1. Introduction
Addressing the dual challenges of climate change mitigation and fiscal sustainability has become a pressing global priority. While many countries have committed to net-zero emissions targets, current and announced policies are insufficient to meet the Paris Agreement’s
 $1.5^\circ \textrm {C}$
temperature goal. This calls for additional mitigation efforts to curb greenhouse gas emissions and align political commitments with environmental constraints. However, if the public sector shoulders too large a share of the transition costs, it could jeopardize the sustainability of sovereign debt. This paper focuses on the economic and fiscal implications of such efforts, analyzing how alternative policy instruments can balance climate goals with public finance sustainability.
Climate change mitigation involves addressing one key market failure, the global warming externality, which necessitates emissions reductions. Policymakers can use instruments such as carbon pricing, public investment in abatement technologies, and subsidies to private mitigation efforts to address this challenge. Carbon pricing incentivizes decarbonization by internalizing environmental costs but imposes welfare costs through reduced consumption. Alternatively, expenditure-based policies like public investment and subsidies ease the transition for the private sector but raise sovereign debt and financing risks, especially in high-debt economies. This paper examines the interplay between these policies, their macroeconomic impacts, and the implications for public debt sustainability.
To address these issues, we develop a dynamic general equilibrium framework that models the macroeconomic and fiscal consequences of alternative mitigation strategies. Our contribution lies at the intersection of two strands of literature. On the one hand, we rely on a macroclimate real model, which allows us to analyze the dynamics of the economy in the presence of the greenhouse gas-related externality, as in Heutel (Reference Heutel2012) or Annicchiarico and Di Dio (Reference Annicchiarico and Di Dio2015). On the other hand, the integration of public debt sustainability issues into macroeconomic models has given rise to an abundant literature, including Corsetti et al. (Reference Corsetti, Kuester, Meier and Müller2013). We use a stylized version of this literature to establish a link between choices in terms of mitigation policies to achieve climate goals and sovereign risks without having to model a detailed financial sector. In an extension, we also take into account the spillover effects of public debt sustainability issues on the private sector financing conditions, which prove to modify the macroeconomic effects and the performance of the various mitigation measures.
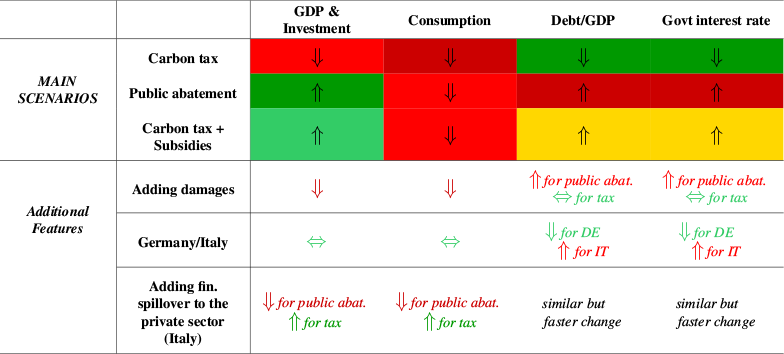
Calibrating the model for three European countries—France, Italy and Germany—our results show a key trade-off between limiting transition economic costs and maintaining public debt sustainability, as depicted in Table 1. Government over-reliance on expenditure-based policies (public mitigation or subsidies) threatens public debt sustainability by increasing the probability of sovereign default, leading to higher interest rates on government bonds. Pressures on debt sustainability occur only during the transition, as the model includes fiscal rules that prevent debt from becoming unsustainable in the long run.Footnote 1 Conversely, carbon pricing policies make the transition more viable for public finances but result in higher economic costs and larger consumption losses.
Comparison of different scenarios: impact on macroeconomic variables.

However, the macroeconomic landscape associated with green public interventions worsens when we extend our framework to take into account financial contagion from deteriorating fiscal sustainability to private sector financing conditions (last row of Table 1). When including spillover mechanisms from government bonds’ interest rates—rising with debt sustainability issues—to the private cost of capital, policies leading to higher sovereign debt are associated with adverse macroeconomic implications (lower GDP and consumption). These spillovers are even larger when the government faces large debt levels, as our results clearly point out: initial debt conditions play a key role, and highly indebted countries, such as Italy, are the most likely to suffer the negative repercussions of transition policies on public finance. In contrast, the negative effects of carbon policies on GDP and consumption are reduced because they lead to a general easing of financing costs, benefiting from fiscal consolidation. As an additional extension, we also analyze the role of climate damages and show that they have negative macroeconomic implications even in a transition scenario with an objective of
 $1.5^{\circ }$
C over preindustrial levels (third to last row of Table 1).
While the analysis focuses on France, Italy, and Germany—chosen for their economic size, heterogeneity in fiscal positions, and significance within the EU—we acknowledge that this represents a narrow scope. However, these countries serve as illustrative cases: Germany exemplifies low-debt, industrialized economies; Italy reflects high-debt vulnerabilities; and France occupies an intermediate position. The key mechanisms and policy trade-offs identified are likely to be relevant for other advanced economies, particularly in the EU, though specific outcomes will depend on national fiscal capacities and institutional frameworks. Future work could extend this analysis to a broader set of countries to assess the generalizability of the findings.
Finally, our analysis searches for a welfare-maximizing policy mix. We find the optimality of a balanced approach for Italy, France, and Germany, with the public sector’s contribution to the total mitigation effort increasing gradually, ranging from 25% to 40% between 2030 and 2050. By contrast, the involvement of the private sector should be immediate, as at the beginning of the transition, abatement costs are lower for the private sector and the effort to decarbonize remains minimal. To incentivize the private sector to invest in mitigation technologies, the government should use carbon pricing policies (carbon prices are estimated to increase between $400 and $600 per ton of CO2, according to country-specific characteristics).
While the relationship between climate change mitigation and public finances has gained increasing attention in policy debates (Emambakhsh et al. (Reference Emambakhsh, Fahr, Giuzio, Pourtalet, Spaggiari and Simon2023), IMF (2023)), academic contributions remain limited.Footnote 2 The literature has primarily focused on the fiscal risks posed by climate change and their implications for sovereign debt sustainability. Some notable exceptions that address the fiscal consequences of transition risks are represented by the following contributions. Agarwala et al. (Reference Agarwala, Burke, Klusak, Mohaddes, Volz and Zenghelis2021) provides a taxonomy of how physical and transition risks translate into fiscal risks, with applications to decarbonization costs in the UK. Similarly, Zenios (Reference Zenios2022) uses integrated assessment models (IAMs) and debt sustainability analysis to assess fiscal space for financing climate policies in a highly indebted country, showing how climate-related risks exacerbate debt dynamics in Italy (Mammetti et al. (Reference Mammetti, Zenios and Morelli2024) further detail and extend this analysis to other 14 countries). Seghini (Reference Seghini2024a) examines the impact of greenhouse gas abatement costs and climate damages on fiscal space in advanced economies, by extending a partial equilibrium model of fiscal limits. She underscores the vital role of global policy coordination in mitigating climate damages and ensuring long-term debt sustainability.
Empirical studies have also explored the links between climate risks and sovereign bond yields. For instance, Battiston and Monasterolo (Reference Battiston and Monasterolo2020) use an asset pricing model to estimate the impact of climate risks on 34 sovereign markets, finding that countries with higher exposure to carbon-intensive sectors face higher yields. Klusak et al. (Reference Klusak, Agarwala, Burke, Kraemer and Mohaddes2021) employ AI-based models to quantify the cost of sovereign debt resulting from climate-driven downgrades, showing that ambitious mitigation policies can limit such risks under low-emissions scenarios. However, in scenarios with limited mitigation, widespread downgrades are expected to increase financing costs significantly.
While these studies offer valuable insights, they rely on case studies or empirical estimations, are based on partial equilibrium models, and do not fully account for how specific mitigation policies affect public debt dynamics and macroeconomic outcomes. Our paper addresses these shortcomings by linking mitigation strategies to public finance outcomes using a stylized general equilibrium macroeconomic model that incorporates sovereign risk dynamics and spillovers to private sector financing conditions.
From a policy perspective, our findings highlight the need to balance mitigation costs with fiscal sustainability. For high-debt countries like Italy, policies relying heavily on public spending heighten sovereign risk and financing costs, while carbon pricing eases fiscal pressures but increases economic costs. Incorporating financial spillovers reveals how sovereign risk affects private sector financing, amplifying public debt dynamics. Policymakers must carefully design transition policies, considering their far-reaching fiscal implications. A balanced approach that safeguards public finances, accounts for initial debt conditions and relative abatement costs, and anticipates financial spillovers is crucial for a sustainable green transition.Footnote 3
The rest of the paper is organized as follows. The complete model is presented in Section 2. Section 3 presents the calibration of the model and justifies key choices. Section 4 shows various sets of results showing the implications of alternative mitigation policies on macroeconomic trends and public debt. Section 5 completes our analysis with a welfare maximization exercise in order to define the optimal share of public abatement. Section 6 concludes with some policy implications and ideas for possible extensions.
2. A macroclimate model with risky government debt
We introduce a streamlined yet comprehensive closed-economy macroclimate model designed to evaluate the interplay between green transition policies, public debt, and macroeconomic variables. We integrate a macroclimate neo-classical real model inspired by Annicchiarico and Di Dio (Reference Annicchiarico and Di Dio2015), with a framework for risky government debt based on insights from Corsetti et al. (Reference Corsetti, Kuester, Meier and Müller2013) and Darracq-Pariès et al. (Reference Darracq-Pariès, Jacquinot and Papadopoulou2016). The core aim is to scrutinize the impact of green policies on public finances and the consequent sustainability of public debt under alternative mitigation strategies. The model incorporates a carbon budget constraint, which aligns with the global commitments undertaken with the Paris Agreement. The economy is made of a competitive private sector, households, and the government. Emissions are a by-product of the production of final goods. Firms engage in profit maximization, factoring in labor, capital, carbon taxation, abatement costs, and green subsidies. They adapt over time to environmental policies, established by the government. Households make decisions regarding consumption, labor supply, and investment in private capital and in government bonds. Their investment in public debt is risky, since in case of default they would be only partially compensated by their loss through public transfers. Their behavior aims to maximize their own utility and it is shaped by taxation, and the overall economic conditions. The government’s role is multifaceted, involving bond issuance, the management of taxes and public spending according to policy rules, and ensuring the respect of the political constraints on carbon emissions. It determines carbon taxes, green subsidies to firms and direct public mitigation efforts in line with the available carbon budget. The model also potentially includes climate damages on productivity as a consequence of cumulative carbon emissions, according to different functional forms proposed in the macroclimate literature.
The model captures the main channels through which reducing carbon emissions impacts the real economy and public finances. For different shares of the public direct effort over total mitigation and the level of green subsidies to the private sector, we determine, thus, the sustainability of public debt in alternative mitigation scenarios. Figure 1 shows the structured interaction of the model components, which is described in detail below.
The model’s structure (variables in parentheses are nonzero only in the event of government debt default).

The carbon budget. The economy operates within a binding total carbon budget imposed by the government, in line to its commitment to international agreements, which aim to limit global temperature under a certain threshold (1.5
 $^{\circ }$
C on average over preindustrial levels):
 \begin{equation} \sum _{t=0}^{+\infty } E_t \leq \bar {E}^n_0 \end{equation}
where
 $E_t$
represents national emissions in one period, and
 $\bar {E}^n_{0}$
the carbon budget available to the economy from period 0 onwards. The imposition of this constraint captures the political willingness to avoid adverse effects of climate change, generated by the use of carbon emissions. The national carbon budget would represent a fraction of a global carbon budget
 $\bar {E}^G_{0}$
in line with these environmental commitments.
Final Good Production. In our economy a unique final good
 $Y_t$
, which is used for consumption and investment, is produced by a continuum of competitive firms
 $i\in (0,1)$
.Footnote
4
We assume a standard Cobb-Douglas production function with capital
 $K_t(i)$
and labor
 $L_t(i)$
as inputs, with the potential addition of climate damages on productivity. Each firm produces:
 \begin{align} Y_{t}(i) =D_f(H^G_t) K_{t}(i)^\kappa [Z_t L_{t}(i)]^{1 - \kappa } , \quad \kappa \in (0,1), \end{align}
where
 $\kappa$
is the elasticity of output with respect to capital and
 $Z_t = Z_0 e^{z t}$
is labor-intensive technological progress. We will normalize
 $Z_0=1$
, for the sake of simplicity.
 $D_f$
represents the damaged total factor productivity (TFP), which is potentially decreasing (according to a given function
 $f$
) in global cumulative GHG emissions, since 1850,
 $H^G_t$
.
Temperature, cumulative and flow emissions. The global average temperature increase, with respect to preindustrial levels, corresponds to a linear function of cumulative emissions:
 $T_t=\gamma H^G_t$
. We assume that the examined country, when selecting its own transition path, will automatically set the path for the global economy.Footnote
5
Therefore, in order to define global emissions and temperature, we multiply national emissions by a factor equal to the ratio between the global and the national carbon budget. Then, global cumulative emissions write as:
 \begin{equation*}H^G_t= H^G_{-1} + \frac {\bar {E}^G_0}{\bar {E}^n_{0}}H_{t}= H^G_{t- 1} + \frac {\bar {E}^G_0}{\bar {E}^n_{0}}E_t,\end{equation*}
where
 $\bar {E}^G_0$
and
 $\bar {E}^n_{0}$
are, respectively, the global and the national carbon budget from 2024 onward, whose first quarter represents our period 0.Footnote
6
National cumulative emissions at time t
 $H_t$
are defined as:
 $H_{t}=\sum _{j=0}^{t} E_{j}= H_{t-1} + E_{t}$
.
Emissions of firm
 $i$
in one period are defined as a by-product of output, and this relationship is affected by the private abatement effort
 $m_{t}(i)$
and the public abatement intervention
 $m^g_t$
,Footnote
7
which we assume to be constant across firms :
 \begin{equation} E_{t}(i) = \xi _t [1- m_{t}(i) - m^g_t] Y_{t}(i) \end{equation}
where
 $\xi _t = \xi _0 e^{-\omega t} = \xi _{t-1} e^{-\omega }$
,
 $\xi _0\gt 0$
, is output’s carbon intensity (emissions per unit of output in the absence of abatement effort), which is decreasing over time at rate
 $\omega \gt 0$
.
Private abatement technology cost. Similarly to Nordhaus (Reference Nordhaus2008), Annicchiarico and Di Dio (Reference Annicchiarico and Di Dio2015), and Jondeau et al. (Reference Jondeau, Levieuge, Sahuc and Vermandel2023), the private abatement technological cost is defined as:
 \begin{equation} A_{t}(i) = \theta _1 [m_{t}(i)]^{\theta _2} Y_{t}(i) \end{equation}
where
 $\theta _1\gt 0, \theta _2\gt 1$
are parameters of the abatement cost function.
Profit maximization. Each firm
 $i$
maximizes profits:
 \begin{equation} \Pi _{t}(i) = Y_{t}(i) - {W_t} L_{t}(i) - {R^k_t}K_{t}(i) - (1-s^A_t) A_{t}(i) -{\tau ^E_t} E_{t}(i) , \end{equation}
subject to the production function (2).
 $W_t$
,
 $R^k_t$
,
 $\tau ^E_t$
, and
 $s^A_t$
are, respectively, the real wage, the rental rate on capital, the carbon tax, and the public subsidy to abatement costs. The latter two depend on the environmental policy regime, decided by the government. Cost minimization at the margin implies:Footnote
8
 \begin{align} & \left (\delta L_{t}(i)\right ) \quad {W_t} =\Theta _{t}(i)D_f(H^G_t)K_{t}(i)^\kappa (1-\kappa ) Z_t^{1-\kappa } L_{t}(i)^{-\kappa } \end{align}
 \begin{align} & \left (\delta K_{t}(i)\right ) \quad {R^k_t}=\Theta _{t}(i)D_f(H^G_t) \kappa K_{t}(i)^{\kappa -1} (Z_tL_{t}(i))^{1-\kappa } \end{align}
 \begin{align} & \left (\delta m_{t}(i)\right ) \quad {\tau ^E_t} =\frac {(1 -s^A_t) \theta _1 \theta _2}{ \xi _t} [m_{t}(i)]^{\theta _2-1} \end{align}
where
 $\Theta _{t}(i)$
is the Lagrange multiplier associated to (2), corresponding to the marginal cost’s component attached to labor and capital.Footnote
9
In the following, we drop the
 $i$
index for simplicity—the index was necessary for representing climate damages as an externality, where the contribution of emissions from firm
 $i$
is marginal— since in equilibrium all firms are identical and perfectly competitive, thus, will make the same choice. The marginal cost of output is:
 \begin{align} MC_t= \quad &\Theta _{t} + (1-s^A_t)\theta _1 m_{t}^{\theta _2} +{\tau ^E_t} \xi _t (1- m_{t}-m^g_t) \end{align}
 \begin{align} \text{where } \quad &\Theta _{t} =\frac {\left ({W_t}\right )^{1-\kappa } \left ({R^k_t}\right )^\kappa }{D_f(H^G_t)Z_t^{(1-\kappa )} \kappa ^{\kappa }(1-\kappa )^{(1-\kappa )} } \end{align}
Notice that in this real model with perfect competition,
 $MC_t=1$
.
Carbon tax and total abatement. The carbon tax
 $\tau ^E_t$
(8) is defined by the government to motivate firms to carry out the collective private mitigation effort
 $m_t=\int _0^1m_t(i)\mathrm{d} i$
. The government also conducts direct public mitigation efforts
 $m^g_t$
. The sum of
 $m_t$
and
 $m^g_t$
represents total abatement and needs to satisfy over time a mitigation rule consistent with the carbon budget (1), the country has committed to:
 \begin{align} &m_t +m^g_t= \left (\frac {H_{t-1}}{\bar {E}^n_0}\right )^p \end{align}
 \begin{align} &\frac {m^g_t}{m_t +m^g_t} = \theta \end{align}
where
 $p\gt 0$
represents the curvature of the mitigation policy rule. According to (11), the total abatement the country needs to carry out in a given period is equivalent to a function of the ratio between its past cumulative emissions
 $H_{t-1}$
and the national carbon budget
 $\bar {E}^n_0$
. When the latter is exhausted (
 $H_{t-1} = \bar {E}^n_{0}$
), we obtain that total mitigation needs to be equal to 1 and zero emissions are associated with production processes. We also assume that the fraction
 $\theta$
, which represents the share of government direct efforts in total abatement, is constant, for the sake of simplicity. In Section 5, we will optimally determine this share over time through a welfare maximization exercise.
Households. The economy is inhabited by a representative, infinitely lived household, who maximizes her intertemporal utility:
 \begin{equation*} \mathbb{E}_t \sum _{i=0}^{\infty } \beta ^i\left (\ln C_{t+i}-\mu _L \frac {L_{t+i}^{1+\sigma _l}}{1+\sigma _l}\right ), \quad \sigma _l\gt 0, \mu _L\gt 0. \end{equation*}
Here,
 $\beta \in (0,1)$
is the discount factor, which is constant over time.
 $C_t$
and
 $L_t$
denote, respectively, the consumption of the final goods and the work hours supplied by the household. The disutility of labor is weighted by
 $\mu _L$
, while
 $\sigma _l$
serves as the inverse of the Frisch elasticity of labor supply. Similarly to Corsetti et al. (Reference Corsetti, Kuester, Meier and Müller2013), the household’s budget constraint for each period is given by:
 \begin{equation} C_t+ I_t+B_t=(1-\vartheta _t)R^d_{t-1}B_{t-1} +W_t L_t+ \Pi _t+R^k_t K_t-T_t +V_t. \end{equation}
 $B_t \equiv \frac {d_{t}Y_t}{R^d_t}$
, as defined below, corresponds to the investment in government bonds made by the household. This corresponds to the amount of bonds
 $D_{t+1}\equiv d_tY_t$
she bought, divided by the gross interest rate
 $R^d_t$
, the government must pay on each bond to compensate the investor. Typically, in dynamic general equilibrium models, government debt is considered risk-free, and
 $R^d_t$
is treated as equivalent to the risk-free interest rate. However, in this model, to capture the implications of the transition for sovereign financing and sustainability, government debt is modeled as risky:
 $\vartheta _t$
represents the haircut, which is zero when the government fully honors its debt commitments, and
 $\vartheta _t= \vartheta \in (0,1)$
, when the government partially defaults on debt, event which happens with probability
 $\mathsf{PD}_t$
. The latter represents the probability of default on currently outstanding debt
 $D_t \equiv R^d_{t-1}B_{t-1}$
, to be repaid at
 $t$
.Footnote
10
Investors evaluate the probability of default according to the following condition:
 \begin{equation} b_M e^{\varepsilon _t}\lt b_t \quad \text{where} \quad \varepsilon _t\sim N(0, \sigma _B) \end{equation}
where
 $b_M$
is the fiscal limit of our economy, in terms of maximum sustainable government borrowing-to-GDP (
 $b_t\equiv \frac {B_t}{Y_t}$
). This fiscal limit is subjected to uncertainty, represented by the random log-normal shock
 $e^{\varepsilon _t}$
with zero-mean and volatility
 $\sigma _B$
. The probability of default writes then as a standard normal c.d.f.:
 \begin{equation} \mathsf{PD}_{t+1}=\Phi \bigg ( \frac {\ln (b_{t})-\ln (b_M)}{\sigma _B}\bigg ), \end{equation}
similarly to Darracq-Pariès et al. (Reference Darracq-Pariès, Jacquinot and Papadopoulou2016), Collard et al. (Reference Collard, Habib and Rochet2015) and Seghini (Reference Seghini2024a), with parameter
 $\sigma _B$
and
 $b_M$
.
 $V_t\equiv (1-f) \vartheta _tR^d_{t-1}B_{t-1}$
is a lump-sum transfer that, should a government default on its debt, partially reimburses bondholders for a fraction
 $1-f$
of the financial losses they sustain due to the default. The standard lump-sum taxes or transfers from the government are given by
 $T_t$
, and dividends from owning firms that produce the final goods are
 $\Pi _t$
. Labor income and rental income from capital services are represented by
 $ W_t L_t$
and
 $R^k_t K_t$
, respectively. In each period
 $t$
, each member inherits
 $K_{t-1}$
units of physical capital from the prior period, devalued by a depreciation rate
 $\delta$
, and makes investment decisions
 $I_t$
. The capital accumulation equation is expressed as:
 \begin{align} &K_{t+1} = (1-\delta )K_{t}+I_t \left [1- S\left (\frac {I_t}{I_{t-1}}\right )\right ], \quad \delta \in (0,1). \nonumber \\ &\text{where} \quad S\left (\frac {I_t}{I_{t-1}}\right ) = \frac {\iota }{2}\left (\frac {I_t}{I_{t-1}}- e^z\right )^2 \end{align}
where
 $S(\cdot )$
represents the investment adaptation cost function and
 $e^z$
the steady-state growth rate of investment. The first-order conditions obtained from the household’s maximization problem, are:Footnote
11
 \begin{align} &\left (\delta C_t\right ) \,\, \frac {1}{C_t}= \lambda _t \end{align}
 \begin{align} &\left (\delta L_t\right ) \,\, \mu _lL_t^{\sigma _l}=\lambda _t { W_t} \end{align}
 \begin{align} &\left (\delta B_{t}\right ) \,\, {\lambda _t}= \beta \mathbb{E}_t \left [\lambda _{t+1}(1-f\vartheta _{t+1})R^d_t \right ]\end{align}
 \begin{align} &\left (\delta I_t\right ) \,\, \lambda _t=\lambda _t^k \left [1-S\left (\frac {I_t}{I_{t-1}}\right )-S^{\prime }\left (\frac {I_t}{I_{t-1}}\right ) \frac {I_t}{I_{t-1}}\right ]+\beta \mathbb{E}_t\left [\lambda _{t+1}^k S^{\prime }\left (\frac {I_{t+1}}{I_t}\right )\left (\frac {I_{t+1}}{I_t}\right )^2\right ] \nonumber \\ & \quad \quad \quad \, = \lambda _t^k \left [1 - \frac {\iota }{2} \left (\frac {I_t}{I_{t-1}} - e^z\right )^2 - \iota \left (\frac {I_t}{I_{t-1}} - e^z\right )\frac {I_t}{I_{t-1}}\right ] +\beta \mathbb{E}_t\left [\lambda _{t+1}^k \iota \left (\frac {I_{t+1}}{I_{t}} - e^z\right )\left (\frac {I_{t+1}}{I_t}\right )^2\right ]\nonumber\\[5pt] \end{align}
 \begin{align} & \left (\delta K_{t+1}\right ) \,\, \lambda ^k_t =\beta \mathbb{E}_t\left [\lambda _{t+1} {R^k_{t+1}}\right ] + \beta (1-\delta )\mathbb{E}_t\left [\lambda ^k_{t+1} \right ] \end{align}
where
 $\lambda _t$
and
 $\lambda _t^k$
are the Lagrange multipliers assigned to the budget constraint and the capital accumulation constraint. Tobin’s
 $\mathrm{Q}$
corresponds to
 $q_t^k=\lambda _t^k / \lambda _t$
, and is equal to 1 when there are no investment adjustment costs (
 $\frac {I_t}{I_{t-1}}= e^z$
).Footnote
12
Therefore, from the first-order conditions (FOCs), we can derive the following equality between the stochastic discount factor—representing the risk-free interest rate—and the rental rate on capital:
 \begin{align} R_{t}\equiv \frac {\lambda _t}{\beta \mathbb{E}_t \left [\lambda _{t+1}\right ]} =\frac {1}{q_t^k \mathbb{E}_t \left [\lambda _{t+1}\right ]}\bigg\{\mathbb{E}_t\left [\lambda _{t+1} {R^k_{t+1}}\right ] + (1-\delta )\mathbb{E}_t\left [\lambda _{t+1}q^k_{t+1} \right ]\bigg\}. \end{align}
Therefore, we can rewrite the FOC with respect to investment in government debt (19) as:
 \begin{align} R_{t}&= \frac { \mathbb{E}_t \left [\lambda _{t+1}(1-f\vartheta _{t+1})R^d_t \right ]}{ \mathbb{E}_t \left [\lambda _{t+1}\right ]} \approx (1-f\vartheta \mathsf{PD}_{t+1})R^d_t . \end{align}
The approximation at the right-hand side of (23) is shown to highlight the role of the term between parentheses as a wedge between the risk-free rate of the economy and the return
 $R^d_t$
required by households to invest in risky government bonds. It holds in the first-order log-linearized version of the model and in steady state.Footnote
13
Government budget constraint and abatement costs. The government levies the lump-sum tax
 $T_t$
(which can also take the form of transfers) and the carbon tax
 $\tau ^E_t$
on emissions, to finance the purchases of goods and services in quantity
 $G_t$
, provide subsidies
 $s^A$
to private abatement costs, and finance direct public mitigation efforts
 $m^g_t$
. It issues bonds
 $D_{t+1}$
, which pay a rate of return
 $R^d_t$
to households (bondholders), in order to borrow
 $B_t$
, and has to repay old debt
 $D_{t}$
. In case of default, it also pays lump-sum transfers
 $V_t$
to households for compensation and is forced to unexpectedly face additional public expenditure
 $G^d_t\equiv f\vartheta _{t} B_{t-1}R^d_{t-1}$
, which corresponds to a proportion
 $f$
of financial losses.
 $G^d_t$
represents unexpected debt restructuring or reputational costs, which arise in case of default (Borensztein and Panizza, Reference Borensztein and Panizza2009).Footnote
14
For the sake of tractability, and in similar spirit to Corsetti et al. (Reference Corsetti, Kuester, Meier and Müller2013), we assume that the combination of transfers and post-default government spending is set such that a sovereign default does not change the actual debt level. Consequently, ex post, regardless of whether a sovereign default has occurred, the sovereign risk premium remains unaffected.Footnote
15
This setup prevents the counterintuitive scenario of lower risk premia before a default due to anticipations of a reduced debt stock post-default.Footnote
16
Thus, the government budget constraint can be written as:
 \begin{equation} B_t = (1-\vartheta _{t}) B_{t-1}R^d_{t-1} - S_t + V_t + G_t^d, \end{equation}
where we use
 $D_t\equiv d_{t-1}Y_{t-1} \equiv B_{t-1}R^d_{t-1}$
for the face value of debt to be repaid at
 $t$
, which is decided in the previous period
 $t-1$
.
The consolidated government budget constraint is given by:
 \begin{equation} B_t = B_{t-1}R^d_{t-1} - S_t, \end{equation}
 $S_t$
denotes the “consolidated” total primary surplus (excluding default transfers and expenditure):
 \begin{align} &S_t = T_t + \tau ^E_t E_t - G_t - s^A_t A_t -A^g_t = \left\{\tau _t + \tau ^E_t \xi _t (1- m_t-m^g_t) -g - \theta _1 s^A_t m_t^{\theta _2} - \theta _3 (m^g_{t})^{\theta _4}\right\} Y_t \end{align}
where
 $g$
represents the exogenous public expenditure as a fraction to GDP, assumed constant. Public abatement costs are assumed to be less convex than private costs (
 $\theta _4\lt \theta _2$
):
 \begin{equation} A^g_{t}= \theta _3 (m^g_{t})^{\theta _4} Y_{t}. \end{equation}
First, the public administration usually implements bigger scale economies than private firms. Secondly, the typical type of public green investment require greater initial investments and lower future operative costs, than in private mitigation efforts. This assumption on convexity aims to schematically capture these observations. Further justifications, in particular for the French case, are provided in the next section on calibration.
Total borrowing proceeds can be written as:
 \begin{align} B_t \equiv b_t Y_t = \frac {D_{t+1}}{R^d_t}\equiv \frac {d_{t}Y_t}{R^d_t} \end{align}
where the return promised on government bonds
 $R^d_t$
has to satisfy the FOC (23).
We also recover
 $b_t$
from the government budget constraint as:
 \begin{equation} b_t = \frac {b_{t-1}Y_{t-1}R^d_{t-1} - S_t}{Y_t}, \end{equation}
and the face value of debt-to-GDP
 $d_t$
implicitly from:
 \begin{equation} b_t = \frac {d_t}{R^d_t} \end{equation}
We add a debt stabilization rule on the lump-sum tax rate
 $\tau _t$
, as in Corsetti et al. (Reference Corsetti, Kuester, Meier and Müller2013) and Darracq-Pariès et al. (Reference Darracq-Pariès, Jacquinot and Papadopoulou2016), adapted in order to take into account our transition scenario from an initial brown to a final green steady state:
 \begin{equation} \tau _t = \tau (b_t, b_{t-1}, b_*, \tau _{t-1},\tau _*,f, y_{0,\,f}). \end{equation}
where
 $y_{0,f}$
represents the initial steady-state for the detrended GDP, and
 $f$
reflects our assumption in terms of the damage function for the particular scenario.
 $\tau (\cdot )$
will be a function which reacts to the deviation of
 $b_t$
from its final steady-state value
 $b_*$
, and to its deviation from the previous period. This debt stabilization rule will be further discussed in Section 3.
Resource constraint The market clearing condition for the final goods market is obtained integrating the household budget constraint, combined with the government constraint:
 \begin{align} & Y_t= C_t + I_t + G_t + G^d_t +{A_t} +A^g_t \end{align}
3. Calibration
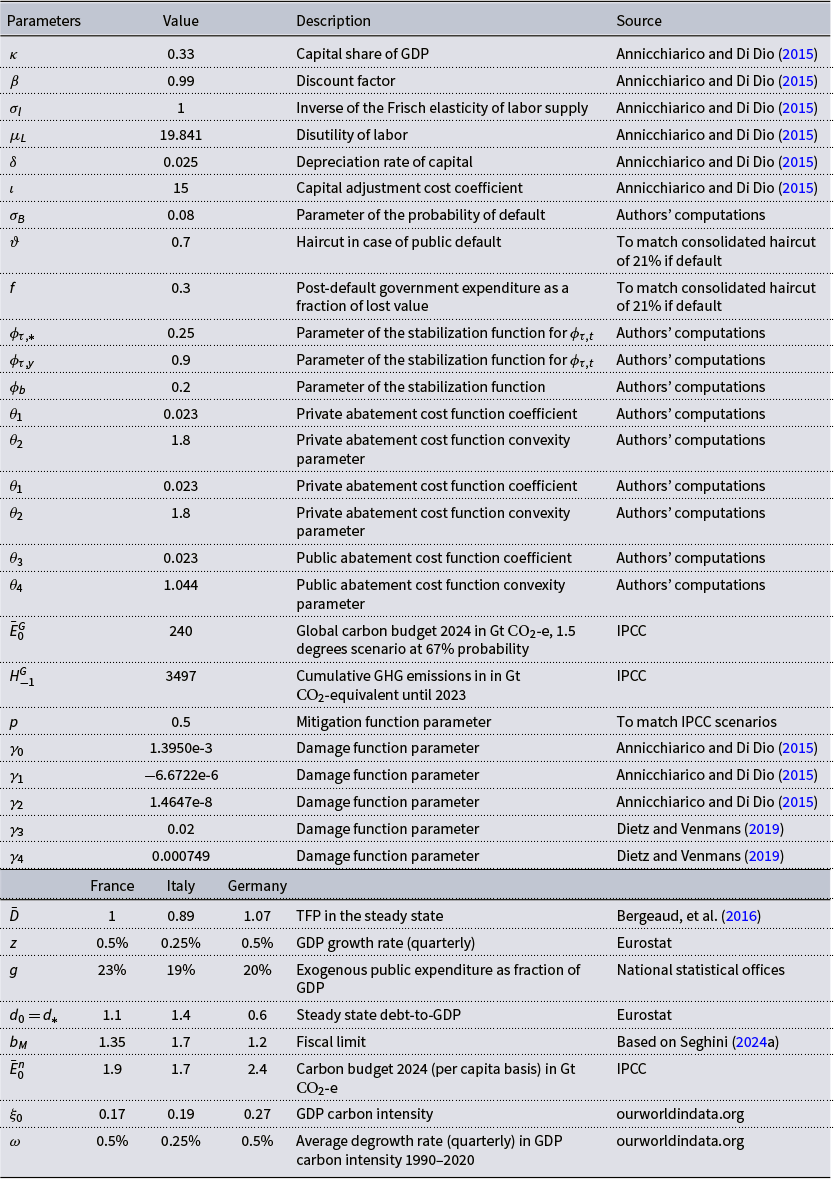
Our model contains thirty-two calibrated parameters, shown in Table 2, of which eight (at the bottom of the table) take country-specific values. Our reference time period is one quarter. The calibration for the traditional aspects of our real neo-classical model (
 $\kappa , \beta , \sigma _l, \mu _l, \delta , \iota$
) follows standard assumptions in the existing literature, as in Annicchiarico and Di Dio (Reference Annicchiarico and Di Dio2015). For the transition setup, global greenhouse gas cumulative emissions until 2023,
 $H^G_{-1}$
, are estimated to have been around 3497 Gt in
 $\textrm{CO}_{2}$
-equivalent.Footnote
17
The abatement cost function coefficients are calibrated to match a (detrended) long-term carbon tax for France of US$ 1000 per ton of
 $\textrm{CO}_{2}$
, in the case of a transition to 1.5
 $^{\circ }$
C with 67% probability, achieved only through carbon pricing. This is in line with the evidence provided by D’Arcangelo et al. (Reference D’Arcangelo, Pisu, Raj and van Dender2022), Quinet et al. (Reference Quinet, Bueb, Hir, Mesqui, Pommeret and Combaud2019) and Bilal and Känzig (Reference Bilal and Känzig2024).
Parametrization

We assume that abatement costs are relatively higher for the public sector than for the private sector. Marginal costs are lower for the private at the beginning of the transition, and increasing above public marginal costs as we approach a full decarbonization. Conversely, marginal public costs are much higher immediately, in line with huge investment in green infrastructure (See Appendix B—Figures 11 and 12). This translates into a lower degree of convexity, that is,
 $\theta _4\lt \theta _2$
. This assumption is based on sectoral estimates of abatement costs, which show that sectors that typically require public intervention (such as electricity and building renovation) are those with the highest costs (Criqui, Reference Criqui2023). For example, in the cement production sector in France, where large private companies operate, it is estimated that one-third of emissions could be reduced at low economic cost - between
 $\unicode {x20AC}$
0/t
 $\textrm{CO}_{2}$
and
 $\unicode {x20AC}$
40/t
 $\textrm{CO}_{2}$
. On the other hand, the assessment of the cost of decarbonizing the electricity system, which must take into account not only the production costs of each type of power plant but also all the associated “system costs,” puts the abatement cost at around
 $\unicode {x20AC}$
400/t
 $\textrm{CO}_{2}$
. In France, as in most countries, this sector is dominated by the public sector, and the costs of maintaining and adapting the electricity system (about 15% of the decarbonization of electricity), which include the costs of modifying generation profiles, short-term balancing of supply and demand, and network reconfiguration, can only be borne by a public operator (RTE-Réseau de Transport d’Electricité, in the case of France). Similarly, in the residential sector, extending the renovation from 6 million to 12 million buildings would increase the abatement cost from about 150 to 400
 $\unicode {x20AC}$
/t
 $\textrm{CO}_{2}$
(Criqui, Reference Criqui2023). The role of the public sector in supporting private efforts, but also in renovating public buildings and social housing, is therefore key. Its contribution is estimated at more than half in the case of France to reach net-zero emission targets (Pisani-Ferry and Mahfouz, Reference Pisani-Ferry and Mahfouz2023).
We will assume three functional forms and calibrations for the damaged TFP
 $D_f$
:
 \begin{align*} &D_{\text{NC}}(H^G_t)= \bar {D}, \quad D_{\text{AD}}(H^G_t)= \bar {D}(1- \gamma _0 - \gamma _1 H^G_t - \gamma _2 {H^G_t}^2), \quad D_{\text{DV}}(H^G_t)= \bar {D}\exp \left \{-\frac {\gamma _3}{2}(\gamma _4 H^G_t)^2\right \} \end{align*}
NC stands for “No Climate” impact, AD for the specification proposed by Annicchiarico and Di Dio (Reference Annicchiarico and Di Dio2015), and DV for the more convex one proposed by Dietz and Venmans (Reference Dietz and Venmans2019). The temperature objective of 1.5
 $^{\circ }$
C with 67% probability corresponds to a global carbon budget of
 $240$
Gt
 $\textrm{CO}_{2}$
(IPCC (2023)). According to a fair per capita criterion, this entails a national budget of 1.9, 1.7, and 2.4 Gt
 $\textrm{CO}_{2}$
for, respectively, France, Italy, and Germany. In Section 4.2, we will show that, despite imposing the respect of this carbon commitment and an immediate and successful transition scenario, climate damages still have an adverse impact on the macroeconomy. The other country-specific parameters are calibrated to match national characteristics.Footnote
18
We define the debt stabilization function (31) as:
 \begin{align*} \tau _t = \phi _{\tau ,t}&[\tau _{t-1} +\phi _{b} (b_{t}-b_{t-1})] +(1-\phi _{\tau ,t})[\tau _*+ \phi _{b} (b_{t}-b_*)]\\ \text{where }\quad &\phi _{\tau ,t} = \frac {1}{1 + \phi _{\tau ,*} \tau _{*}} +\unicode {x1D7D9}_{D_f(H^G_t)\neq \bar {D}} \phi _{\tau ,y}(y_{0, \text{NC} } - y_{0,n}) (b_{t-1} - b_*), \end{align*}
In the long-run this rule guarantees
 $\tau _t= \tau _*$
, which is the lump-sum tax consistent with the final steady-state value of borrowing-to-GDP
 $b_*$
. The function’s parametrization aims to capture the generally limited tax buoyancy in the short-term, highlighted by the empirical literature on tax responsiveness (e.g., recently Cornevin et al. (Reference Cornevin, Flores and Angel2023)). The parameter
 $\phi _{b}$
represents the response of
 $\tau _t$
to debt-to-GDP values;
 $ \phi _{\tau ,t}$
represents a smoothness weight on past values of taxes and indebtedness. The baseline value of this smoothness parameter is defined to be decreasing in the long-term lump-sum tax value
 $\tau _*$
: if higher public financing needs through taxes are planned in the long-run, taxation changes are less difficult. In the presence of climate damages, we allow
 $ \phi _{\tau ,t}$
to be time-varying, and reacting to the distance of the current debt level to its steady state,
 $(b_{t-1} - b_*)$
. This creates additional difficulty in dealing with high debt in the presence of climate challenges.Footnote
19
The parameters of the log-normal probability of default are determined in order to match government risk premia with current evidence. The national values for the fiscal limits are (conservatively) in line with the evidence provided by Collard et al. (Reference Collard, Habib and Rochet2015) and Seghini (Reference Seghini2024a). Despite the selection of a quite high haircut
 $\vartheta = 0.7$
, this is balanced by the parameter
 $f$
, representing the post-default government expenditure as a fraction of investors’ lost value
 $\vartheta _tR^d_{t-1}B_{t-1}$
. Therefore, we can interpret the product
 $f \vartheta =0.21$
as a consolidated haircut, whose value is, in the end, reasonably conservative for advanced economies.
4. Results
We present first our benchmark results calibrated for France, assessing how sensitive they are to key parameters like public abatement costs or redistribution of carbon tax proceeds. Second, we include climate damages into the model to account for the potential impact of physical risks on public finances. Third, to show the importance of the initial indebtedness situation in the future debt sustainability conditions, we complement the results calibrated on France with two alternative countries, a highly indebted country (Italy) and a low-debt country (Germany). Finally, we add financial spillovers to the model by linking the cost of private investment to the sovereign risk premium.
4.1 Benchmark results and sensitivity to key parameters
We use our model to analyze the impact of three distinct policies on GDP and debt levels, each representing an extreme approach to achieving a successful transition within the carbon budget. Although these stylized scenarios were deliberately chosen to highlight the key differences between transition strategies, they can nevertheless be linked to current policy approaches.
-
(1) First, we envisage the case with a carbon tax or carbon pricing as the unique transition policy (green line in all figures). Although this option can be seen as extreme, it is closer to the EU transition policy, as the Emission Trading System (ETS) aims to reduce emissions via a carbon market.
-
(2) Second, we assume a transition strategy based on direct public mitigation (red line). This approach is similar to policies such as those implemented in the United States under the Inflation Reduction Act, which rely largely on public expenditures.
-
(3) Finally, we investigate an intermediate case whereby a carbon tax is associated with subsidies to the private sector up to 90% of mitigation efforts (blue line).
In all the scenarios, we assume that carbon taxes are either fully used to pay off debt or recycled in public investment. Moreover, subsides are fully funded by extra debt, as government expenditures and other taxes are exogenous. We ignore for now climate damages (
 $f =$
NC), to highlight the impact of transition policies only. Given our mitigation rule (11), the transition to net-zero emission will be completed in around 35 years and all three scenarios satisfy the carbon emissions’ path consistent with the imposed carbon budget. In Figure 2, we show the financial and macroeconomic implications of these policies. In scenario (1), the transition is implemented only through the carbon tax, which increase rapidly to around US$ 1000 per ton of
 $\textrm{CO}_{2}$
. The level and trajectory of the carbon tax may appear extreme. However, this scenario reflects two critical considerations. First, it translates the social cost of carbon required to achieve net zero by 2060 under a single-policy framework. Second, the steep initial increase in the tax aligns with the need for rapid early emissions reductions, as decarbonization is more achievable in the initial stages. Only such a sharp rise can sufficiently incentivize the private sector to commit to this decarbonization path. While the carbon tax trajectory is concave and thus departs from a dynamically efficient Hotelling path, the resulting emissions profile—shown in Appendix C—supports the view that decarbonization is faster in the early stages and then slows as hard-to-abate sectors dominate the remaining emissions, consistent with a realistic transition path. While this approach may seem challenging from an implementation perspective, it represents what is necessary to stay within the carbon budget if the burden of decarbonization rests solely on the private sector.
The financial and macroeconomic impact of 3 transition scenarios: (1) carbon tax (green lines); (2) direct public mitigation (red lines); (3) carbon tax with subsidies at 90% (blue line).

The carbon tax leads to a sharp temporary increase in annual carbon revenues (up to 5% of GDP) and allows a temporary reduction on the lump-sum tax imposed on households, thus partially substituting classical forms of taxation (see Figure 13 in Appendix C). On the macroeconomic side, when the transition only involves carbon taxation, the costs are the largest on GDP and consumption. We observe an important permanent and negative impact on GDP (−1%) and on consumption (−3.5%). There is also a some eviction effect on investment (i.e., investment excluding abatement-related efforts), which is decreased by around 3.5%. On the contrary, the effect on public finances is positive, as public debt-to-GDP is reduced by 6 percentage points. As a result, the 1-year interest rate of public debt declines and the annual probability of sovereign default is temporary lower and almost null, as shown in Figure 3. The figures also includes a variant of this carbon tax scenario, investigating the effects of some recycling of the tax proceeds through higher government expenditures. The macroeconomic effects are hardly changed, with only a slightly less negative impact on GDP. The public finances are however affected as the reduction in public debt is halved, limiting the decline in interest rates on public bond and the sovereign default probability.
Annual probability of default. (1) carbon tax (green lines); (2) direct public mitigation (red lines); (3) carbon tax with subsidies at 90% (blue line).

By contrast, in scenario (2), when the mitigation effort is made only through direct public intervention (i.e. the share of public mitigation effort over total effort is 100% or, in Eq. (12),
 $\theta \approx 1$
), the impact on GDP is positive, at the expenses of an increase in public debt-to-GDP, and its probability of default. While abatement is clearly expensive, this positive impact comes from higher public investment in abatement that makes not only the transition costless for the private sector but also generates support from the government to aggregate demand. This demand effect is amplified through accelerator mechanisms, as non-abatement-related private investment also benefits from higher GDP. However, we notice some eviction effect as far as consumption is concerned, primarily explained by the need for higher investment levels. In this second scenario, the main result concerns the impact on public finances. Public debt-to-GDP increases by 7 percentage points and, consequently, the annual probability of default on public debt rises to 10%. The interest rate on sovereign bonds also increases by around 60 basis points. The large impact on public debt and the threat to debt sustainability is partly explained by the assumption that abatement costs are higher in the beginning of the transition for the public sector compared to private effort. This is due to a lower convexity of mitigation costs for the public sector, which implies higher total costs, given a certain abatement effort
 $m\in [0,1]$
. However, to gauge the sensitivity of our results to this assumption, we simulate the model with two alternative abatement costs for the public sector, the benchmark being labeled “high public abatement costs” and the alternative “medium/low public abatement costs”. This variant does not change the main results but reduces somehow the size of the impacts. This is particularly the case on the public debt-to-GDP level, although it remains higher than the starting point by 4 percentage points (from 7 in the benchmark scenario). In this more favorable variant, the probability of sovereign default still increases, reaching 4% by 2035.
Finally, scenario (3), where carbon taxes are combined with public subsidies for private-sector reduction efforts, provides intermediate results. The impact on GDP is positive, albeit to a lesser extent than in the previous scenario, and the increase in public debt relative to GDP is also lower (2 percentage points of GDP). The negative impact on consumption is very similar to scenario (2), which shows that a combination of a small increase in carbon tax (around $100 per ton of
 $\textrm{CO}_{2}$
) and subsidies to the private sector limit the negative impact on households while minimizing the pressure on the public finance sustainability. Indeed, in this scenario, the increase in sovereign interest rates is limited to 50 basis points and the probability of default only increases to 3%. It is worth noting that the subsidy is calibrated to cover the full cost of abatement, including inframarginal measures, unlike the carbon tax which targets marginal emissions. As a result, even in the case where 90% of abatement costs are subsidized, the remaining 10% still represents a production cost borne by the private sector. This explains the small residual negative supply shock visible in output and consumption, despite the substantial public support. Scenarios (2) and (3), both requesting financing from public money, need further explanations as far as consumption and investment behave. First, while these scenarios imply higher public borrowing and a corresponding need for increased household savings, its impact on consumption is offset—and ultimately dominated—by stronger income effects, as subsidies and public investment stimulates GDP and aggregate demand. Second, while higher government borrowing could also crowd out private investment through reduced available savings, this effect is more than offset by strong demand-side stimulus from public investment, which boosts output and, in turn, encourages private capital accumulation. Moreover, although abatement costs act as a negative TFP shock—reducing the return to capital—this effect is significantly attenuated in the subsidy case because the government absorbs a large share of the cost, cushioning the productivity decline faced by the private sector. Overall, the simulations offer valuable insights into the dynamics of public finances and the key mechanisms driving these outcomes during the transition. However, it is challenging to draw definitive conclusions about long-term fiscal sustainability over the 35-year period, as our model incorporates a fiscal rule to prevent public debt from following an unsustainable trajectory. What is most relevant in our analysis is understanding how public finances respond during the transition, depending on the policy choices made. This perspective highlights the interplay between policy design and fiscal dynamics rather than focusing solely on long-term debt outcomes.
4.2 Adding climate damages to the model
The physical consequences of climate change could also put pressures on public finances by reducing economic growth, making therefore public debt unsustainable. To assess such effects, we include in the model damage functions. To gauge how sensitive our results could be to the type of damage functions, we run our simulations with two specifications, one from Annicchiarico and Di Dio (Reference Annicchiarico and Di Dio2015) and one from Dietz and Venmans (Reference Dietz and Venmans2019). Figure 4 shows how our benchmark results are affected by adding climate damages to the model. In all scenarios, the real effects are more negative, with lower GDP, consumption and investment. For instance, in the carbon tax scenarios (scenario (1)), the decline in GDP goes from −1% in the benchmark results to −2% with the damage function by Dietz and Venmans (Reference Dietz and Venmans2019) and −5% with the function proposed by Annicchiarico and Di Dio (Reference Annicchiarico and Di Dio2015). Similarly, the positive impacts on GDP of the two other scenarios are lower or even turn negative with the second damage function. Interestingly, the impact on public finances is broadly unchanged in the case of scenarios (1) and (3), but are more adverse in the case of the public mitigation scenario (scenario (2)). In particular, using the Annicchiarico and Di Dio (Reference Annicchiarico and Di Dio2015)’s damage function, the maximum impact on debt-to-GDP ratio increases from 117% to close to 120%, although the further increase arises 10 years later. This leads as a result to higher probability of default (peaking at 15% in 2040) and higher interest rates (up to 300 basis points in 2040 compared to the initial steady-state value, that is, almost 100 basis points more from its maximum without considering damages).
The impact on fiscal and macroeconomic variables of climate change according to two alternative damage functions in 3 carbon budget-consistent scenarios: (1) carbon tax (green line); (2) direct public mitigation (red line); (3) carbon tax with subsidies at 90% (blue line). The damage function denoted AD corresponds to Annicchiarico and Di Dio (Reference Annicchiarico and Di Dio2015), and DV to Dietz and Venmans (Reference Dietz and Venmans2019).

4.3 Debt-to-GDP levels and the transition
The next exercise involves examining the initial debt situation to differentiate the impact of transition policies on public finances according to whether the country is low or high debt. Zenios (Reference Zenios2022) underlines that the high indebtedness of a country (Italy in his study) can be even more problematic in terms of public finance sustainability when the government tackles climate change issues. To do this, we run the previous simulations with calibrations applied to high-debt and low-debt countries, Italy and Germany, respectively. First of all, it should be noted that the impacts on real GDP, consumption, and investment are broadly similar (see Figure 5), despite different levels of carbon tax (in scenario (1)) and public abatement expenditures (in scenarios (2) and (3)). These differences can be explained by different carbon budgets and carbon intensities. However, the initial public debt situation has an impact on the future of public finances, and the lower the public debt, the less detrimental it is for debt sustainability. While the favorable scenario for public finances (scenario (1) with carbon tax only) leads to a similar drop in the probability of default for all countries (see Figure 15 - Appendix E), the trajectory of scenario (2), that is, with direct public mitigation effort, is particularly unfavorable for highly indebted countries, with in our case a further increase from 10% in our benchmark economy (France) to 14% in the case of Italy. The increase in Italian sovereign bond interest rates from current level is close to 250 basis points compared to less than 200 basis points in the case of France and almost no change in the case of Germany. These results show therefore the sensitivity of interest rates on public debt to the initial conditions. A highly indebted country will experience tensions on the sovereign debt market, paying large risk premia when the transition policy implies, as in scenario (2), a further increase in public debt.
The role of initial debt levels. Macroeconomic and fiscal developments in Italy, France and Germany for 3 carbon budget-consistent scenarios: (1) carbon tax (green line); (2) direct public mitigation (red line); (3) carbon tax with subsidies at 90% (blue line).

4.4 Financial spillovers of high debt
Our final sensitivity analysis concerns the possible financial impact of higher government debt on private sector financing conditions. To do this, we create a link between the interest rate on government bonds, which is influenced by debt sustainability issues, and the cost of capital for the private sector. By following Burriel et al. (Reference Burriel, Checherita-Westphal, Jacquinot, Schön and Stähler2020), we therefore modify equation (22) as follows:
 \begin{align} R_{t} =\frac {1}{q_t^k \mathbb{E}_t \left [\lambda _{t+1}\right ]}\left \{\mathbb{E}_t\left [\lambda _{t+1} {R^k_{t+1}}\right ] + (1-\delta )\mathbb{E}_t\left [\lambda _{t+1}q^k_{t+1}(1-\omega _q f \vartheta _t\mathsf{PD}_{t+1}) \right ]\right \}, \end{align}
where we calibrate the degree of spillover of public default risk to the private sector
 $\omega _q= 0.5$
. Figure 6 depicts the spillover mechanism. To study the case where interest rates are the most sensitive to the initial debt situation, we assess such financial spillovers in the case of Italy. Most of the effects are visible on the macroeconomic variables (see Figure 7). The increase in the rental rate of capital coming from the transmission of debt sustainability issues on financial markets is around 60 basis points in the direct public mitigation scenario (scenario (2)). The tightening of financing conditions for the private sector leads to negative effects on investment and consumption that are amplified by the contraction in demand. Overall, GDP contracts by almost 1.5% in 2032, while it increases when neglecting such financial spillovers (by 1.5%). Consumption reaches a low of −3% by 2040 while investment dynamics is quicker and more adverse with a decline by −9% in 2030. The deterioration in economic conditions also affects public finances. Although the maximum increase in debt and the probability of default are broadly similar whether or not spillover effects are taken into account, amplification by the private sector plays more a role in the dynamics, as these increases occur earlier and faster if spillover effects are taken into account. The impact of financial spillovers in the other two scenarios is more benign, although the positive effect on GDP of subsidies (scenario (3)) is much lower and the demand component dynamics are worse, including a temporary decline in investment and lower consumption. By contrast, the financial spillovers absorb part of the negative effect of carbon taxation on the macroeconomy. Due to a greater drop in the cost of capital, the decline in investment and consumption is more moderate.
The overall effect on GDP is also less negative during the transition. For example, in 2035, GDP falls by around 0.5%, whereas it falls almost twice as much in the absence of spillover effects. Additional results are provided in Appendix F, with sensitivities to various degrees of subsidies (Figure 16).
5. Welfare maximization and the optimal public abatement
To complete our analysis, we employ a dynamic Ramsey model to determine the optimal share of public abatement. The results thus far highlight a key trade-off for policymakers: placing the burden of the green transition on the private sector risks undermining the country’s economic performance, while relying heavily on public spending threatens the sustainability of public debt. In this context, we aim to identify the optimal degree of government intervention that maximizes citizens’ welfare, balancing economic, fiscal, and environmental considerations.
The financial impact of higher government debt on private sector financing conditions. Variables between parentheses are not null only in case of default on government debt.

Spillover of high public risk to the the private sector. Fiscal and macroeconomic developments in Italy for 3 carbon budget-consistent scenarios: (1) carbon tax (green line); (2) direct public mitigation (red line); (3) carbon tax with subsidies at 90% (blue line).

We define the social planner’s problem as the committed choice of the share of government direct investment in total abatement efforts,
 $\theta _t$
, in order to maximize welfare, defined as the present discounted value of utility:
 \begin{align} \max _{\theta _t} \mathcal{V}_t = \max _{\theta _t} \left (\ln C_{t}-\mu _L \frac {L_{t}^{1+\sigma _l}}{1+\sigma _l}\right ) + \beta \mathbb{E}_t \mathcal{V}_{t+1}, \end{align}
subject to all the equations describing the competitive equilibrium.
We start by defining the optimal share of public abatement by ignoring the possibility for the government to subsidize the private effort. We also neglect spillover effects through financing costs in a first exercise.
The results in Figure 8 show that to keep public debt on a sustainable path, the effort should be borne by the private sector at the beginning of the transition, implying a sharp increase in the carbon tax. As in our benchmark results, the carbon tax increase might appear excessively steep and high, raising questions about its feasibility. However, as previously noted, the level reflects the social cost of carbon required to stay within the carbon budget, while the trajectory is designed to provide the incentives needed for the private sector to accelerate decarbonization. This triggers some economic costs with a decline of about 0.4% of GDP. This immediate involvement of the private sector is related to the fact that, at the beginning of the transition, when the effort to decarbonize is still minimal, abatement costs are lower for the private sector.Footnote 20 As the transition path progresses, the abatement effort increases and becomes more costly, even more so for the private sector. To limit these costs and their impact on welfare, the government should increase gradually its contribution. This intervention through public mitigation limits the cost in terms of GDP, which even benefits from public intervention from 2030–35, and stabilizes the decline in consumption at around 2%. The optimal share of public mitigation is around 40% at its highest, from 2040 onwards. By relying initially more on the private sector, public debt can be stabilized and the pressure on interest rates on government bonds remains limited.
Optimal public over total abatement. Fiscal and macroeconomic developments in France, Germany, and Italy, under zero subsidies and no spillover.

Optimal public over total abatement and economic output in France, under various degrees of subsidies.

The long-term equilibrium share of public mitigation, in line with the evaluation proposed by Pisani-Ferry and Mahfouz (Reference Pisani-Ferry and Mahfouz2023) in the case of France, depends on public finance conditions and relative mitigation costs. In Appendix G, we provide some sensitivity of this optimal share to different relative abatement costs between the public and private sectors and to the share of public spending in GDP (Figures 17--20). The results show that changing the convexity parameter of mitigation costs (
 $\theta _4$
) changes both the steady state of the optimal public share of abatement and its transition path.
When the parameter is assumed to be the same for both sectors (while it is lower by 40% in our benchmark results), the optimal public share of abatement rises immediately to 45%, while it rises more gradually to 40% in our benchmark results. Regarding the share of public expenditure in GDP, the higher the level of government consumption, the lower the optimal public share of abatement in the steady state (from 45% with public expenditure at 10% of annual GDP to 35% when it is at 45%). These results show that for countries with high levels of public consumption, the remaining fiscal space is more limited to take on a larger share of mitigation efforts.
In terms of cross-country differences, we find very little variation in the optimal share of public abatement between France, Germany, and Italy. The fact that France already has a favorable energy mix implies a later involvement of the public sector, but a higher level of carbon tax to incentivize the private sector to decarbonize even more. Italy’s high initial public debt does not prevent the government from investing public funds in the transition, but it does lead to higher interest rates on government bonds to keep the debt under control. In all countries, the cost in terms of lost consumption is relatively similar (around −2%) and relatively contained compared to previous scenarios involving only the private sector, while remaining broadly in line with the loss that occurs when only the public sector bears the cost of the transition.
The second-to-last exercise considers the possibility for the government to subsidize private abatement efforts. Figure 9 presents the welfare-maximizing results for France under various levels of subsidies. Including subsidies in the policy mix increases the optimal share of public abatement and leads to more positive effects on GDP. It is important to recall that the marginal cost of private mitigation remains the same for a given level of mitigation effort, whether it is incentivized through a carbon tax or through green subsidies. However, these two instruments have opposite effects on GDP and public debt. By contrast, subsidies have economic implications that are similar to those of direct public investment in mitigation. Nonetheless, at higher levels of abatement, public intervention is more efficient when implemented through direct public mitigation rather than through subsidies to the private sector. This explains why the optimal
 $\theta$
reaches a greater value when a higher level of subsidies is assumed, given their similar effects on public debt and borrowing costs, but their different marginal abatement costs. These results raise an important question regarding the role of carbon taxes in our model. A Pigouvian carbon tax is typically regarded as the first-best policy instrument to internalize environmental externalities. However, our simulations suggest that a combination of direct public investment and private mitigation maximizes welfare while stabilizing the debt-to-GDP ratio. A related question concerns how this result compares to what the optimal debt level would be. Our analysis does not aim to compute an optimal debt level, but rather to identify the optimal policy mix to support the transition, given the current level of debt-to-GDP. The concept of the fiscal limit adopted here, which determines the probability of default, is drawn from the literature on involuntary government debt default and is not related to welfare maximization. The underlying assumption is that, in advanced economies, governments do not strategically choose their debt levels; instead, the maximum amount they can borrow is determined by market forces. The last exercise analyses the implication of approaching the fiscal limit by including spillovers from higher public debt costs to economy-wide financing conditions. Figure 10 shows the results for Italy. The higher involvement of the public sector puts pressure on debt sustainability and, therefore, the economic costs become larger when financial spillovers are taken into account.
Optimal public over total abatement and economic output in Italy, without and with spillover.

Normalized abatement cost function for different convexity of the curve. The red (green) curve represents the benchmark assumption for the public (private) sector.

Overall, this welfare-maximizing exercise shows that to be optimal, the abatement effort can be shared equally by the public and private sectors, thereby limiting the welfare costs while keeping public debt in check. Moreover, the optimal policy path derived endogenously from the Ramsey framework already captures important elements of differentiated timing and intensity of interventions. In particular, it implies a sequencing of policies in which private sector action is frontloaded through strong price signals (i.e., a rising carbon tax), while public investment gradually scales up as abatement becomes more costly. This policy profile reflects not only a balance of macroeconomic and fiscal trade-offs but also improves political feasibility by smoothing adjustment costs over time. While this analysis does not explicitly test alternative policy mixes defined ex ante, it offers a robust benchmark for assessing the desirability of such differentiated and time-varying strategies.
6. Conclusions
This paper sheds light on the intricate dynamics between the imperative of the green transition, the delicate balance of public finances, and the potential macroeconomic ramifications. Based on a Neo-classical model including the environmental component and risky government debt, our findings underscore a critical paradox: while transition policies are pivotal for steering economies towards a low-carbon future, those entailing an increase in public debt pose important challenges. The risk of making public debt unsustainable or precipitating higher financing costs is significant, hampering the very transition they aim to facilitate. Moreover, the incorporation of climate-related damages into our model worsens the situation, nullifying the positive macroeconomic effects that public expenditure-driven policies might otherwise have on aggregate demand.
In addition, the paper highlights the key role of initial debt conditions, explaining that highly indebted countries are the most likely to suffer the negative repercussions of transition policies on public finances. This vulnerability amplifies the urgency of adopting prudent fiscal strategies to effectively manage the transition. Finally, taking into account the spillover of increased public debt riskiness on private financing conditions reveals a more worrying macroeconomic impact, accentuating the importance of financial interactions.
Strategies based on carbon taxation, on the other hand, are costly for the macroeconomy, particularly for households who reduce their spending to finance transition costs and limit pressure on public finances. However, intermediate strategies, such as recycling carbon tax revenues by increasing public spending, or carbon pricing policies combined with public subsidies for private-sector abatement efforts, have more neutral effects on macroeconomic variables, while making public debt more sustainable. Our welfare-maximizing exercise supports indeed a balanced approach, where the share of the mitigation effort undertaken by the public sector ranges from 25% to 40% between 2030 and 2050.
Our analysis relies on a debt stabilization rule that prevents public debt from being unsustainable in the long term. This rule uses lump-sum taxes as a way to stabilize public debt. A more complex model could account for diverse tax sources and include distortionary taxes, like income tax, capital tax or VAT, that could potentially modify the optimal policy mix. For instance, Barrage (Reference Barrage2020) shows that optimal carbon tax schedules are 8–24% lower when there are distortionary taxes, compared to the setting with lump-sum taxes considered in the literature and in this paper. Another possible extension could consider the role of frictions in market adjustments, leading climate policies to impact price dynamics. In such a framework, it would be interesting to study how monetary policy could interact with fiscal policy in the macroeconomic dynamics of the green transition. Finally, the aim of our paper is to describe illustrative and normative scenarios, rather than empirical and positive ones. However, a more complex approach could also consider the role of the rest of the world in a small open economy setting, taking into account the role of divergent mitigation strategies across countries. In the European context, it would also be particularly important to consider the interaction between European and national policies when designing optimal decarbonization strategies for governments. Such extensions are however left for future research.
In light of the findings of this paper, policymakers are urged to exercise prudence in designing transition policies, recognizing that their fiscal implications extend far beyond the immediate macroeconomic effects. A balanced approach that safeguards public finances, recognizes initial debt conditions, relative marginal abatement costs and anticipates financial spillovers is essential to ensure the effectiveness and sustainability of the green transition. Combining environmental and fiscal sustainability is indeed key, as the imperative of a low-carbon future should not blind us to the complex fiscal landscape that surrounds it. A misstep in this area could undermine the very goals we seek to achieve.
Acknowledgements
We are grateful to Jean-Charles Rochet, Tony Berrada, Katheline Schubert, Olivier Blanchard, Ugo Panizza, Michel Juillard, Jean-Guillaume Sahuc, Pascal Jacquinot, Julien Matheron, Aude Pommeret, Sophie Zhou, Fanny Henriet, Noëmie Lisack, and other participants at the Banque de France’s Research Seminar, PSE Macro Workshop, 4th EENR International Conference, 4th WIMFEH Workshop, the RCEA ICEEF 2024, TSE-Banque de France Climate & Biodiversity Conference, 31st CEPR ESSIM, and 72nd AFSE Congress for valuable suggestions. Caterina Seghini gratefully acknowledges the financial support of the Swiss Finance Institute and the University of Geneva, which funded her doctoral studies during which this research was conducted. Remaining errors are the authors’. This paper reflects the opinions of the authors and do not necessarily express the views of the Banque de France or the Eurosystem.
Appendix
A. Summary of equilibrium equations
Lower case letters denote detrended variables, starred variables denote steady-state values.Footnote 21
 \begin{align*} &c_t= \frac {1}{\lambda ^z_t} ; \quad {\lambda ^z_t}= \bar {\beta } \mathbb{E}_t \left [\lambda ^z_{t+1}(1-f\vartheta _{t+1})R^d_t \right ] ; \quad w_t= c_t \mu _l L_t^{\sigma _l}\\[3pt]&1= q_t^k \left [1 - \frac {\iota }{2} \left (\frac {i_te^z}{ i_{t-1}} - e^z\right )^2 - \iota \left (\frac {i_te^z}{ i_{t-1}} - e^z\right )\frac {i_te^z}{ i_{t-1}}\right ] \\[3pt] &\quad\quad+\frac {\bar {\beta } }{\lambda ^z_t}\mathbb{E}_t\left [\lambda ^z_{t+1}q_{t+1}^k \iota \left (\frac {i_{t+1}e^z}{ i_{t}} - e^z\right )\left (\frac {i_{t+1}e^z}{ i_{t}}\right )^2\right ] \\[3pt] & R_{t}\equiv \frac {\lambda ^z_t}{\bar {\beta } \mathbb{E}_t \left [\lambda ^z_{t+1}\right ]}= \frac {1}{q_t^k\mathbb{E}_t \left [\lambda ^z_{t+1}\right ]}\left \{\mathbb{E}_t\left [\lambda ^z_{t+1} {R^k_{t+1}}\right ] + (1-\delta )\mathbb{E}_t\left [\lambda ^z_{t+1}q^k_{t+1} \right ]\right \} \\[3pt] &k_{t+1} = \frac {(1-\delta )}{e^z}k_{t}+i_t \left [1- \frac {\iota }{2} \left (\frac {i_te^z}{ i_{t-1}} - e^z\right )^2\right ]\\[3pt] &y_{t} = D_f(H^G_t)k_{t}^\kappa L_{t}^{1 - \kappa } \\[3pt] &{R_t^k}=\frac {\kappa }{1-\kappa } \frac {L_t}{k_t}{w_t} \\[3pt] &1= \frac {{w_t}^{1-\kappa } {R^k_t}^\kappa }{D_f(h^G_t) \kappa ^{\kappa }(1-\kappa )^{(1-\kappa )} } + (1-s^A_t)\theta _1 m_{t}^{\theta _2} +\xi _0 P^E_t (1- m_{t}) \end{align*}
 \begin{align*} &{m_{t}}= \left [\frac {\xi _0 P^E_t}{(1 -s^A_t) \theta _1 \theta _2} \right ]^{1/(\theta _2-1)} \\[3pt] &y_t= c_t+i_t+g y_t +f\vartheta _{t} b_{t-1}y_{t-1}e^{-z}R^d_{t-1} +\theta _1 m_{t}^{\theta _2}y_t +\theta _3 (m^g_{t})^{\theta _4}y_t\\[3pt] & e_{t} = \xi _0 (1- m_{t}) y_{t}\\[3pt] &h^G_t = {h^G_{t- 1}} + \frac {\bar {E}^G_0}{\bar {E}^n_{0}}e_{t}\\[3pt] & D_{\text{DV}}(h^G_t) = \bar {D} \exp \left \{-\frac {\gamma _3}{2} \left [\gamma _4 h^G_t\right ]^2\right \}, \quad D_{\text{AD}}(h^G_t)= \bar {D}(1- \gamma _0 - \gamma _1 h^G_t - \gamma _2 {h^G_t}^2), \quad D_{\text{NC}}(h^G_t)= \bar {D} \\[3pt] & b_t = \frac { b_{t-1}R^d_{t-1}y_{t-1}}{y_te^z} - \left[\tau _t + \xi _0 P^E_t (1- m_t) -g -s^A_t \theta _1 m_t^{\theta _2}- \theta _3 (m^g_{t})^{\theta _4}\right]\\[3pt] & \tau _t = \phi _{\tau ,t}[\tau _{t-1} +\phi _{b} (b_{t}-b_{t-1})] +(1-\phi _{\tau ,t})[\tau _*+ \phi _{b} (b_{t}-b_*)]\\[3pt] &\phi _{\tau ,t} = \frac {1}{1 + \phi _{\tau ,*} \tau _{*}} +\unicode {x1D7D9}_{D_f(H^G_t)\neq \bar {D}} \phi _{\tau ,y}(y_{0, \text{fr}} - y_{0,n}) (b_{t-1} - b_*) \\[3pt] & b_t = \frac {d_{t}}{R^d_t} \\[3pt] &\sum _{t=0}^{+\infty } e_t =\bar {E}^n_0 \Longrightarrow m_{t}+m^g_t= \left (\frac {h_{t-1}}{\bar {E}_0^n}\right )^p; \quad m^g_t=\theta (m_{t}+m^g_t) \end{align*}
B. Abatement cost function
Normalized marginal abatement cost function for different convexity of the curve. The red (green) curve represents the benchmark assumption for the public (private) sector.

Carbon emissions’ path respecting the carbon budget, and the fiscal impact of 3 path-consistent scenarios: (1) carbon tax (green lines); (2) direct public mitigation (red lines); (3) carbon tax with subsidies at 90% (blue line).

C. Additional results—Benchmark
D. Additional results—Adding climate damages
The impact on fiscal variables of climate change according to two alternative damage functions in 3 carbon budget-consistent scenarios: (1) carbon tax (green line); (2) direct public mitigation (red line); (3) carbon tax with subsidies at 90% (blue line).

E. Additional results—Cross-country differences
The role of initial debt levels. Fiscal developments in Italy, France and Germany for 3 carbon budget- consistent scenarios: (1) carbon tax (green line); (2) direct public mitigation (red line); (3) carbon tax with subsidies at 90% (blue line).

F. Additional results—Financial spillovers
Spillover of high public risk to the the private sector. Fiscal and macroeconomic developments in Italy for 3 carbon budget-consistent scenarios: (1) carbon tax (green line); (2) direct public mitigation (red line); (3) carbon tax with subsidies at 90% (blue line).

G. Additional results—Welfare maximization
Optimal public over total abatement. Fiscal and macroeconomic developments in France, under various degrees of subsidies.

Optimal public over total abatement. Fiscal and macroeconomic developments in Italy, with and without spillover.

Optimal public over total abatement and economic output in France, with alternative convexity of abatement costs.

Optimal public over total abatement and economic output in France, with alternative fractions of public expenditure over GDP.