


Introduction
Over the past two decades, an entire generation of Mexicans has come of age during the country’s deadliest wave of violence since the 1910 Revolution. The ongoing ‘drug war’ has claimed more than 450,000 lives and led to over 120,000 disappearances since December 2006.Footnote 1 Millions of Mexicans have transitioned to adulthood in communities torn apart by violence and insecurity, witnessing an unprecedented militarization of public security and of everyday life. This generation now constitutes one-third of the country’s voting-age population.Footnote 2 Despite the scale and intensity of this conflict, little is known about its socio-political impact on the youth. How does growing up in communities marked by large-scale criminal violence and militarized security policies shape young people’s political attitudes and behaviors?
This question highlights a significant gap in the literature, as youth make up a disproportionately large share of victims and perpetrators of organized criminal violence (Chioda Reference Chioda2017; Muggah and Tobón Reference Muggah and Tobón2018; Rivera Reference Rivera2016; Sweeten et al Reference Sweeten, Piquero and Steinberg2013). Our study addresses this gap by examining how childhood exposure to both criminal violence and militarized law enforcement shapes trust and other political attitudes among Mexican youth. While existing research has documented the effects of exposure to violence in adulthood, far less is known about the political consequences of early-life exposure. Drawing on political socialization theories (Campbell et al Reference Campbell, Converse, Miller and Stokes1980; Green et al., Reference Green, Palmquist and Schickler2004; Healy and Malhotra Reference Healy and Malhotra2013; Hyman Reference Hyman1959) and research on the attitudinal and behavioral effects of exposure to violence (Balcells and Torrats-Espinosa Reference Balcells and Torrats-Espinosa2018; Bateson Reference Bateson2012; Bauer et al Reference Bauer, Blattman, Chytilová, Henrich, Miguel and Mitts2016) and militarized security (Flores-Macías and Zarkin Reference Flores-Macías and Zarkin2022; Masullo and Morisi Reference Masullo and Morisi2024), this study shows that early-life exposure to criminal violence and military intervention has lasting consequences for political attitudes in adulthood.
A key contribution of our work is showing how different types of exposure shape these attitudes. We theoretically distinguish and empirically test the effects of lethal criminal violence and military interventions. Specifically, we argue that childhood exposure to lethal criminal violence should negatively affect trust in both the community and law enforcement later in life.Footnote 3 In contrast, childhood exposure to state-led militarized operations should decrease trust in specific institutions responsible for these operations. In Mexico, the detrimental impact on trust is more likely to be observed in government authorities and state security forces such as the federal police (or national guard) and the military, which were deployed throughout the country to combat organized criminal groups (OCGs). However, we note that although military interventions often coincide with increased violence, this is not always the case. We adjudicate between military-cartel confrontations and military operations alone to explore conditional effects.
To test our empirical expectations, we use an original in-person survey of nearly 3,000 individuals representative of Mexico’s urban population aged 16–29. A distinctive feature of our survey design is that respondents indicate where they spent the majority of their childhood, enabling us to match them with fine-grained municipal data on criminal violence and militarized law enforcement during their childhood. Specifically, we construct measures of childhood exposure to lethal criminal violence, armed confrontations between military forces and drug-trafficking organizations, and military operations based on respondents’ birth year and childhood municipality of residence.
Thus, the core of our empirical strategy exploits variation in exposure to violence and militarized law enforcement during childhood based on respondents’ geographic location and date of birth. In essence, we test whether respondents exposed to varying levels of violence, military confrontations, and military operations during childhood exhibit different levels of interpersonal and political trust. To strengthen causal identification, we also implement a quasi-experimental design that treats the 2007 deployment of military forces to combat drug cartels as an exogenous policy shock, building upon previous research that has employed similar approaches (for example, Flores-Macías Reference Flores-Macías2018; Trejo and Skigin, Reference Trejo and Skigin2026).
The results confirm our expectations: (1) youths who grew up in the most violent environments exhibit lower levels of trust in law enforcement authorities and their communities; and (2) military confrontations and operations negatively impact trust in the authorities involved in the militarization of public security – specifically, the federal police, the military, and, to some extent, the government. The results of exposure to military interventions are strongest when they involve violent confrontations. We also find that citizens may not lose trust in the government as a whole but instead hold specific politicians accountable for militarized security policies. Analyzing how violence and militarized law enforcement shaped vote choice in the June 2021 midterm election among voting-aged respondents, we find backlash against the PAN and PRI and higher null voting and abstention, likely in reaction to drug-war-era military actions. Taken together, these findings support the argument that citizens selectively punish politicians linked to militarized security strategies, and that such efforts may foster political disaffection.
Our findings do not discount the fact that exposure to drug-war violence during other life stages influences political attitudes. Rather, we show that childhood exposure has a direct effect on political attitudes that is not confounded by alternative explanations or later exposure. This is one of the key contributions of our study. Previous research has examined the effects of organized criminal violence on political participation (Córdova Reference Córdova2019; Dorff Reference Dorff2017; Trelles and Carreras Reference Trelles and Carreras2012), electoral accountability (Carreras and Visconti Reference Carreras and Visconti2022; Ley Reference Ley2017), political competition (Daniele and Dipoppa Reference Daniele and Dipoppa2017; Trejo and Ley Reference Trejo and Ley2021), and policy preferences (García-Ponce et al Reference García-Ponce, Zeitzoff and Wantchekon2021; Laterzo Reference Laterzo2024; Visconti Reference Visconti2020), among other political outcomes (García-Ponce Reference García-Ponce2025). Newer research has extended this work to consider the impacts of militarized law enforcement on political attitudes (Flores-Macías and Zarkin Reference Flores-Macías and Zarkin2022; Masullo and Morisi Reference Masullo and Morisi2024). However, these studies have focused on adulthood and on the relatively contemporaneous effects of exposure on political attitudes. The political consequences of growing up in communities affected by criminal violence and related conflict have largely been overlooked. We extend this literature by shifting the focus to this critical younger age group.
We also contribute to research on the formation of political beliefs and the causal effects of childhood experiences on political attitudes. Childhood socialization processes and life conditions heavily influence political attitudes, behavior, and preferences in adulthood (Campbell et al Reference Campbell, Converse, Miller and Stokes1980; De Neve Reference De Neve2015; Green et al., Reference Green, Palmquist and Schickler2004; Healy and Malhotra Reference Healy and Malhotra2013; Hyman Reference Hyman1959; Jennings and Niemi Reference Jennings and Niemi2014). Numerous studies show that childhood exposure to violence – particularly during civil war – affects human capital accumulation (Chamarbagwala and Morán Reference Chamarbagwala and Morán2011; Justino et al Reference Justino, Leone and Salardi2014; Leon Reference Leon2012; Shemyakina Reference Shemyakina2011), health-related outcomes (Akbulut-Yuksel Reference Akbulut-Yuksel2017; Akresh et al Reference Akresh, Lucchetti and Thirumurthy2012), and broader human development. This trauma can even be transmitted across generations (Lupu and Peisakhin Reference Lupu and Peisakhin2017). We advance this scholarship by showing that childhood exposure to criminal violence and militarized security has lasting effects on adult political attitudes and voting preferences.
While our study is focused on Mexico, it offers broader insights for other contexts. Many countries across Latin America and beyond face unprecedented crises of criminal violence, territorial control by non-state armed groups, and increasingly militarized government responses. Understanding how these experiences influence the political attitudes, behaviors, and beliefs of young people coming of age during these conflicts is vital for understanding and addressing threats to democratic governance.
The remainder of the article is structured as follows. We first present our theoretical framework and situate our argument within the relevant literature, then provide historical context on Mexico’s drug war and outline our empirical expectations. Next, we describe our data collection and empirical approach. We then report the main findings and discuss their implications. We conclude by underscoring the need for further research on how rising criminal violence shapes the political beliefs and values of younger generations across the Global South.
Theoretical Framework
The notion that early-life exposure to protracted violence can significantly impact the development of political attitudes and behavior finds support in two complementary strands of research. The first underscores the influence of childhood experiences in shaping political beliefs but seldom considers the influence of exposure to crime and violence. The second establishes a link between exposure to violence and subsequent political attitudes and behaviors, but focuses primarily on adults. Our study weaves these literatures together to reveal the impacts of childhood exposure to criminal violence and military interventions on political attitudes within the context of Mexico’s drug war.
Childhood Experiences and Political Socialization
Cornerstone research in developmental psychology and neuroscience shows that the architecture of the human brain is affected by early childhood experiences and environmental factors, particularly during the first eight to ten years of life. Early life experiences – positive and negative – provide the foundation for future behavioral, cognitive, and social skill development (Feldman Reference Feldman2020; Heim and Nemeroff Reference Heim and Nemeroff2001; Knudsen et al Reference Knudsen, Heckman, Cameron and Shonkoff2006). Adverse or traumatic experiences – especially in this formative period – have strong impacts on outcomes such as skill development and later employability (Shonkoff and Phillips Reference Shonkoff and Phillips2000), mental health (Boullier and Blair Reference Boullier and Blair2018), high-risk behaviors (Campbell et al Reference Campbell, Walker and Egede2016), and personality traits (Fletcher and Schurer Reference Fletcher and Schurer2017).
Childhood experiences heavily influence the formation of political attitudes, behaviors, and beliefs. Building on Hyman (Reference Hyman1959)’s seminal work on the political socialization of children in the United States, longitudinal and intergenerational studies have consistently found persistent relationships between processes of childhood socialization and political beliefs (Hatemi et al Reference Hatemi, Funk, Medland, Maes, Silberg, Martin and Eaves2009; Jennings and Niemi Reference Jennings and Niemi2014). Indeed, political identities adopted early in life strongly predict adult political views (Campbell et al Reference Campbell, Converse, Miller and Stokes1980; Green et al., Reference Green, Palmquist and Schickler2004; Healy and Malhotra Reference Healy and Malhotra2013), and powerful early-life experiences can shape ideology and policy preferences. For instance, Yanagizawa-Drott and Madestam (Reference Yanagizawa-Drott and Madestam2011) find that childhood exposure to patriotic events in the United States increases Republican identification, votes for Republicans, and turnout later in life, while Guo et al (Reference Guo, Gao and Liang2023) show that early-life famine severity experienced by Chinese politicians influences their policy preferences.
A growing body of work corroborates that social cognition in early childhood is already oriented towards group living, setting the foundation of political sensitivities and attitudes (Reifen-Tagar and Cimpian Reference Reifen-Tagar and Cimpian2022; Wegemer and Vandell Reference Wegemer and Vandell2020). This challenges the assumption that young children lack the cognitive capacity and social understanding to develop political thought (Guidetti et al Reference Guidetti, Carraro and Castelli2021; Rizzo et al Reference Rizzo, Elenbaas and Vanderbilt2020; Taylor Reference Taylor2020). Most of these studies have primarily focused on understanding the development of political beliefs in the context of the United States and Western Europe. In Mexico, the foundational work by Segovia (Reference Segovia1975) demonstrated that Mexican children’s political attitudes in the early 1970s mirrored the authoritarian tendencies of the hegemonic one-party regime.Footnote 4
Although we know that childhood plays a foundational role in shaping attitudes and behaviors, existing research often overlooks the significance of childhood exposure to violence on political attitudes. Only a handful of studies have paid attention to this subject. Lupu and Peisakhin (Reference Lupu and Peisakhin2017) provide evidence of intergenerational effects of violence on ethnic identity and political attitudes among Crimean Tatars who suffered the violence of deportation. Similar patterns have been shown in South Korea (Hong and Kang Reference Hong and Kang2017) and in Africa (Adhvaryu and Fenske Reference Adhvaryu and Fenske2023). This nascent literature – in tandem with well-established knowledge of the larger impact of childhood events on adult attitudes and behaviors – provides strong suggestive evidence that exposure to violence, as well as to state interventions aimed at curbing it, should shape political orientations later in life. Importantly, the effects may vary with the type of violence, since different forms of violence are not equally visible, salient, or psychologically processed. Our study contributes to this literature by examining how exposure to organized criminal violence and drug-war militarized operations during childhood in Mexico affects political attitudes in adulthood.
Exposure to Violence, Military Interventions, and Political Attitudes
A large body of research finds that exposure to violence increases political engagement (for example, Bateson Reference Bateson2012; Bauer et al Reference Bauer, Blattman, Chytilová, Henrich, Miguel and Mitts2016). However, studies that isolate different types of violence exposure present more nuanced findings (García-Ponce Reference García-Ponce2019; Grossman et al Reference Grossman, Manekin and Miodownik2015; Jones et al Reference Jones, Troesken and Walsh2017). In Latin America, where organized crime is a major security threat, exposure to criminal violence seems to negatively impact political trust, particularly in security-related institutions (Blanco and Ruiz Reference Blanco and Ruiz2013; Blanco Reference Blanco2013; Corbacho et al Reference Corbacho, Philipp and Ruiz-Vega2015; Malone Reference Malone2010; Pion-Berlin and Carreras Reference Pion-Berlin and Carreras2017). This suggests that individuals attribute insecurity to the actors that generate it, or fail to prevent it, a pattern observed beyond the region as well (Deglow and Sundberg Reference Deglow and Sundberg2021). Although these studies do not connect childhood experiences to adult behaviors or attitudes, they show that experiences across one’s lifecycle are impactful. This does not contradict evidence that crime and violence can also increase political participation or prosocial behavior; victimization can simultaneously reduce trust and increase participation in social and political organizations (Pazzona Reference Pazzona2020).
Effects on institutional trust are context-specific. In countries with lackluster justice systems, personal experience with crime erodes support only for the police. But the negative impacts of violence on institutional trust can travel beyond the criminal justice system (Malone Reference Malone2010). Some find that exposure to crime and insecurity decreases trust in government entities more generally. In Mexico, criminal violence demobilizes voters (Ley Reference Ley2018) and support for the national incumbent party varies inversely with prevailing levels of violence (Ley Reference Ley2017). In poor-performing, high-crime countries, fear of neighborhood crime has a negative relationship with measures of diffuse support (Blanco and Ruiz Reference Blanco and Ruiz2013; Malone Reference Malone2010). Such studies show that crime exposure can transcend measures of specific support, affecting individuals’ trust in major national institutions and the entire regime.
Violence exposure can also negatively affect interpersonal relationships and social cohesion. In terms of psychological effects, this includes a decreased ability to express empathy, increased antisocial behavior, and the normalization of aggression (Baskin and Sommers Reference Baskin and Sommers2015; Guerra et al Reference Guerra, Rowell Huesmann and Spindler2003; Hawkins et al Reference Hawkins, Herrenkohl, Farrington, Brewer, Catalano, Harachi and Cothern2000). In addition to direct cognitive and behavioral effects, exposure to violence leads to related secondary effects by increasing the likelihood that individuals interact with the justice system (Hawkins et al Reference Hawkins, Herrenkohl, Farrington, Brewer, Catalano, Harachi and Cothern2000; Siegel et al Reference Siegel, Estrada, Crockett and Baskin-Sommers2019). Crime victimization during adulthood has also been shown to decrease overall horizontal trust in one’s community, family, and friends (Corbacho et al Reference Corbacho, Philipp and Ruiz-Vega2015; Salmi et al Reference Salmi, Smolej and Kivivuori2007).
While deployment of law enforcement to combat drug-related violence typically entails exacerbated conflict – including substantial civilian casualties and human rights abuses (Calderón et al Reference Calderón, Robles, Díaz-Cayeros and Magaloni2015; Flores-Macías and Zarkin Reference Flores-Macías and Zarkin2024) – effects of this exposure may be nuanced. Research indicates that conflict related to law enforcement operations should have similar negative effects on attitudes. In Mexico, support for militarization decreases if operations cause civilian casualties, but not when victimization is isolated to cartel members (Masullo and Morisi Reference Masullo and Morisi2024). Given that such operations often lead to increased violence, negative attitudes are likely to grow following exposure to law enforcement-related conflict.
However, not all military operations necessarily entail violence, and operations without conflict may not have these effects. Indeed, individuals tend to be supportive of military operations and war in response to an imminent threat, but civilian costs can curtail this support (Dill and Schubiger Reference Dill and Schubiger2021). Further, in the context of Mexico, Flores-Macías and Zarkin (Reference Flores-Macías and Zarkin2022) show that military uniforms and weapons are perceived positively. Little research has adjudicated whether exposure to military presence itself, versus presence involving violence and conflict, has differing effects on trust.
Hence, prior work suggests that childhood exposure to violence, insecurity, and militarized law enforcement can diminish trust in various entities, both at the government and community levels. However, it also suggests that exposure should have differential effects on trust depending on the type of insecurity at hand. Exposure to criminal violence should have more general impacts on trust in one’s community but also in law enforcement agencies, who may be seen as responsible for preventing and responding to these acts. On the other hand, violence and insecurity more directly attributed to the state – such as conflicts between law enforcement and criminal groups – should affect trust in a distinct manner. This insecurity may be seen as more attributable to specific actors deployed (for example, the military, police) and officials involved in this deployment. Law enforcement deployments on their own, without necessarily entailing violence, should not necessarily have negative effects.
A Generation Exposed to Mexico’s Drug War
In December 2006, former Mexican president Felipe Calderón began a war against organized crime by deploying military forces throughout Northern and Western Mexico. Drug cartels in the country had flourished during the years prior, particularly during the era of one-party rule. Trejo and Ley (Reference Trejo and Ley2018), for example, show that in the 1990s, cartels engaged in significant violence, especially during periods of gubernatorial power shift. When one-party rule was broken, cartels continued their violent practices in attempts to re-establish and hold onto their power (Osorio Reference Osorio2013; Ríos Reference Ríos2015; Trejo and Ley Reference Trejo and Ley2020).
The beginning of Calderón’s administration marked a significant public security policy shift. The drug war became the centerpiece of his presidency (Lessing Reference Lessing2017), and the Mexican army (under the direction of the Secretariat of National Defense, SEDENA), which had not been trained to fight OCGs, became the leading force behind its operations. Federal police were regularly deployed in tandem with these forces, while lower-level police forces were often reported to be in collaboration with drug-trafficking groups.Footnote 5
In this way, the country largely saw the constabularization of the military, where the armed forces assumed domestic public safety tasks. Militarized policing was also present, where civilian-led police forces were equipped with military-grade weapons and gear, and engaged in military-style tactics, often in tandem with military forces (Flores-Macías and Zarkin Reference Flores-Macías and Zarkin2022). This entailed the adoption of security strategies developed for war, leading to human rights violations and the deterioration of democratic controls (Brewer and Verduzco Reference Brewer and Verduzco2022; Magaloni and Rodriguez Reference Magaloni and Rodriguez2020).
During the subsequent presidential administration, President Enrique Peña Nieto (2012–18) adopted a similar strategy towards organized crime. In addition to the domestic deployment of the military, he created a new national police force (the national gendarmerie) to assist in the efforts (Council on Foreign Relations 2022). Although the number of military operations declined, the core of his security strategy relied on capturing or killing criminal bosses, seizing drugs, and eradicating illicit crops. This approach deepened under President Andrés Manuel López Obrador (2018–24), although he applied different rhetoric to combating crime (Deare Reference Deare2021).
The militarization of public security has failed to reduce crime and violence in Mexico. As shown in Figure 1 (upper panel), despite a modest decline in the homicide rate at the beginning of Peña Nieto’s administration, homicides began to trend up again in 2015 and remained at record-high levels during López Obrador’s administration. Approximately 450,000 people have been killed and around 120,000 have been reported disappeared since the start of the drug war.
Homicide rate and military confrontations, 1990–2020.
Note: annual homicide rate and military confrontations across presidential administrations in Mexico (1990–2020), based on data from INEGI and SEDENA, respectively.

The production of violence involves a complex network of armed actors, including OCGs, state security forces, and vigilante groups, making it difficult to precisely estimate how many homicides are directly attributable to the drug war. However, there is growing evidence that the law enforcement approach adopted over the past two decades has contributed to the escalation of violence (Calderón et al Reference Calderón, Robles, Díaz-Cayeros and Magaloni2015; Dell Reference Dell2015; Phillips Reference Phillips2015). Although the Mexican state deployed troops domestically in the post-revolutionary era to suppress political opposition (Rath Reference Rath2013), the military’s role in everyday public security was far less visible and consequential prior to the drug war’s militarized turn. Work by Flores-Macías (Reference Flores-Macías2018) suggests that militarized anti-drug enforcement has weakened the Mexican state’s capacity not only to provide public order, but also to extract fiscal resources.
Thus, the drug war initiated by Calderón represents a defining era in Mexico’s modern history. An entire generation of Mexicans was born, raised, and transitioned to adulthood during the most violent episode in the history of the country over the past century. Those who were school-age children in the early years of the drug war now comprise a substantial part of the voting-age population. Many of these young adults grew up in communities with unprecedentedly high levels of crime and violence, witnessing both the consolidation of the militarization of public security and the government’s failures to make their communities safer.
In addition, youths account for an overwhelmingly high percentage of victims of criminal violence in Mexico. Based on official statistics from the National Institute of Statistics and Geography (INEGI), the homicide rate among youths aged 15–24 increased three-fold between 2007 and 2011. As of 2021, the year of our survey, approximately 21 per cent of the victims of intentional homicide were 24 years old or younger – more than half were under 34 years old. As a result of this, life expectancy has deteriorated among males and it has stagnated among females (Aburto et al Reference Aburto, Beltrán-Sánchez, García-Guerrero and Canudas-Romo2016; Canudas-Romo et al Reference Canudas-Romo, Aburto, García-Guerrero and Beltrán-Sánchez2017).
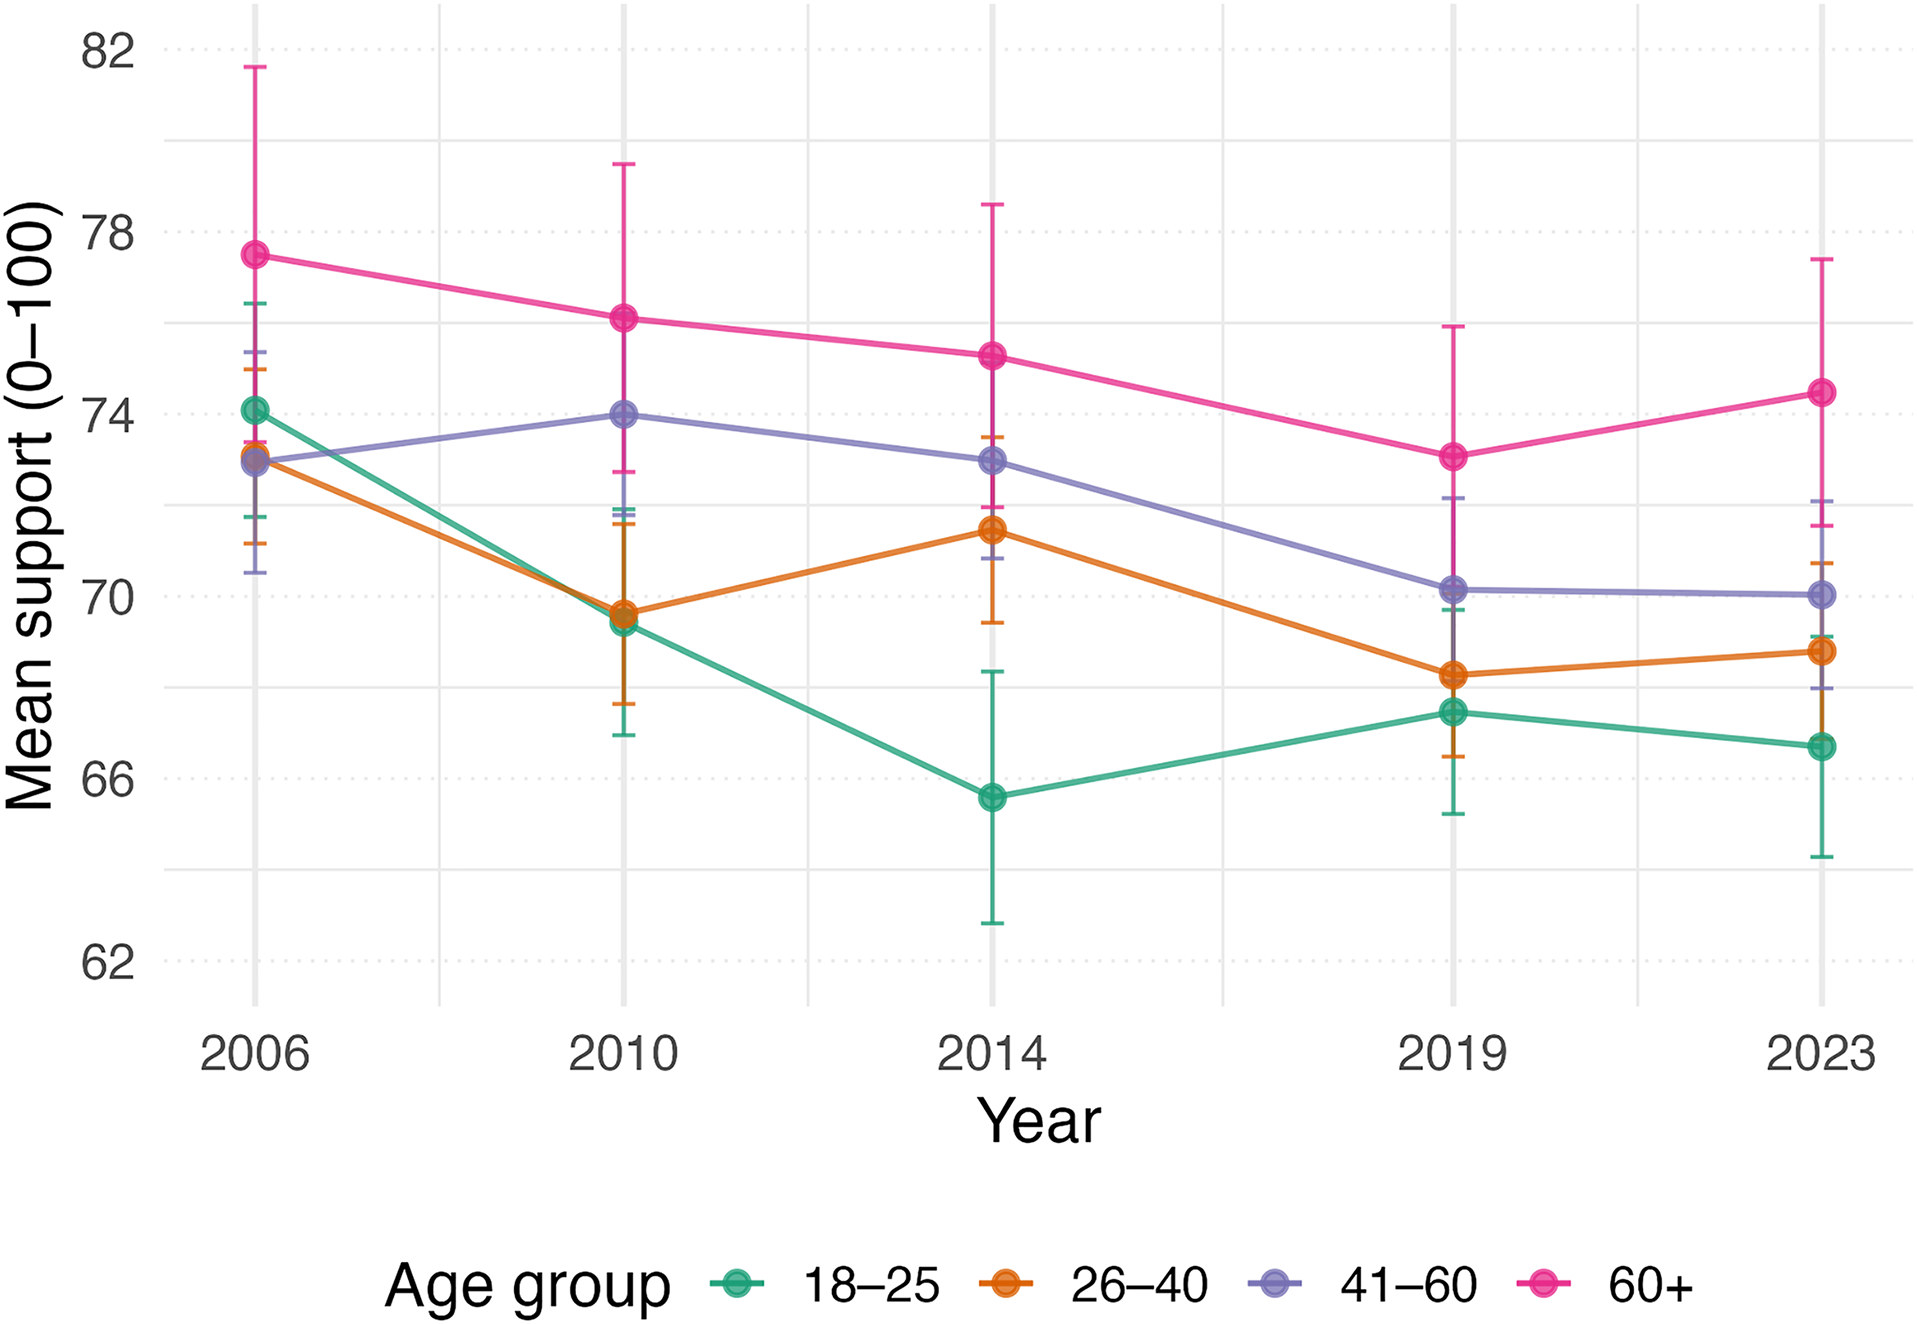
The effects of criminal violence on young people’s life choices and political beliefs remain understudied in Mexico and beyond. Looking at the impact on youths is important for developing policies that foster social and political stability, democratic norms, and social cohesion among the younger generation. As shown in Figure 2, data from AmericasBarometer (LAPOP Lab 2024) indicate a significant decline in democratic support among the youngest citizens. This disparity is also evident in voter turnout rates among younger and older citizens. For example, during the 2021 midterm elections, held just a few weeks prior to our survey, only 41 per cent of eligible voters aged 20–29 cast ballots. In contrast, turnout among voters aged 50–80 exceeded 60 per cent.Footnote 6
Trends in support for democracy in Mexico across age groups, 2006–23.
Note: support for democracy measured on a 0–100 scale using survey-weighted means from five AmericasBarometer waves in Mexico. Vertical bars indicate 95 per cent confidence intervals (CIs). (LAPOP Lab 2024).

This generational disaffection with democracy is not unique to Mexico. Across Latin America, younger citizens generally express lower trust in institutions and weaker commitment to democracy than older generations (Latinobarómetro Study 2023; UNDP 2024). Nonetheless, Mexico represents an extreme case in terms of the violence and insecurity accompanying its democratic era. The intensity of the drug war provides a critical test of the impact of violence on youth attitudes. By focusing on violence in Mexico’s context, we isolate a factor that is plausibly a key driver of youth disaffection.
Empirical Expectations
Individuals raised in communities marked by pervasive violent crime and impunity are likely to develop mistrust towards government, security institutions, and even their own communities. Drawing on research on political socialization, evidence on the political consequences of violence, and accounts of Mexico’s militarized drug war, we hypothesize that childhood exposure to drug-war violence leaves a distinct imprint on political attitudes. However, we argue that not all forms of exposure exert the same influence. We distinguish between three forms of exposure: lethal criminal violence, military presence, and violent military confrontations. Each varies in visibility and in the extent to which responsibility can be attributed to state actors, and we therefore expect these forms of exposure to differentially shape the political trust of Mexican youth.
A growing literature emphasizes that the political consequences of violence depend not only on its intensity but also on its visibility and attribution. As Durán-Martínez (Reference Durán-Martínez2015) notes, criminal organizations often deploy clandestine or concealed violence to regulate illicit markets while minimizing the risk of detection and prosecution. At other times, violence is made deliberately visible and spectacular, executed to challenge state authority, intimidate the public, or signal dominance. Violence also varies in the extent to which responsibility can be clearly assigned – some events are easily attributable to the (in)action of specific actors, while others remain ambiguous. These dimensions shape attitude formation: visible and clearly attributable violence should facilitate more precise belief updating than diffuse or ambiguous events. We use these conceptual distinctions to derive empirical expectations for each of our three exposure measures.
First, lethal criminal violence signals severe insecurity, constitutes the most publicly documented manifestation of drug-war violence – captured most directly through homicide statistics – and reflects a profound failure of public security. Yet despite its severity, such violence often involves unknown perpetrators, contested victim status, and considerable ambiguity regarding responsibility. As a result, exposure to homicidal violence is likely to generate generalized fear and uncertainty rather than precise attribution. We therefore expect childhood exposure to lethal criminal violence to have its strongest corrosive effects on social cohesion and trust in public security institutions. Specifically, we hypothesize that higher levels of exposure to homicidal violence during childhood will erode interpersonal trust, as persistent insecurity encourages withdrawal from community life. We also anticipate declines in trust in the federal police. Given the federal government’s mandate to combat organized crime, responsibility attribution is clearer at the federal level than for subnational police forces.Footnote 7 The distinction between federal and subnational policing offers a strong test of our responsibility attribution mechanism.
Second, we argue that exposure to the state’s militarized response to the drug war has distinct implications for political trust, depending on whether that exposure involves violence. We first consider violent military confrontations, that is, direct armed clashes between military or militarized federal forces and criminal organizations. These events are highly visible, explicitly violent, and readily attributable to state security policy. Rather than signaling protection or order, repeated exposure to such confrontations during childhood may communicate that militarization fails to deliver lasting security and instead brings sustained conflict into civilian spaces. We therefore hypothesize that childhood exposure to violent military confrontations will have particularly strong negative effects on trust in the institutions responsible for the design and implementation of this strategy: the military, the federal government, and the federal police.
In contrast, the mere presence of military operations – the deployment of troops without direct confrontation or visible acts of violence – may have more muted effects. While military presence can reshape daily life as the state attempts to maintain or restore order, it does not necessarily involve overt violence or civilian harm. Given the historically high levels of public confidence in the Mexican military, which have proven resilient even during the drug war (Bailey et al Reference Bailey, Parás and Vargas2013; Flores-Macías and Zarkin Reference Flores-Macías and Zarkin2022), we expect that exposure to military presence alone will not generate the same erosion of institutional trust observed in contexts marked by violent confrontations. Distinguishing between violent and non-violent forms of militarization allows us to assess whether declines in trust are driven by the presence of security forces per se or by their engagement in visible and violent conflict.
Together, these expectations allow us to isolate the distinct effects of different types of exposure and test mechanisms through which violence affects trust. By contrasting ambiguous criminal violence with violence involving state security forces, and by distinguishing violent from non-violent forms of military involvement, we provide a framework for understanding how early exposure to violence shapes trust in communities and political institutions later in life.
Empirical Approach
Survey and Data
Our goal is to examine how childhood exposure to lethal criminal violence and drug-war military interventions shapes individuals’ trust in political institutions and their communities later in life. To investigate this, we leverage three primary data sources: (1) an original survey fielded in Mexico among youths; (2) official municipal-level data on homicide rates over the past few decades; and (3) official records detailing the frequency of military confrontations and operations in each municipality.Footnote 8
In partnership with Buendía & Márquez, a leading survey firm based in Mexico City, and a team of local enumerators, we conducted an in-person survey of 2,880 young individuals aged 16 to 29 in June 2021. The sample is representative of urban Mexico for our target age group. Ethical considerations were a central concern in the design of our survey. All participation was informed, voluntary, and confidential. Since our study did not include people under 16 years of age, parental consent was not required. The research presented no more than minimal risk to subjects, researchers, and enumerators, with the only potential concern being possible discomfort when responding to certain questions. Participants were informed of this risk and the consent process emphasized their right to withdraw from the study at any time. See Appendix 1 for a description of our participant recruitment process and our adherence to principles of ethical human subjects research.
We focus on urban Mexico for two reasons. First, the forms of violence experienced in urban versus rural areas of Mexico are different in nature. Rural areas are more likely to experience violence associated with illicit crop production, land disputes, or the extortion of agricultural workers in a context of limited state presence (Dube et al Reference Dube, García-Ponce and Thom2016; Herrera and Martinez-Alvarez Reference Herrera and Martinez-Alvarez2022), which is why the socio-demographic profiles of victims and perpetrators tend to be different than in urban areas (Muñiz-Sánchez et al Reference Muñiz-Sánchez, Fuerte-Celis and Méndez-Ramírez2022; Villarreal Reference Villarreal2004). Second, 80 per cent of Mexico’s population resides in urban areas. A similar percentage of homicides and violent crime take place in metropolitan areas, where youths are at a disproportionately high risk of becoming targets of organized criminal violence. Therefore, while rural violence is prevalent in many communities of Mexico, we believe it is conceptually distinct.
Our survey was representative of common socio-demographic characteristics, such as income and education level. In addition, we employed a unique strategy to ensure representativeness of the various levels of municipal violence across the country. Within this strategy, we considered three variables that capture variations in violence at this geographic level: homicide rates, reported non-homicidal crime, and perceived levels of violence. Although homicide rates are commonly used as a benchmark for the prevalence of violence, we incorporate additional measures because homicide alone does not capture the full extent of citizen insecurity.
These measures are typically not available at the subnational level, particularly at units as small as the municipality. To circumvent this issue, we rely upon measures available at the national and city level from Mexico’s National Survey of Urban Public Security (ENSU) and use multilevel regression and post-stratification (MrP) to generate subnational measures (Gelman and Little Reference Gelman and Little1997). We model respondents’ perceptions of violence and reported victimization as a function of selected socio-demographic characteristics (that is, location, age, gender, occupation, education) and generate municipal-level estimates with such models via post-stratification using Mexico’s 2015 intercensus. We thus create 157 municipal estimates of both reported victimization and perceived insecurity. We utilize these estimates and the most recently reported homicide rates collected by the Executive Secretariat of the National System of Public Security (SESNSP) to stratify our survey sample.Footnote 9 We limit our sampling frame to municipalities surveyed by ENSU, and order these units based on the three levels of insecurity via seriation.
Our outcome variables were measured by asking respondents to rate their level of trust on a 1–7 scale, with 1 indicating no trust and 7 indicating a great deal of trust. Respondents completed this exercise for the following groups: their community (neighbors), the police (municipal, state, federal), the military (army and navy), and the government (federal, state, local).Footnote 10 We standardize these variables and center them at 0, allowing us to interpret results in terms of standard deviations from the mean.
To measure exposure to lethal criminal violence and the military strategy of the drug war, we match respondents with administrative data regarding these factors at the municipal level. To do so, respondents were asked where they were born and raised (either the municipality where they currently reside, or elsewhere). This is uncommon in current public opinion surveys in the area and allows us to measure exposure to violence and militarization in one’s childhood hometown.Footnote 11 We then rely on these municipal identifiers to calculate their exposure to both violence and militarization.
First, to measure childhood exposure to lethal criminal violence, we draw on annual municipal homicide counts from Mexico’s National Institute of Statistics and Geography (INEGI) and population estimates from the National Population Council (CONAPO). For each respondent, we calculate the average homicide rate experienced during the first ten years of life, based on their birth year and the municipality where they spent the majority of their childhood. Intentional homicides constitute the most complete and reliable proxy for lethal criminal violence over our study period, as death certificates are processed through medical and forensic systems and coded by both medical personnel and the Attorney General’s Office.Footnote 12 Furthermore, most of the dramatic increases in homicidal violence during the drug-war period stem from inter- and intra-OCG conflict (Calderón et al Reference Calderón, Robles, Díaz-Cayeros and Magaloni2015).Footnote 13
Second, to capture exposure to drug-war military interventions, we calculate the average level of exposure to military confrontations and operations across individuals’ first ten years of life. Data for these measures were collected via right-to-information requests filed to the Mexican government by Flores-Macías and Zarkin (Reference Flores-Macías and Zarkin2022, Reference Flores-Macías and Zarkin2024).Footnote 14 To capture military confrontations we utilize municipal-level data regarding the military’s confrontations with criminal groups (enfrentamientos). This is a count variable, indicating the number of confrontations each year between SEDENA and suspected criminals across all municipalities.Footnote 15 To measure military presence, we draw on data regarding operations, which indicate if the military (specifically the army, or SEDENA) was deployed to a municipality to participate in law enforcement operations. Functions included patrols, checkpoints, and detentions. This is a binary variable, indicating if at least one of these functions was present or not.
These two measures of militarization are complementary and allow for a nuanced assessment of military strategy and policing at the municipal level. Confrontations, our first measure, allow us to explore if drug-war interventions that explicitly involved violence and conflict have long-term effects on attitudes. Operations (our second measure) allow us to explore whether or not exposure to deployment – without necessitating violent conflict – has such effects.
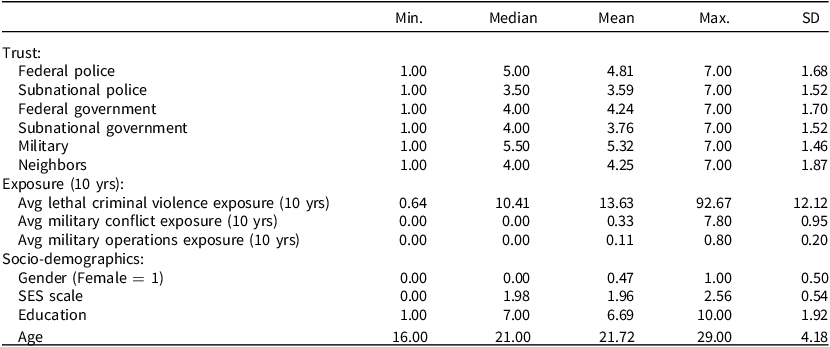
Our survey also collected socio-demographic information which we use as controls. These variables are respondent gender, level of education, and socio-economic status (SES). To create our SES index, we rely on a battery of questions regarding individuals’ possession of a series of assets and use principal component analysis (PCA) to create a single variable (Appendix 4). Descriptive statistics are presented in Table 1.
Descriptive statistics of key variables

Table 1. Long description
A table presenting descriptive statistics of key variables. The table has 14 rows and 6 columns. The columns are labeled Min., Median, Mean, Max., and SD. The rows are categorized under Trust, Exposure (10 yrs), and Socio-demographics. Under Trust, the rows include Federal police, Subnational police, Federal government, Subnational government, Military, and Neighbors. Under Exposure (10 yrs), the rows include Avg lethal criminal violence exposure (10 yrs), Avg military conflict exposure (10 yrs), and Avg military operations exposure (10 yrs). Under Socio-demographics, the rows include Gender (Female = 1), SES scale, Education, and Age. Row 1: Federal police, Min. 1.00, Median 5.00, Mean 4.81, Max. 7.00, SD 1.68. Row 2: Subnational police, Min. 1.00, Median 3.50, Mean 3.59, Max. 7.00, SD 1.52. Row 3: Federal government, Min. 1.00, Median 4.00, Mean 4.24, Max. 7.00, SD 1.70. Row 4: Subnational government, Min. 1.00, Median 4.00, Mean 3.76, Max. 7.00, SD 1.52. Row 5: Military, Min. 1.00, Median 5.50, Mean 5.32, Max. 7.00, SD 1.46. Row 6: Neighbors, Min. 1.00, Median 4.00, Mean 4.25, Max. 7.00, SD 1.87. Row 7: Avg lethal criminal violence exposure (10 yrs), Min. 0.64, Median 10.41, Mean 13.63, Max. 92.67, SD 12.12. Row 8: Avg military conflict exposure (10 yrs), Min. 0.00, Median 0.00, Mean 0.33, Max. 7.80, SD 0.95. Row 9: Avg military operations exposure (10 yrs), Min. 0.00, Median 0.00, Mean 0.11, Max. 0.80, SD 0.20. Row 10: Gender (Female = 1), Min. 0.00, Median 0.00, Mean 0.47, Max. 1.00, SD 0.50. Row 11: SES scale, Min. 0.00, Median 1.98, Mean 1.96, Max. 2.56, SD 0.54. Row 12: Education, Min. 1.00, Median 7.00, Mean 6.69, Max. 10.00, SD 1.92. Row 13: Age, Min. 16.00, Median 21.00, Mean 21.72, Max. 29.00, SD 4.18.
Note: sample size is 2,425 respondents. Individuals who spent their childhood in a municipality different from their current place of residence are excluded.
Methods
We employ two complementary identification strategies to test if childhood exposure to lethal criminal violence, military confrontations, or military operations affects trust later in life. The first exploits variation in childhood exposure to our independent variables based on year of birth and geographic location. The second strategy leverages the sudden, large-scale troop deployments that began in 2007 as a quasi-experimental shock, enabling us to isolate the causal effects of exposure to both military confrontations and operations.
Exposure defined by birth year and childhood municipality
Following recent work on the long-run consequences of early-life violence (for example, Gutiérrez-Romero Reference Gutiérrez-Romero2024; Justino et al Reference Justino, Leone and Salardi2014; Leon Reference Leon2012), we exploit exogenous differences in childhood exposure to lethal criminal violence, military confrontations, and military operations that arise from respondents’ year of birth and geographic location during their first ten years of life. The resulting variation allows us to compare individuals who, during their formative years, experienced higher or lower levels of criminal violence and military interventions, even though they share either a common birthplace or a common birth year.
Formally, we estimate the following reduced-form specification via OLS:
 $$y_{ijt} = \beta _{1}\,V_{jt} + {\bf X}_{i}^{\prime }{\boldsymbol\beta }_{\rm 2} + \alpha _{j} + \phi _{t} + \varepsilon _{ijt},$$
where y ijt denotes the trust outcome for individual i born in year t in municipality j. Our parameter of interest, β 1, captures the effect of childhood violence exposure, measured by
 $${V_{jt}}\; = \;{1 \over {11}}\sum\limits_{a = 0}^{10} {{\rm{Violenc}}{{\rm{e}}_{j,t + a}}}$$
the average annual intensity of (1) lethal criminal violence, (2) military confrontations, or (3) military operations in municipality j from the respondent’s birth year t through age ten. The vector
 ${\bf X}_{i}$
includes individual covariates – gender, socio-economic status, and education level – that might correlate with both exposure and trust. Municipality fixed effects (α
j
) absorb all time-invariant local characteristics, while birth-year fixed effects (φ
t
) purge nationwide shocks common to each cohort. Identification therefore hinges on within-municipality, across-cohort deviations in violence intensity and on cross-municipality differences experienced by the same cohort. Robust standard errors account for any remaining correlation in unobserved shocks, ϵ
ijt
.
Quasi-experimental design based on military interventions
The nature of the dramatic shock of military deployments across the country in 2007 allows us to leverage a quasi-experimental design for both exposure to confrontations and operations. This strategy is in line with previous research leveraging this shock (Brown et al Reference Brown, Montalva, Thomas and Velásquez2019; Flores-Macías and Zarkin Reference Flores-Macías and Zarkin2024; Flores-Macías Reference Flores-Macías2018; Trejo and Skigin, Reference Trejo and Skigin2026), and supplements our previous analysis. We can only do so for military-related variables as deployment of the military in drug-war operations was rare prior to 2007, while lethal criminal violence was present in the country across all years.Footnote 16 Our empirical strategy compares individuals born in the same municipality but in different periods, and individuals born in the same period but in different municipalities, during the drug war’s early years. This design allows us to calculate a debiased estimator which accounts for confounding factors both at the municipal and cohort levels. By comparing across these groups, we incorporate not only a group exposed to the treatment alongside potential confounders, but also a group exposed to those confounders in the absence of the treatment.
To employ this strategy, we define treated individuals and a range of treatment years. As municipalities have gone in and out of treatment over time (varying levels of military presence), and respondents have continuously aged throughout this period, we approach this by conservatively defining a range of years in which the military was domestically active, along with a cohort of individuals who were aged ten or younger throughout that period. Based on our data, this approach results in examining the years 2007–11. This period not only represents the height of the drug-war’s military interventions but aligns precisely with a cohort we can identify in our data – those born between 2001 and 2005, all of whom were aged ten or younger during these years. Defining treatment in this way is the most conservative approach. In Table 2 we show that exposure to both military confrontations and operations is balanced across those who were both eligible (born 2001–05) and ineligible for treatment. Further, in Appendix 15, we also less conservatively define the cohort eligible to be treated.
Balance in exposure to military interventions across cohorts

Table 2. Long description
A table comparing mean confrontations and mean operations across two cohorts. The table has two rows and three columns. The columns are labeled ‘Mean confrontations’ and ‘Mean operations’. The rows are labeled ‘Cohort: Eligible’ and ‘Cohort: Ineligible’. For the ‘Cohort: Eligible’ row, the mean confrontations value is 1.33 and the mean operations value is 0.35. For the ‘Cohort: Ineligible’ row, the mean confrontations value is 1.39 and the mean operations value is 0.36.
Note: calculated as the average level of confrontations or operations (binary variable) for each group. Those eligible for treatment are those born between 2001 and 2005 in our sample.
With this in mind, we utilize standard OLS models with the following equation:
 $${\displaystyle y_{ij}= \beta _{1}M_{{j}[i]} + \beta _{2}D_{i} + \beta _{3}M_{j[i]}D_{i} +{\bf X}_{i}^{\prime }{\boldsymbol\beta }_{4} + \alpha _{j} + \epsilon _{i}}$$
Here, y ij is the outcome variable observed for respondent i in municipality j. M j[i] represents either the average military confrontations or operations between 2007 and 2011 for each municipality j of residence, for each respondent i. D i is a binary indicator which is 1 if respondent i was born between 2001 and 2005, and 0 otherwise. The parameter of interest is β 3, which captures the effect of the interaction between M j[i] and D i . In the X i vector of controls, we also include the age of the respondents to account for the differing effects within each cohort (eligible or ineligible for exposure). We retain municipality-level fixed effects (α j ) as in Equation (1), which absorb the main effect of Mj[i] . We do not include birth-year fixed effects in this model as we include terms for both cohort and age (continuously operationalized).
Results
Exposure to Lethal Criminal Violence
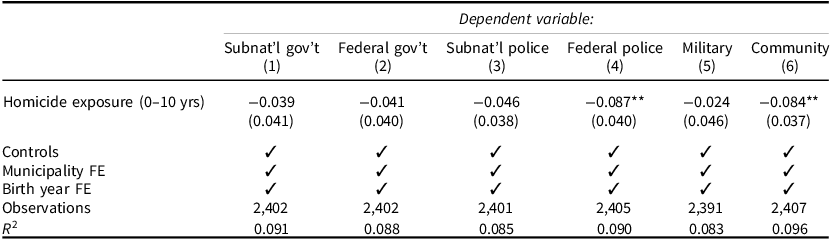
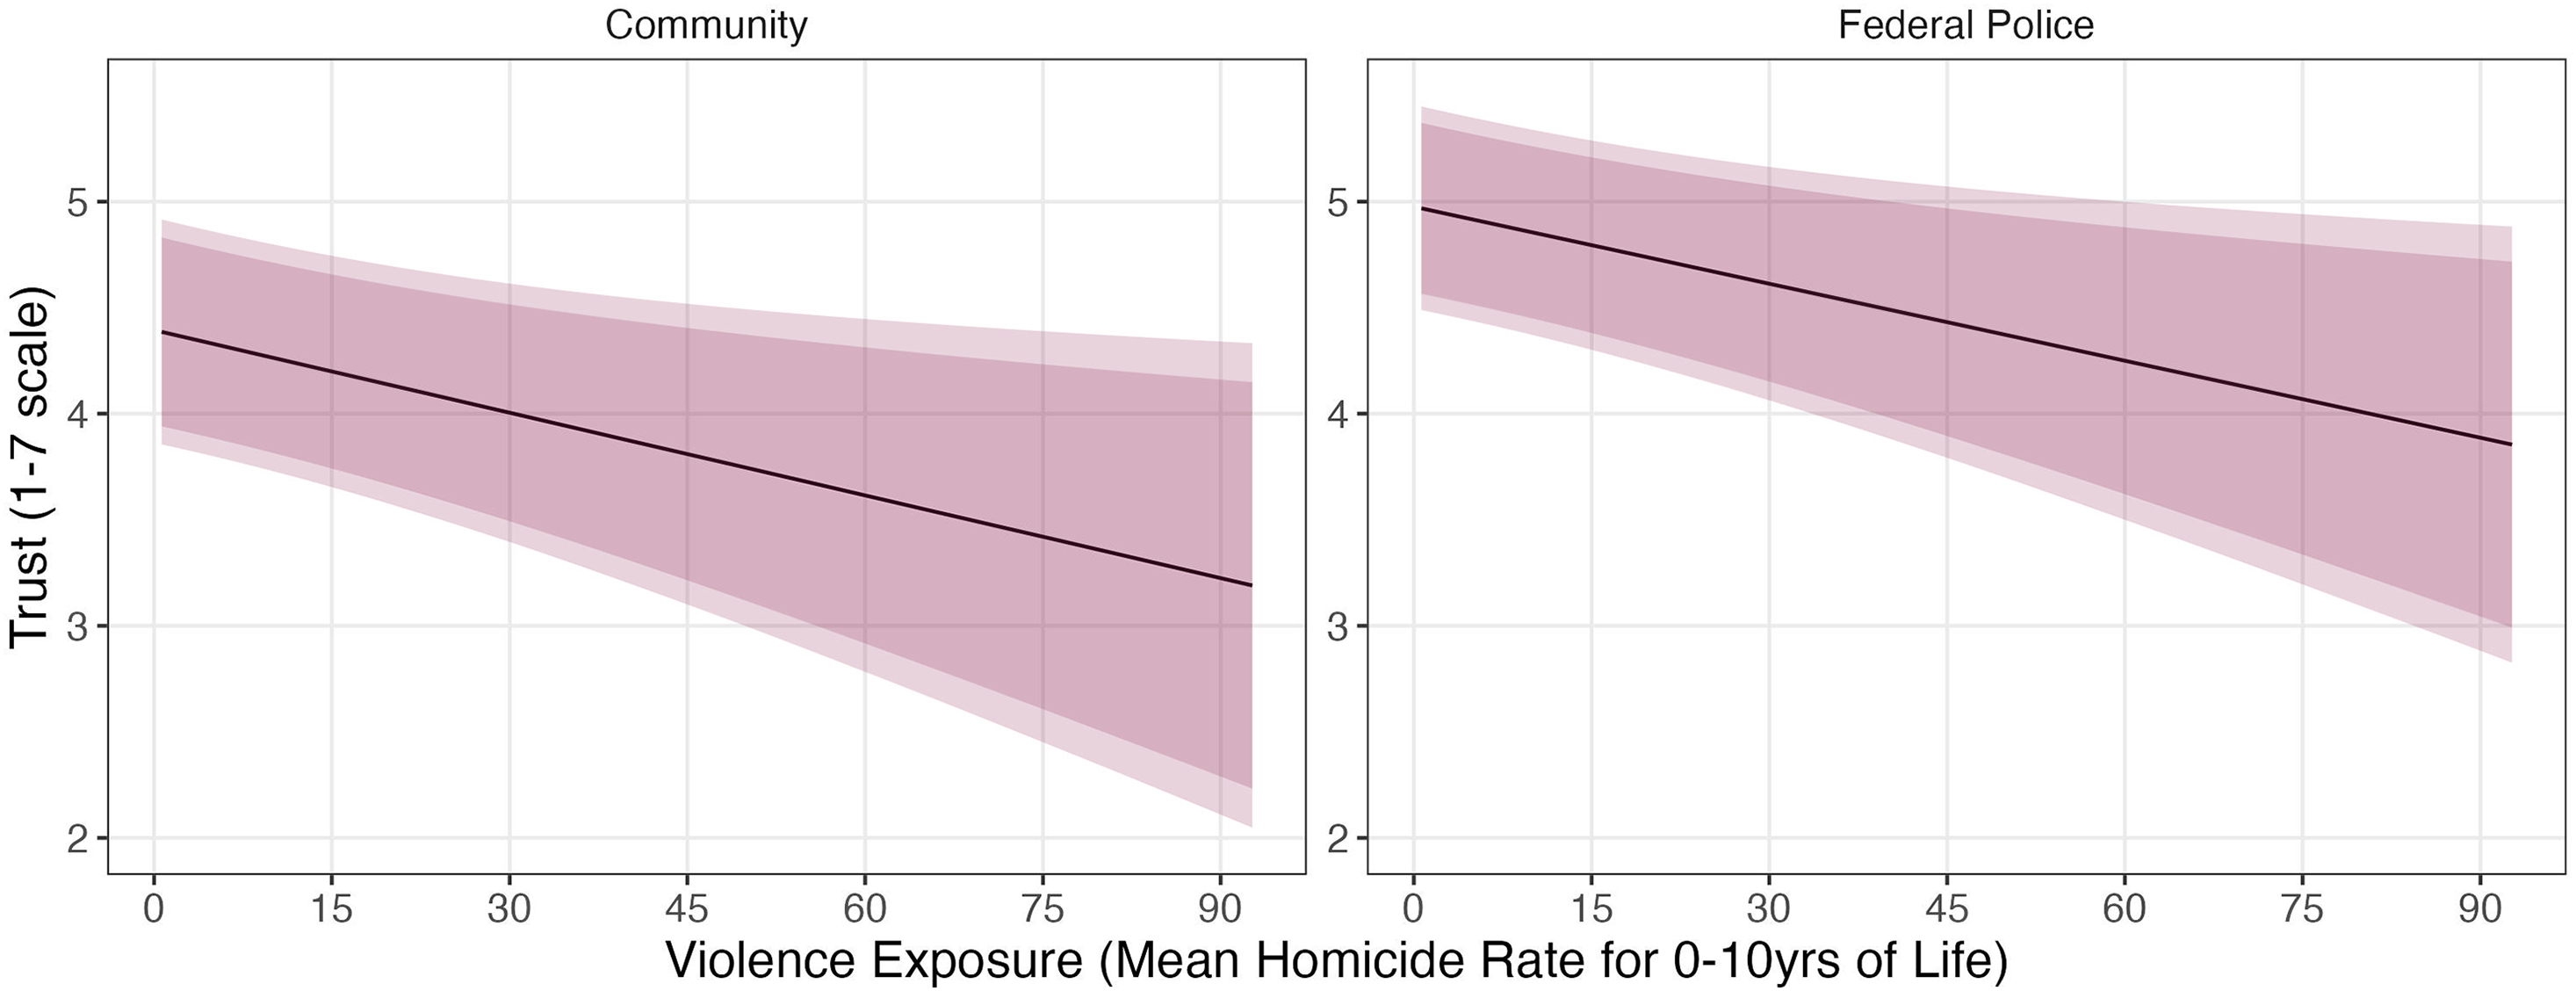
Increased exposure to lethal criminal violence during early childhood results in a statistically significant decline in trust in the federal police and one’s community later in life (Figure 3). Negative relationships are present for all actors explored, although others are not significant (Table 3). The magnitude of statistically significant results is also notable. To contextualize our findings, consider two individuals: one who spent their first ten years of life in a municipality with an average homicide rate of 40 per 100,000 residents – approximately two standard deviations above the mean – and another who experienced minimal homicidal violence (fewer than 1 per 100,000). According to our estimates, the former would express 10 per cent less trust in the federal police compared to the latter. These results support our expectations that exposure to criminal violence early in life should erode trust not only in law enforcement, but also in one’s community more broadly. In Appendix 9, we demonstrate that this result is driven by the socio-economically well-off, which comports with literature showing that the rich are especially sensitive to crime shocks (Clément and Piaser Reference Clément and Piaser2021; Rueda and Stegmueller Reference Rueda and Stegmueller2016).
Exposure to homicide and trust

Table 3. Long description
A table titled ‘AQ36’ with six columns and six rows, focusing on the impact of homicide exposure on trust in various institutions. The columns are labeled ‘Subnat’l gov’t’, ‘Federal gov’t’, ‘Subnat’l police’, ‘Federal police’, ‘Military’, and ‘Community’. The row labels include ‘Homicide exposure (0-10 yrs)’, ‘Controls’, ‘Municipality FE’, ‘Birth year FE’, ‘Observations’, and ‘R-squared’. The values for ‘Homicide exposure (0-10 yrs)’ are -0.039 (0.041) for Subnat’l gov’t, -0.041 (0.040) for Federal gov’t, -0.046 (0.038) for Subnat’l police, -0.087** (0.040) for Federal police, -0.024 (0.046) for Military, and -0.084** (0.037) for Community. The ‘Controls’, ‘Municipality FE’, and ‘Birth year FE’ rows all have checkmarks indicating their inclusion. The ‘Observations’ row shows values ranging from 2,391 to 2,405. The ‘R-squared’ row shows values ranging from 0.083 to 0.091.
Note: *p < 0.1; **p < 0.05; ***p < 0.01.
Exposure to homicide and decreased trust.
Note: predicted values from OLS models. Results correspond to models 4 and 6 in Table 3. Models used to generate predictions do not use standardized dependent or independent variables. Shaded regions represent 90 per cent (dark) and 95 per cent (light) CIs.

Exposure to Military Interventions
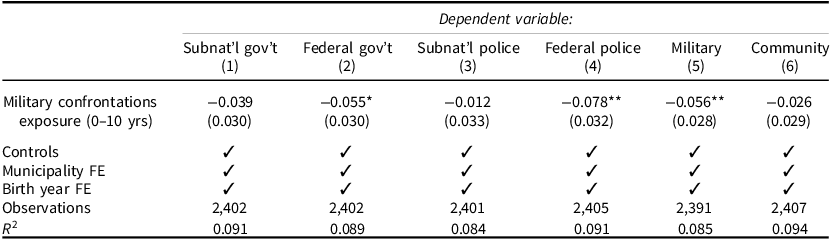
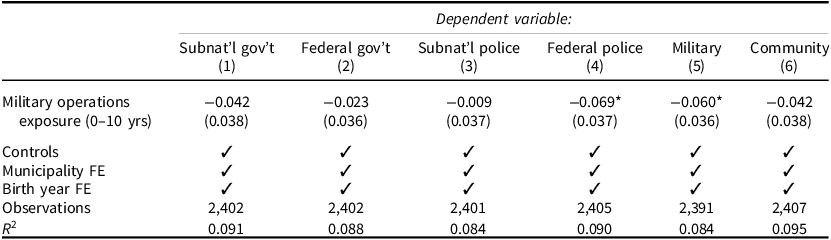
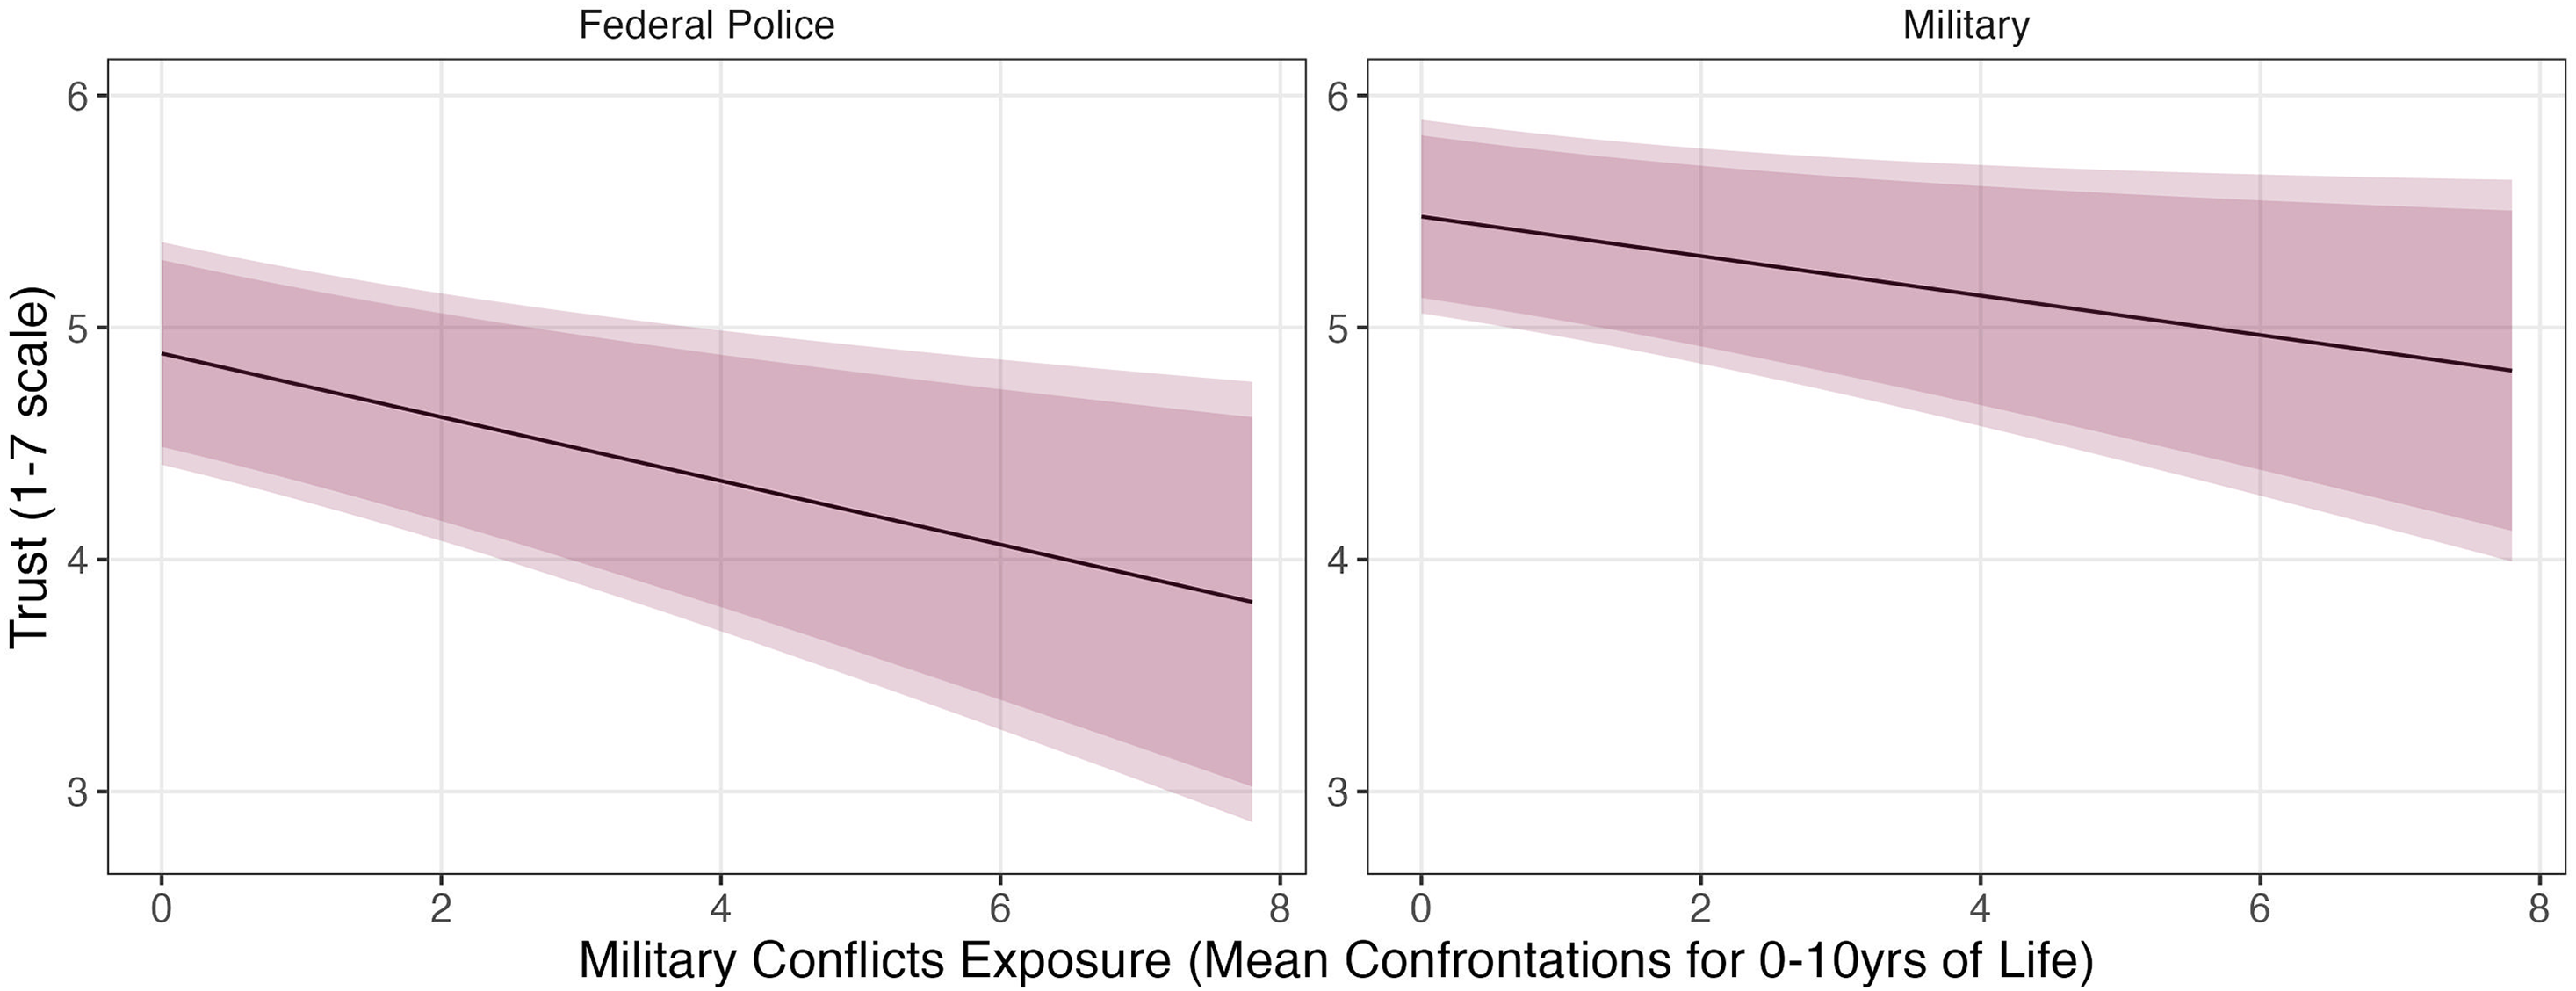
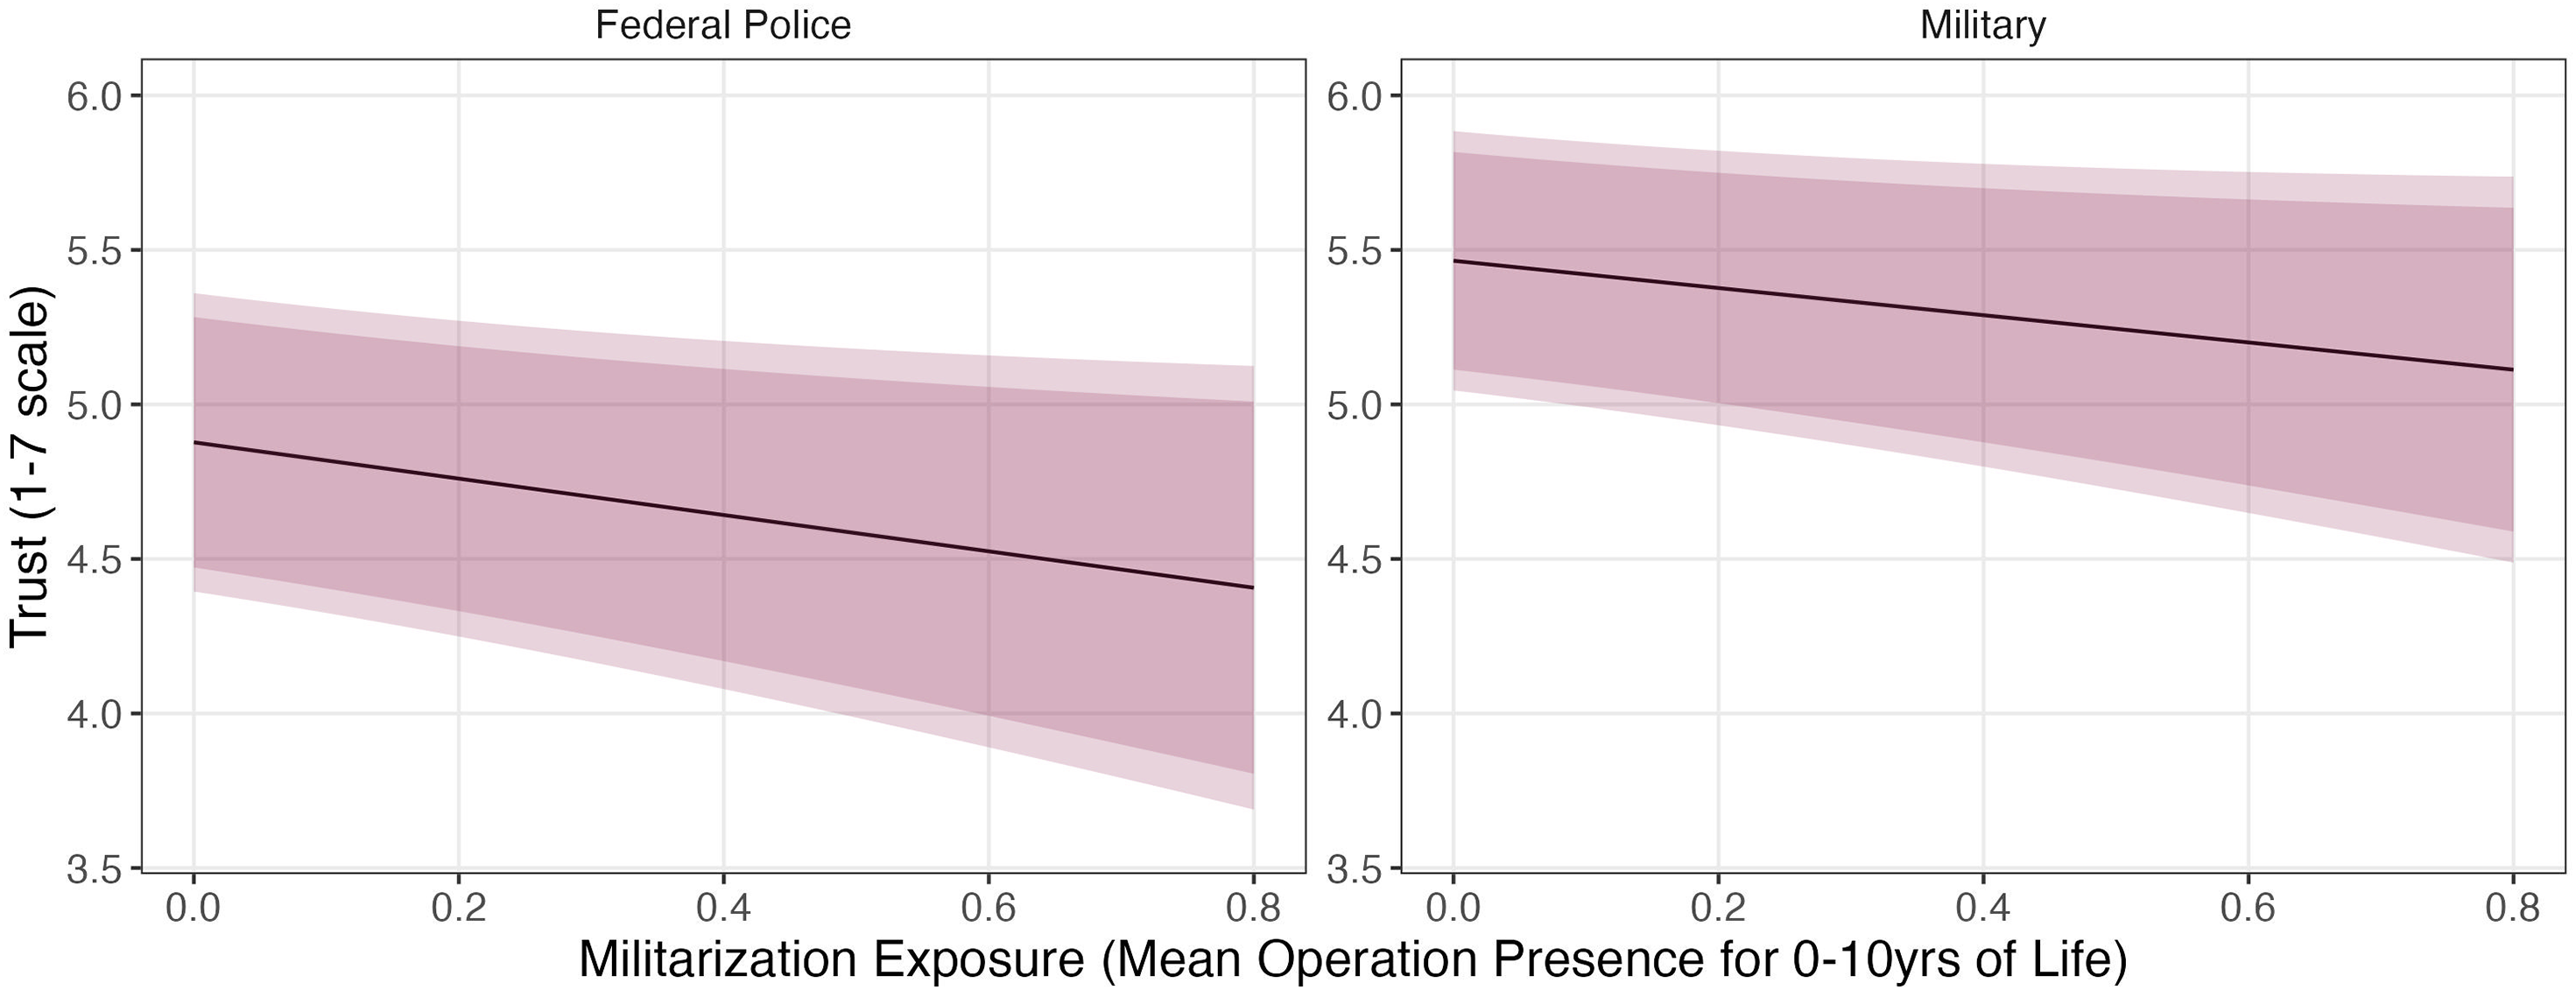
Tables 4 and 5 report observational estimates of the effect of exposure to military confrontations and operations on trust (Equation (1)). As shown in Figures 4 and 5, greater childhood exposure to military confrontations and operations is associated with lower levels of trust in the federal police and the military later in life. Negative relationships with all other variables explored are also present, although only trust in the federal government reaches a conventional level of significance in the case of confrontations (Table 4, p < 0.1). The stronger effects restricted to the federal police and military support our theory, suggesting a pattern of actor-specific blame attribution. Results in Appendix 9 demonstrate that the negative relationship between exposure to confrontations and trust is driven by those from lower socio-economic strata and with lower levels of educational attainment. This is supported by research showing that marginalized groups – particularly youths – are most vulnerable to state–criminal conflict, both in terms of their increased exposure to repressive state security practices (Ryngelblum and Peres Reference Ryngelblum and Peres2021) and their higher likelihood of OCG recruitment and victimization (Juárez et al Reference Juárez, Urdal and Vadlamannati2022).
Exposure to military confrontations and trust

Table 4. Long description
A table titled AQ33 presents the impact of military confrontations exposure on trust in various institutions. The table has 6 columns and 6 rows, including the header row. The columns are labeled as follows: Subnat’l gov’t, Federal gov’t, Subnat’l police, Federal police, Military, and Community. The row labels include Military confrontations exposure (0-10 yrs), Controls, Municipality FE, Birth year FE, Observations, and R-squared. The values in the table are as follows: Row 1: Military confrontations exposure (0-10 yrs): Subnat’l gov’t: -0.039 (0.030), Federal gov’t: -0.055* (0.030), Subnat’l police: -0.012 (0.033), Federal police: -0.078** (0.032), Military: -0.056** (0.028), Community: -0.026 (0.029). Row 2: Controls: Subnat’l gov’t: ✓, Federal gov’t: ✓, Subnat’l police: ✓, Federal police: ✓, Military: ✓, Community: ✓. Row 3: Municipality FE: Subnat’l gov’t: ✓, Federal gov’t: ✓, Subnat’l police: ✓, Federal police: ✓, Military: ✓, Community: ✓. Row 4: Birth year FE: Subnat’l gov’t: ✓, Federal gov’t: ✓, Subnat’l police: ✓, Federal police: ✓, Military: ✓, Community: ✓. Row 5: Observations: Subnat’l gov’t: 2,402, Federal gov’t: 2,402, Subnat’l police: 2,401, Federal police: 2,405, Military: 2,391, Community: 2,407. Row 6: R-squared: Subnat’l gov’t: 0.091, Federal gov’t: 0.089, Subnat’l police: 0.084, Federal police: 0.091, Military: 0.085, Community: 0.094. The table shows the impact of military confrontations exposure on trust in various institutions, with significant negative impacts on trust in the federal police and military.
Note: *p < 0.1; **p < 0.05; ***p < 0.01.
Exposure to military operations and trust

Table 5. Long description
The table presents observational estimates of the effect of exposure to military confrontations and operations on trust in different institutions. It includes six columns: Subnat’l gov’t, Federal gov’t, Subnat’l police, Federal police, Military, and Community. Each column shows the impact of military operations exposure over 0-10 years on trust in these institutions. The table has controls for Municipality FE and Birth year FE. The number of observations ranges from 2,391 to 2,407, and the R-squared values range from 0.084 to 0.095. Row 1: Military operations exposure (0-10 yrs), -0.042 (0.038), -0.023 (0.036), -0.009 (0.037), -0.069* (0.037), -0.060* (0.036), -0.042 (0.038). Row 2: Controls, Municipality FE, Birth year FE, Municipality FE, Birth year FE, Municipality FE, Birth year FE, Municipality FE, Birth year FE. Row 3: Observations, 2,402, 2,402, 2,401, 2,405, 2,391, 2,407. Row 4: R-squared, 0.091, 0.088, 0.084, 0.090, 0.084, 0.095.
Note: *p < 0.1; **p < 0.05; ***p < 0.01.
Exposure to military confrontations and decreased trust.
Note: predicted values from OLS models. Results correspond to models 4 and 5 in Table 4. Models used to generate predictions do not use standardized dependent or independent variables. Shaded regions represent 90 per cent (dark) and 95 per cent (light) CIs.

Exposure to military operations and decreased trust.
Note: predicted values from OLS models. Results correspond to models 4 and 5 in Table 5. Models used to generate predictions do not use standardized dependent or independent variables. Shaded regions represent 90 per cent (dark) and 95 per cent (light) CIs.

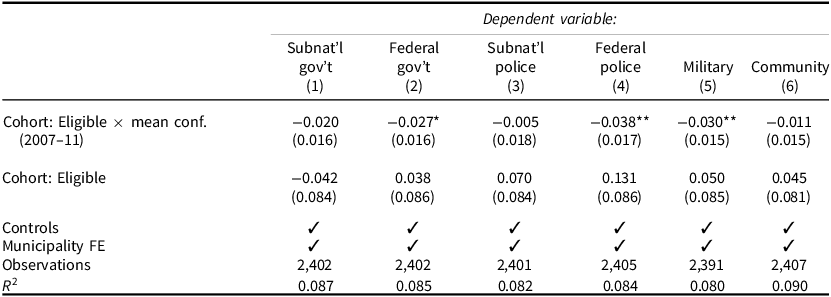
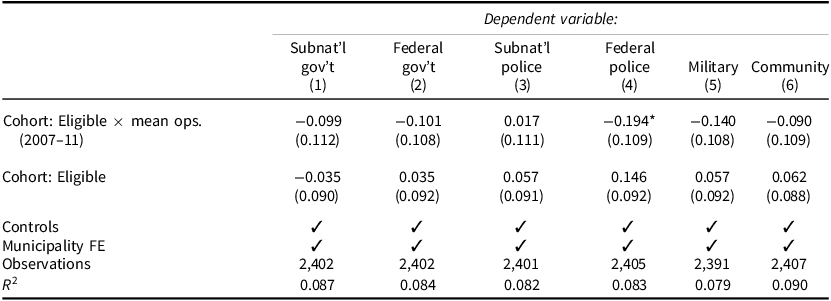
Results in Tables 6 and 7 correspond to our quasi-experimental assessment, leveraging the exogenous shock of military deployments beginning in late 2006/early 2007 (Equation (2)). This strategy is a more stringent and conservative estimation of this effect, utilizing our debiased estimator. Estimates indicate that exposure to military confrontations during one’s formative years is associated with marked declines in trust in the federal government, federal police, and military. Exposure to military operations – which does not necessarily entail conflict – results in consistent negative effects, but these are only statistically significant for federal police.Footnote 17 In Appendix 12, we provide additional support for this point, isolating the impact of confrontations holding constant exposure to operations. We demonstrate that exposure to violent confrontations has an additional impact on trust, particularly in the federal police and military.
Military confrontations and cohort eligibility

Table 6. Long description
The table presents data on the impact of military confrontations on trust in various institutions, focusing on different cohorts and variables. It includes six columns and five rows of data, along with controls and observations. The columns are labeled as follows: Subnat’l gov’t, Federal gov’t, Subnat’l police, Federal police, Military, and Community. The rows are labeled as follows: Cohort: Eligible × mean conf. (2007-11), Mean conf. (2007-11), Cohort: Eligible, Controls, Municipality FE, Observations, and R^2. Each cell contains numerical values representing the data for each category. The table shows the mean confidence levels and the impact of eligibility on trust in different institutions. Notable trends include negative values for trust in federal government, federal police, and military, indicating a decline in trust associated with exposure to military confrontations during formative years. The data suggests consistent negative effects on trust in federal police, with statistical significance noted in some categories.
Note: *p < 0.1; **p < 0.05; ***p < 0.01.
Military operations and cohort eligibility

Table 7. Long description
A table with six columns and five rows, including a header row. The columns are labeled ‘Subnat’l gov’t’, ‘Federal gov’t’, ‘Subnat’l police’, ‘Federal police’, ‘Military’, and ‘Community’. The rows are labeled ‘Cohort: Eligible × mean ops (2007-11)’, ‘Mean ops (2007-11)’, ‘Cohort: Eligible’, and ‘Controls’. The table presents numerical values for each column and row intersection, indicating the impact of military operations on trust in various institutions. Notable values include -0.194 for ‘Federal police’ under ‘Cohort: Eligible × mean ops (2007-11)’, and 0.405 for ‘Military’ under ‘Mean ops (2007-11)’. The table also includes footnotes indicating significance levels and controls used in the analysis.
Note: *p < 0.1; **p < 0.05; ***p < 0.01.
Consistent with our expectations, we find strong and method-consistent evidence that exposure to military confrontations results in the long-term erosion of trust in the military and federal police. By contrast, the negative effect associated with military operations is more method-sensitive and only significant at the p < 0.1 level. This suggests that exposure to military presence alone during childhood may not have a prominent effect; instead, violence associated with military confrontations may be necessary to strongly depress trust later in life.
Further, we proposed that trust in the federal government should also suffer from exposure to, at minimum, military confrontations. While the effect is negative, it is only significant in two instances at the p < 0.1 level (Tables 4 and 6). To probe this tenuous result, in the subsequent section we evaluate if opinions of the federal government are specifically targeted at officials who are co-partisans of those most responsible for drug-war-era violence – namely, the PRI and PAN.
Effects on Vote Choice
Results in the previous section suggest that exposure to militarized violence may lead citizens to form more targeted political assessments, rather than broadly eroding trust in government. To further evaluate this, we examine whether individuals exposed to local military engagements during childhood are more likely to penalize politicians affiliated with the parties of the presidents who authorized troop deployments in their communities – Calderón’s PAN and Peña Nieto’s PRI.Footnote 18 Voters exposed to violence during childhood and to the continued failure of this strategy under successive governments may have developed generalized skepticism towards both parties, consistent with theories of political socialization that emphasize early-life experiences.
Accordingly, we examine the reported vote choice of voting-aged respondents in our sample (n = 1,898), assessing how exposure to lethal criminal violence, military–criminal confrontations, and military operations during the first decade of life shapes support for PAN and PRI candidates in the 2021 legislative election. In these midterm elections, a vote for the PAN or PRI primarily reflected support for each party’s national brand rather than for individual legislative candidates.Footnote 19 Because both parties governed during respondents’ childhood years, voters who link those periods to militarization and drug-war violence may penalize both parties across levels of office. Conducted one week after the June 2021 legislative election, our survey allows us to measure recent vote choice with minimal recall error while maximizing the eligible electorate in our sample, as all respondents aged 18 or older by mid-2021 were eligible to vote.
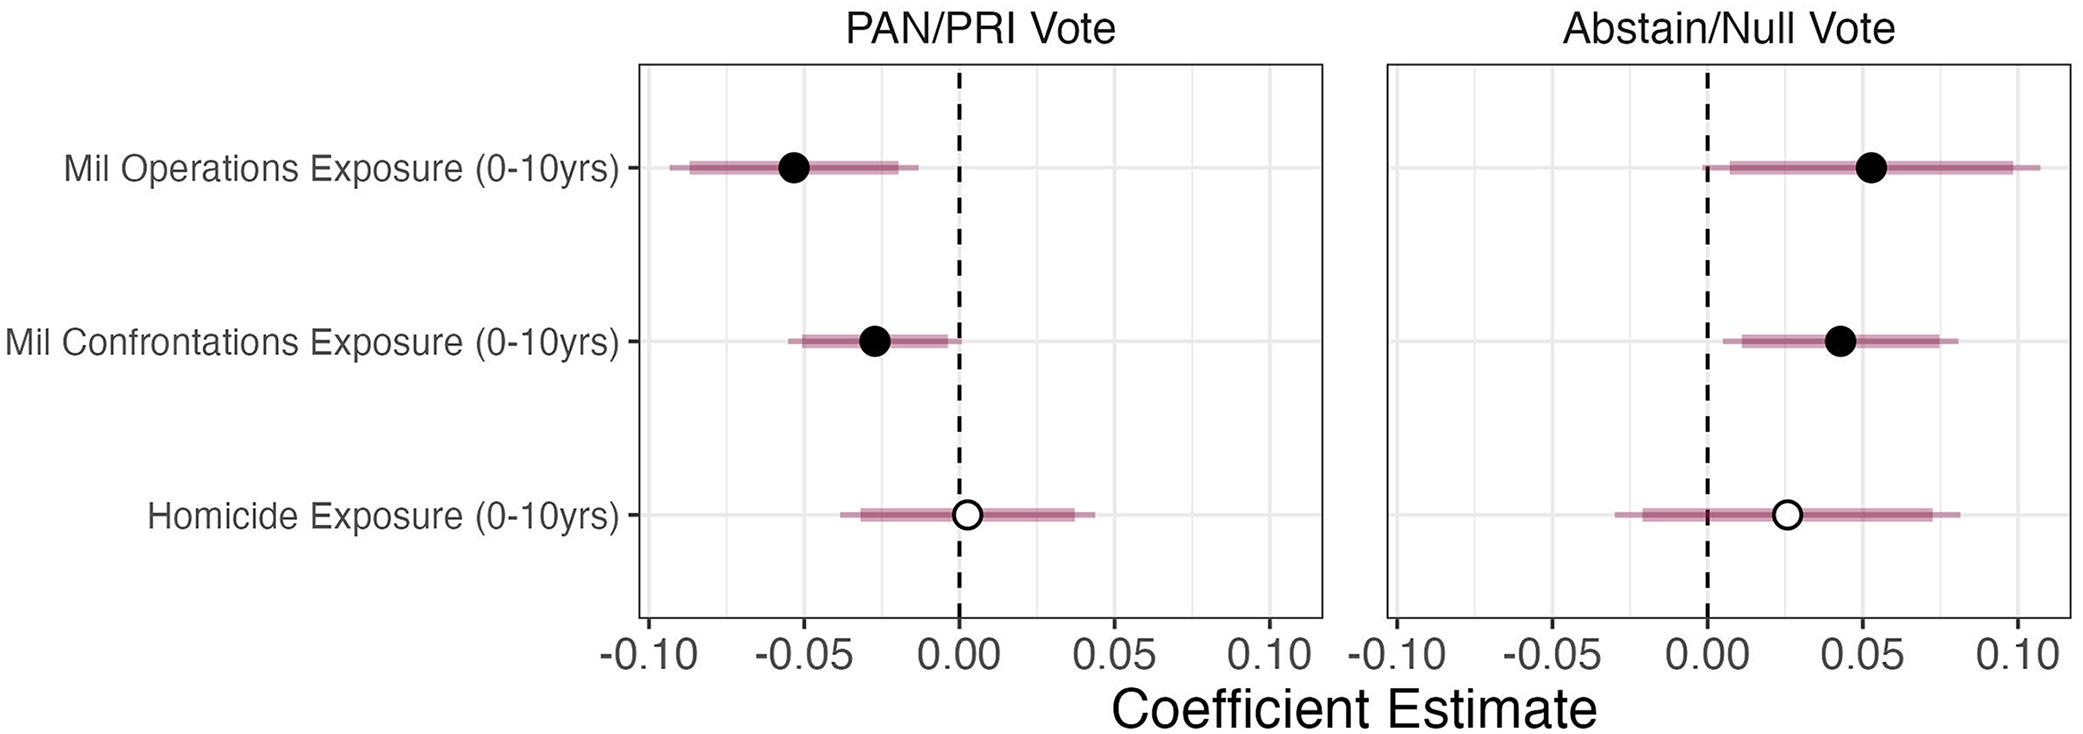
The results presented in Figure 6 provide evidence in support of a backlash against the PAN and PRI in light of exposure to drug-war-era military interventions. See Appendix 13 for full results. As exposure to confrontations (p < 0.1) and operations (p < 0.05) during childhood increases, the probability of voting for the PAN or PRI later in life decreases. Notably, as exposure to lethal violence increases, the PAN/PRI vote probability does not decrease. A one standard deviation increase in exposure to military presence, for example, resulted in a 5 percentage-point decrease in the likelihood of voting for the PAN or PRI. This supports our argument regarding targeted effects on specific government-led efforts. We also analyze the degree to which this reduced probability of voting for the PAN or PRI translates into increased support for competing parties – namely MORENA – or disengagement with the political system. We find that both exposure to military operations and confrontations is associated with decreased engagement overall, as measured by vote abstention and null voting. As shown in Appendix 13, there is no relationship between exposure and vote for MORENA.
Effect of criminal violence and military interventions on vote behavior.
Note: coefficients correspond to linear probability models, predicting a PAN/PRI vote (left panel) or vote abstention/null vote (right panel). The main independent variables are standardized. Models include controls for gender, SES, and education, with birth year and municipality fixed effects. Error bars represent 90 per cent (bold) and 95 per cent (thin) CIs.

Robustness
We test the robustness of our findings using alternative specifications and additional controls. In our continuous models (Tables 3–5), we account for pre-drug-war trends by controlling for SEDENA drug-trafficking detentions prior to the drug war (Appendix 6), and ensure current violence is not driving results by including the contemporary municipal homicide rate (Appendix 7). We also implement a risk-set matching design (Rosenbaum Reference Rosenbaum2020), restricting analyses to municipalities on similar exposure paths but with different onset timing (Appendix 11). Finally, we consider the reliability of our results in light of the modifiable areal-unit problem (MAUP) (Lee et al Reference Lee, Rogers and Soifer2025) by re-estimating exposure using a respondent’s municipality and all adjacent municipalities (Appendix 8). Across all robustness checks, results remain consistent in sign and typically in significance.
For our results leveraging the exogenous shock of the drug war (Tables 6 and 7), we adopt a more relaxed definition of the eligible cohort, including respondents born as early as 1999. Although this captures some individuals aged 11–12 in 2010–11 and younger children in 2007–10, results remain largely unchanged (Appendix 15). Our claim of exogeneity assumes no systematic pre-shock differences between municipalities with high versus low levels of military interventions. Consistent with the logic of parallel trends, we find no pre-drug-war differences in drug-trafficking detentions among municipalities first targeted in 2007 (Appendix 14). We also document balance across homicide rates, pre-war detentions, and respondent demographics (Appendix 14), supporting a lack of systematic difference in observable potentially confounding variables.
Conclusion
We document the lasting detrimental effects of Mexico’s drug war on the political attitudes of conflict-exposed children. We provide evidence that exposure to lethal criminal violence and to the government’s militarized security strategy during the first decade of life lowers community and political trust in ways that persist into early adulthood. We also find that childhood exposure to military interventions triggered a political backlash against the PAN and PRI – the parties responsible for implementing these security policies during this generation’s formative years – and heightened political disaffection.
While our focus is on childhood experiences, we acknowledge that exposure to violence at later stages of life also shapes political attitudes (for example, Bauer et al Reference Bauer, Blattman, Chytilová, Henrich, Miguel and Mitts2016; Ley Reference Ley2017; Pion-Berlin and Carreras Reference Pion-Berlin and Carreras2017). Nevertheless, our central finding is that early-life exposure exerts particularly durable effects. We use the terms ‘long-lasting’ and ‘persistent’ in a precise sense: these effects carry forward from exposure during ages 0–10 to political attitudes measured for ages 16–29, and remain evident even after accounting for contemporaneous violence.
Our study also brings conceptual nuance to research on exposure to militarized conflict. We differentiate between experiences with violent military confrontations and with non-violent military operations. While exposure to confrontations produces consistent and sizable decreases in trust, exposure to operations – capturing military presence without violence – has weaker and less consistent effects. This distinction highlights that mass deployments alone may not be sufficient to generate long-term attitudinal changes; rather, it is the experience of violent confrontation that appears to undermine trust most strongly in related government institutions. These results reinforce the argument that it is childhood exposure to violence, rather than militarization itself, that yields enduring consequences for political attitudes.
We also show that exposure to lethal criminal violence during one’s formative years undermines trust in both federal police forces and one’s community. This aligns with research demonstrating that violence weakens a community’s social fabric (Corbacho et al Reference Corbacho, Philipp and Ruiz-Vega2015; Salmi et al Reference Salmi, Smolej and Kivivuori2007), while contributing new evidence that these effects persist over time. We also find a negative, although not statistically significant, relationship across all other political institutions examined. Finding a statistically significant decrease in trust in the federal police, rather than across government institutions more broadly, provides a new perspective on the effects of violence on trust that contrasts with earlier research reporting more widespread negative impacts.
Our analysis further demonstrates that childhood exposure to both military confrontations and military presence produces electoral consequences. Individuals exposed to these forms of militarization are less likely, years later, to support PAN or PRI candidates – the parties of the presidents who oversaw the bulk of these interventions. Notably, we do not find consistent declines in overall trust in the federal government, suggesting that youths attribute responsibility to specific political actors rather than to governing institutions more broadly. While our evidence comes from the 2021 midterm election, these partisan effects may be even stronger in high-salience contests, warranting further research.
These patterns carry important implications for downstream political engagement. Lower interpersonal and institutional trust can diminish individuals’ willingness to participate in civic and electoral life, and prior research shows that political participation tends to be lower in high-violence settings (Córdova Reference Córdova2019; Ley Reference Ley2018; Trelles and Carreras Reference Trelles and Carreras2012). Our findings suggest one potential mechanism: violence experienced during formative years weakens trust, which in turn may discourage individuals from participating in the political life of their communities (Wollebæk et al Reference Wollebæk, Lundåsen and Trägårdh2012). In contexts where individuals continue to reside in the same communities where they experienced violence – as is common in Mexico and much of Latin America – the erosion of social and political trust may thus have severe and lasting consequences.
Finally, understanding the long-term effects of childhood exposure to violence is essential for designing policies that foster political stability, strengthen democratic norms, and promote social cohesion. This study provides new evidence of the socio-political consequences of exposure to criminal violence and militarized security interventions during childhood – an area that remains understudied despite the millions of children growing up amid conflict in the Global South. Further research should examine whether particular forms of violence exposure shape the adoption of specific political ideologies in adulthood and whether the impacts on trust and engagement persist as exposed cohorts age.
Supplementary material
The supplementary material for this article can be found at https://doi.org/10.1017/S0007123426101707.
Data availability statement
Replication data for this article can be found in the Harvard Dataverse at https://doi.org/10.7910/DVN/9MNIY3.
Acknowledgements
We are grateful to Elena Barham, Robert Blair, Tanisha Fazal, Gabriella Levy, Vicky Murillo, Guillermo Trejo, Morgan Wack, Ye Wang, and participants at APSA, MPSA, WADES, UNU-WIDER, the 2022 Conference on Long-Range Development in Latin America, the Public Choice Society, and seminars at CIDE, Duke, UC San Diego, Penn, Columbia, American University, and the Multi-Method Conflict Consortium for helpful comments and feedback. We thank Gustavo Flores-Macías and Jessica Zarkin for sharing data on operations and confrontations, and Elena Barham for sharing data on disappearances. We also thank Vivian Bronsoler, Elisa Lavore, and the field team at Buendía & Márquez for their invaluable contributions. We gratefully acknowledge generous support from UNU-WIDER and USAID. All errors are our own.
Author contributions
Authors contributed equally to this work.
Financial support
This work was supported by the United Nations University World Institute for Development Economics Research (UNU-WIDER) and the United States Agency for International Development (USAID).
Competing interests
None to disclose.
Ethical standards
This research went under full review and was approved by The George Washington University Committee on Human Research, Institutional Review Board (IRB), FWA00005945.




 Open access

