Implications
A leptin deficit in rodents triggers centrally driven adaptations such as increased appetite, insulin resistance and altered production of hormones regulating metabolic efficiency. Whether reduced central leptin signaling triggers similar adaptations in the sheep remains unknown. This issue was addressed by infusing a leptin antagonist via an intracerebroventricular cannula in well-conditioned mature sheep. The leptin antagonist tended to reduce thyroid hormone production when administered alone but failed to trigger other adaptations, even though it completely blocked the anorectic effects of exogenous leptin. These results imply that well-conditioned mature sheep are relatively insensitive to short-term reduction in central leptin signaling.
Introduction
Leptin is a 16 kDa protein hormone produced nearly exclusively by adipose tissue (Ahima and Flier, Reference Ahima and Flier2000; Boisclair et al., Reference Boisclair, Wesolowski, Kim and Ehrhardt2006). In ruminants and most other animals, leptin production is proportional to adipose tissue mass but is also modulated by other signals such as insulin and glucocorticoids (Ahima and Flier, Reference Ahima and Flier2000; Ingvartsen and Boisclair, Reference Ingvartsen and Boisclair2001; Boisclair et al., Reference Boisclair, Wesolowski, Kim and Ehrhardt2006). Leptin acts predominantly on the hypothalamus and other restricted areas of the central nervous system (CNS) owing to the high abundance of the fully competent signaling form of the leptin receptor in these regions (Myers and Olson, Reference Myers and Olson2012). Leptin is involved in the regulation of energy homeostasis as shown by reduced feed intake following exogenous administration and by exaggerated appetite in the total absence of leptin (Ahima and Flier, Reference Ahima and Flier2000; Boisclair et al., Reference Boisclair, Wesolowski, Kim and Ehrhardt2006; Farooqi and O'Rahilly, Reference Farooqi and O'Rahilly2009).
Ruminants suffering from a total lack of leptin have not been identified, but they, nevertheless, naturally experience sustained periods of hypoleptinemia. For example, high yielding dairy cows suffer from chronic energy insufficiency (CEI) in early lactation because voluntary feed intake is insufficient to cover the metabolic demands of the mammary gland (Bell, Reference Bell1995; Bell and Bauman, Reference Bell and Bauman1997). During CEI, ruminant adapt by mobilizing endogenous reserves and by inducing adaptations preserving energy and nutrients (Bell and Bauman, Reference Bell and Bauman1997; Boisclair et al., Reference Boisclair, Wesolowski, Kim and Ehrhardt2006). These adaptations were initially attributed to hormone actions in the periphery (Bauman and Currie, Reference Bauman and Currie1980), but it is now clear that insufficient leptin contributes by targeting the CNS (Myers and Olson, Reference Myers and Olson2012). These adaptive responses were identified by studying mice and humans suffering from a total leptin deficiency (Leibel, Reference Leibel2008; Paz-Filho et al., Reference Paz-Filho, Wong and Licinio2011) and include increased appetite, higher metabolic efficiency and peripheral insulin resistance (Leibel, Reference Leibel2008; Farooqi and O'Rahilly, Reference Farooqi and O'Rahilly2009; Paz-Filho et al., Reference Paz-Filho, Wong and Licinio2011). In contrast, the role of leptin in sheep has been explored exclusively via exogenous leptin administration to animals endowed with a completely intact leptin system. These studies have shown that leptin can regulate appetite (Henry et al., Reference Henry, Goding, Alexander, Tilbrook, Canny, Dunshea, Rao, Mansell and Clarke1999; Blache et al., Reference Blache, Tellam, Chagas, Blackberry, Vercoe and Martin2000; Henry et al., Reference Henry, Goding, Tilbrook, Dunshea, Blache and Clarke2004), but have provided little information on the impact of reduced central leptin signaling in the context of normal physiology.
Our overall objective was to test the hypothesis that central leptin signaling is involved in adaptive metabolism in sheep. As the physiological signal read by the CNS in many contexts is falling rather than increasing plasma leptin (Leibel, Reference Leibel2008), we treated well-fed adult sheep with an ovine leptin antagonist mutant (OLA) harboring alanine substitution of amino acid residues 39 to 41 (Niv-Spector et al., Reference Niv-Spector, Gonen-Berger, Gourdou, Biener, Gussakovsky, Benomar, Ramanujan, Taouis, Herman, Callebaut, Djiane and Gertler2005). This mutant binds the leptin receptor with an affinity equal to wild type leptin but is totally devoid of agonistic activity.
Material and methods
All animal procedures were approved by the relevant local Animal Care and Use Committee (West Virginia University for surgeries and Cornell University for animal experiments).
Surgical preparation of animals
Five mature Suffolk ewes (age 3 to 4 years) were prepared under halothane anesthesia with permanent intracerebroventricular (ICV) cannula inserted into the third ventricle as described by Hileman et al. (Reference Hileman, Schillo and Hall1993). In brief, a 1 cm diameter hole was drilled through the skull and the sagittal sinus was ligated and cut. Radio opaque dye was injected into one lateral ventricle via a temporary cannula followed by frontal and lateral X-ray. Using X-ray visualization, a 60 mm long, 18 g stainless steel cannula was placed into the third ventricle about 5 mm dorsal to the median eminence. The cannula was cemented to the skull with screws and dental acrylic, and plugged with a 21 g wire stylet. A plastic cap with a removable lid was affixed in the dental acrylic to protect the protruding part of the cannula. Ewes were transported to Cornell University after a recovery period of 3 to 4 weeks. After completing studies described below, necropsy of each animal confirmed cannula placement in the third ventricle.
Experimental design
Animals were kept in individual metabolic crates and housed at all times in a single experimental room under controlled environment (20°C to 22°C, light on between 0600 and 2000 h). They were used in two different studies over a period of ∼5 months with each study separated by an 8-week interval. Sheep were fed a single total mixed ration (TMR) consisted of chopped alfalfa grass hay, barley grain, molasses and mineral supplement in the ratio of 67 : 30 : 2.4 : 0.6 and contained 130 g CP and 10.5 MJ of metabolizable energy (ME) per kg DM. The TMR was offered ad libitum except between studies when it was limited to amounts covering 1.2 maintenance energy requirements.
Study 1: OLA efficacy in vivo
Ewes were randomly allocated to 3×3 Latin Squares (one complete and one incomplete). At the start of each experimental period, ewes were weighted and assessed a body condition score (BCS) using a 5-point sheep scoring system (1=thin, 5=fat) as described by Russel (Reference Russel1984). Ewes were fitted with a catheter in both jugular veins the day before each experimental period. Experimental periods lasted 5 days and were separated by a 14-day intervening period. Each experimental period was divided into a 3-day period of basal dry matter intake (DMI) measurements and a 2-day period of ICV treatment. Treatments were chronic ICV infusion of artificial cerebrospinal fluid (aCSF; 150 mM NaCl, 1.2 mM CaCl2, 1 mM MgCl2, 2.8 mM KCl), ovine leptin (4 µg/h; treatment designated L) or the combination of ovine leptin (4 µg/h) and its mutant version OLA (40 µg/h; treatment designated L+OLA). OLA and leptin have a similar affinity for the leptin receptor (Niv-Spector et al., Reference Niv-Spector, Gonen-Berger, Gourdou, Biener, Gussakovsky, Benomar, Ramanujan, Taouis, Herman, Callebaut, Djiane and Gertler2005). Accordingly, in the case of the L+OLA treatment, the OLA infusion rate was 10 times higher than that of leptin to ensure OLA predominance at the receptor. The OLA mutant has the same exact sequence as ovine leptin except for alanine substitution mutations of amino acids 39 to 41. Ovine leptin and OLA were produced in a bacterial expression system, refolded and purified to homogeneity as previously described (Niv-Spector et al., Reference Niv-Spector, Gonen-Berger, Gourdou, Biener, Gussakovsky, Benomar, Ramanujan, Taouis, Herman, Callebaut, Djiane and Gertler2005). All proteins were dissolved in aCSF, with each ICV treatment delivered as a 100 µL/h continuous infusion using a syringe pump (model SE 400; Vial Medical, Grenoble, France). Ewes were offered an excess of a single TMR, delivered as equal meals every 2 h using an automatic feeder. This feeding mode promotes constant absorption of nutrients and steady-state level of metabolites and hormones in plasma. The DMI was recorded every 24 h throughout each experimental period. In addition, blood samples were taken (every 20 min between 1000 and 1400 h) the day before initiating ICV treatments and on the last day of ICV treatment. All blood samples were processed to plasma by the addition of heparin (30 U/ml) and centrifugation. Plasma was stored at −20°C until analyzed for metabolites and hormones.
Study 2: Impact of reduced endogenous leptin signaling in the brain
Ewes were randomly allocated to a single cross-over design consisting of 7-day experimental periods separated by a 14-day intervening period. BW and BCS of each ewe were recorded at the start of each period. Each experimental period was divided into a 3-day period of basal measurements and a 4-day period of ICV treatment. Treatments were ICV infusion of aCSF or OLA (40 µg/h) delivered by constant infusion as described for study 1. Diet and feeding protocols were identical to study 1, except that DMI was also recorded every 2 h for the first 6 h of infusion. Blood samples were taken the day before initiating ICV treatments and on the last day of ICV treatment, as described for study 1. In addition, an insulin tolerance test was performed immediately following blood sampling on the last day of ICV treatment. The insulin tolerance test consisted of an intravenous bolus of bovine insulin in one catheter (300 mU/kg BW; Sigma, St. Louis, MO, USA) followed by rapid blood sampling from the contralateral catheter (−30, −20, −10, 0, 4, 8, 12, 16, 20, 30, 45, 60, 90, 120, 150 and 180 min relative to bolus administration at 0 min).
Analysis of plasma metabolites and hormones
Plasma glucose and non-esterified fatty acids (NEFA) were analyzed by the glucose oxidase method and the acyl-CoA synthetase/oxidase method, respectively (Thorn et al., Reference Thorn, Ehrhardt, Butler, Quirk and Boisclair2008). Plasma insulin concentrations were measured with a commercial human RIA (Linco Research, St. Louis, MO, USA) utilizing bovine insulin as the iodinated hormone and standard in the assay. Plasma leptin was measured by a bovine RIA validated with ovine plasma (Ehrhardt et al., Reference Ehrhardt, Slepetis, Siegal-Willott, Van Amburgh, Bell and Boisclair2000). Total plasma triiodothyronine (T3), thyroxine (T4) and cortisol were measured using commercial solid phase RIA (T3 and T4; Diasorin Inc., Stillwater, MN, USA; Cortisol, Siemens, Malvern, PA, USA). The limits of detection for these assays were 0.03 ng/ml for insulin, 0.2 ng/ml for leptin, 0.05 ng/ml for T3, 0.04 ng/ml for T4 and 0.1 ng/ml for cortisol. Intra- and inter-assay coefficients of variation were <8% for all assays.
Calculations and statistical analysis
The glucose response to the insulin challenge was calculated as the area under the response curve (AUC) and corrected for differences in baseline glucose concentration (average of concentration at −30, −20, −10 and 0 min). The average concentration of each metabolite and hormone was calculated over each 4 h sampling window. Maintenance ME was calculated for each sheep using the relation: ME maintenance (MJ)=4.184×(0.009×BW (kg)+0.9955) (NRC, 2007).
All statistical analyses were performed with JMP software, version Pro10 (SAS InstituteInc., Cary, NC, USA). For study 1, the following model was used:
 $$Y_{{ijklm}} =\mu {\plus}T_{i} {\plus}P_{j} {\plus}S_{k} {\plus}D_{l} {\plus}TD_{{il}} {\plus}E_{m} {\plus}e_{{ijklm}} $$
where Y ijklm is the dependent, continuous variable, μ the overall mean, T i the fixed effect of the i th treatment (i=aCSF, L and L+OLA), P j is the fixed effect of the j th period (j=1, 2 and 3), S k the fixed effect of the k th square (k=1 and 2), D l is the fixed effect of the l th day (l=1 and 2), TD il is the fixed effect of the interaction between the i th treatment and the l th day, E m is the random effect of the m th ewe (m=1, 2, 3, 4 and 5) and e ijklm is the residual error. Metabolites and hormones were analyzed with a similar model except that day effect was not included and values obtained during the basal period were used as covariate.
For study 2, the following model was used:
 $$Y_{{ijkl}} =\mu {\plus}T_{i} {\plus}P_{j} {\plus}D_{k} {\plus}TD_{{ik}} {\plus}E_{l} {\plus}e_{{ijkl}} $$
where Y ijkl is the dependent, continuous variable, μ the overall mean, T i the fixed effect of the i th treatment (i=aCSF and OLA), P j is the fixed effect of the j th period (j=1 and 2), D k is the fixed effect of the k th day (k=1, 2, 3 and 4), TD ik is the fixed effect of the interaction between the i th treatment and the k th day, E l is the random effect of the l th ewe (l=1, 2, 3, 4 and 5), and e ijkl is the residual error. For the analysis of DMI on the 1st day of infusion, the same model was used except that D k included the following k levels: 0 to 2, 2 to 4, 4 to 6 and 6 to 24 h. Metabolites and hormones were analyzed with a similar model except that day effect was not included and values obtained during the basal period were used as covariate.
When indicated, pair-wise comparisons were performed with Tukey adjustment. Statistical significance and tendency were set at P<0.05 and P<0.10, respectively.
Results
Study 1
To test the effectiveness of the leptin antagonist OLA in vivo, we focused on DMI because it is the most consistent variable affected by ICV leptin treatment in the sheep.
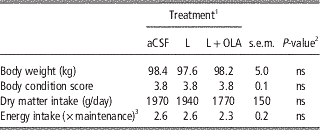
At the start of the basal period, BW and BCS did not differ between aCSF, L and L+OLA (Table 1). Similarly, DMI and ME intake estimated relative to maintenance energy requirement were identical, indicating similar nutritional state before all treatments (Table 1).
BW and energy intake of ewes measured during a 3-day basal period preceding treatments (study 1)

1 Ewes (n=5) received intracerebroverticular infusion of artificial cerebrospinal fluid (aCSF), ovine leptin (4 µg/h; L) or the combination of both ovine leptin and ovine leptin antagonist (4 and 40 µg/h, respectively; L+OLA) over a 2-day period.
2 Type I error probability, ns=P>0.10.
3 Metabolizable energy intake is expressed as a fold of maintenance energy requirement.
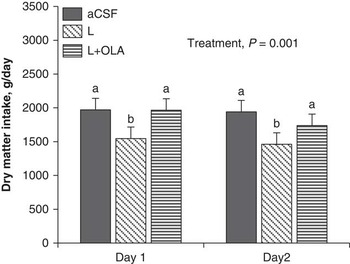
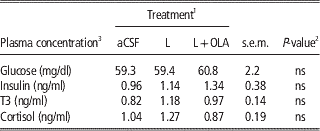
During ICV infusion there was an overall treatment effect (P<0.001, Figure 1). The ICV leptin treatment accounted entirely for this effect (P<0.05), causing DMI reductions of 23% and 25% on the 1st and 2nd day of infusion, with no treatment×time interaction. Co-infusion of OLA with leptin, however, OLA eliminated completely the anorexic effect of leptin on both days (Figure 1). There were no treatment effects on plasma variables indicative of insulin action (glucose and insulin) or on the plasma concentration of hormones affecting metabolic efficiency (T3 and cortisol; Table 2).
Prevention of the anorexic effect of leptin by the leptin receptor antagonist. Ewes (n=5) received intracerebroventricular infusion of artificial cerebrospinal fluid (aCSF), leptin (4 µg/h; L) or the combination of leptin (4 µg/h) and the leptin antagonist (40 µg/h; L+OLA). Voluntary dry matter intake during the 2-day treatment period. The significant effect of treatment is reported. Each bar represents the mean±s.e. of voluntary dry matter intake (g/day). Bars with different subscript differ significantly (P<0.05).

Effect of leptin or the combination of leptin and the ovine leptin antagonist on plasma variables

1 Ewes (n=5) received intracerebroverticular infusion of artificial cerebrospinal fluid (aCSF), ovine leptin (4 µg/h; L) or the combination of both ovine leptin and ovine leptin antagonist (4 and 40 µg/h, respectively; L+OLA) over a 2-day period.
2 Type I error probability, ns=P>0.10.
3 T3=triiodothyronine.
Study 2
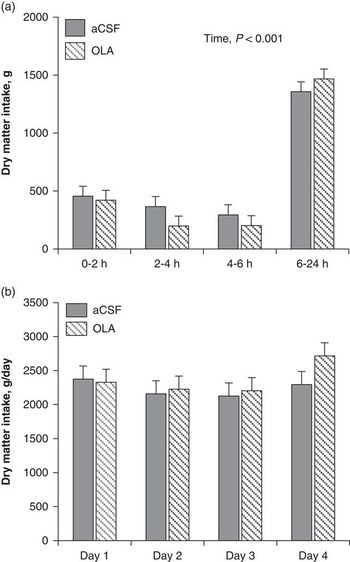
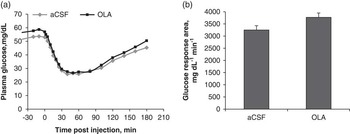
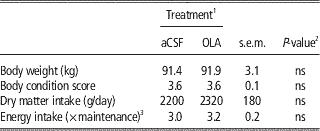
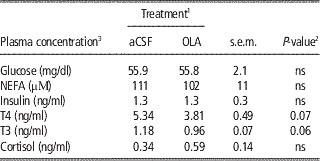
To determine whether a reduction of endogenous leptin signaling in the brain affected voluntary DMI and peripheral metabolic responses, OLA was infused alone. Similar to study 1, the baseline BW, BCS, voluntary DMI or ME intake relative to maintenance energy requirements did not differ before treatments (Table 3). OLA treatment did not increase DMI at any time during the 1st day of infusion (Figure 2a) or on any of the 4 days of ICV infusion (Figure 2b). Further, the ICV infusion of OLA did not affect the plasma concentrations of glucose, NEFA and insulin (Table 4). An index of insulin action was obtained by performing an insulin tolerance test after 4 days of OLA treatment (Figure 3). OLA had no effect on insulin action as reflected by similar characteristics of the glucose disappearance curve (time to the plasma glucose nadir, glucose response area between bolus and the plasma glucose nadir, Figure 3a) or total glucose response area (Figure 3b). Central infusion of OLA had no effect on plasma cortisol but showed a tendency to reduce plasma concentrations of T3 and T4 by 19% and 29%, respectively (P=0.06 and 0.07, respectively; Table 4).
Effect of leptin receptor antagonist on voluntary feed intake. Ewes (n=5) received intracerebroventricular infusion of artificial cerebrospinal fluid (aCSF) or the ovine leptin antagonist (40 µg/h; OLA). (a) Voluntary dry matter intake at specific time intervals during the first day of intracerebroventricular infusion. The significant effect of time is reported. Each bar represents the mean±s.e. of voluntary feed intake (g/day). (b) Voluntary dry matter intake over the 4-day period of intracerebroventricular infusion. Each bar represents the mean±s.e. of voluntary dry matter intake (g/day).

Effect of the leptin receptor antagonist on insulin action. Ewes (n=5) received intracerebroventricular infusion of artificial cerebrospinal fluid (aCSF) or the ovine leptin mutant (40 µg/h; OLA) for 4 consecutive days. An insulin tolerance test was performed on the 4th day of infusion. (a) Temporal pattern of plasma glucose in response to a single injection of insulin at time 0. (b) The glucose response area was calculated between time 0 and 180 min and corrected for difference in baseline concentration. Each bar represents the mean±s.e. of glucose response area (mg/dl min).

BW and energy intake of ewes measured during a 3-day basal period preceding treatments (study 2)

1 Ewes (n=5) received intracerebroverticular infusion of artificial cerebrospinal fluid (aCSF) or ovine leptin antagonist (40 µg/h; OLA) over a 4-day period.
2 Type I error probability, ns=P>0.10.
3 Metabolizable energy intake is expressed as a fold of maintenance energy requirement.
Effect of the ovine leptin antagonist on plasma variables

1 Ewes (n=5) received intracerebroverticular infusion of artificial cerebrospinal fluid (aCSF) or ovine leptin antagonist (40 µg/h; OLA) over a 4-day period.
2 Type I error probability, ns=P>0.10.
3 NEFA=non-esterified fatty acids; T4=thyroxine; T3=triiodothyronine.
Discussion
In humans and rodents, a lack of leptin triggers CNS-driven adaptations such as increased appetite, higher metabolic efficiency and peripheral insulin resistance (Leibel, Reference Leibel2008; Farooqi and O’Rahilly, Reference Farooqi and O'Rahilly2009; Paz-Filho et al., Reference Paz-Filho, Wong and Licinio2011). These adaptations are reversed by leptin therapy, confirming their leptin dependence (Leibel, Reference Leibel2008; Paz-Filho et al., Reference Paz-Filho, Wong and Licinio2011). In sheep and other ruminants, animals lacking leptin have not been identified and leptin actions have been inferred by exogenous leptin administration of animals fed once daily an unlimited amount of feed (Henry et al., Reference Henry, Goding, Alexander, Tilbrook, Canny, Dunshea, Rao, Mansell and Clarke1999; Blache et al., Reference Blache, Tellam, Chagas, Blackberry, Vercoe and Martin2000; Morrison et al., Reference Morrison, Daniel, Holmberg, Djiane, Raver, Gertler and Keisler2001; Morrison et al., Reference Morrison, Wood, McFadin, Whitley and Keisler2002). These studies showed that leptin reduces appetite when administered via the ICV approach but not when infused in the periphery. Therefore, leptin produced anorectic responses only when hypothalamic nuclei were exposed to supraphysiological leptin concentration. While the ICV approach provides unambiguous evidence that leptin can regulate appetite in ruminants, it provides no information on the consequence of reduced central leptin signaling in the normal physiological context. This is an important unresolved issue in the sheep because data in both rodents and humans show that the vast majority of leptin actions are initiated by reduced central signaling (Leibel, Reference Leibel2008).
To address the role of reduced leptin signaling in the sheep, we perform ICV infusions of OLA, an ovine leptin mutant incorporating alanine substitution mutations of amino acids 39 to 41. OLA binds the leptin receptor with normal affinity but lacks agonistic activity. Accordingly, OLA failed to induce leptin-dependent responses in cell culture when used alone, and more importantly produces dose-dependent inhibition of these responses when added simultaneously with leptin (Niv-Spector et al., Reference Niv-Spector, Gonen-Berger, Gourdou, Biener, Gussakovsky, Benomar, Ramanujan, Taouis, Herman, Callebaut, Djiane and Gertler2005). However, evidence that OLA can antagonize leptin action in the sheep was lacking, prompting us to first ask whether it could ablate the anorexic effects of ICV leptin. The leptin dose we used in this experiment (4 µg/h) reduced DMI by 23% within a day, in close agreement with a previous experiment performed in mature sheep (Blache et al., Reference Blache, Tellam, Chagas, Blackberry, Vercoe and Martin2000). Administration of a 10-fold excess of OLA completely ablated the anorexic effect of leptin, demonstrating for the first time that OLA is an effective antagonist in the sheep under in vivo conditions.
When leptin is infused via an ICV cannula, most of the leptin in CSF is of exogenous origin and present at supraphysiological concentration. Under these conditions, OLA neutralizes the exogenously derived leptin but this approach cannot address the role of endogenous leptin. As demonstrated in rats, co-infusion of a similarly designed rat leptin antagonist prevented the anorexic effects of leptin but did not increase feed intake above control; an increased appetite was seen only when endogenous leptin signaling was inhibited by infusion of the rat leptin antagonist alone (Zhang et al., Reference Zhang, Matheny, Tumer, Mitchell and Scarpace2007). In the sheep, however, administration of OLA alone in the second experiment did not increase DMI at any time over a 4-day treatment period. This negative result cannot be explained by an inadequate OLA concentration in CSF. This concentration can be estimated with the relation C=E/K×V d where C is OLA concentration, E the OLA infusion rate, K the fractional turnover rate and V d the volume of distribution (Shipley and Clark, Reference Shipley and Clark1972). Using a CSF volume and fractional production rate of adult sheep (14.2 ml and 0.5/h; Evans et al. (Reference Evans, Reynolds, Reynolds, Saunders and Segal1974)) and our infusion rate of 40 µg/h, a steady state OLA concentration of 5600 ng/ml is estimated in CSF. This is a 2200- to 5000-fold excess over endogenous leptin concentration of 1 to 2.5 ng/ml reported in CSF of well-fed adult sheep (Adam et al., Reference Adam, Findlay and Miller2006; Adam and Findlay, Reference Adam and Findlay2010). Although this modeling provides only an estimate, it leaves no doubt that OLA was present in substantial excess over endogenous leptin in CSF. The other caveat is that OLA is unable to signal and any OLA effect reflects an inhibition of endogenous leptin action. It follows that OLA will have no effect if the receptor is completely resistant to the prevailing endogenous leptin level. Accordingly, we interpret the lack of OLA effect on appetite as evidence that endogenous leptin plays a minor role in limiting DMI of well-conditioned mature sheep.
In the first experiment, ICV leptin had no effect on plasma glucose, insulin and cortisol, in agreement with previous sheep work (Henry et al., Reference Henry, Goding, Alexander, Tilbrook, Canny, Dunshea, Rao, Mansell and Clarke1999; Blache et al., Reference Blache, Tellam, Chagas, Blackberry, Vercoe and Martin2000; Henry et al., Reference Henry, Goding, Tilbrook, Dunshea, Blache and Clarke2004). A deficit in central leptin signaling, on the other hand, has major impacts on all these variables in rodents. For example, a near total insulin deficiency not only leads to hyperglycemia, but also to a leptin deficit (Chinookoswong et al., Reference Chinookoswong, Wang and Shi1999; Lin et al., Reference Lin, Higginbotham, Judd and White2002). Correction of this leptin deficit only in the brain via ICV treatment was sufficient to normalize plasma glucose, even if plasma insulin remained depressed (Hidaka et al., Reference Hidaka, Yoshimatsu, Kondou, Tsuruta, Oka, Noguchi, Okamoto, Sakino, Teshima, Okeda and Sakata2002). Similarly, circulating glucocorticoids are increased in leptin-deficient rodents (Huang et al., Reference Huang, Rivest and Richard1998; Perry et al., Reference Perry, Zhang, Zhang, Kumashiro, Camporez, Cline, Rothman and Shulman2014). In the sheep, however, infusion of OLA alone did not provide evidence that reduced central leptin signaling leads to insulin resistance or increased plasma cortisol.
The only result suggesting the possibility of an involvement of central leptin signaling in our experiment was provided by thyroid hormones. Central infusion of OLA led to a near significant reduction in the plasma concentrations of T3 and T4. The impact of ICV leptin on thyroid hormone concentration has not been studied in the sheep except for one report where a 5-day ICV infusion produced no effects (Blache et al., Reference Blache, Tellam, Chagas, Blackberry, Vercoe and Martin2000). In contrast, rodents and humans lacking leptin have depressed plasma T3 and T4 and these deficits are corrected by leptin administration (Ahima et al., Reference Ahima, Prabakaran, Mantzoros, Qu, Lowell, Maratos-Flier and Flier1996; Farooqi et al., Reference Farooqi, Matarese, Lord, Keogh, Lawrence, Agwu, Sanna, Jebb, Perna, Fontana, Lechler, DePaoli and Rahilly2002). Reduced thyroid hormone levels are known to promote higher metabolic efficiency (Rosenbaum et al., Reference Rosenbaum, Goldsmith, Bloomfield, Magnano, Weimer, Heymsfield, Gallagher, Mayer, Murphy and Leibel2005; Mullur et al., Reference Mullur, Liu and Brent2014). Interestingly, dairy cows experience coincidental reductions in plasma leptin and thyroid hormones in early lactation (Block et al., Reference Block, Butler, Ehrhardt, Bell, Van Amburgh and Boisclair2001; Reist et al., Reference Reist, Erdin, von Euw, Tschuemperlin, Leuenberger, Delavaud, Chilliard, Hammon, Kuenzi and Blum2003). Further work is warranted to investigate the possibility that reduced leptin signaling contributes to higher metabolic efficiency of energy-deficient ruminants by promoting lower plasma thyroid hormones.
In summary, we showed that OLA is an effective leptin antagonist under in vivo conditions in the sheep. Using OLA, our results showed that tonic central leptin signaling is of minor importance in the short term in regulating appetite, indices of insulin action or plasma cortisol, but raise the possibility that leptin plays a role in regulating thyroid hormone production in well-fed, well-conditioned mature sheep. Our results, however, do not rule out the possibility that a reduction in central leptin signaling regulates these responses during other phases of development and physiological states.
Acknowledgments
This research was supported by Grant No US-4117-08 of the Binational Agricultural Research and Development Foundation (BARD) to Y.R. Boisclair and A Gertler. Financial assistance was also provided by the State Scholarships Foundation of Greece through a post-graduate study scholarship to Andreas Foskolos. The authors would like to recognize the support and excellent technical assistance of Ramona M. Ehrhardt in this project.