INTRODUCTION
The South African sugarcane industry is a cost-competitive producer of raw and refined sugar products and generates on average 22 mt of sugarcane annually from about 47 000 registered sugarcane growers on approximately 430 000 ha (Meyer, Reference Meyer2007). The initiation of the plant breeding programme at the South African Sugarcane Research Institute (SASRI) in the 1940s has ensured the supply of high-yielding, disease-resistant varieties adapted to a diverse range of conditions. The adoption of new varieties is considered to be an essential part of the continued improvement of yields and profitability in any progressive crop production industry. As with other crops, in South Africa the decision to adopt new sugarcane varieties is based on a combination of technological information and personal preference. Aspects such as availability of seedcane (Pillay, Reference Pillay1999), adaptability of varieties (Mordocco et al., Reference Mordocco, Stringer and Cox2007) and reliable variety information (Pillay, Reference Pillay1999) have been identified as major factors influencing adoption. In most sugarcane industries, variety information is typically obtained from plant breeding selection programmes (Parfitt, Reference Parfitt2005), post-release evaluation programmes (Ramburan et al., Reference Ramburan, Redshaw and Van Den Berg2007) and observations of commercial performance. With the bulk of variety information being gathered during the selection and evaluation phases, it is essential that such information is accurate, reliable and applicable. Information originating from replicated field trials at strategic localities may be considered as one of the most reliable and influential factors affecting the adoption of new varieties in the South African sugar industry. It is therefore imperative that experimental yield data should be interpreted to accurately indicate productivity under commercial conditions for growers to understand the results and adopt the most appropriate varieties.
In South Africa, new sugarcane varieties are released to the industry after 12–15 years of selection within the plant breeding programme at SASRI. Selection primarily occurs on research farms (each farm is referred to as a selection programme) strategically located to represent the major production areas within the industry. Advanced selection stages test varieties on a limited number of off-station sites and compare results between selection programmes (Parfitt, Reference Parfitt2005). During the entire selection process, the number of environments that a variety may be exposed to is limited by logistics and cost; however, varieties must be released to the industry and recommended according to the available information. Varieties are also monitored within post-release variety evaluation trials established throughout the industry (both on- and off-station) as part of the variety evaluation project (VEP). The objective of the VEP is to evaluate performance under a wider range of environmental conditions and management practices in order to assist with recommendations for commercial adoption (Ramburan et al., Reference Ramburan, Redshaw and Van Den Berg2007). The results are presented to growers via formal and informal publications, and this information has a direct influence on the adoption of potential commercial varieties by the industry.
Despite these efforts, growers and extension specialists in the South African sugarcane industry have voiced concerns that experimental yields were consistently higher than commercial yields and were therefore practically unattainable. Such a discrepancy is a common phenomenon in a wide range of crops (Bissessur et al., Reference Bissesur, Ramnawas and Ramdoyal2007; Milligan et al., Reference Milligan, Balzarini, Gravois and Bischoff2007; Walker and Simmonds, Reference Walker and Simmonds1981) and is of concern, given that a lack of confidence by growers could ultimately lead to non-adoption of improved varieties. The objective of this study was therefore to compare experimental and commercial yields of sugarcane in order to determine whether suitable correction factors could be applied to give a representative indication of likely commercial yield. An analysis was also carried out to determine whether data from on-station or off-station trials could be better correlated with commercial yields.
MATERIALS AND METHODS
The study involved the analysis of long-term experimental and commercial data. Trial data for the study were taken from a database of results from all variety trials conducted as part of the VEP (Bezuidenhout, Reference Bezuidenhout1998). Commercial data were extracted from the Industry Information Database at SASRI. This contains production data at the industry level, as well as at the mill supply area (MSA) level, i.e. a region from which all sugarcane is delivered to a particular mill for processing. Sugarcane yield (fresh stalk weight) data from all trials harvested as part of the VEP were utilized, while commercial yields were calculated from the total tonnages crushed and area harvested each year throughout the industry. The two data sets were compared over a period of 29 years (1979–2007) in order firstly to identify the relative variability within each data set, and secondly to determine the comparative yield levels.
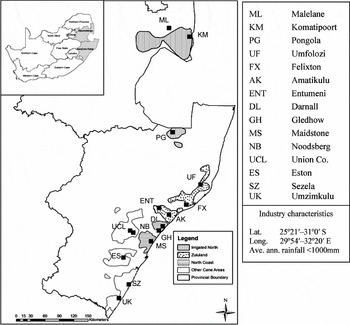
The long-term means of each data set were divided by each other to calculate a correction factor to predict commercial yields from experimental information. The derived factor was used to correct trial data for comparison with the industry commercial data set as a whole, as well as within three major regions (North Coast, Zululand, Northern) of the industry over the period 1995–2006. The analysis was repeated at the MSA level in order to determine the validity of the technique within smaller geographic units, and individual correction factors were calculated for each MSA, which were then correlated with commercial yields in each area. Finally, the trial data set was divided into on-station (on SASRI research farms) and off-station (on growers’ commercial fields) trials and compared to the commercial data set from 1984 to 2006 to determine which correlated better with commercial production. Figure 1 summarizes the environmental and geographic characteristics of the South African sugar industry.
Geographical characteristics of the South African sugar industry depicting regions investigated and mill supply areas.

Statistical analysis was carried out by two-sample unpaired t-tests and linear regression analysis using Genstat (Version 10). Significant and highly significant differences are indicated by p < 0.05 and p < 0.001 respectively.
RESULTS
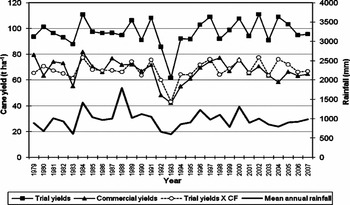
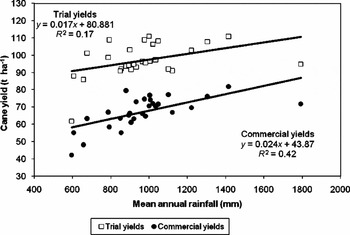
General trends of the experimental yields were similar to those of commercial yields over the 29-year period and both data sets were strongly influenced by industry rainfall patterns (Figure 2). Commercial yields (R 2 = 0.42, regression coefficient = 0.024) were more strongly influenced by rainfall than trial yields (R 2 = 0.17, regression coefficient = 0.017) (Figure 3). The drought years of 1983, 1992, and 1993 in particular resulted in low trial and commercial yields. Trial yields were consistently higher than commercial yields from 1979 to 2007 (Figure 2) and the two datasets were significantly different (p < 0.001) from each other, with the mean difference being 30 t ha−1. A correction factor of 0.7 was determined to convert experimental results to the equivalent commercial yield level. When corrected, the trial data set closely followed the trend in commercial yields.
Average trial yields with and without a correction factor (CF), commercial yields and rainfall (1979–2006).

Relationships between trial and commercial yields with rainfall (1979–2006).

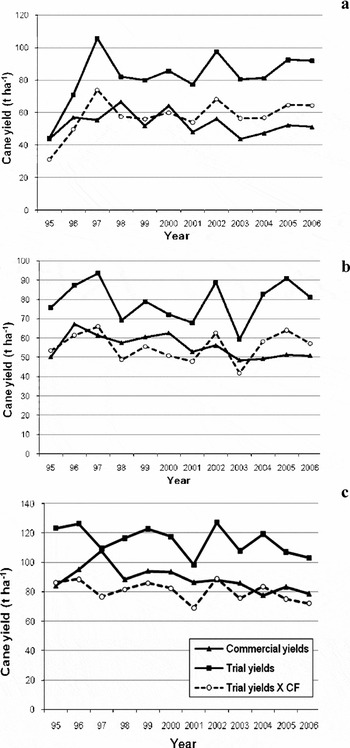
At the regional level, trial yields followed the patterns of commercial yields, but were again consistently higher and significantly different (p < 0.001 for all three regions) to commercial yields (Figure 4). The application of the correction factor (0.7) successfully adjusted trial yields to correspond to commercial levels.
Average trial yields with and without a correction factor (CF) and commercial yields for the North Coast (a), Zululand (b), and North (c) regions from 1995 to 2006.

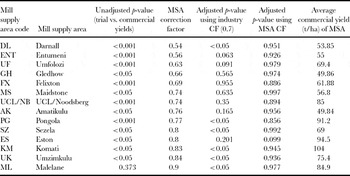
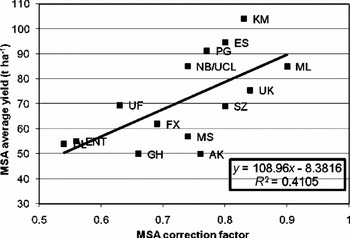
Analysis of trial and commercial yields within individual MSAs also indicated trial yields that were consistently and significantly (at least p < 0.05) higher than commercial yields in all but Malelane MSA (Table 1). When the trial and commercial datasets within each MSA were compared, correction factors ranged from 0.54 to 0.9 (Table 1). The general correction factor of 0.7 as well as these individual factors were applied to trial data at each MSA to determine which would be more successful in adjusting yields to corresponding commercial levels. In general, better correlations were obtained when the general factor of 0.7 was applied to the MSA trial yields, compared to those obtained using the individual MSA factors (Table 1). A significant linear relationship (y = 108.96x − 8.3816) was established between the individual correction factors and mean commercial yields within each MSA (Figure 5).
p-values when trial yields were compared to commercial yields without adjustment, with adjustment using the industry correction factor (CF) of 0.7, and with adjustment using the individual MSA CFs.

Relationship between average commercial yields and associated correction factors within mill supply areas.

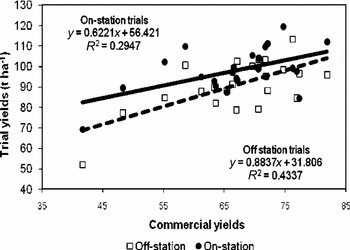
When trial yields were separated into on-station and off-station trials and compared with commercial yields, regression analyses indicated that off-station trials (R 2 = 0.43, regression coefficient = 0.88) exhibited a stronger correlation with commercial yields than on-station trials (R 2 = 0.29, regression coefficient = 0.62) (Figure 6). On-station trial yields were also generally higher than off-station yields over the 23-year comparison period.
Relationships between on-station trial yields, off-station trial yields and commercial yields.

DISCUSSION
The differences between trial and commercial yields observed in this study are in agreement with the findings of similar investigations (Bissessur et al., Reference Bissesur, Ramnawas and Ramdoyal2007; Davidson, Reference Davidson1962; Simmonds, Reference Simmonds1980). The differences may be attributed to a number of factors: of particular importance is the lower level of spatial variability within individual trial plots, as compared to large commercial fields within which areas of low yield can greatly affect the yield of the field as a whole (Milligan et al., Reference Milligan, Balzarini, Gravois and Bischoff2007). When trial plot yields are extrapolated, no consideration for the influence of such variability is accounted for. In addition, the nature of trial site selection and management also influences yields, with trials conducted on research stations generally receiving high levels of management, whilst sites for off-station trials are often selected on better-managed farms in the hope of increasing the likelihood of a reliable outcome.
The discrepancy between trial and commercial yields is also influenced by the lack of reliable commercial data (Walker and Simmonds, Reference Walker and Simmonds1981). Additionally, there are also differences in the methodologies of yield determination for trial and commercial purposes, with trial yields being determined in-field with specially designed weighing equipment, whereas commercial yields are usually determined using large-scale equipment at the factory. In the case of small plot variety trials, it is likely that newer, higher-yielding varieties will benefit from greater capture of resources (sunlight, water and nutrients), as compared to lower yielding varieties in neighbouring commercial fields. Such factors, however, cannot necessarily be controlled by researchers.
The mean factor of 0.7 for correcting trial to commercial yields determined in this study compares with factors of 0.86 and 0.76 determined for sugarcane by Bissessur et al. (Reference Bissesur, Ramnawas and Ramdoyal2007) and Davidson (Reference Davidson1962), respectively. In those studies, no attempt was made to apply these efficiencies as a correction factor for trial yields. The current study provides evidence that a correction of 0.7 is appropriate to adjust trial yields to realistic commercial levels at the industry as well as the regional level in the South African sugarcane industry. This correction factor should be applied (by researchers or extension specialists) to trial data that appears to exaggerate local productivity trends, thereby making data more acceptable to growers and assisting with commercial decisions concerning variety selection. The adjustment of trial data is a controversial issue, and for this reason it is suggested that growers should be made aware of the reasons for the consistent yield discrepancy, and be presented with actual and adjusted trial yields to facilitate better understanding in future.
For individual MSAs the correction factors calculated in this study should be viewed with caution. MSAs are smaller geographic units, and for any particular year the average trial yield for a particular area is represented by only one or two trials, and is therefore not representative of an entire MSA. The broad factor of 0.7 is therefore preferred, as it is based on a very wide range of production conditions. The analysis of individual MSAs was nevertheless useful in identifying the relationship between commercial yields and the calculated correction factors (Figure 5). This relationship suggests that in mill areas with high average commercial yields, trial yields correspond more accurately to commercial yields whilst in areas of lower potential, trial yields correspond less accurately to commercial yields. This implies that variety trials in the South African sugarcane industry give a better prediction of actual commercial performance under high potential conditions, as compared to lower potential conditions.
The analysis also revealed that off-station trial yields exhibited a stronger relationship with commercial yields. This is expected as off-station trials are conducted on growers’ commercial fields and are therefore more representative of the industry. This finding has resulted in a decision to move the focus of the VEP to off-station sites in the future.
Many studies comparing trial and commercial yields have concentrated on the ability of trials to predict the relative commercial performance of varieties (Bissessur et al., Reference Bissesur, Ramnawas and Ramdoyal2007; Walker and Simmonds, Reference Walker and Simmonds1981). In such studies it was found that annual differences in production (Simmonds, Reference Simmonds1980), differences between varieties chosen for the studies (Walker and Simmonds, Reference Walker and Simmonds1981), differences in management practices, and planting of varieties in conditions for which they were not necessarily bred and selected (Ellis et al., Reference Ellis, Basford, Leslie, Hogarth and Cooper2004) may confound the yield discrepancy between trial and commercial production. In view of these considerations, the strategy employed for this study was rather simple as such confounding factors were not considered (this is emphasized). Instead, historic trial and commercial data were compared holistically with no intention of investigating or fragmenting these factors. Rather, the focus of this study was to attempt to correct the discrepancy in order to make trial results more acceptable to growers. Much emphasis has been recently placed on cost savings and profitability within the South African sugarcane industry. Many researchers use trial results for costing exercises to promote best management practices or varieties. This study has shown that trial yields consistently exaggerate commercial production, implying that such costing exercises based on research results may be misleading to growers, and that in future a correction factor should be applied prior to such economic evaluations.
CONCLUSIONS
The purpose of this study is based on the theory that a simple discrepancy between trial and commercial yields can affect the mindset of growers to the extent that uptake of recommended varieties may be compromised. Trial data adjustment for the purposes of improving technology transfer is controversial; however, the application of such a technique for variety recommendations in particular should be considered, as the relative variety rankings (which will not be affected by the adjustment) are a more important consideration than actual yields. The outcomes of this study will be used to demonstrate the degree of disparity between trial and commercial yields to growers and extension specialists, together with reasons for such differences. It is envisaged that future variety recommendations in the South African sugarcane industry will involve the use of a correction factor when necessary in order to improve uptake of variety recommendations by growers. Possible effects of exaggerated trial yields on costing exercises will also be investigated in more detail.