1 Introduction
The interaction between viscous free-surface flows and topography has received considerable attention owing to its importance in a wide range of industrial and environmental contexts. These include the downslope migration of lava flows, which develop when liquid magma erupts from a volcano (Sparks, Pinkerton & Hulme Reference Sparks, Pinkerton and Hulme1976; Cashman, Kerr & Griffiths Reference Cashman, Kerr and Griffiths2006), ice flows over Greenland and Antarctica (Rignot, Mouginot & Scheuchl Reference Rignot, Mouginot and Scheuchl2011) and thin ‘coating’ flows in engine bearings, printing, painting and other manufacturing processes (Huppert Reference Huppert1982a ; Stillwagon & Larson Reference Stillwagon and Larson1988; Kistler & Schweizer Reference Kistler and Schweizer1997; Baxter et al. Reference Baxter, Power, Cliffe and Hibberd2009).
In many of these applications, the fluid flow is influenced by a range of complex physics and this has engendered much research. As an example, modelling lava is particularly challenging because it is a complex fluid; as it cools, lava becomes more viscous and subsequently solidifies, and has a yield strength that varies across time and space (Sparks et al. Reference Sparks, Pinkerton and Hulme1976; Griffiths Reference Griffiths2001; Takagi & Huppert Reference Takagi and Huppert2010). Slow travelling ice is often modelled as a non-Newtonian viscous fluid using a power-law model (Glenn Reference Glenn1955; Hutter Reference Hutter1982), whilst in thin coating flows over small obstacles such as adhered particles, surface tension plays a key role (Hansen Reference Hansen1986; Pozrikidis & Thoroddsen Reference Pozrikidis and Thoroddsen1991; Blyth & Pozrikidis Reference Blyth and Pozrikidis2006). There have also been experiments to determine the role of inertia in thin flows over topography (Pritchard, Scott & Tavener Reference Pritchard, Scott and Tavener1992). Many researchers simplify the flow physics by applying the lubrication approximation. Gaskell et al. (Reference Gaskell, Jimack, Sellier, Thompson and Wilson2004) demonstrated that this is often a good approximation even when it does not strictly apply (for example in flow over steep topographies).
The present study is primarily motivated by how lava flows interact with topography and how this informs the design of barriers. Lava flows can migrate into populated areas and cause significant damage to homes and infrastructure, costing millions of dollars to local economies (Williams & Moore Reference Williams and Moore1983; Barberi & Carapezza Reference Barberi and Carapezza2013). There have been attempts to construct barriers to divert lava flows, but these have had limited success (Colombrita Reference Colombrita1984; Scifoni et al. Reference Scifoni, Coltelli, Marsella, Proietti, Napoleoni, Vicari and Del Negro2010). Whilst there have been some numerical simulations and laboratory studies on controlling and diverting lava flows (Fujita et al. Reference Fujita, Hidaka, Goto and Umino2009; Dietterich et al. Reference Dietterich, Cashman, Rust and Lev2015), there has been little theoretical analysis of how effective barriers should be designed.
Kerr, Griffiths & Cashman (Reference Kerr, Griffiths and Cashman2006) suggested that the formation of crust at the lateral edges of a downslope lava flow confines the lava to a channel of constant width. Over a significant range of temperatures, lava behaves as a viscoplastic fluid, with internal stresses having a significant influence on its gravity-driven flow (see Balmforth, Craster & Sassi Reference Balmforth, Craster and Sassi2002). A key challenge for creating simplified models of lava is determining which of its non-Newtonian properties is the most important physical process in any given situation (Balmforth et al. Reference Balmforth, Burbidge, Craster, Salzig and Shen2000).
The interaction between a lava flow and topographical variations adds an extra layer of complexity to the modelling. In order to gain insight into the role of topography, we consider a simplified model of lava as an isothermal Newtonian fluid and since lava flows have large length scales relative to the capillary length, we can assume surface tension is negligible. Such viscous Newtonian flows have been studied in the absence of undulations on a horizontal plane by Huppert (Reference Huppert1982b ), and an inclined plane by Huppert (Reference Huppert1982a ) and Lister (Reference Lister1992), who showed that flow from a line source on an inclined plane becomes steady far behind the contact line where it advances with constant depth. These studies have been central to improving our understanding of lava flows and they have been used extensively.
We analyse how a steady downslope viscous flow is perturbed by topography and apply the results to inform optimal barrier construction. Larger topographical mounds can partition the flow and lead to ‘safe’ zones in their wake in which there is no fluid. Thus, along with determining the major features of the flow, a key aim of this paper is to ascertain the dimensions and strength of a barrier necessary to protect a particular location from a lava flow. An increased understanding of how lava flows over topography is also critical for our ability to use volcanic deposits for paleoclimate reconstructions (Edwards et al. Reference Edwards, Karson, Wysocki, Lev, Bindeman and Kueppers2013). The present work may also be of interest in other areas, such as the glass industry, coating flows and glacier dynamics.
The paper is structured as follows. In § 2, we adapt Lister’s governing equation for downslope viscous flows to incorporate the influence of topographical variations. This introduces dimensionless parameters that quantify the amplitude of the mound and the depth of the oncoming flow. We focus on the steady flow from a sustained source that develops at late times after the front has passed the topography and other transient effects have diminished. In § 3 we introduce a numerical scheme to simulate this steady problem. The results demonstrate that dry regions, in which there is no fluid, can occur for shallow flows past sufficiently large mounds.
To provide insights to the key physics of the problem, we first consider the simpler case of topography which varies only in the downslope direction in § 4. In this case, dry regions cannot develop. Ponding, where the flow becomes much deeper than its steady upstream depth, occurs upstream of any locations at which the gradient of the topography points upwards relative to the downwards direction of gravity. We find asymptotic expressions for the depth in the ponded region.
In § 5, we examine flow around topography that varies in both down and cross-slope directions and extend our asymptotic approach to the flow over and around an axisymmetric mound. The results show good agreement with our numerical simulations, providing both a useful validation of the numerical technique and significant insight into the dynamical controls of these flows. When the topography is everywhere coated by the fluid, there is mathematically an ‘inner region’ in which the flow is driven primarily by the topography and the downslope component of gravity, matched to an ‘outer region’ in which gradients of the hydrostatic pressure associated with the component of gravity normal to the slope become significant. The ‘inner’ expansion breaks down with the onset of dry regions. By reintroducing the diffusive slumping terms associated with the hydrostatic pressure gradients, we calculate the extent of the flow up the mound.
Finally, in order to apply the results to the problem of barrier construction, we consider a wide elliptical mound in § 6. Our asymptotic analysis can be used to determine the mound width and height and the upstream flow depth for which lava is diverted away from a downstream region. We also calculate an upper bound for the force exerted on the mound by the pond of lava.
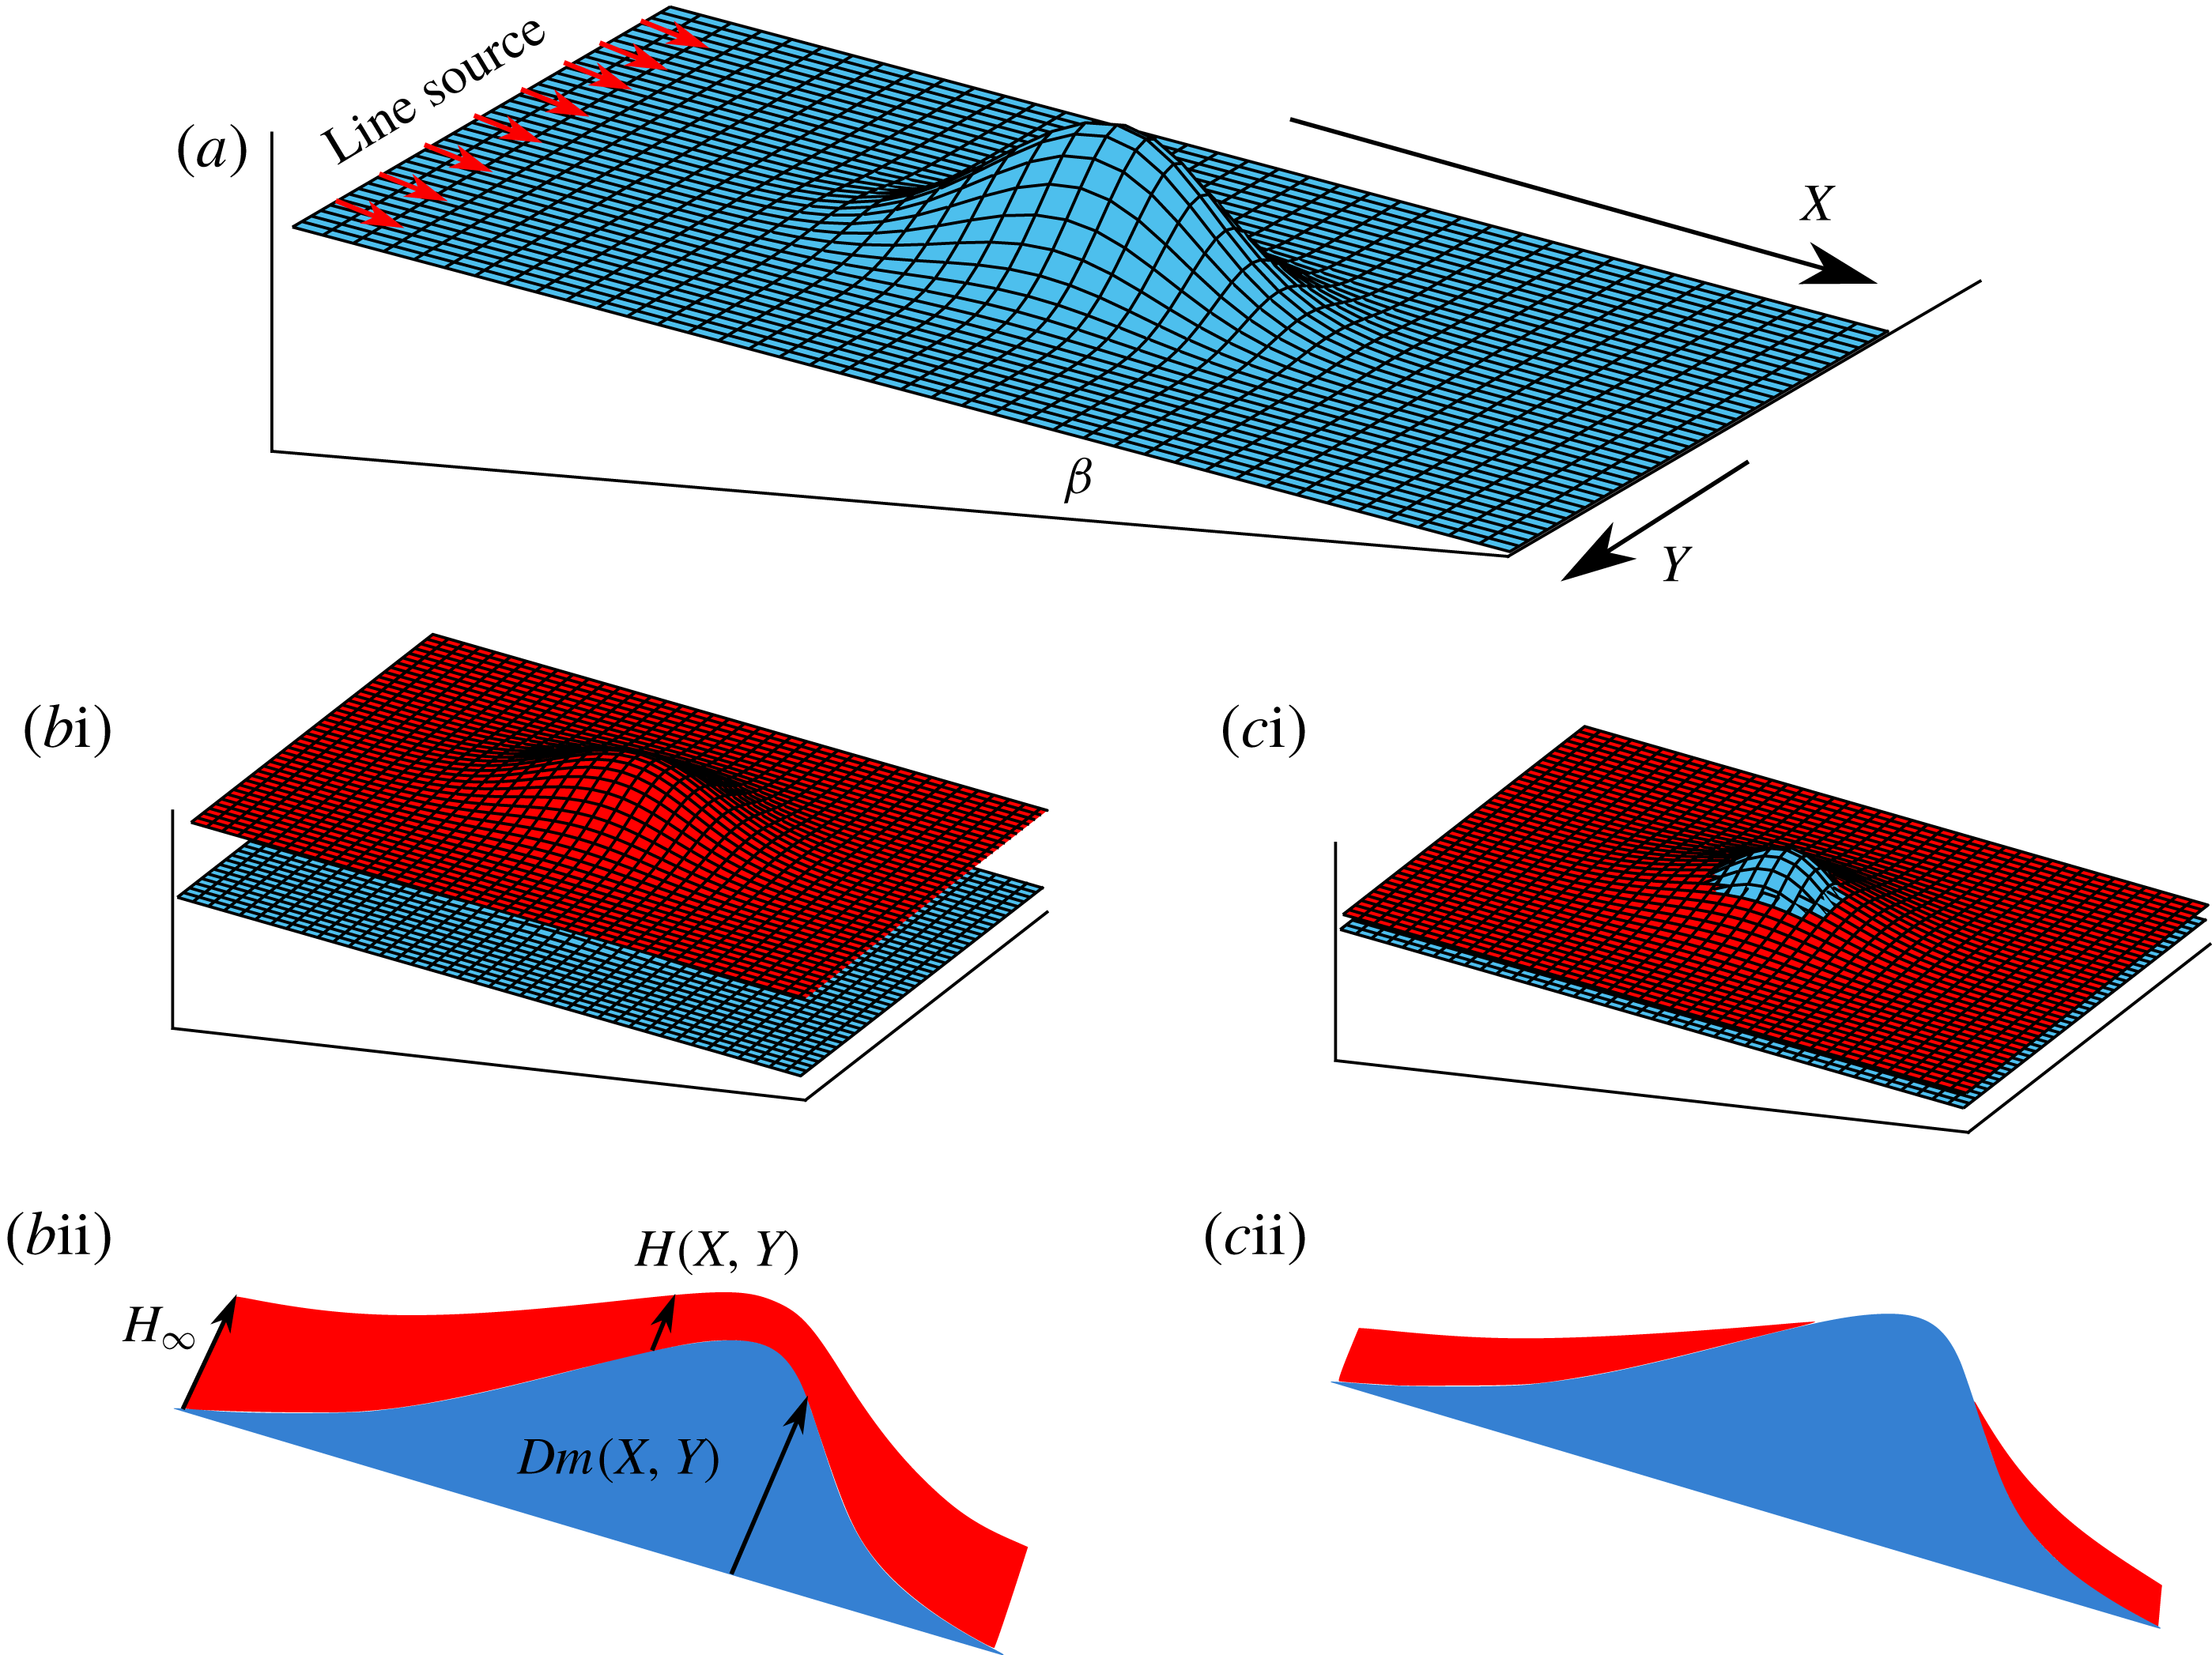
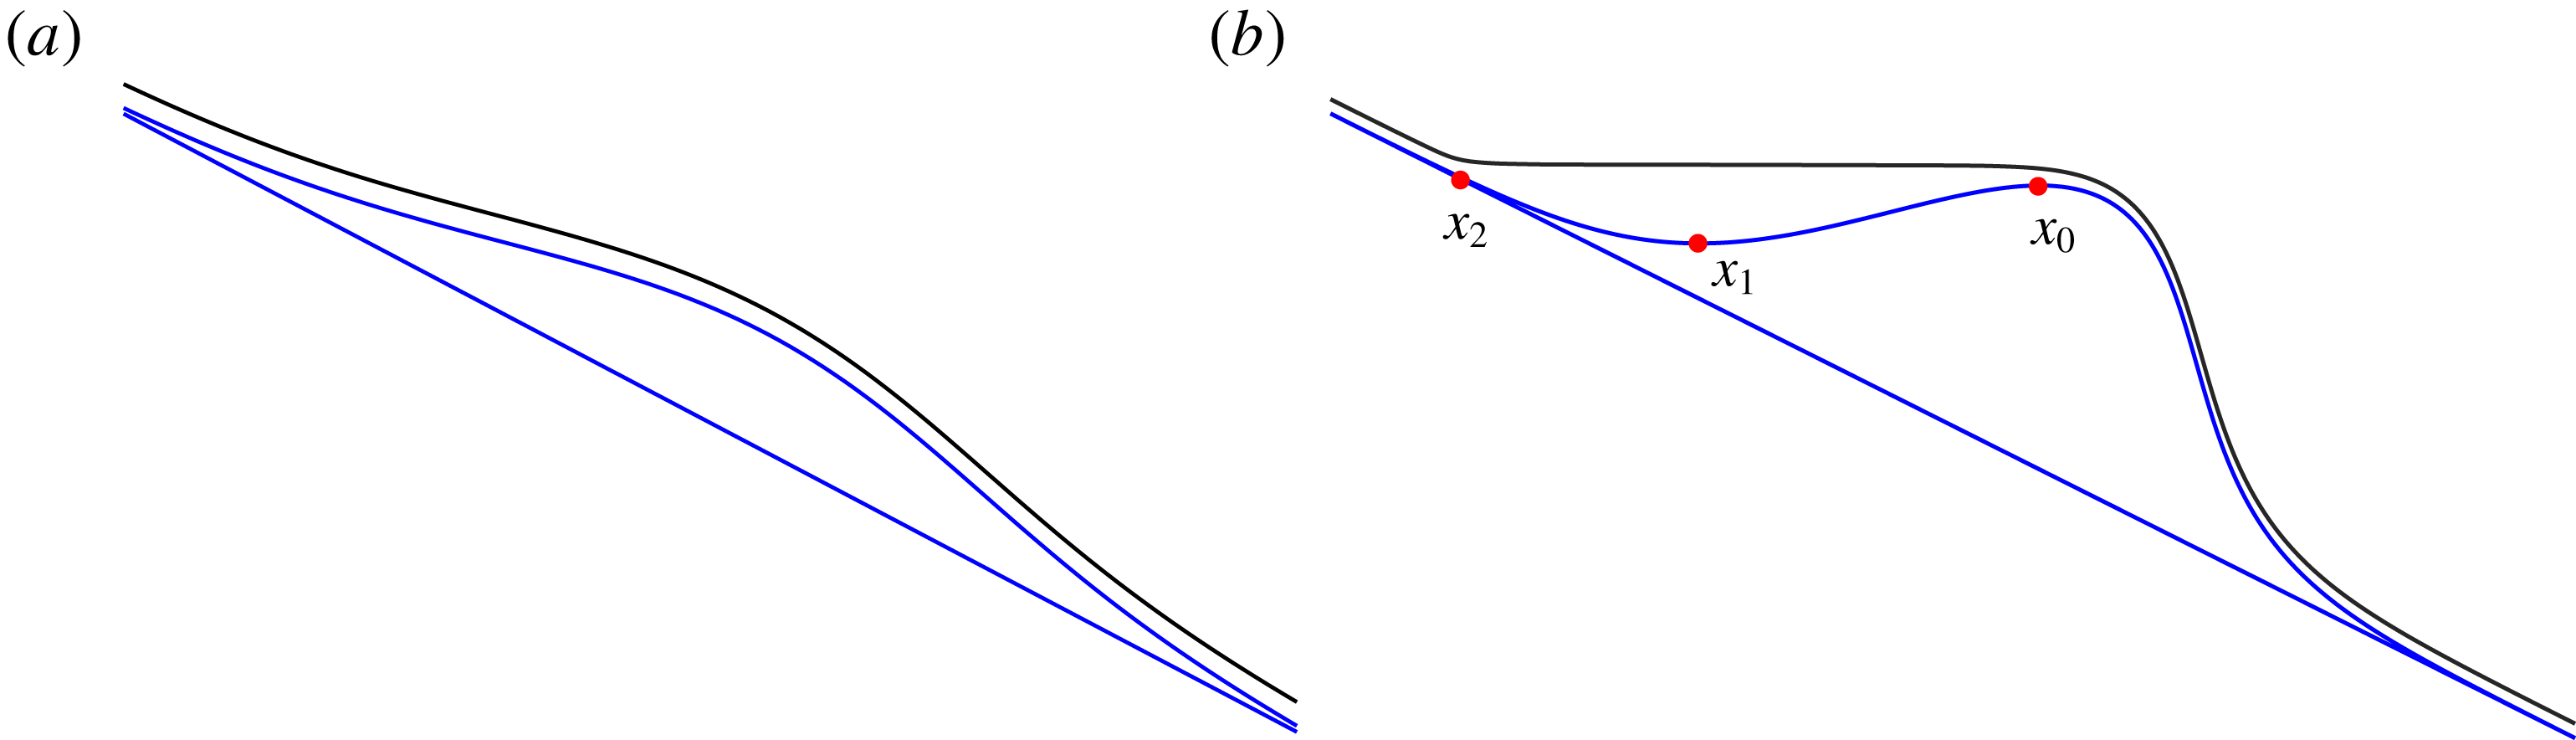
Schematic diagrams showing the steady flow over mounds. The topography is shown in blue whilst the flow surface is shown in red. (a) An example slope topography. (bi) Flow over a mound in the case where there is no dry region, (bii) cross-section in the
 $X$
direction along the line of symmetry. (ci) Flow around a mound in the case where there is a dry region at the top, (cii) cross-section in the
 $X$
direction.

2 Model
We consider the flow of a fluid of constant dynamic viscosity
 $\unicode[STIX]{x1D707}$
down a rigid inclined plane at an angle
 $\unicode[STIX]{x1D6FD}$
to the horizontal. We denote the downslope coordinate by
 $X$
, the cross-slope coordinate by
 $Y$
, the normal distance above the inclined plane by
 $Z$
and time by
 $T$
. A mound of height,
 $Dm(X,Y)$
(with height scale
 $D$
), is added to the plane (figure 1), where the maximum value of
 $m$
is
 $1$
. The thickness of the current is given by
 $H(X,Y,T)$
. We assume that the fluid is sufficiently viscous that the effects of both inertia and surface tension can be neglected (i.e. Reynolds and Bond numbers are sufficiently small). We further assume that the flow is predominantly parallel to the plane and hence the pressure,
 $P$
, within the fluid is hydrostatic (Batchelor Reference Batchelor1965),
 $$\begin{eqnarray}\displaystyle P=P_{0}+\unicode[STIX]{x0394}\unicode[STIX]{x1D70C}g[H(X,Y)+Dm(X,Y)-Z]\cos \unicode[STIX]{x1D6FD}, & & \displaystyle\end{eqnarray}$$
where
 $\unicode[STIX]{x0394}\unicode[STIX]{x1D70C}$
is the density difference between the fluid and the ambient and
 $P_{0}$
is the ambient pressure, assumed constant. The fluid velocity in the
 $X$
and
 $Y$
directions is given by
 $$\begin{eqnarray}\displaystyle & \displaystyle U=\frac{\unicode[STIX]{x0394}\unicode[STIX]{x1D70C}g}{2\unicode[STIX]{x1D707}}Z(Z-2H)\left[\left(\frac{\unicode[STIX]{x2202}H}{\unicode[STIX]{x2202}X}+D\frac{\unicode[STIX]{x2202}m}{\unicode[STIX]{x2202}X}\right)\cos \unicode[STIX]{x1D6FD}-\sin \unicode[STIX]{x1D6FD}\right], & \displaystyle\end{eqnarray}$$
 $$\begin{eqnarray}\displaystyle & \displaystyle V=\frac{\unicode[STIX]{x0394}\unicode[STIX]{x1D70C}g}{2\unicode[STIX]{x1D707}}Z(Z-2H)\left(\frac{\unicode[STIX]{x2202}H}{\unicode[STIX]{x2202}Y}+D\frac{\unicode[STIX]{x2202}m}{\unicode[STIX]{x2202}Y}\right)\cos \unicode[STIX]{x1D6FD}, & \displaystyle\end{eqnarray}$$
respectively (Lister Reference Lister1992). Local mass conservation is expressed by
 $$\begin{eqnarray}\displaystyle \frac{\unicode[STIX]{x2202}H}{\unicode[STIX]{x2202}T}+\frac{\unicode[STIX]{x2202}}{\unicode[STIX]{x2202}X}\left(\int _{0}^{H}U\,\text{d}Z\right)+\frac{\unicode[STIX]{x2202}}{\unicode[STIX]{x2202}Y}\left(\int _{0}^{H}V\,\text{d}Z\right)=0. & & \displaystyle\end{eqnarray}$$
Then using our expressions for the velocities (2.2) and (2.3), we obtain as the nonlinear partial differential equation governing the flow
 $$\begin{eqnarray}\displaystyle \frac{\unicode[STIX]{x2202}H}{\unicode[STIX]{x2202}T}+\frac{\unicode[STIX]{x0394}\unicode[STIX]{x1D70C}g\sin \unicode[STIX]{x1D6FD}}{3\unicode[STIX]{x1D707}}\frac{\unicode[STIX]{x2202}H^{3}}{\unicode[STIX]{x2202}X}=\frac{\unicode[STIX]{x0394}\unicode[STIX]{x1D70C}g\cos \unicode[STIX]{x1D6FD}}{3\unicode[STIX]{x1D707}}\unicode[STIX]{x1D735}\boldsymbol{\cdot }[H^{3}\unicode[STIX]{x1D735}(H+Dm)]. & & \displaystyle\end{eqnarray}$$
We consider a line source far upstream of the mound supplying a flux of
 $Q$
per unit width. Lister (Reference Lister1992) showed that after an initial transient and away from the contact line, the flow behind the front becomes steady and advances with constant depth
 $$\begin{eqnarray}\displaystyle H_{\infty }=\left(\frac{3\unicode[STIX]{x1D707}Q}{\unicode[STIX]{x0394}\unicode[STIX]{x1D70C}g\sin \unicode[STIX]{x1D6FD}}\right)^{1/3}. & & \displaystyle\end{eqnarray}$$
We consider the interaction between this flow and mounds with length scale
 $L$
measured parallel to the inclined plane and we assume that the channel is much wider than the mound so that it may be considered isolated. We note that the assumption of hydrostatic pressure (2.1) requires that the flow is shallow relative to the streamwise variation (
 $H_{\infty }\ll L$
). In terms of the parameters in the problem, the Reynolds and Bond numbers are
 $$\begin{eqnarray}\displaystyle Re=\frac{\unicode[STIX]{x0394}\unicode[STIX]{x1D70C}U^{2}/L}{\unicode[STIX]{x1D707}U/H_{\infty }^{2}}=\frac{H_{\infty }^{5}\unicode[STIX]{x0394}\unicode[STIX]{x1D70C}^{2}g}{L^{2}\unicode[STIX]{x1D707}^{2}},\quad Bo=\frac{\unicode[STIX]{x0394}\unicode[STIX]{x1D70C}gL^{2}}{\unicode[STIX]{x1D6FE}}, & & \displaystyle\end{eqnarray}$$
where the velocity scale is
 $U\sim \unicode[STIX]{x0394}\unicode[STIX]{x1D70C}gH_{\infty }^{3}/(\unicode[STIX]{x1D707}L)$
(see (2.2)) and
 $\unicode[STIX]{x1D6FE}$
is the coefficient of surface tension.
There are three length scales in the model: the mound amplitude,
 $D$
; the mound’s streamwise length scale,
 $L$
; and the depth of the flow far upstream,
 $H_{\infty }$
. We introduce the following dimensionless variables
 $$\begin{eqnarray}\displaystyle x=X/L,\quad y=Y/L,\quad z=Z/H_{\infty },\quad t=QT/LH_{\infty }. & & \displaystyle\end{eqnarray}$$
Using (2.5), we find the following governing equation for the dimensionless depth,
 $h(x,y,t)$
,
 $$\begin{eqnarray}\displaystyle \frac{\unicode[STIX]{x2202}h}{\unicode[STIX]{x2202}t}+\frac{\unicode[STIX]{x2202}h^{3}}{\unicode[STIX]{x2202}x}=\unicode[STIX]{x1D735}\boldsymbol{\cdot }[h^{3}\unicode[STIX]{x1D735}({\mathcal{F}}h+{\mathcal{M}}m)], & & \displaystyle\end{eqnarray}$$
where
 $$\begin{eqnarray}\displaystyle {\mathcal{F}}=\frac{H_{\infty }}{L\tan \unicode[STIX]{x1D6FD}}=\left[\frac{3\unicode[STIX]{x1D707}Q}{(\unicode[STIX]{x0394}\unicode[STIX]{x1D70C}g\sin \unicode[STIX]{x1D6FD})L^{3}\tan ^{3}\unicode[STIX]{x1D6FD}}\right]^{1/3} & & \displaystyle\end{eqnarray}$$
is a dimensionless proxy for the upstream flow depth. It quantifies the importance of the diffusive terms on the right-hand side of (2.9), associated with the gravity-driven slumping of the fluid, relative to the downslope advective term on the left-hand side of the same equation, associated with the gravity-driven flow down the plane. Also
 $$\begin{eqnarray}\displaystyle {\mathcal{M}}=\frac{D}{L\tan \unicode[STIX]{x1D6FD}}, & & \displaystyle\end{eqnarray}$$
which is the ratio of the characteristic gradient of the mound,
 $D/L$
, to the gradient of the inclined plane,
 $\tan \unicode[STIX]{x1D6FD}$
. Because there are three length scales in the problem, it is fully defined by the two dimensionless parameters,
 ${\mathcal{F}}$
and
 ${\mathcal{M}}$
.
To protect towns, barriers must be many hundreds of metres wide whilst the oncoming lava flows may have a depth of the order of metres. For a typical slope gradient of 10 to 20 %, we find that
 ${\mathcal{F}}\ll 1$
and we focus our attention on this limit and investigate the effect of varying the mound height through the parameter
 ${\mathcal{M}}$
.
We now describe the dimensionless mound topography,
 $m(x,y)$
. We begin our analysis by assuming that the mound is axisymmetric,
 $m=m(r)$
, where
 $r=\sqrt{x^{2}+y^{2}}$
. The peak dimensional height of the mound is
 $D$
and we take the origin in
 $x$
,
 $y$
coordinates to be at the peak of the mound, i.e.
 $m(0)=1$
. The mound height decays to zero away from the origin (
 $m\rightarrow 0$
as
 $r\rightarrow \infty$
). In §§ 3 and 5, we use
 $m=\exp (-r^{2})$
but our analysis applies to a more general class of mounds. We generalise this in § 6 to analyse non-axisymmetric mounds with elliptical contours.
Since we are interested, inter alia, in determining the shape of dry regions when they occur, we can simplify the governing equation by restricting our attention to the steady flow which occurs after the front of the current has passed the mound. In this case the governing equation is
 $$\begin{eqnarray}\displaystyle \frac{\unicode[STIX]{x2202}h^{3}}{\unicode[STIX]{x2202}x}=\unicode[STIX]{x1D735}\boldsymbol{\cdot }[h^{3}\unicode[STIX]{x1D735}({\mathcal{F}}h+{\mathcal{M}}m)]. & & \displaystyle\end{eqnarray}$$
The term on the left-hand side is associated with the component of gravity in the downslope direction, while the right-hand side represents the motion due to the gradients of hydrostatic pressure. The right-hand side comprises two terms: the first is due to gradients of the flow thickness; while the second encodes the force due to the underlying topography.
To determine the boundary condition as
 $r\rightarrow \infty$
, we note that sufficiently far away from the origin, the mound has negligible influence on the current and hence
 $H\rightarrow H_{\infty }$
from which we obtain
 $$\begin{eqnarray}\displaystyle h\rightarrow 1,\quad \text{as}~r\rightarrow \infty . & & \displaystyle\end{eqnarray}$$
The dimensionless flow velocity is given by
 $$\begin{eqnarray}\displaystyle \boldsymbol{u}=3z(z/2-h)[\unicode[STIX]{x1D735}({\mathcal{F}}h+{\mathcal{M}}m)-\boldsymbol{e}_{x}], & & \displaystyle\end{eqnarray}$$
where
 $\boldsymbol{e}_{x}$
is the unit vector in the
 $x$
direction.
3 Numerical technique
We used MATLAB’s Partial Differential Equation Toolbox™ to solve the steady governing equation (2.12). The program uses a finite-element method and performs adaptive mesh generation. We take the first guess to be
 $h=1$
everywhere and then iterate to determine the steady solution that is influenced by the topography.
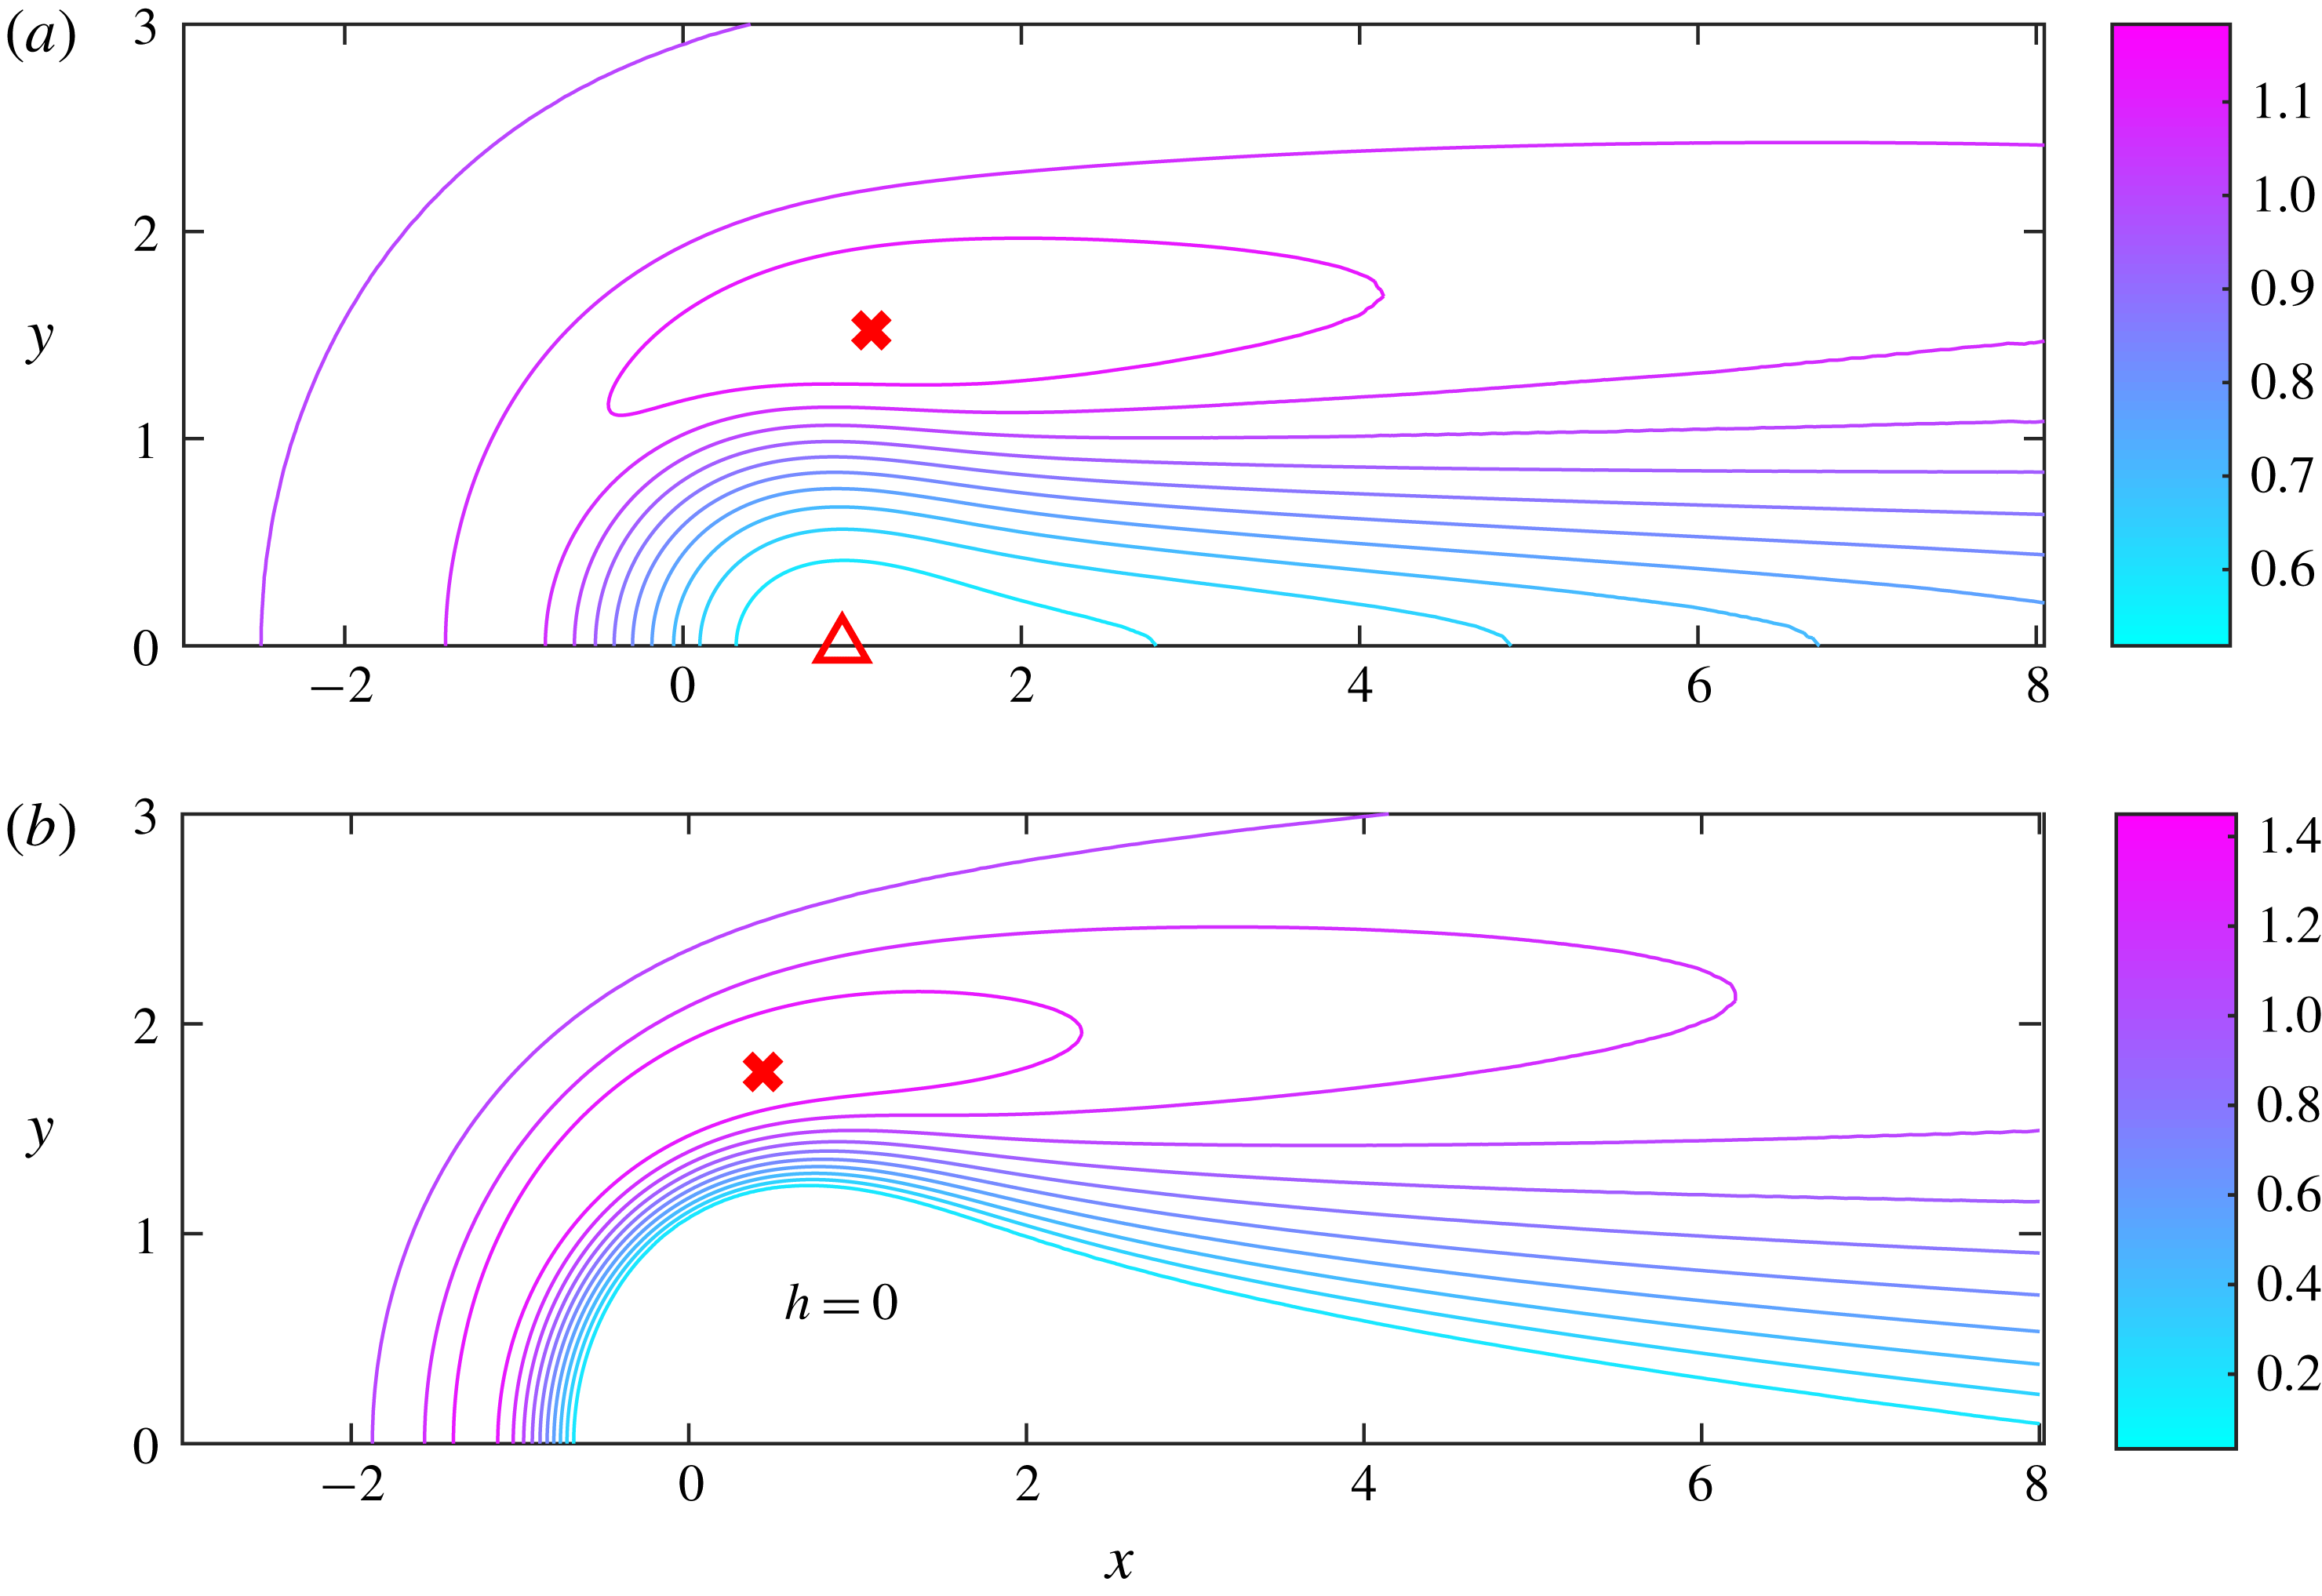
Contour plots of the thickness of the steady flow above the topography of shape
 $m=\exp (-r^{2})$
and of different dimensionless magnitudes,
 ${\mathcal{M}}$
. (a)
 ${\mathcal{F}}=0.1$
and
 ${\mathcal{M}}=0.5$
, the red cross marks the maximum thickness (
 $h=1.183$
) and the red triangle marks the minimum thickness (
 $h=0.519$
). (b)
 ${\mathcal{F}}=0.1$
and
 ${\mathcal{M}}=1.5$
, the red cross marks the maximum thickness (
 $h=1.463$
) and there is a region in which
 $h=0$
. As the mound height is increased, dry regions occur. Note that the mound is centred at the origin of the (
 $x$
,
 $y$
) plane.

The problem is symmetric about the centreline
 $y=0$
so computational effort is reduced by using a half-domain. We solve the governing equation on the domain
 $0<y<c$
,
 $a<x<b$
(where
 $a<0$
) with boundary conditions described as follows. The upstream line source supplies constant flux so
 $h(x=a)=1$
. We allow ‘free flow’ on the other three boundaries which corresponds to
 $\unicode[STIX]{x2202}h/\unicode[STIX]{x2202}n=0$
. For each pair
 ${\mathcal{F}}$
,
 ${\mathcal{M}}$
, we run our numerical technique on a particular domain and subsequently increase the domain size until the results become independent of further increases. For example, with
 ${\mathcal{F}}=0.1$
and
 ${\mathcal{M}}=0.5$
, we used
 $a=-6$
,
 $b=26$
and
 $c=5$
. A contour plot of the thickness of the flow is shown in figure 2(a).
The minimum thickness of the current decreases as the mound height is increased through the parameter
 ${\mathcal{M}}$
or as the upstream flow depth is decreased through the parameter
 ${\mathcal{F}}$
. For sufficiently large mounds, dry regions in which the flow depth vanishes (
 $h=0$
) can occur (see figure 2
b). In the regime of very shallow upstream flow (
 ${\mathcal{F}}\ll 1$
), the critical mound height beyond which dry regions occur is
 ${\mathcal{M}}_{c}\approx 1.17$
for
 $m=\exp (-r^{2})$
. This critical height is derived using asymptotic analysis in § 5, where we also discuss its physical significance.
The original numerical scheme was not effective when there were dry regions. The diffusive term in the partial differential equation (2.12) is
 $\unicode[STIX]{x1D735}\boldsymbol{\cdot }(h^{3}\unicode[STIX]{x1D735}h)$
. The nonlinear diffusion coefficient is
 $h^{3}$
, which is degenerate as
 $h\rightarrow 0$
. There are large gradients in
 $h$
near the dry regions and these are unable to be resolved by the numerical scheme and can lead to spurious and inadmissible regions of
 $h<0$
.
We therefore introduced a small source upstream of the mound to provide a ‘virtual’ thin film over the dry region to combat this difficulty. The governing equation is adjusted to
 $$\begin{eqnarray}\displaystyle \frac{\unicode[STIX]{x2202}h^{3}}{\unicode[STIX]{x2202}x}=\unicode[STIX]{x1D735}\boldsymbol{\cdot }[h^{3}\unicode[STIX]{x1D735}({\mathcal{F}}h+{\mathcal{M}}m)]+\unicode[STIX]{x1D716}(x,y), & & \displaystyle\end{eqnarray}$$
where
 $\unicode[STIX]{x1D716}(x,y)=\unicode[STIX]{x1D716}_{0}\exp [-(x+1)^{2}-y^{2}]$
. The magnitude of the source,
 $\unicode[STIX]{x1D716}_{0}$
, was minimized subject to the constraint that the thin film coats the dry region. The flow’s thickness is everywhere
 $h>0$
and the problem can be solved as described above. The edge of the dry region can be determined by analysing where the flow thickness increases from its approximately constant value in the thin film. For figure 2(b) with
 ${\mathcal{F}}=0.1$
and
 ${\mathcal{M}}=1.5$
, we used
 $\unicode[STIX]{x1D716}_{0}=0.008$
(smaller
 $\unicode[STIX]{x1D716}_{0}$
led to regions with
 $h<0$
in the numerical results). We found that doubling the source magnitude to
 $\unicode[STIX]{x1D716}_{0}=0.016$
increased the max depth by less than 0.1 %, which demonstrates that the results from this virtual source method are highly accurate.
The ‘dry’ region is coated in fluid owing to the ‘virtual’ source. Within the thin film of ‘virtual’ fluid, the depth is approximately constant but there are large gradients in
 $h$
at the boundary of the film zone. The large gradients provide the location of the boundary of the ‘dry’ region and we set
 $h=0$
inside this region (see figure 2
b).
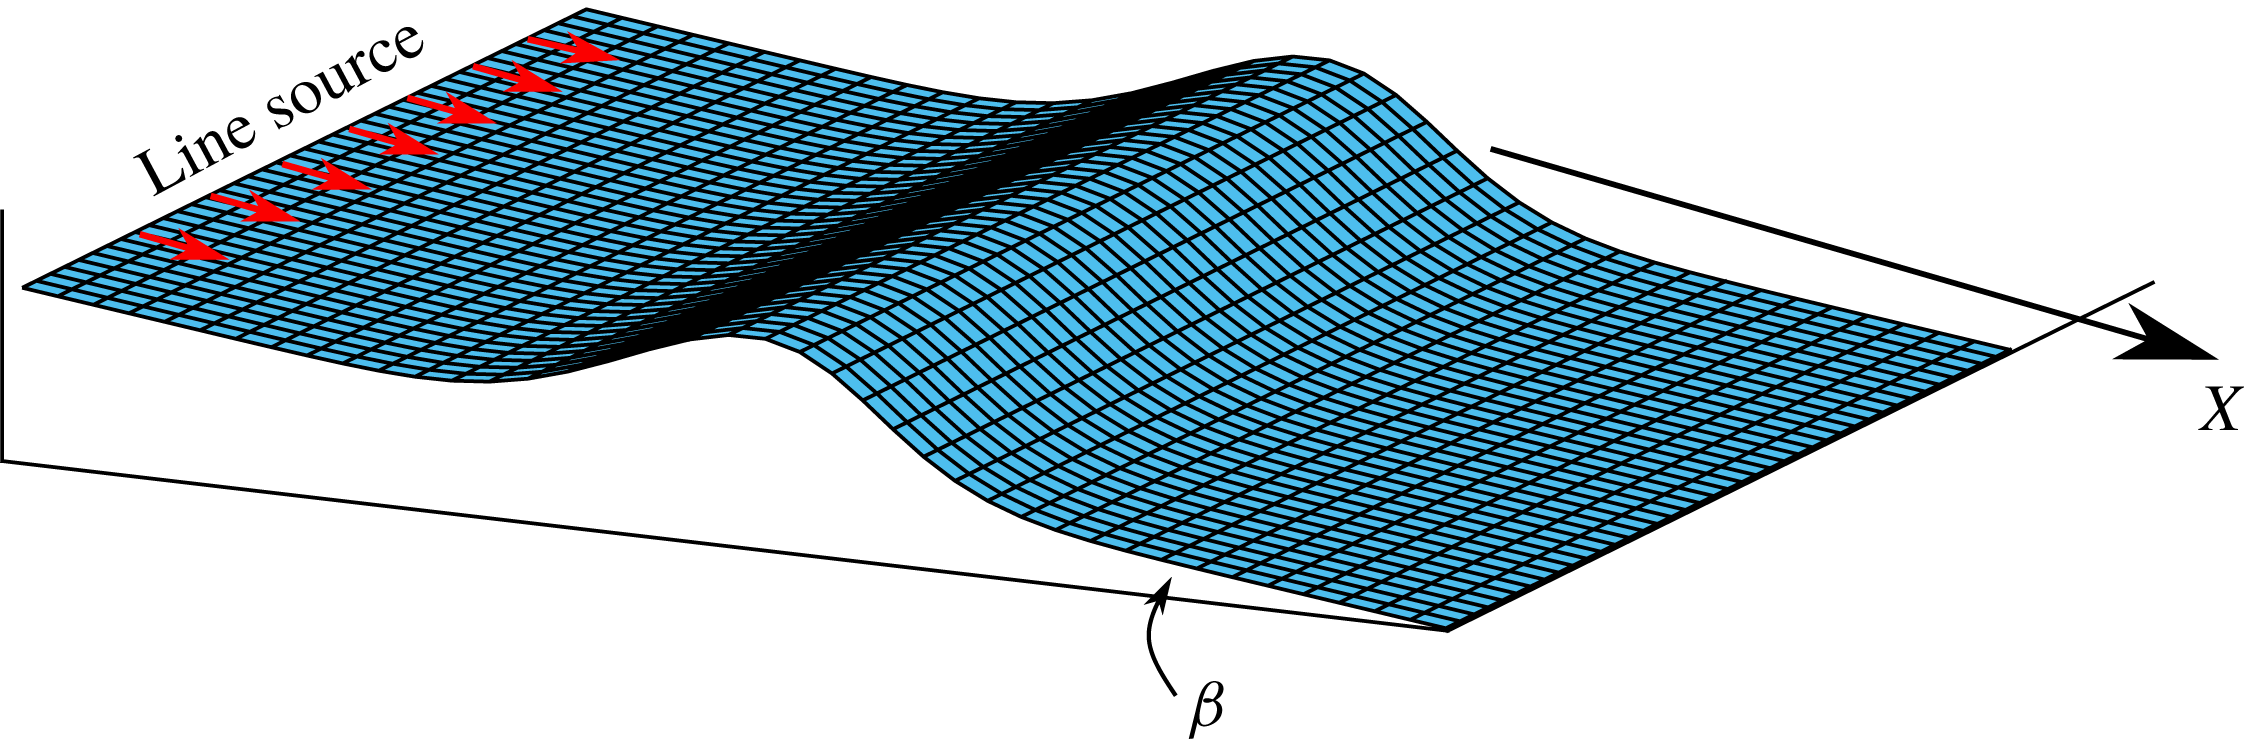
We now compute the flow thickness for a wide range of two-dimensional topographies. Asymptotic analysis can help interpret the results of these computations, but before launching into this analysis it is helpful to study the one-dimensional case of flow over a mound which spans the channel in the
 $y$
direction;
 $m=\exp (-x^{2})$
(see figure 3). Although dry zones are not possible in this one-dimensional problem due to the imposition of a constant volume flus, this problem provides valuable insights into the important aspects of the problem.
4 Flow over one-dimensional mounds
For flow over a one-dimensional mound (as depicted in figure 3), the steady governing equation (2.12) simplifies to
 $$\begin{eqnarray}\displaystyle \frac{\text{d}h^{3}}{\text{d}x}=\frac{\text{d}}{\text{d}x}\left[h^{3}\left({\mathcal{F}}\frac{\text{d}h}{\text{d}x}+{\mathcal{M}}\frac{\text{d}m}{\text{d}x}\right)\right]. & & \displaystyle\end{eqnarray}$$
Mass conservation demands that the flow must all go over the bump and hence dry regions cannot occur, in contrast to the two-dimensional problem in which the flow may be entirely deflected around the topography. Since the flow is steady, the downstream flux per unit width is constant everywhere and determined by the source injection. This condition can be written as
 $$\begin{eqnarray}\displaystyle \int _{0}^{h}u(x,z)\,\text{d}z=h^{3}\left(1-{\mathcal{F}}\frac{\text{d}h}{\text{d}x}-{\mathcal{M}}\frac{\text{d}m}{\text{d}x}\right)=1, & & \displaystyle\end{eqnarray}$$
where
 $u$
is the flow velocity, given by the
 $x$
-component of (2.14). The condition (4.2) cannot be satisfied if
 $h=0$
and hence requires that
 $h>0$
everywhere in the steady flow over a one-dimensional mound; that is there are no dry regions possible.
Schematic diagram showing a ‘one-dimensional’ mound topography which varies only in the
 $X$
direction.

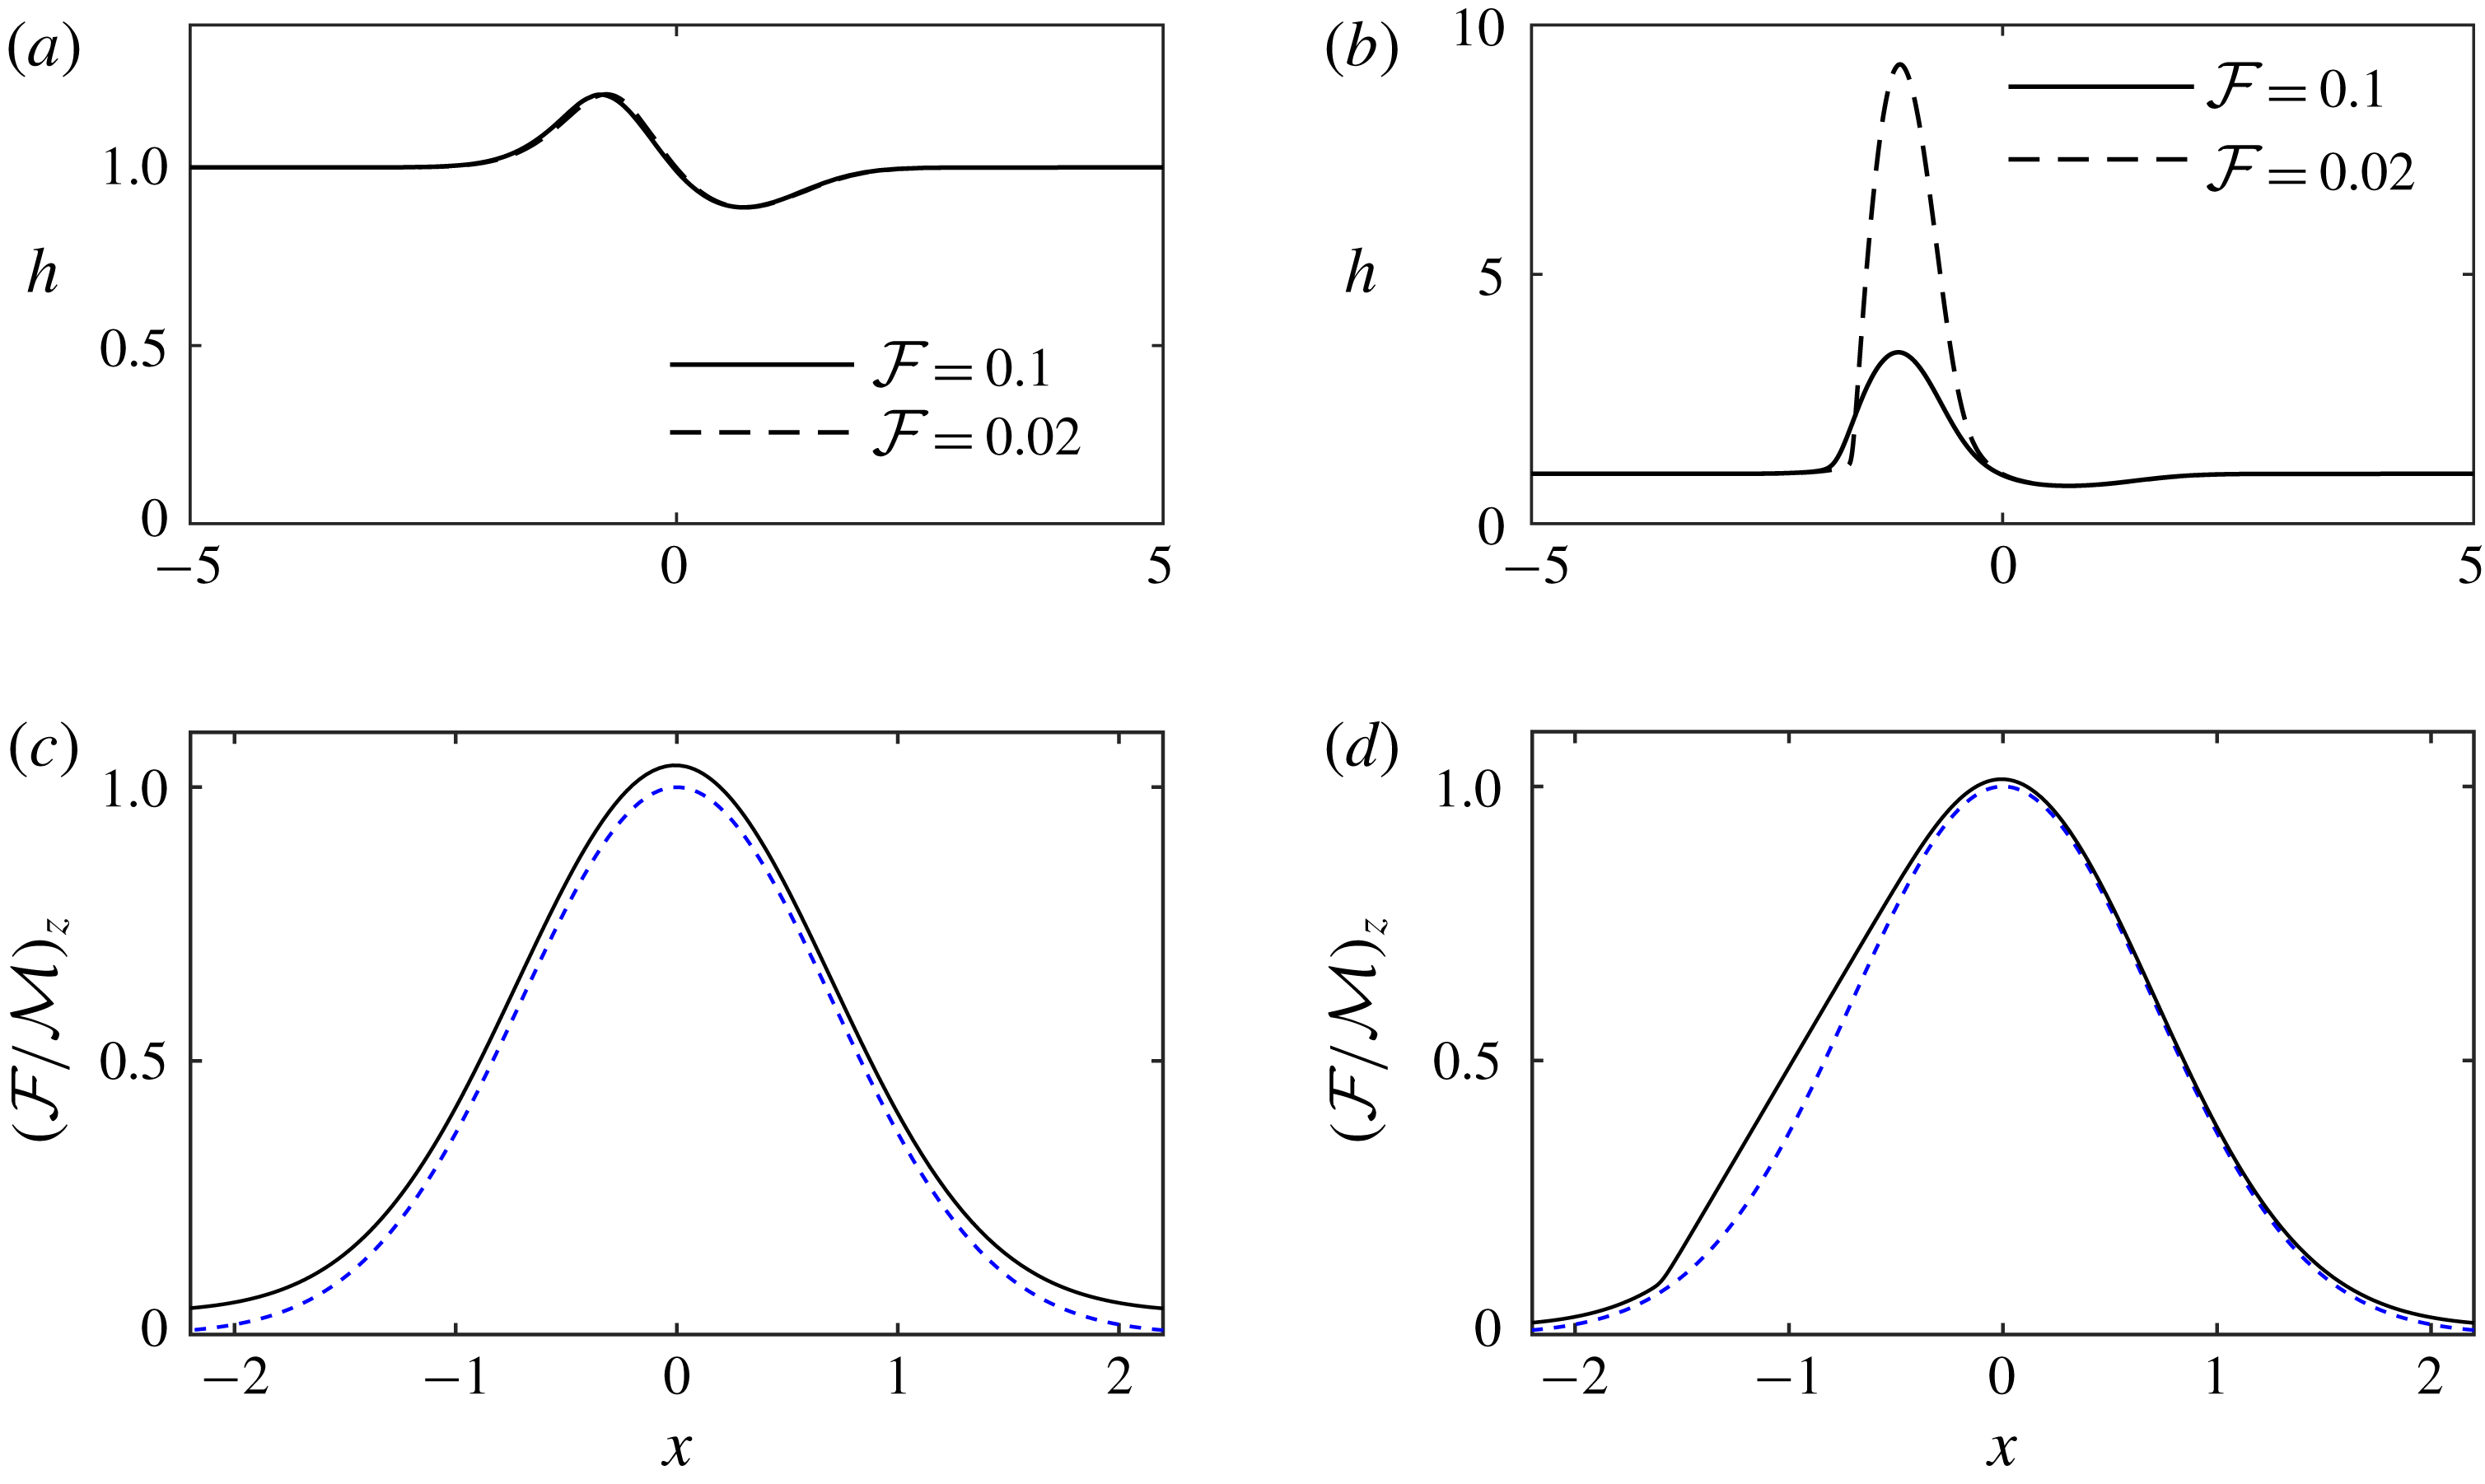
The profiles of the steady flow over the one-dimensional mound,
 $m(x)=\exp (-x^{2})$
, as a function of streamwise distance,
 $x$
. (a) Numerical solutions to (4.3) for
 ${\mathcal{M}}=0.5$
and two shallow oncoming flows,
 ${\mathcal{F}}=0.1$
and
 ${\mathcal{F}}=0.02$
. (b) Solutions for a larger mound,
 ${\mathcal{M}}=1.5$
. The solution is no longer independent of
 ${\mathcal{F}}$
to leading order. (c) The flow thickness relative to the height of the topography corresponding to
 ${\mathcal{F}}=0.02$
in (a). The vertical axis has been scaled so that the mound height is unity. (d) The flow thickness relative to the topography corresponding to
 ${\mathcal{F}}=0.02$
in (b). In both (c) and (d), the surface of the flow is plotted with a continuous line, while the mound is plotted with a dotted line. The fluid ‘ponds’ upstream of the mound; the flow surface is horizontal in coordinates parallel and perpendicular to the direction of gravity (see figure 5).

We can integrate (4.1), or use the constant flux condition (4.2), to obtain the following first-order differential equation for
 $h(x)$
 $$\begin{eqnarray}\displaystyle h^{3}\left[1-{\mathcal{M}}\frac{\text{d}m}{\text{d}x}\right]=1+{\mathcal{F}}h^{3}\frac{\text{d}h}{\text{d}x}. & & \displaystyle\end{eqnarray}$$
The numerical solution of (4.3) depends upon the shape of the mounds, given by
 $m(x)$
. We solve (4.3) together with the far-field boundary condition
 $h\rightarrow 1$
as
 $x\rightarrow \pm \infty$
, which demands that the flow returns to its unperturbed steady state far from the mound. In principle, we could impose the depth of the flow at some distant upstream location,
 $h(-{\mathcal{L}})=1$
, where
 ${\mathcal{L}}$
is positive and
 ${\mathcal{L}}\gg 1$
. However, in this case numerical integration downstream generates numerical instability and exponential growth in
 $h(x)$
. Instead, we impose the condition at a downstream location,
 $h({\mathcal{L}})=1$
, and then straightforwardly numerically integrate to upstream locations, ensuring that the computed solution does not depend upon the magnitude of
 ${\mathcal{L}}$
. In figure 4 we have plotted our numerical results for some shallow flows (
 ${\mathcal{F}}\ll 1$
). The numerical results exhibit a qualitative change in behaviour as
 ${\mathcal{M}}$
is increased past a critical value,
 ${\mathcal{M}}_{c}$
, which will be determined below (see figure 4
a where
 ${\mathcal{M}}=0.5$
and figure 4
b where
 ${\mathcal{M}}=1.5$
). For
 ${\mathcal{M}}>{\mathcal{M}}_{c}$
, the flow develops a deep ‘pond’ of fluid upstream of the mound.
We illustrate the qualitative change in behaviour in figure 5. Increasing the mound height beyond a critical value,
 ${\mathcal{M}}_{c}$
, leads to a region in which the topography is upslope (between
 $x_{1}$
and
 $x_{0}$
in figure 5
b). The qualitative change in behaviour occurs at
 ${\mathcal{M}}_{c}$
because the current cannot flow up a slope, even with a very shallow gradient, until sufficient fluid has accumulated in a pond to overtop the highest part of the slope. This is because the flow is shallow and viscously controlled, with inertia playing only a negligible role.
The critical mound height,
 ${\mathcal{M}}_{c}$
, corresponds to a mound at which the topography first becomes horizontal at a single point. This can be seen by noting that the gradient of the topography relative to gravity is given by (cf. (2.2))
 $$\begin{eqnarray}\displaystyle (D/L)m^{\prime }(x)-\tan \unicode[STIX]{x1D6FD}=-\tan \,\unicode[STIX]{x1D6FD}[1-{\mathcal{M}}m^{\prime }(x)]. & & \displaystyle\end{eqnarray}$$
For the case
 $m=\exp (-x^{2})$
, the expression
 $1-{\mathcal{M}}m^{\prime }(x)$
is strictly positive provided that
 $$\begin{eqnarray}\displaystyle {\mathcal{M}}<{\mathcal{M}}_{c}=(e/2)^{1/2}\approx 1.16\ldots & & \displaystyle\end{eqnarray}$$
and hence there are no regions of upslope topography in this case. For
 ${\mathcal{M}}>{\mathcal{M}}_{c}$
, the expression,
 $1-{\mathcal{M}}m^{\prime }(x)$
, is negative in a region which we label
 $x_{1}<x<x_{0}$
(see figure 5
b).
Cartoons of the two flow regimes: (a)
 ${\mathcal{M}}<{\mathcal{M}}_{c}$
and (b)
 ${\mathcal{M}}>{\mathcal{M}}_{c}$
. At the points
 $x_{1}$
and
 $x_{0}$
, the topography is horizontal with an inflection point in between. The ‘pond’ re-joins the regular expansion at the upstream point
 $x_{2}$
.

Figure 4(a) suggests that for sufficiently small mound heights,
 ${\mathcal{M}}$
, the flow thickness is of order unity throughout the domain in the regime
 ${\mathcal{F}}\ll 1$
, because the motion is predominantly driven by the downslope component of gravity and the contribution due to the gradient of hydrostatic pressure is negligible. This motivates a regular expansion,
 $h_{R}(x)$
, in terms of the small parameter
 ${\mathcal{F}}$
 $$\begin{eqnarray}\displaystyle h\equiv h_{R}(x)=h_{0}(x)+{\mathcal{F}}h_{1}(x)+\cdots \,. & & \displaystyle\end{eqnarray}$$
The governing equation (4.3) together with the far-field boundary condition
 $h\rightarrow 1$
can be used to determine
 $$\begin{eqnarray}\displaystyle h_{0}=[1-{\mathcal{M}}m^{\prime }(x)]^{-1/3},\quad h_{1}={\mathcal{M}}m^{\prime \prime }(x)[1-{\mathcal{M}}m^{\prime }(x)]^{-8/3}/9, & & \displaystyle\end{eqnarray}$$
and the first two terms in the expansion for
 $h$
are
 $$\begin{eqnarray}\displaystyle h\sim [1-{\mathcal{M}}m^{\prime }(x)]^{-1/3}+{\mathcal{F}}{\mathcal{M}}m^{\prime \prime }(x)[1-{\mathcal{M}}m^{\prime }(x)]^{-8/3}/9+\cdots \,. & & \displaystyle\end{eqnarray}$$
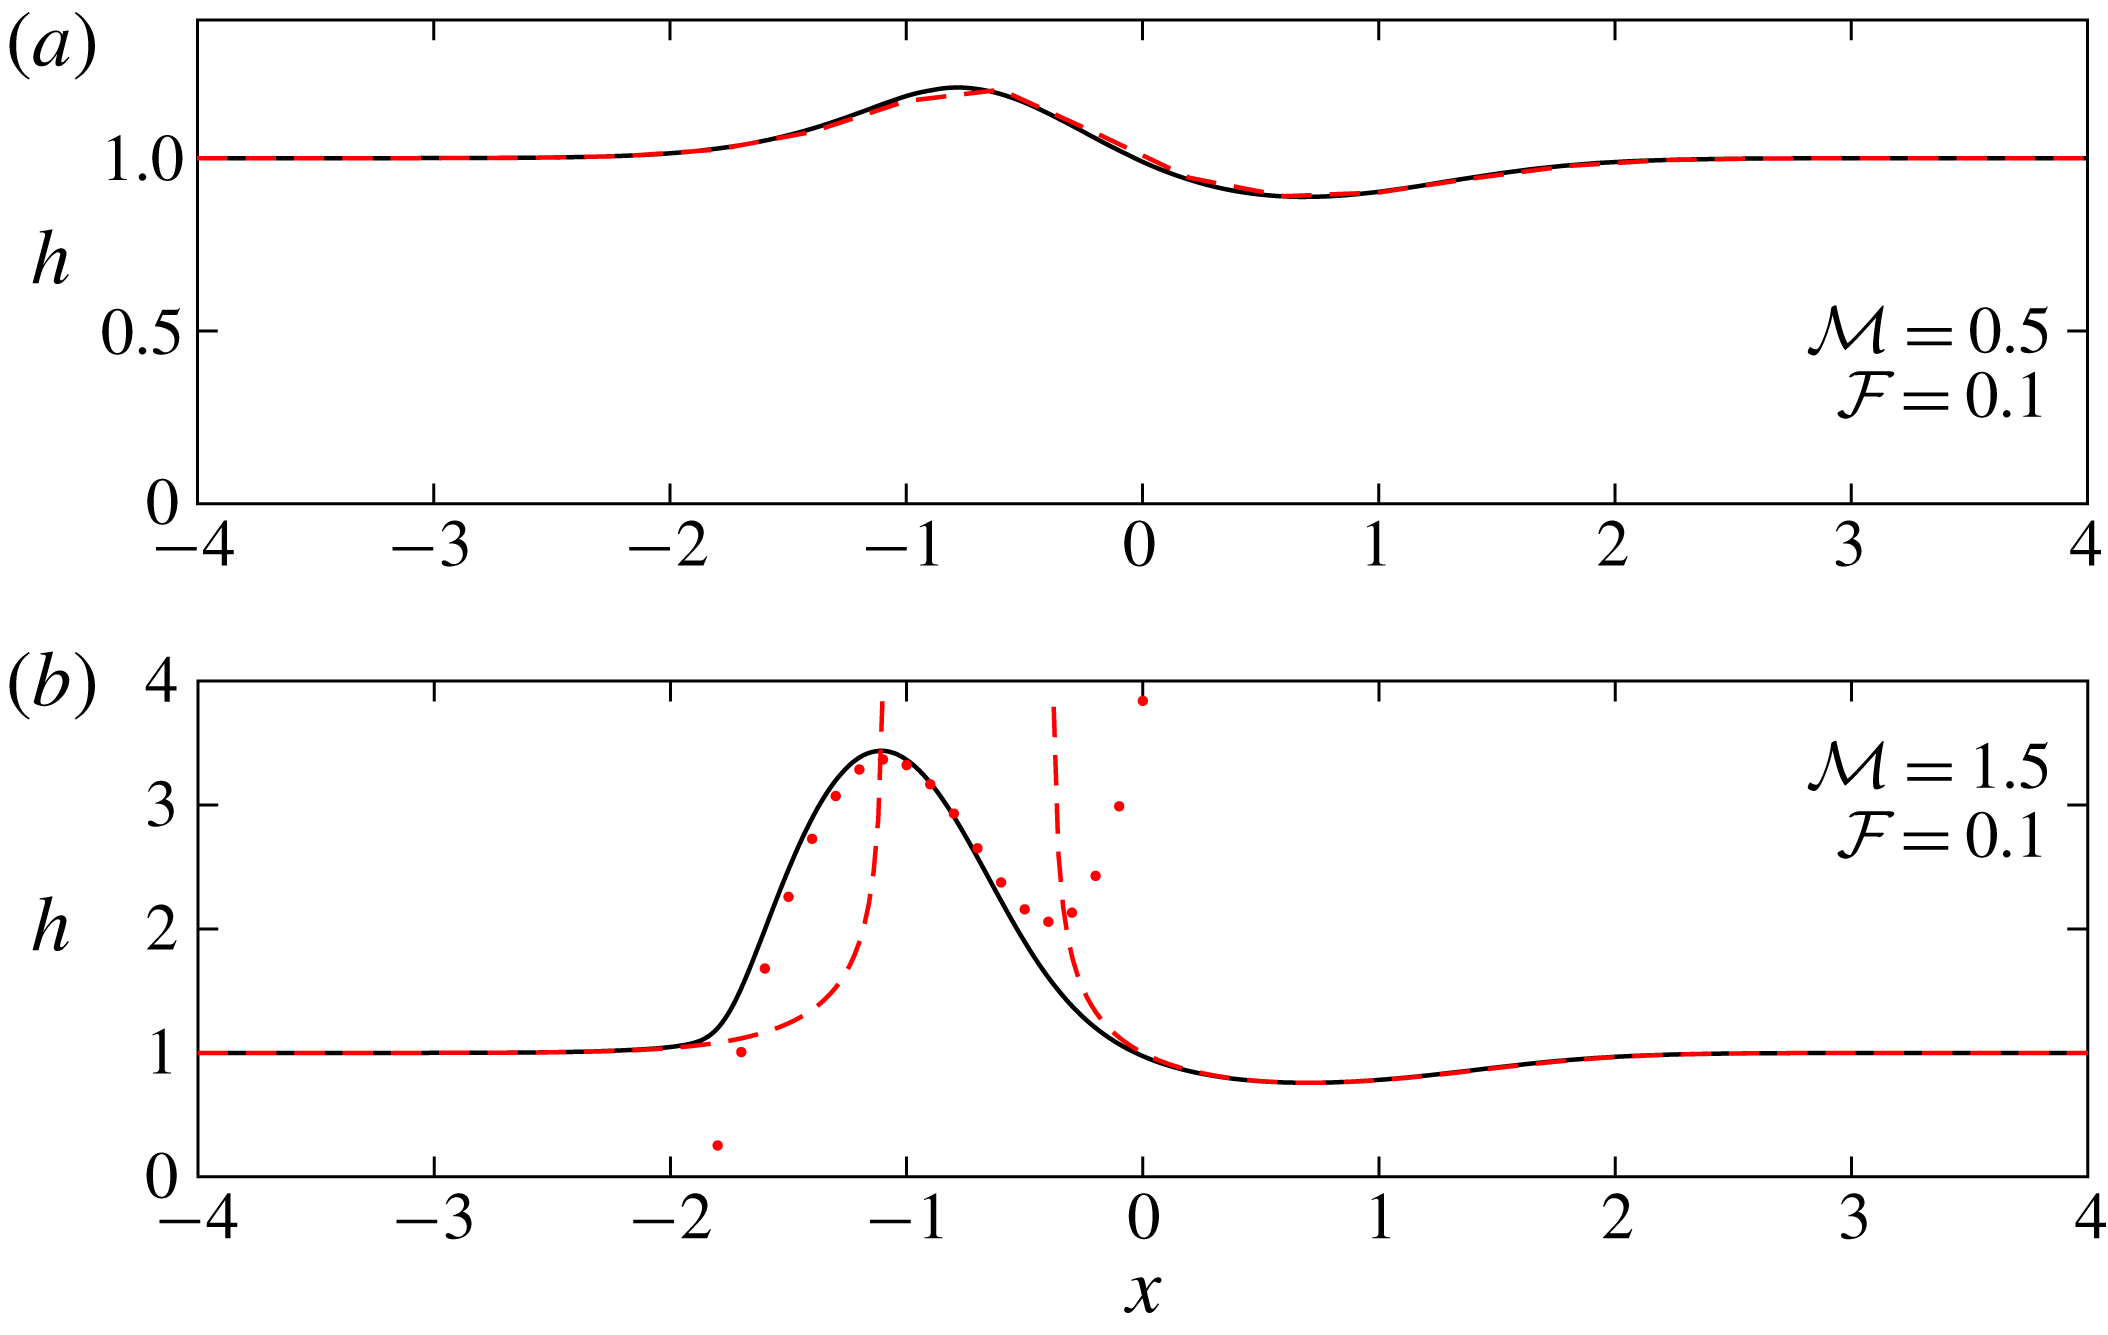
This expansion is plotted as a red dashed line in figure 6(a) for
 ${\mathcal{F}}=0.1$
and
 ${\mathcal{M}}=0.5$
. It shows excellent agreement with the numerical solution, which is plotted as a continuous black line. Equation (4.8) predicts that the flow thickness at leading order is independent of
 ${\mathcal{F}}$
, which agrees with the numerical solutions in figure 4(a).
Figure 6(b) illustrates that for a larger mound (
 ${\mathcal{M}}=1.5$
), there is a deep region in which our expansion (4.8) does not agree with the numerical results; this indicates that a different approach is required. The solution for
 $h_{R}(x)$
is invalid because it becomes singular if there is a solution to the equation
 $$\begin{eqnarray}\displaystyle 1-{\mathcal{M}}m^{\prime }(x)=0. & & \displaystyle\end{eqnarray}$$
For
 ${\mathcal{M}}>{\mathcal{M}}_{c}$
, there are two (negative) solutions to (4.9), which we label
 $x_{1}<x_{0}<0$
and (4.8) no longer provides a complete asymptotic solution for the depth of the fluid layer over the entire domain (see figure 5). Our expansion (4.8) is valid for
 ${\mathcal{M}}<{\mathcal{M}}_{c}$
, and in this case the solution is accurately provided by (4.8), as illustrated by figure 4(a). However, for larger mounds it is not asymptotic near
 $x_{0}$
and
 $x_{1}$
; the second term in (4.8) is more singular than the first, and thus a new expansion is required.
The thickness of the flow as a function of streamwise distance, showing the comparison between the numerical solutions (continuous black lines) and asymptotic approximations found in § 4. (a) For the smaller mound regime (
 ${\mathcal{M}}=0.5$
), the
 $O(1)$
expansion given by (4.8) and plotted as a red dashed line is accurate everywhere. (b) For a larger mound (
 ${\mathcal{M}}=1.5$
), the
 $O(1)$
expansion is not valid in the large depth region and is in fact singular here. We plot the
 $O({\mathcal{F}}^{-1})$
expansion (4.18) in red dots, noting that this is valid only within the ponded region and is matched to the regular expansion outside of this zone.

To determine the revised asymptotic form of the solution in the regime
 ${\mathcal{M}}>{\mathcal{M}}_{c}$
, we return to the governing equation (4.3). We note that the regular asymptotic series (4.8) was derived on the basis that the gradient of the flow thickness was negligible. As the singular points of the regular series are approached (namely,
 $x=x_{0}$
and
 $x=x_{1}$
), it is no longer the case that the gradients are negligible; instead they play a leading order role in the form of the solution. This motivates a different asymptotic expansion in the ‘ponded’ region, close to but upstream of the peak of the mound, within which the flow is relatively thick. In the ponded region we write
 $$\begin{eqnarray}\displaystyle h\equiv h_{p}(x)={\mathcal{F}}^{-1}{\hat{h}}_{-1}+\unicode[STIX]{x1D6FE}({\mathcal{F}}){\hat{h}}_{0}+\cdots \,, & & \displaystyle\end{eqnarray}$$
where
 $\unicode[STIX]{x1D6FE}({\mathcal{F}})\ll {\mathcal{F}}^{-1}$
is to be determined. This form of solution is restricted to the ponded region; far-field boundary conditions may not be applied directly and instead the solution must be matched to the regular series,
 $h_{R}(x)$
at ‘transition’ zones close to
 $x=x_{0}$
and
 $x=x_{2}$
(
 ${<}x_{1}$
), the latter of which is to be determined as part of the solution (see figure 5).
Substituting
 $h_{p}(x)$
into (4.3) and balancing terms of the same asymptotic order, we find that
 $$\begin{eqnarray}\displaystyle {\hat{h}}_{-1}=x-{\mathcal{M}}m(x)+c_{-1},\quad \text{and}\quad {\hat{h}}_{0}=c_{0}, & & \displaystyle\end{eqnarray}$$
where
 $c_{-1}$
and
 $c_{0}$
are constants to be determined.
First we match to the downstream form of the flow thickness by analysing the governing equation close to
 $x=x_{0}$
. We introduce the following rescaled variables
 $$\begin{eqnarray}\displaystyle x=x_{0}+({\mathcal{F}}^{3}/{\mathcal{X}}^{4})^{1/7}\unicode[STIX]{x1D702},\quad \text{and}\quad h=({\mathcal{F}}{\mathcal{X}})^{-1/7}H(\unicode[STIX]{x1D702}), & & \displaystyle\end{eqnarray}$$
where
 ${\mathcal{X}}=-{\mathcal{M}}m^{\prime \prime }(x_{0})$
. The leading-order terms in the governing equation in the regime
 ${\mathcal{F}}\ll 1$
are then given by
 $$\begin{eqnarray}\displaystyle \unicode[STIX]{x1D702}=\frac{1}{H^{3}}+\frac{\text{d}H}{\text{d}\unicode[STIX]{x1D702}}. & & \displaystyle\end{eqnarray}$$
Matching to the downstream regular expansion (4.8), we obtain
 $$\begin{eqnarray}\displaystyle H\rightarrow \unicode[STIX]{x1D702}^{-1/3}+{\textstyle \frac{1}{9}}\unicode[STIX]{x1D702}^{-8/3},\quad \text{as}~\unicode[STIX]{x1D702}\rightarrow \infty . & & \displaystyle\end{eqnarray}$$
We note that the distinguished scalings of (4.12) are deduced by balancing the terms downstream (4.14). Numerically integrating (4.13), we find that
 $$\begin{eqnarray}\displaystyle H\rightarrow {\textstyle \frac{1}{2}}\unicode[STIX]{x1D702}^{2}+1.611\ldots \quad \text{as}~\unicode[STIX]{x1D702}\rightarrow -\infty , & & \displaystyle\end{eqnarray}$$
and this condition must match the form of the solution in the ponded region. Thus evaluating (4.10) as
 $x\rightarrow x_{0}$
by substituting for
 $x$
in terms of
 $\unicode[STIX]{x1D702}$
given by (4.12), we find that
 $$\begin{eqnarray}\displaystyle h_{p}\sim {\mathcal{F}}^{-1}[x_{0}-{\mathcal{M}}m(x_{0})+c_{-1}]+({\mathcal{F}}{\mathcal{X}})^{-1/7}\unicode[STIX]{x1D702}^{2}+\unicode[STIX]{x1D6FE}({\mathcal{F}})c_{0}+\cdots \,. & & \displaystyle\end{eqnarray}$$
Matching (4.15) and (4.16), we determine that
 $\unicode[STIX]{x1D6FE}({\mathcal{F}})={\mathcal{F}}^{-1/7}$
and that
 $$\begin{eqnarray}\displaystyle c_{-1}=-x_{0}+{\mathcal{M}}m(x_{0}),\quad \text{and}\quad c_{0}=1.611[-{\mathcal{M}}m^{\prime \prime }(x_{0})]^{-1/7}. & & \displaystyle\end{eqnarray}$$
In the ponded region, the asymptotic expansion is given by
 $$\begin{eqnarray}\displaystyle h_{p}\sim {\mathcal{F}}^{-1}[x-x_{0}+{\mathcal{M}}(m(x_{0})-m(x))]+1.611{\mathcal{F}}^{-1/7}[-{\mathcal{M}}m^{\prime \prime }(x_{0})]^{-1/7}+\cdots \,.\quad & & \displaystyle\end{eqnarray}$$
Upstream of the mound, the ponded zone re-joins a region that is modelled accurately by the regular expansion
 $h_{R}(x)$
around the location
 $x=x_{2}$
. We introduce a rescaled independent variable in this zone to capture the transition in the solution between the ponded and regular asymptotic series. In this case the distinguished scaling is
 $$\begin{eqnarray}\displaystyle x=x_{2}+{\mathcal{F}}\unicode[STIX]{x1D709},\quad \text{and}\quad h={\hat{h}}(\unicode[STIX]{x1D709}). & & \displaystyle\end{eqnarray}$$
In terms of these variables the leading-order terms in the governing equation become
 $$\begin{eqnarray}\displaystyle 1-{\mathcal{M}}m^{\prime }(x_{2})=\frac{1}{{\hat{h}}^{3}}+\frac{\text{d}{\hat{h}}}{\text{d}\unicode[STIX]{x1D709}}. & & \displaystyle\end{eqnarray}$$
The matching condition upstream is that the regular series is approached and thus
 ${\hat{h}}\rightarrow [1-{\mathcal{M}}m^{\prime }(x_{2})]^{-1/3}$
as
 $\unicode[STIX]{x1D709}\rightarrow -\infty$
. Substituting for
 $x$
in the ponded expression (4.18) and evaluating this when
 $\unicode[STIX]{x1D709}\ll 1$
, we find that
 $$\begin{eqnarray}\displaystyle h_{p}={\mathcal{F}}^{-1}[x_{2}-{\mathcal{M}}m(x_{2})+c_{-1}]+c_{0}{\mathcal{F}}^{-1/7}+\unicode[STIX]{x1D709}[1-{\mathcal{M}}m^{\prime }(x_{2})]+\cdots \,. & & \displaystyle\end{eqnarray}$$
Thus we deduce that
 $$\begin{eqnarray}\displaystyle x_{2}=x_{0}+{\mathcal{M}}[m(x_{2})-m(x_{0})]+{\mathcal{F}}^{6/7}1.611[-{\mathcal{M}}m^{\prime \prime }(x_{0})]^{-1/7}+\cdots \,. & & \displaystyle\end{eqnarray}$$
This completes the asymptotic solution for the thickness of the flowing layer in the regime
 ${\mathcal{F}}\ll 1$
. In figure 6(b) we show that it captures accurately the numerically computed behaviour for a particular parameter value.
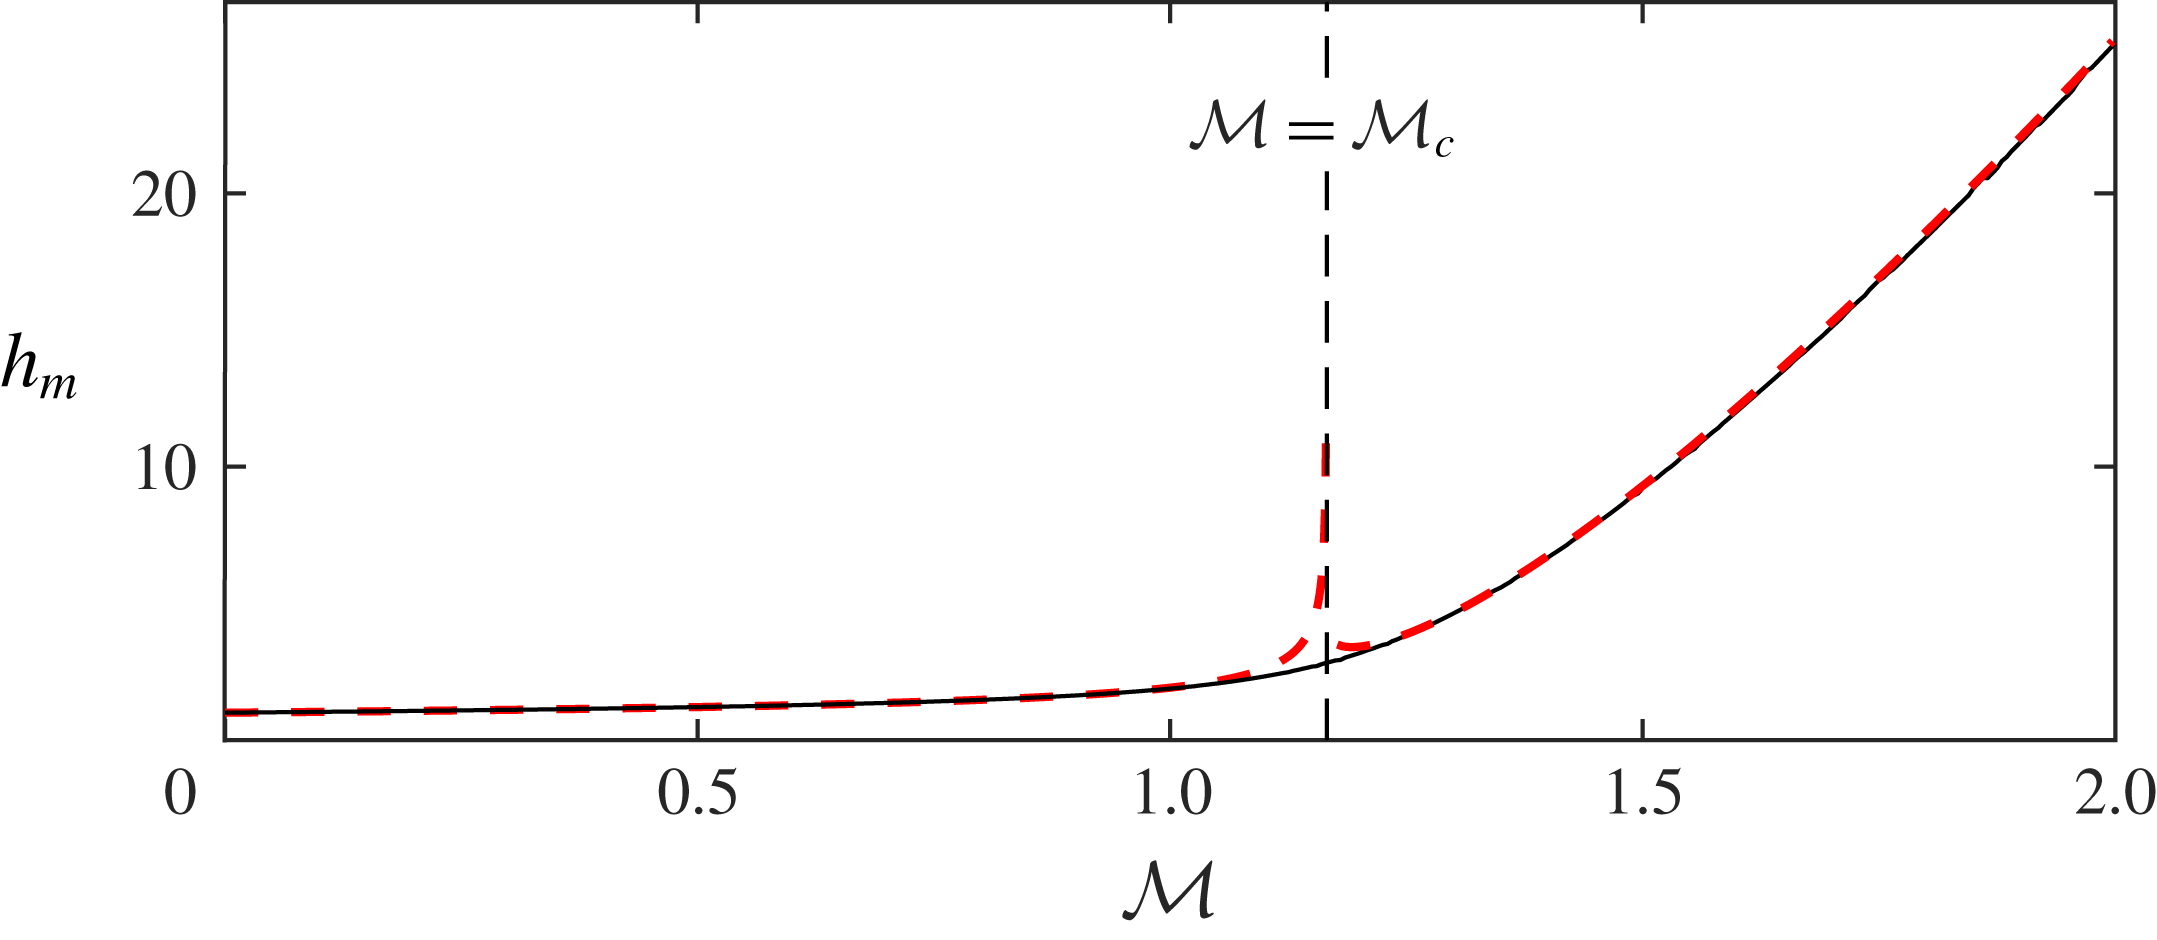
We calculate numerically the maximum flow thickness that occurs as the fluid flows over the mound,
 $h_{m}$
, as a function of the dimensionless amplitude of the mound,
 ${\mathcal{M}}$
(see figure 7), noting its weak dependence on
 ${\mathcal{M}}$
for values less than the critical value,
 ${\mathcal{M}}_{c}$
, but its much stronger dependence for values in excess of the critical value. This quantity may also be evaluated directly from our asymptotic expansions for
 $h_{R}$
and
 $h_{P}$
. When
 ${\mathcal{M}}<{\mathcal{M}}_{c}$
, the maximum depth occurs at
 $x_{m}({<}0)$
where
 $m^{\prime \prime }(x_{m})=0$
and
 $h_{m}=h_{R}(x_{m})$
; for
 $m(x)=\text{exp}(-x^{2})$
this means that
 $x_{m}=-1/\sqrt{2}$
and
 $h_{m}=(1-{\mathcal{M}}/{\mathcal{M}}_{c})^{-1/3}$
.
Maximum flow thickness as a function of the dimensionless amplitude of the mound for
 ${\mathcal{F}}=0.02$
. The numerically calculated thickness is plotted as a continuous black line; the asymptotic prediction is plotted as a red dashed line.

When
 ${\mathcal{M}}>{\mathcal{M}}_{c}$
, the maximum occurs at
 $x=x_{1}$
, since this is where
 $\text{d}h_{p}/\text{d}x$
vanishes and so the maximum height is given by
 $$\begin{eqnarray}\displaystyle h_{m}={\mathcal{F}}^{-1}\{x_{1}-x_{0}-{\mathcal{M}}[m(x_{1})-m(x_{0})]\}+c_{0}{\mathcal{F}}^{-1/7}. & & \displaystyle\end{eqnarray}$$
We have found two regimes for the flow over a one-dimensional mound in the case of a shallow upstream depth (
 ${\mathcal{F}}\ll 1$
). For smaller mounds, the flow thickness is everywhere comparable to the upstream depth, but for mounds higher than a critical threshold (
 ${\mathcal{M}}>{\mathcal{M}}_{c}$
), there is a region upstream of the mound in which the fluid ‘ponds’ much deeper than the upstream depth.
The critical dependence of the flow behaviour on the mound height will inform our study of two-dimensional mounds in the next section.
5 Flow over two-dimensional mounds
The governing equation for steady flow over a mound is given by (2.12) and in this section we analyse the motion when the mound varies both laterally and in the downslope direction. In contrast to one-dimensional mounds (§ 4), the flow in this scenario need not surmount the obstacle, but rather may be totally deflected around it. In this section we analyse the motion in the regime
 ${\mathcal{F}}\ll 1$
and
 ${\mathcal{M}}=O(1)$
in which the flowing layer is much shallower than both the amplitude and streamwise extent of the mound.
We follow a similar analysis as for the one-dimensional problem (§ 4) to determine how the size of the mound controls the steady flow and in particular determine when the flow does not surmount the mound, leading to a dry region. Motivated by the numerical results shown in figure 2(a), we seek a regular expansion for the flow thickness for smaller mounds in the form
 $$\begin{eqnarray}\displaystyle h\equiv h_{R}=h_{0}+{\mathcal{F}}h_{1}+\cdots \,. & & \displaystyle\end{eqnarray}$$
Then, at leading order, we find the first-order partial differential equation for
 $h_{0}$
 $$\begin{eqnarray}\displaystyle \left[1-{\mathcal{M}}\frac{\unicode[STIX]{x2202}m}{\unicode[STIX]{x2202}x}\right]\frac{\unicode[STIX]{x2202}h_{0}^{3}}{\unicode[STIX]{x2202}x}-{\mathcal{M}}\frac{\unicode[STIX]{x2202}m}{\unicode[STIX]{x2202}y}\frac{\unicode[STIX]{x2202}h_{0}^{3}}{\unicode[STIX]{x2202}y}={\mathcal{M}}h_{0}^{3}\unicode[STIX]{x1D6FB}^{2}m. & & \displaystyle\end{eqnarray}$$
This equation neglects the diffusive slumping terms in the governing equation (2.12). We use the method of characteristics to find the following solution to (5.2)
 $$\begin{eqnarray}\displaystyle \frac{\text{d}x}{\text{d}s}=1-{\mathcal{M}}\frac{\unicode[STIX]{x2202}m}{\unicode[STIX]{x2202}x},\quad \frac{\text{d}y}{\text{d}s}=-{\mathcal{M}}\frac{\unicode[STIX]{x2202}m}{\unicode[STIX]{x2202}y},\quad \frac{\text{d}\log (h_{0}^{3})}{\text{d}s}={\mathcal{M}}\unicode[STIX]{x1D6FB}^{2}m, & & \displaystyle\end{eqnarray}$$
where
 $s$
parameterises the characteristics. The characteristic projections in the (
 $x$
,
 $y$
) plane and the flow thickness,
 $h_{0}(s)$
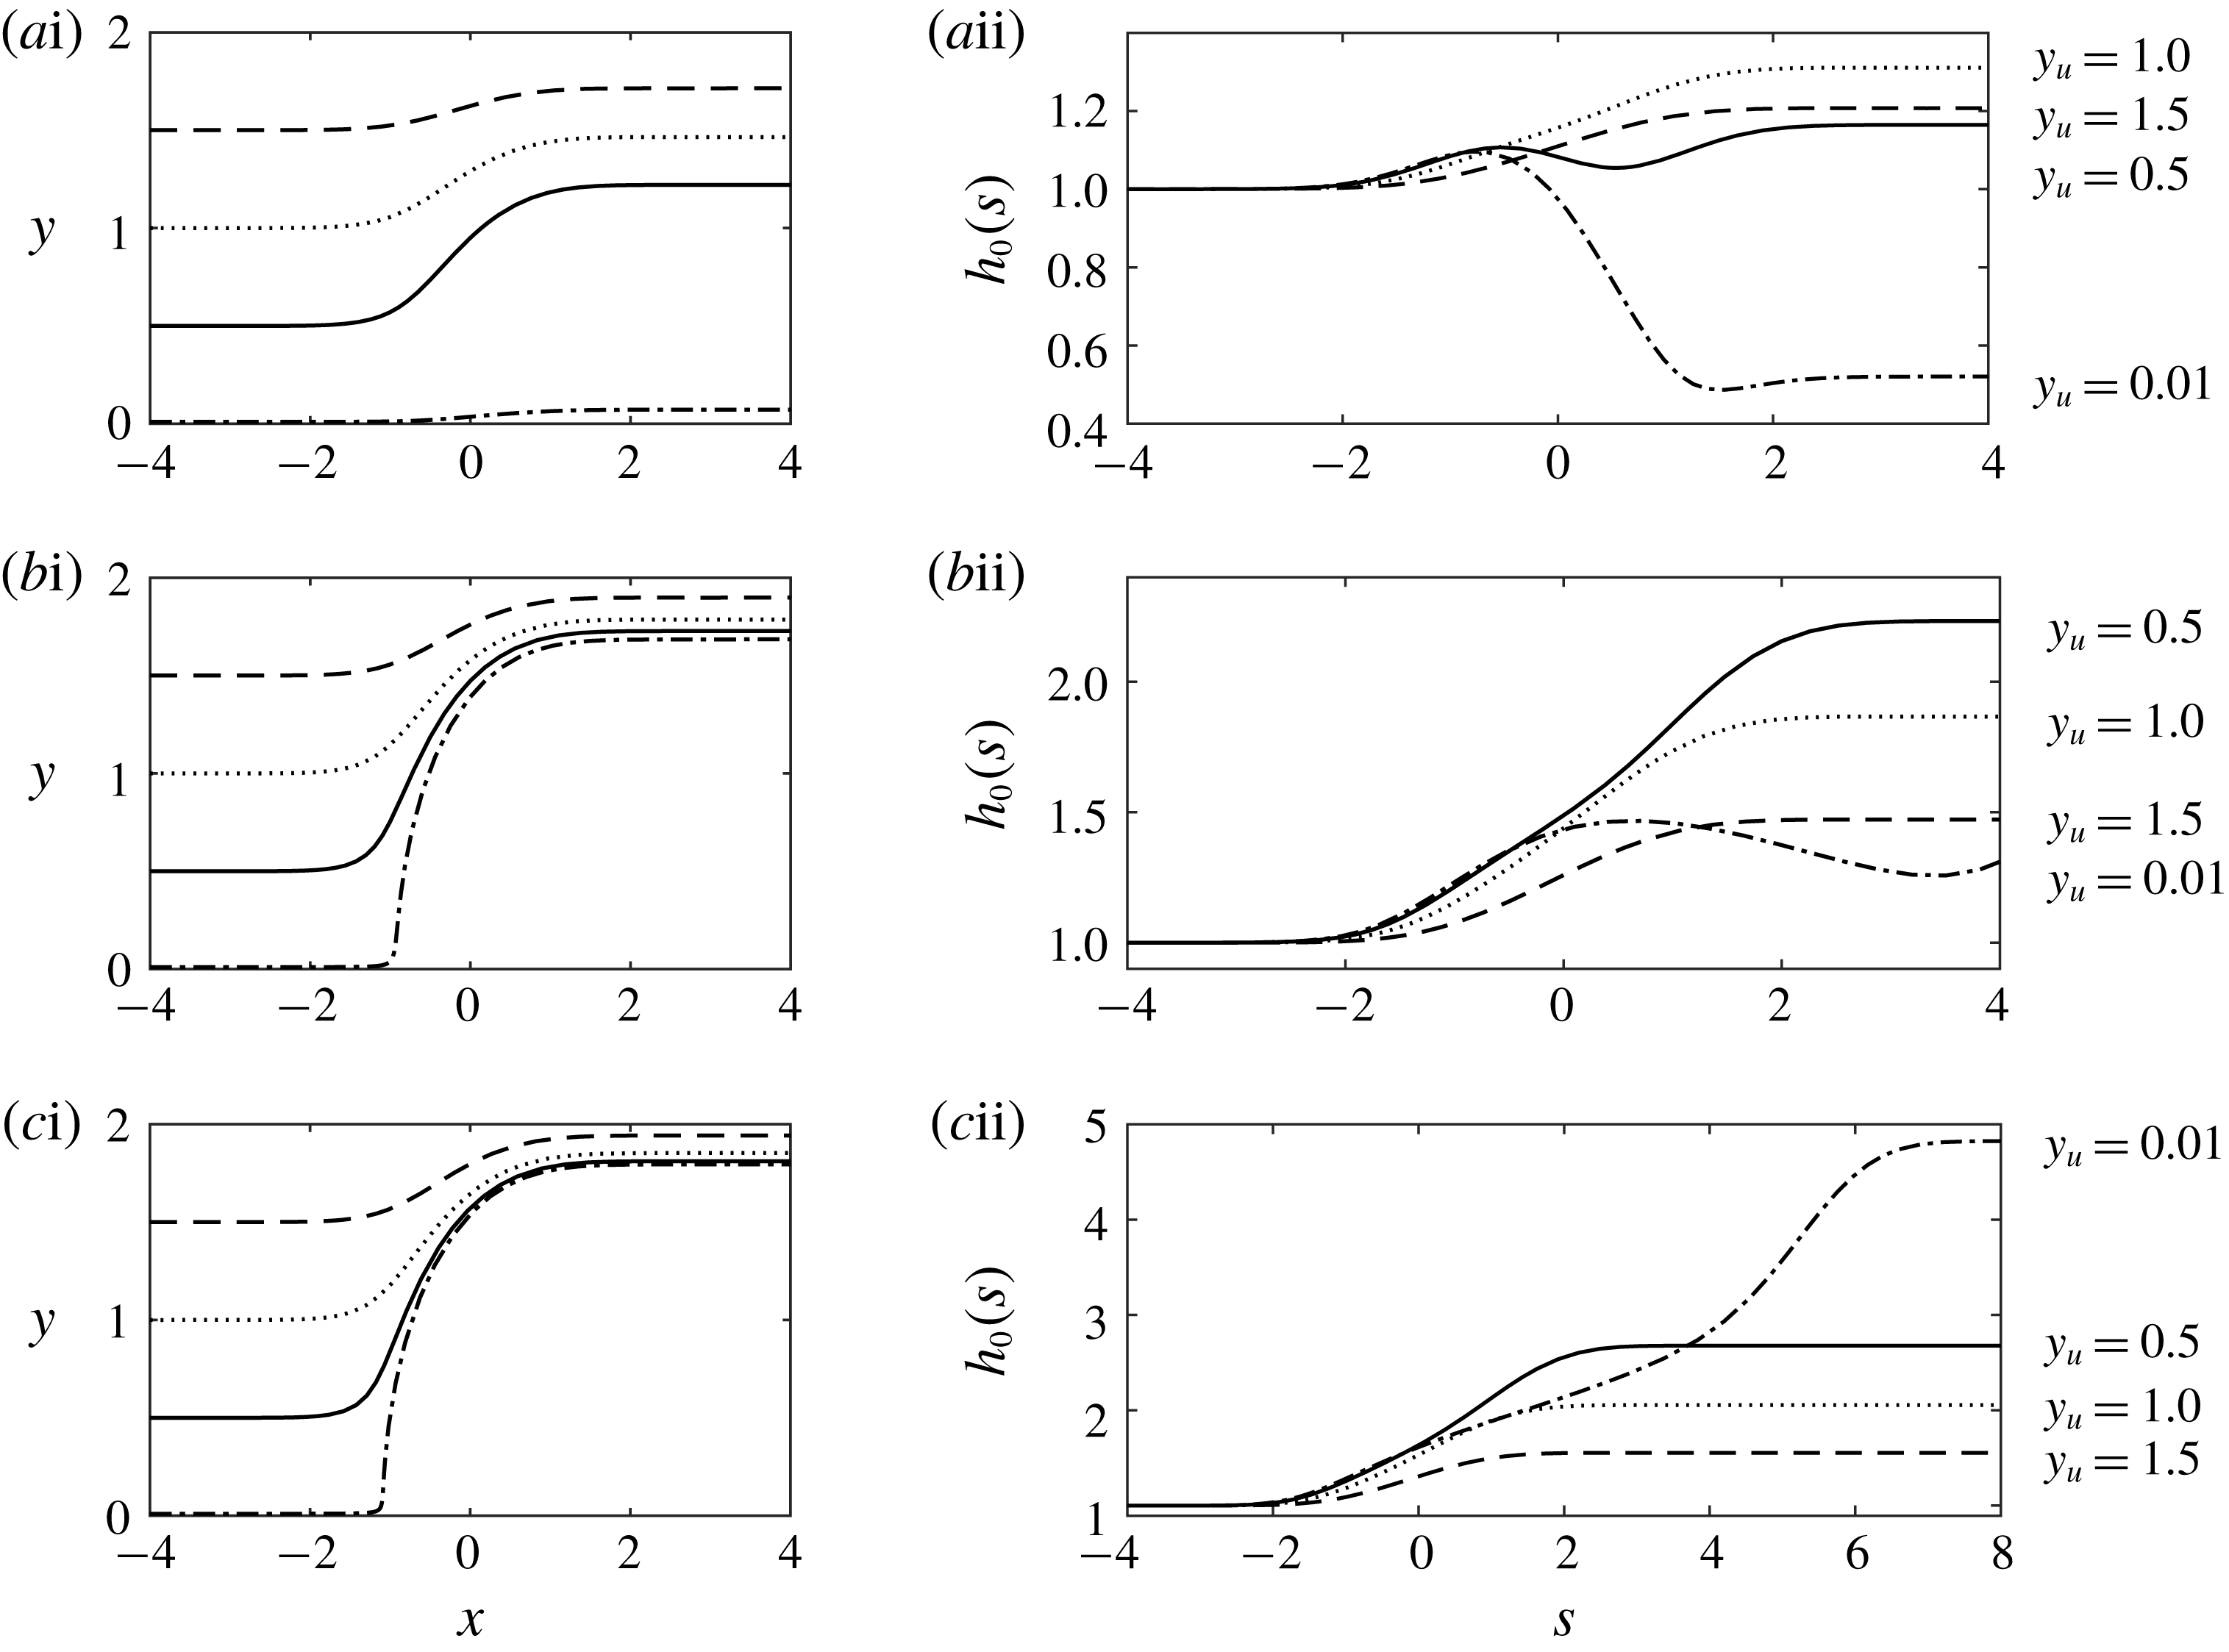
, along some of the characteristics are plotted in figure 8.
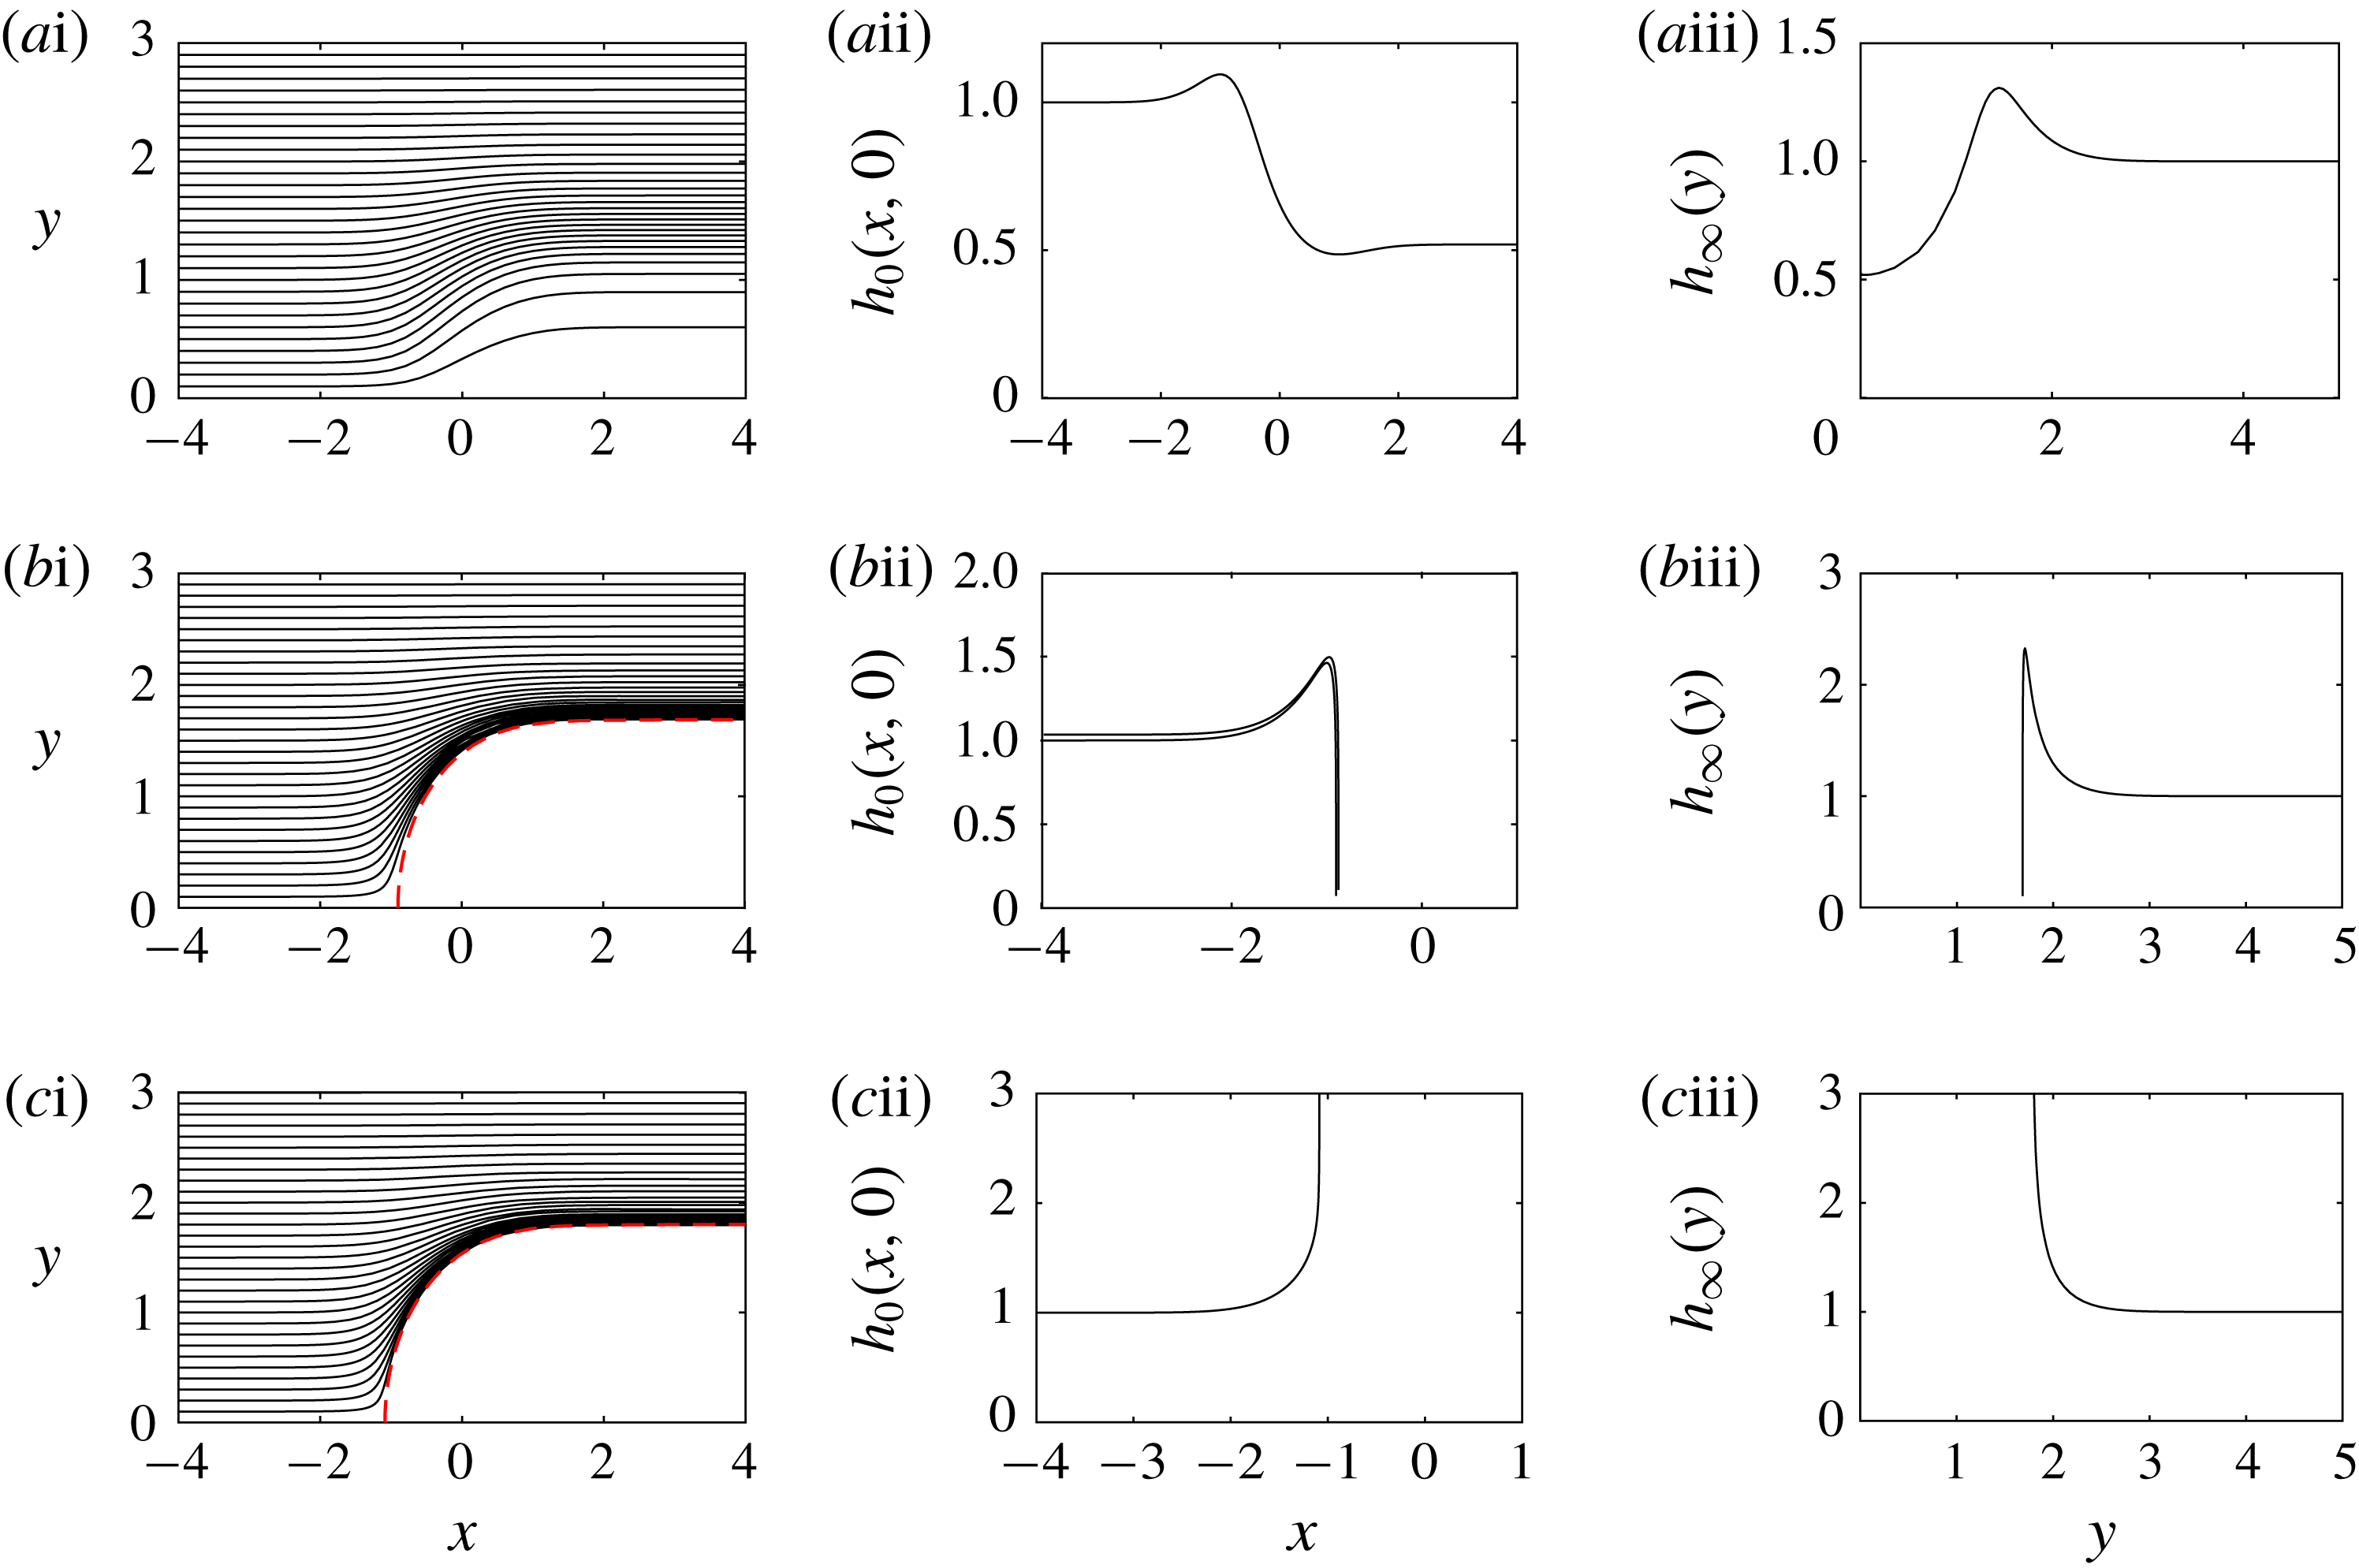
The asymptotic solution for flow over a two-dimensional mound,
 $h_{0}(x,y)$
, in the case that the diffusive slumping terms are neglected. The characteristics for (5.2) are plotted in the (
 $x$
,
 $y$
) plane for
 ${\mathcal{M}}=0.5$
in (ai), for
 ${\mathcal{M}}=1.25$
in (bi) and for
 ${\mathcal{M}}=1.5$
in (ci) for four upstream cross-flow positions,
 $y_{u}$
. The characteristics are parameterised by
 $s$
(see (5.3)). The leading order flow thickness,
 $h_{0}(s)$
, is plotted along the four characteristics for
 ${\mathcal{M}}=0.5$
,
 ${\mathcal{M}}=1.25$
and
 ${\mathcal{M}}=1.5$
in (aii), (bii) and (cii), respectively.

The asymptotic solution for flow over a two-dimensional mound,
 $h_{0}(x,y)$
, in the case that the diffusive slumping terms are neglected (see (5.2)). The three rows correspond to different mound heights:
 ${\mathcal{M}}=0.5$
,
 $1.25$
and
 $1.5$
. The characteristics are shown in the (
 $x$
,
 $y$
) plane in the first column. The red dashed lines in panels (bi) and (ci) show the boundary of the region that is not accessed by characteristics. The second column presents the thickness along the centreline,
 $y=0$
, predicted by the method of characteristics. Further downstream, the solution depends only on the cross-slope coordinate and this far downstream shape,
 $h_{\infty }(\,y)$
is plotted in the third column.

We observe that for
 ${\mathcal{M}}<{\mathcal{M}}_{c}$
,
 $\text{d}x/\text{d}s$
is nowhere
 $0$
, where
 ${\mathcal{M}}_{c}=(e/2)^{1/2}$
(see (4.5)) takes the same critical value as found for the one-dimensional mound. It corresponds to the smallest mound for which there is a point at which the topography is horizontal relative to the direction of gravity. As in the one-dimensional problem, we anticipate a qualitative change in behaviour at
 ${\mathcal{M}}_{c}$
and begin our analysis by studying smaller mounds defined by
 ${\mathcal{M}}<{\mathcal{M}}_{c}$
.
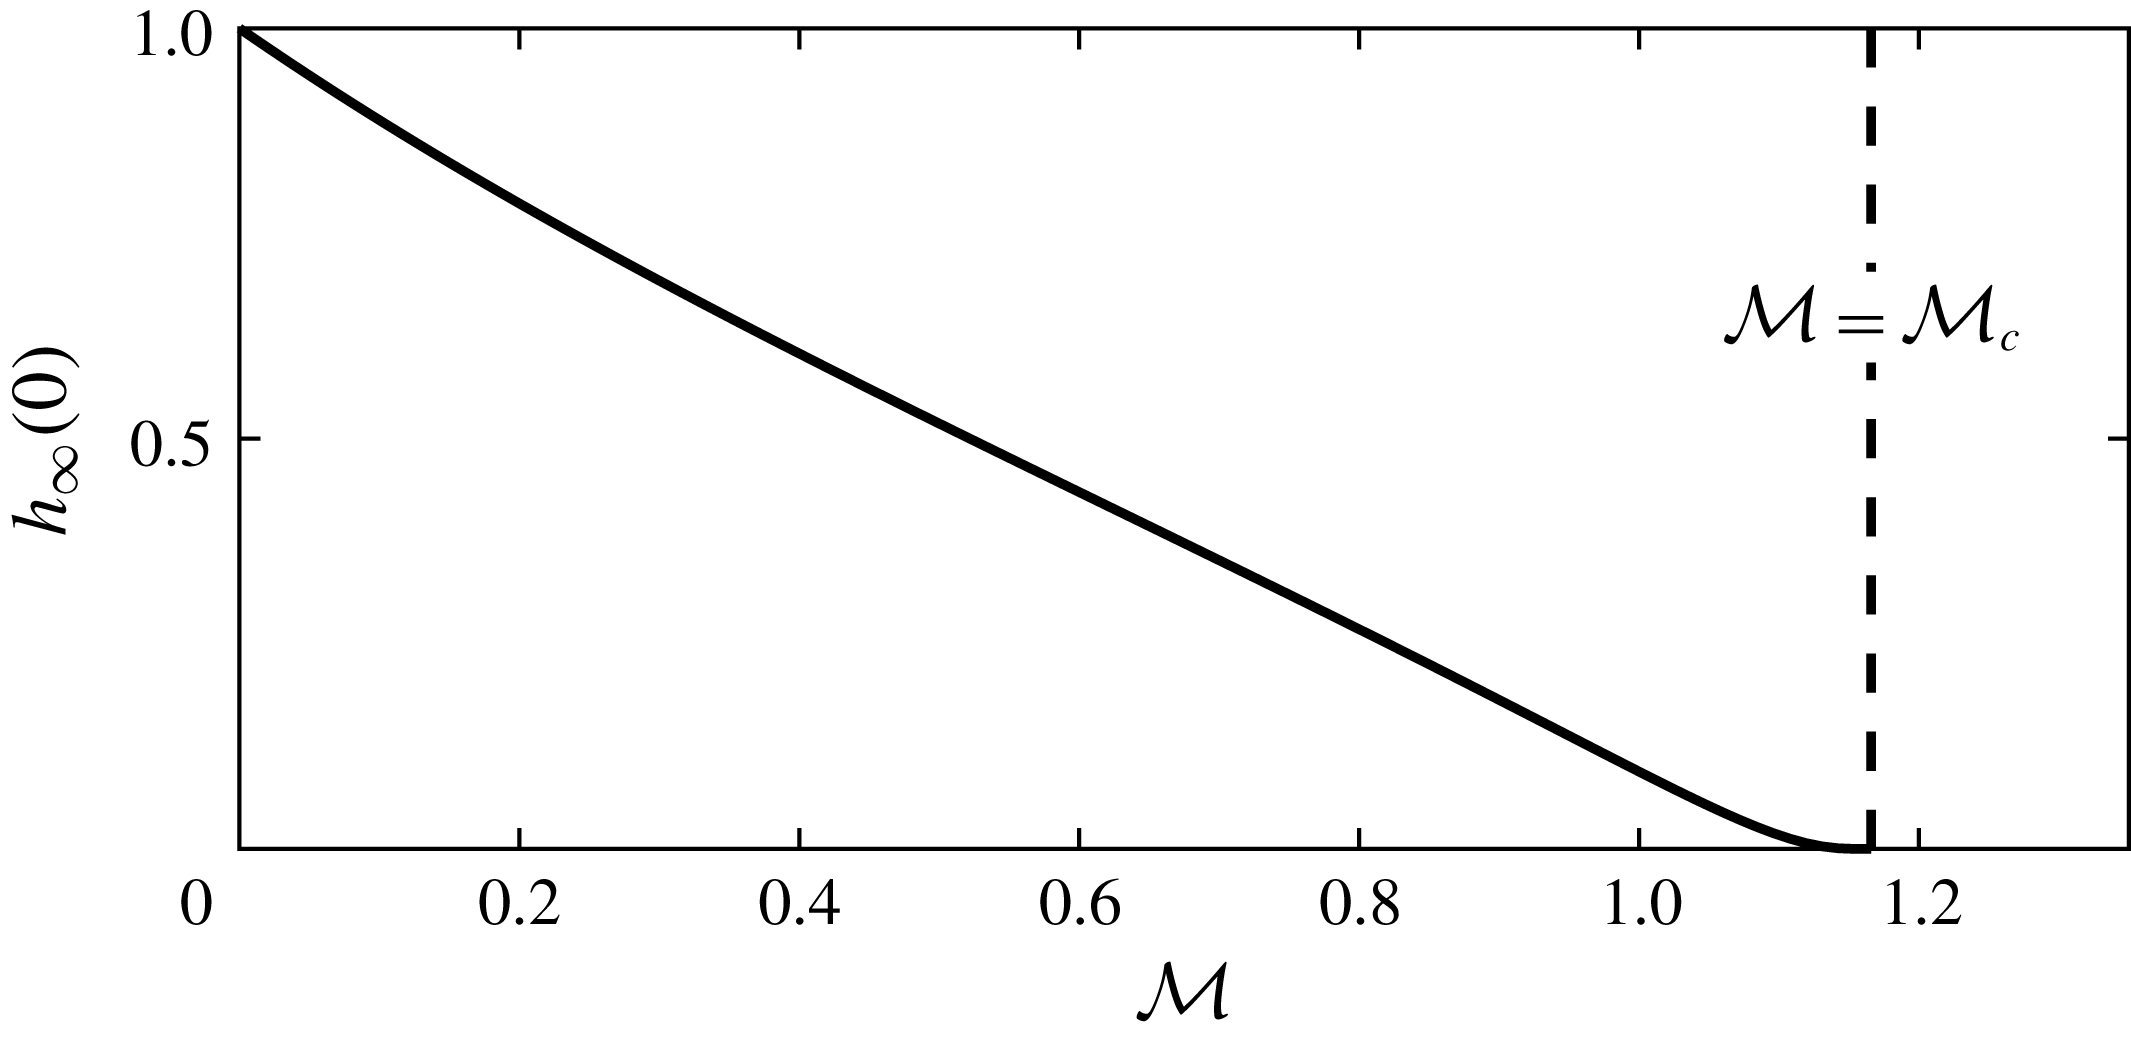
Far downstream flow thickness over an axisymmetric mound along the line of symmetry (
 $y=0$
). The thickness is plotted as a function of the dimensionless mound amplitude,
 ${\mathcal{M}}$
, according to the leading-order expansion (5.2).

In the (
 $x$
,
 $y$
) plane, the shape of the characteristic curves for (5.2) are given by
 $$\begin{eqnarray}\displaystyle \frac{\text{d}y}{\text{d}x}=\frac{2{\mathcal{M}}y\text{e}^{-r^{2}}}{1+2{\mathcal{M}}x\text{e}^{-r^{2}}}, & & \displaystyle\end{eqnarray}$$
where
 $r^{2}=x^{2}+y^{2}$
and
 $m=\exp (-r^{2})$
. The characteristics are plotted for
 ${\mathcal{M}}=0.5<{\mathcal{M}}_{c}$
in figure 9(ai).
The depth far upstream of the mound is unity and we can numerically integrate the system (5.3) to obtain the leading-order thickness,
 $h_{0}$
. We plot a cross-section through the line of symmetry (
 $y=0$
) of
 $h_{0}$
in figure 9(aii).
Far downstream, the characteristic solution converges to a shape which is independent of
 $x$
since
 $\text{d}y/\text{d}s$
and
 $\text{d}h/\text{d}s$
tend to zero; we denote
 $$\begin{eqnarray}\displaystyle h_{\infty }(\,y)=\lim _{x\rightarrow \infty }h_{0}(x,y). & & \displaystyle\end{eqnarray}$$
This far downstream shape is plotted in figure 9(aiii), which illustrates that the thickness converges to
 $1$
as
 $y\rightarrow \infty$
but not as
 $x\rightarrow \infty$
.
The leading-order thickness
 $h_{0}$
cannot be matched with the far-field condition,
 $h\rightarrow 1$
as
 $x\rightarrow \infty$
, which suggests there is again an ‘outer’ region in which the diffusive slumping terms are important and our current asymptotic expansion, which neglects this cross-slope spreading, is not valid (see chap. 5 of Hinch Reference Hinch1991). This downstream region is analysed in § 5.1.
In figure 10, we plot the far downstream thickness on the line of symmetry,
 $h_{\infty }(0)$
, as a function of the dimensionless mound amplitude,
 ${\mathcal{M}}$
. The flow thickness over the highest parts of the mound decreases as the mound amplitude increases. However, there are no dry regions for
 ${\mathcal{M}}<{\mathcal{M}}_{c}$
.
Figure 10 suggests that dry regions may occur for
 ${\mathcal{M}}>{\mathcal{M}}_{c}$
. For such larger mounds,
 $\text{d}x/\text{d}s$
vanishes along the
 $x$
axis at
 $x_{1}$
, the more negative root of (4.9). The characteristic, which originates from
 $(x_{1},\unicode[STIX]{x1D716})$
, where
 $\unicode[STIX]{x1D716}>0$
is arbitrarily small, is plotted as a red dashed line in figures 9(bi) and 9(ci). This line bounds a region that is not accessed by the characteristics. We anticipate that dry regions may occur within the area not accessed by characteristics and this is corroborated by our numerical results (see figure 2). Figure 9(bii) shows that the flow thickness along the centreline vanishes. This vanishing thickness is propagated along the characteristics at the edge of the inaccessible region. In figure 9(cii), the behaviour is different; the flow thickness becomes singular and this singularity is propagated along the bounding characteristics. We discuss the difference between these regimes later in this section.
We note that the characteristic projections (5.3a
) and (5.3b
) may be thought of as a phase plane. For
 ${\mathcal{M}}<{\mathcal{M}}_{c}$
, there are no stationary points but for
 ${\mathcal{M}}>{\mathcal{M}}_{c}$
, there are two stationary points at
 $(x_{1},0)$
and
 $(x_{0},0)$
, where
 $x_{1}<x_{0}$
. The point
 $(x_{1},0)$
is at the edge of the inaccessible region and is the stationary point of interest. It is a saddle point with an unstable manifold in the
 $y$
-direction and a stable manifold along the
 $x$
axis, which can be seen in figures 9(bi) and 9(ci). The point
 $(x_{1},0)$
is a saddle for all
 ${\mathcal{M}}>{\mathcal{M}}_{c}$
because
 $m_{xx}$
is positive here and
 $m_{yy}$
is negative.
To analyse behaviour at the edge of the inaccessible region, we consider the flow thickness along the line of symmetry
 $y=0$
as the point (
 $x_{1}$
,
 $0$
) is approached. The characteristics from our asymptotic expansion, equations (5.1) and (5.2), indicate that the flow thickness along the centreline is given by
 $$\begin{eqnarray}\displaystyle \frac{\text{d}\log (h_{0}^{3})}{\text{d}x}=\frac{4{\mathcal{M}}(x^{2}-1)\text{e}^{-x^{2}}}{1+2{\mathcal{M}}x\text{e}^{-x^{2}}}. & & \displaystyle\end{eqnarray}$$
As
 $x\rightarrow x_{1}$
the denominator tends to zero and the gradients in the flow thickness become very large (see figures 9
bii and 9
cii). Our asymptotic expansion breaks down here, similar to the behaviour in the one-dimensional problem (see § 4).
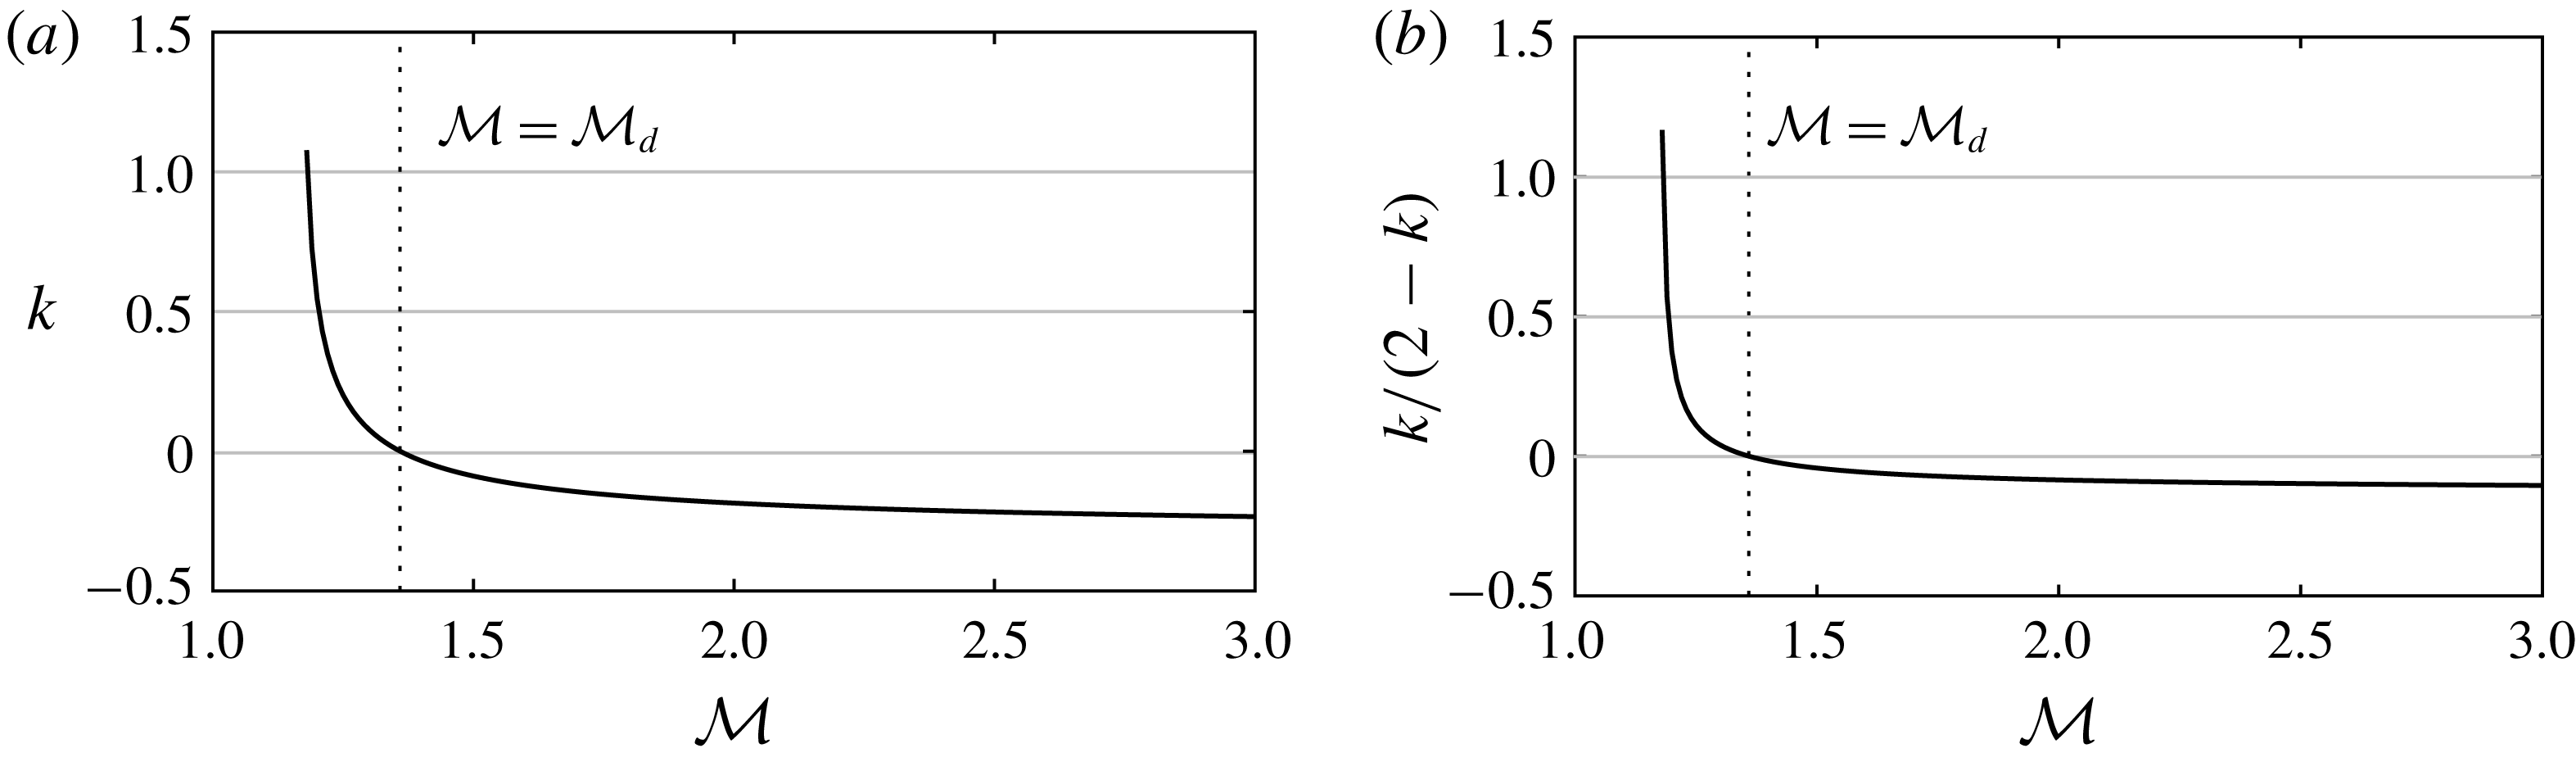
(a) Exponent
 $k$
[of
 $h_{0}\sim (x_{1}-x)^{k}$
as
 $x\rightarrow x_{1}$
] as a function of the dimensionless mound amplitude,
 ${\mathcal{M}}$
. (b) Exponent,
 $k/(2-k)$
, of
 ${\mathcal{F}}$
in the flow depth (
 $h\sim {\mathcal{F}}^{k/(2-k)}$
, equation (5.17)) in the ponded region upstream of the mound.

The large
 $x$
-gradients in the flow thickness, (
 $\unicode[STIX]{x2202}h/\unicode[STIX]{x2202}x$
) suggest that the downslope diffusive slumping term
 ${\mathcal{F}}\unicode[STIX]{x2202}^{2}h^{4}/\unicode[STIX]{x2202}x^{2}$
needs to be reintroduced near the singularity. We consider this neighbourhood and approximate (5.6) to leading order by
 $$\begin{eqnarray}\displaystyle \frac{\text{d}\log (h_{0}^{3})}{\text{d}x}=\frac{2(x_{1}^{2}-1)}{(1-2x_{1}^{2})(x-x_{1})}. & & \displaystyle\end{eqnarray}$$
Then, according to (5.6), near
 $x_{1}$
, the leading-order term,
 $h_{0}$
is proportional to
 $(x_{1}-x)^{k}$
, where
 $$\begin{eqnarray}\displaystyle k=\frac{2(x_{1}^{2}-1)}{3(1-2x_{1}^{2})}, & & \displaystyle\end{eqnarray}$$
which, through
 $x_{1}$
, is weakly dependent on
 ${\mathcal{M}}$
. The exponent
 $k$
is plotted as a function of
 ${\mathcal{M}}$
in figure 11(a). The plot demonstrates that
 $k<2$
and that
 $k$
changes sign as
 ${\mathcal{M}}$
is increased. Note that
 $x_{1}<-1/2^{1/2}$
and hence
 $k$
changes sign as
 $x_{1}$
crosses
 $-1$
. In terms of
 ${\mathcal{M}}$
this sign change corresponds to
 $$\begin{eqnarray}\displaystyle & \displaystyle k>0,\quad \text{for }{\mathcal{M}}<{\mathcal{M}}_{d}=e/2\approx 1.36, & \displaystyle\end{eqnarray}$$
 $$\begin{eqnarray}\displaystyle & \displaystyle k<0,\quad \text{for }{\mathcal{M}}>{\mathcal{M}}_{d}. & \displaystyle\end{eqnarray}$$
Hence there is a change in behaviour at the secondary critical value,
 ${\mathcal{M}}={\mathcal{M}}_{d}$
. This can be observed by comparing figures 9(bii), 9(biii) and 9(cii), 9(ciii); in the former,
 ${\mathcal{M}}=1.25<{\mathcal{M}}_{d}$
, whilst in the latter,
 ${\mathcal{M}}=1.5>{\mathcal{M}}_{d}$
. The regime change corresponds to a change in sign of the gradient of
 $h_{0}$
at the stagnation point,
 $(x_{1},0)$
. The gradient is proportional to
 $\unicode[STIX]{x1D6FB}^{2}m=4(r^{2}-1)\text{e}^{-r^{2}}$
, which changes sign (for
 $y=0$
) as
 $x_{1}$
crosses
 $1$
.
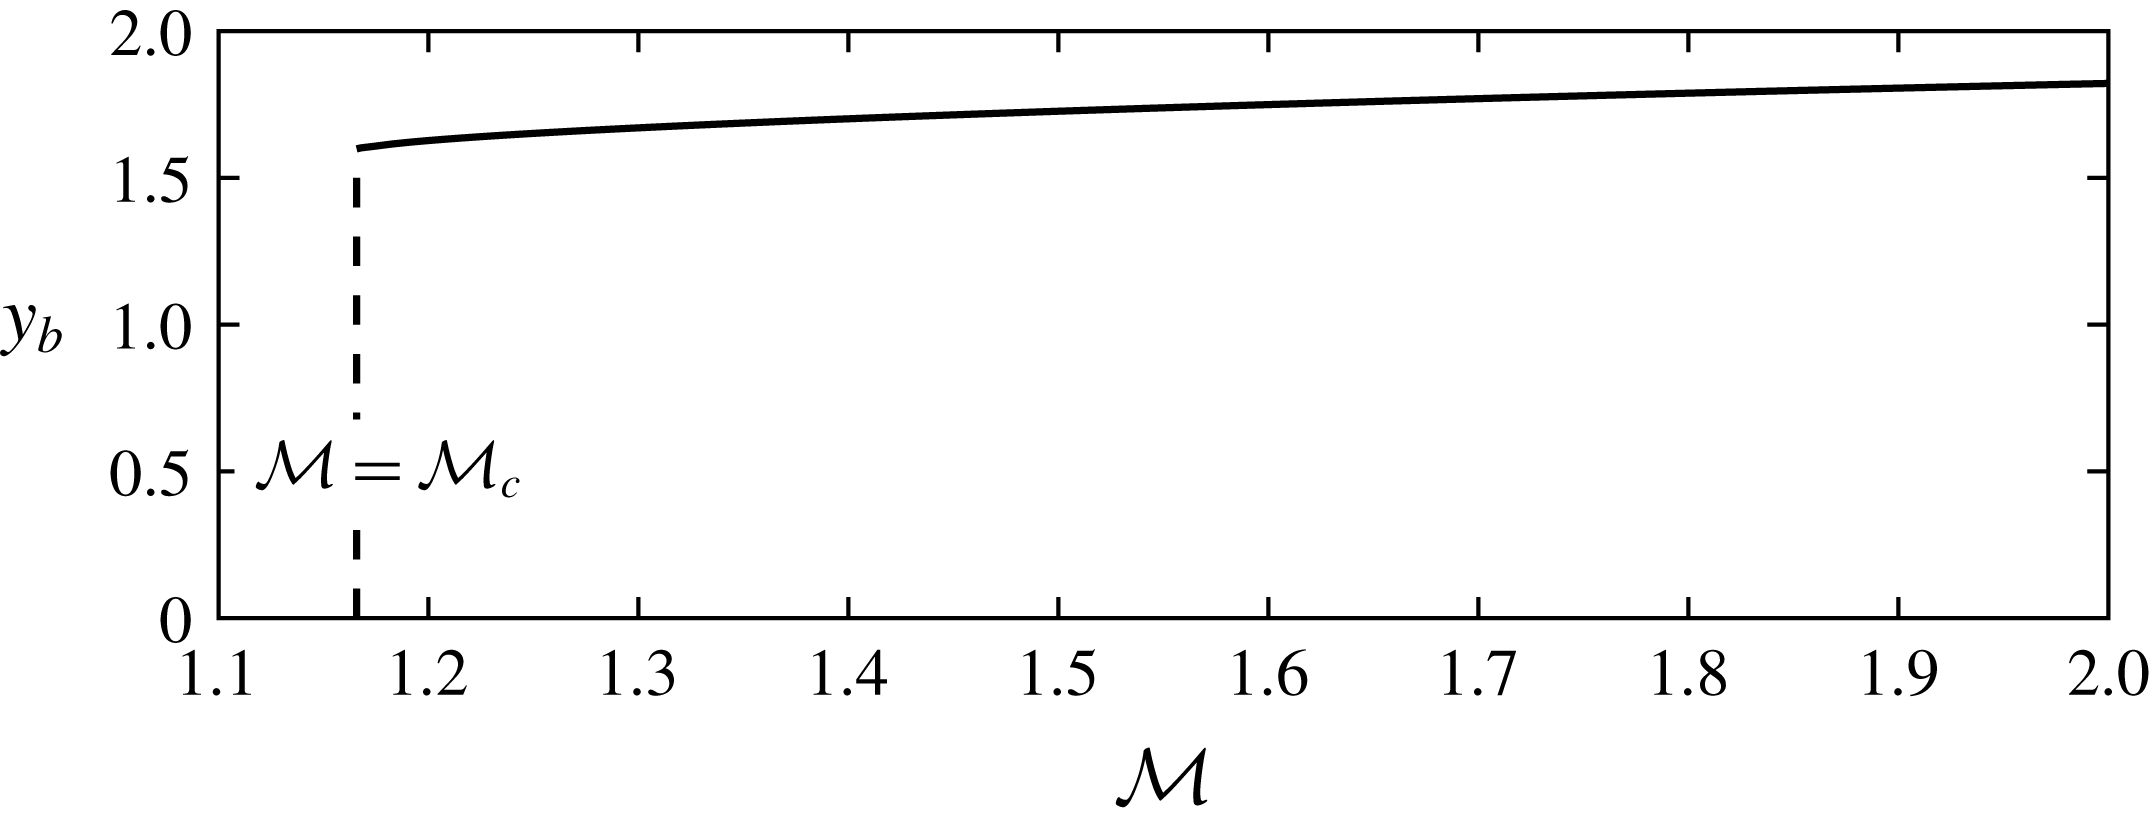
The downstream width of the inaccessible region,
 $y_{b}$
, as a function of the dimensionless amplitude of the mound,
 ${\mathcal{M}}$
, for flow over the axisymmetric mound
 $m=\exp (-r^{2})$
.

The regime change also corresponds to the inaccessible region containing the unit circle. We deduce from (5.3) that the flow thickness,
 $h_{0}$
is monotonically increasing along characteristics that do not pass through the unit circle, which corresponds to the region in which the amplitude of the topography is greatest. Within the unit circle, the flow thickness is monotonically decreasing along characteristics (compare the
 $y_{u}=0.01$
characteristics in figures 8
bii and 8
cii).
In figure 12, we demonstrate how the size of the inaccessible region for an exponential mound increases with
 ${\mathcal{M}}$
by plotting
 $y_{b}$
, the far downstream deflection of the bounding characteristic (i.e. the solution of (5.3) for
 $y(s)$
as
 $s\rightarrow \infty$
given
 $y(0)=\unicode[STIX]{x1D716}\ll 1$
and
 $x(0)=x_{1}$
). For
 ${\mathcal{M}}<{\mathcal{M}}_{d}$
, some characteristics pass through the unit circle and hence
 $h_{0}$
is not everywhere monotonically increasing along characteristics. We note that
 $y_{b}$
vanishes for
 ${\mathcal{M}}<{\mathcal{M}}_{c}$
because the mound is sufficiently small that the flow surmounts it and is not deflected around it.
The flow thickness far downstream of the mound,
 $h_{\infty }(\,y)$
, does not vary monotonically with
 $y$
if
 ${\mathcal{M}}<{\mathcal{M}}_{d}$
, as illustrated, for example, by figures 9(aiii) and 9(biii); instead it exhibits a maximum,
 $h_{m}$
, which occurs at location
 $y_{m}$
(defined by
 $h_{\infty }(y_{m})=h_{m}$
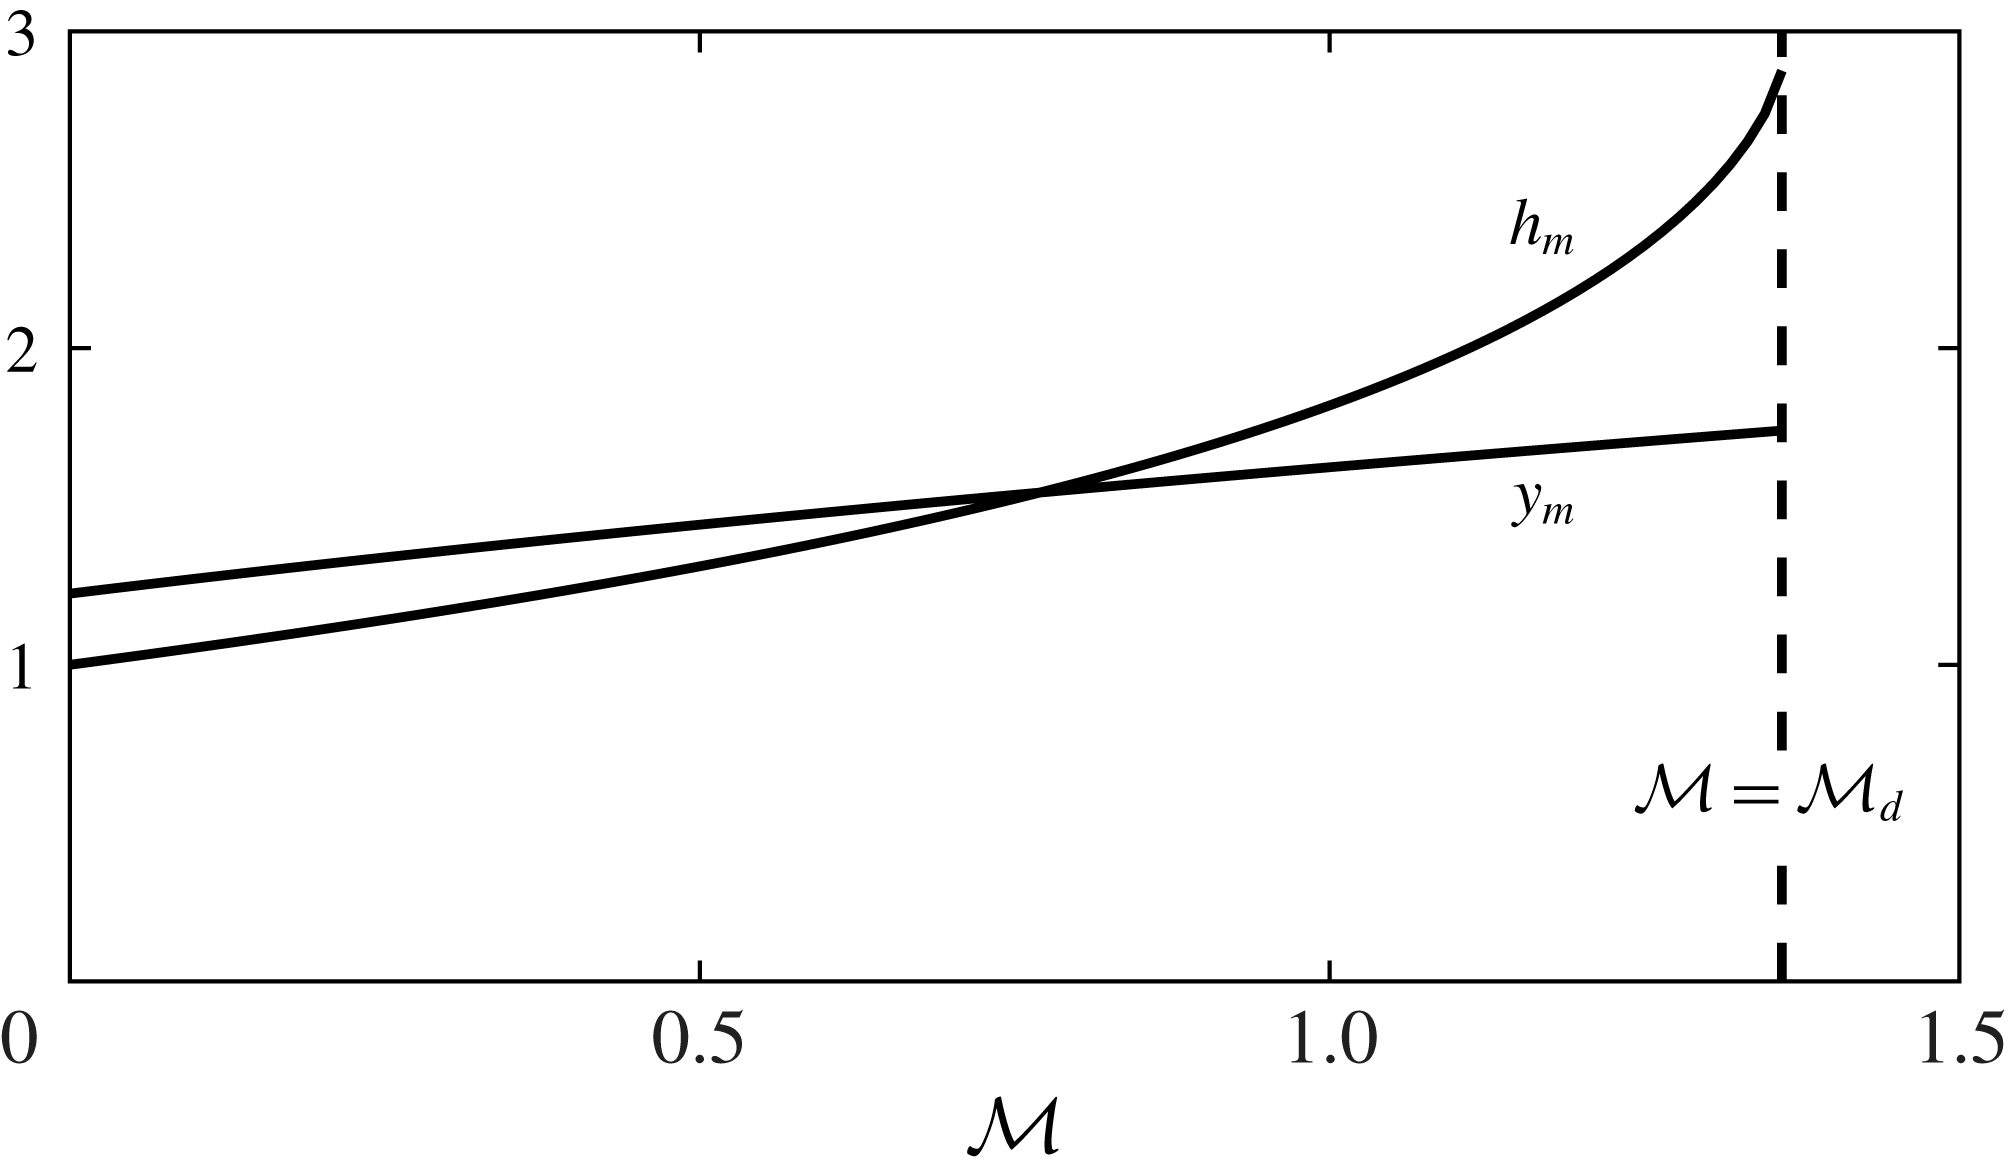
). The variation of
 $h_{m}$
and
 $y_{m}$
with the dimensionless mound size,
 ${\mathcal{M}}$
, is plotted in figure 13, noting that for
 ${\mathcal{M}}>{\mathcal{M}}_{d}$
the downstream depth has become infinite at
 $y=y_{b}$
and that for
 ${\mathcal{M}}<{\mathcal{M}}_{d}$
both
 $h_{m}$
and
 $y_{m}$
increase monotonically with
 ${\mathcal{M}}$
due to the increased flow deflection around the mound.
To analyse the downslope diffusive term in a neighbourhood of
 $x_{1}$
along the symmetry axis (
 $y=0$
), we introduce the rescalings
 $$\begin{eqnarray}\displaystyle x=x_{1}+{\mathcal{F}}^{\unicode[STIX]{x1D6FC}}\unicode[STIX]{x1D709},\quad h={\mathcal{F}}^{\unicode[STIX]{x1D6FC}k}\tilde{h}, & & \displaystyle\end{eqnarray}$$
where the scaling for
 $h$
is motivated by the behaviour of the characteristic solution (5.7) and (5.8). Using the governing equation (2.12), we find that along the centreline
 $\tilde{h}$
satisfies
 $$\begin{eqnarray}\displaystyle \frac{1}{4}\frac{\unicode[STIX]{x2202}^{2}\tilde{h}^{4}}{\unicode[STIX]{x2202}\unicode[STIX]{x1D709}^{2}}+A_{{\mathcal{M}}}\unicode[STIX]{x1D709}\frac{\unicode[STIX]{x2202}\tilde{h}^{3}}{\unicode[STIX]{x2202}\unicode[STIX]{x1D709}}+B_{{\mathcal{M}}}\tilde{h}^{3}=0, & & \displaystyle\end{eqnarray}$$
where we have chosen
 $$\begin{eqnarray}\displaystyle \unicode[STIX]{x1D6FC}=(2-k)^{-1}, & & \displaystyle\end{eqnarray}$$
for a balance and
 $$\begin{eqnarray}\displaystyle A_{{\mathcal{M}}}={\mathcal{M}}\left.\frac{\unicode[STIX]{x2202}^{2}m}{\unicode[STIX]{x2202}x^{2}}\right|_{x=x_{1},y=0},\quad B_{{\mathcal{M}}}={\mathcal{M}}\unicode[STIX]{x1D6FB}^{2}m|_{x=x_{1},y=0} & & \displaystyle\end{eqnarray}$$
are constants. The boundary condition for (5.11) as
 $\unicode[STIX]{x1D709}\rightarrow -\infty$
is provided by the limiting behaviour of the characteristic solution along the centreline, given by (5.7). Writing this in terms of
 $\tilde{h}$
and
 $\unicode[STIX]{x1D709}$
, we find that
 $$\begin{eqnarray}\displaystyle \tilde{h}=C_{{\mathcal{M}}}(-\unicode[STIX]{x1D709})^{k}, & & \displaystyle\end{eqnarray}$$
where
 $C_{{\mathcal{M}}}$
is a constant that can be determined from the limit of the numerical solution to the characteristics as
 $x_{1}$
is approached. We solve for
 $\tilde{h}$
by assuming
 $\tilde{h}$
has compact support, shooting from
 $\tilde{h}(\unicode[STIX]{x1D709}_{0})=0$
and iterating to find
 $\unicode[STIX]{x1D709}_{0}$
by matching with the boundary condition (5.14) as
 $\unicode[STIX]{x1D709}\rightarrow -\infty$
. To shoot from
 $\tilde{h}=0$
we need two boundary conditions. Taking the limit of small
 $\tilde{h}$
in (5.11), we determine the behaviour near
 $\unicode[STIX]{x1D709}_{0}$
to be
 $$\begin{eqnarray}\displaystyle \tilde{h}\sim A_{{\mathcal{M}}}\unicode[STIX]{x1D709}_{0}(\unicode[STIX]{x1D709}_{0}-\unicode[STIX]{x1D709}). & & \displaystyle\end{eqnarray}$$
Cross-slope location,
 $y_{m}$
, and magnitude,
 $h_{m}$
, of the maximum downstream flow thickness
 $h_{\infty }(\,y)$
as functions of
 ${\mathcal{M}}$
for flow over the axisymmetric mound,
 $m=\exp (-r^{2})$
.

This provides the two boundary conditions: the values of
 $h$
and its first derivative at
 $\unicode[STIX]{x1D709}\approx \unicode[STIX]{x1D709}_{0}$
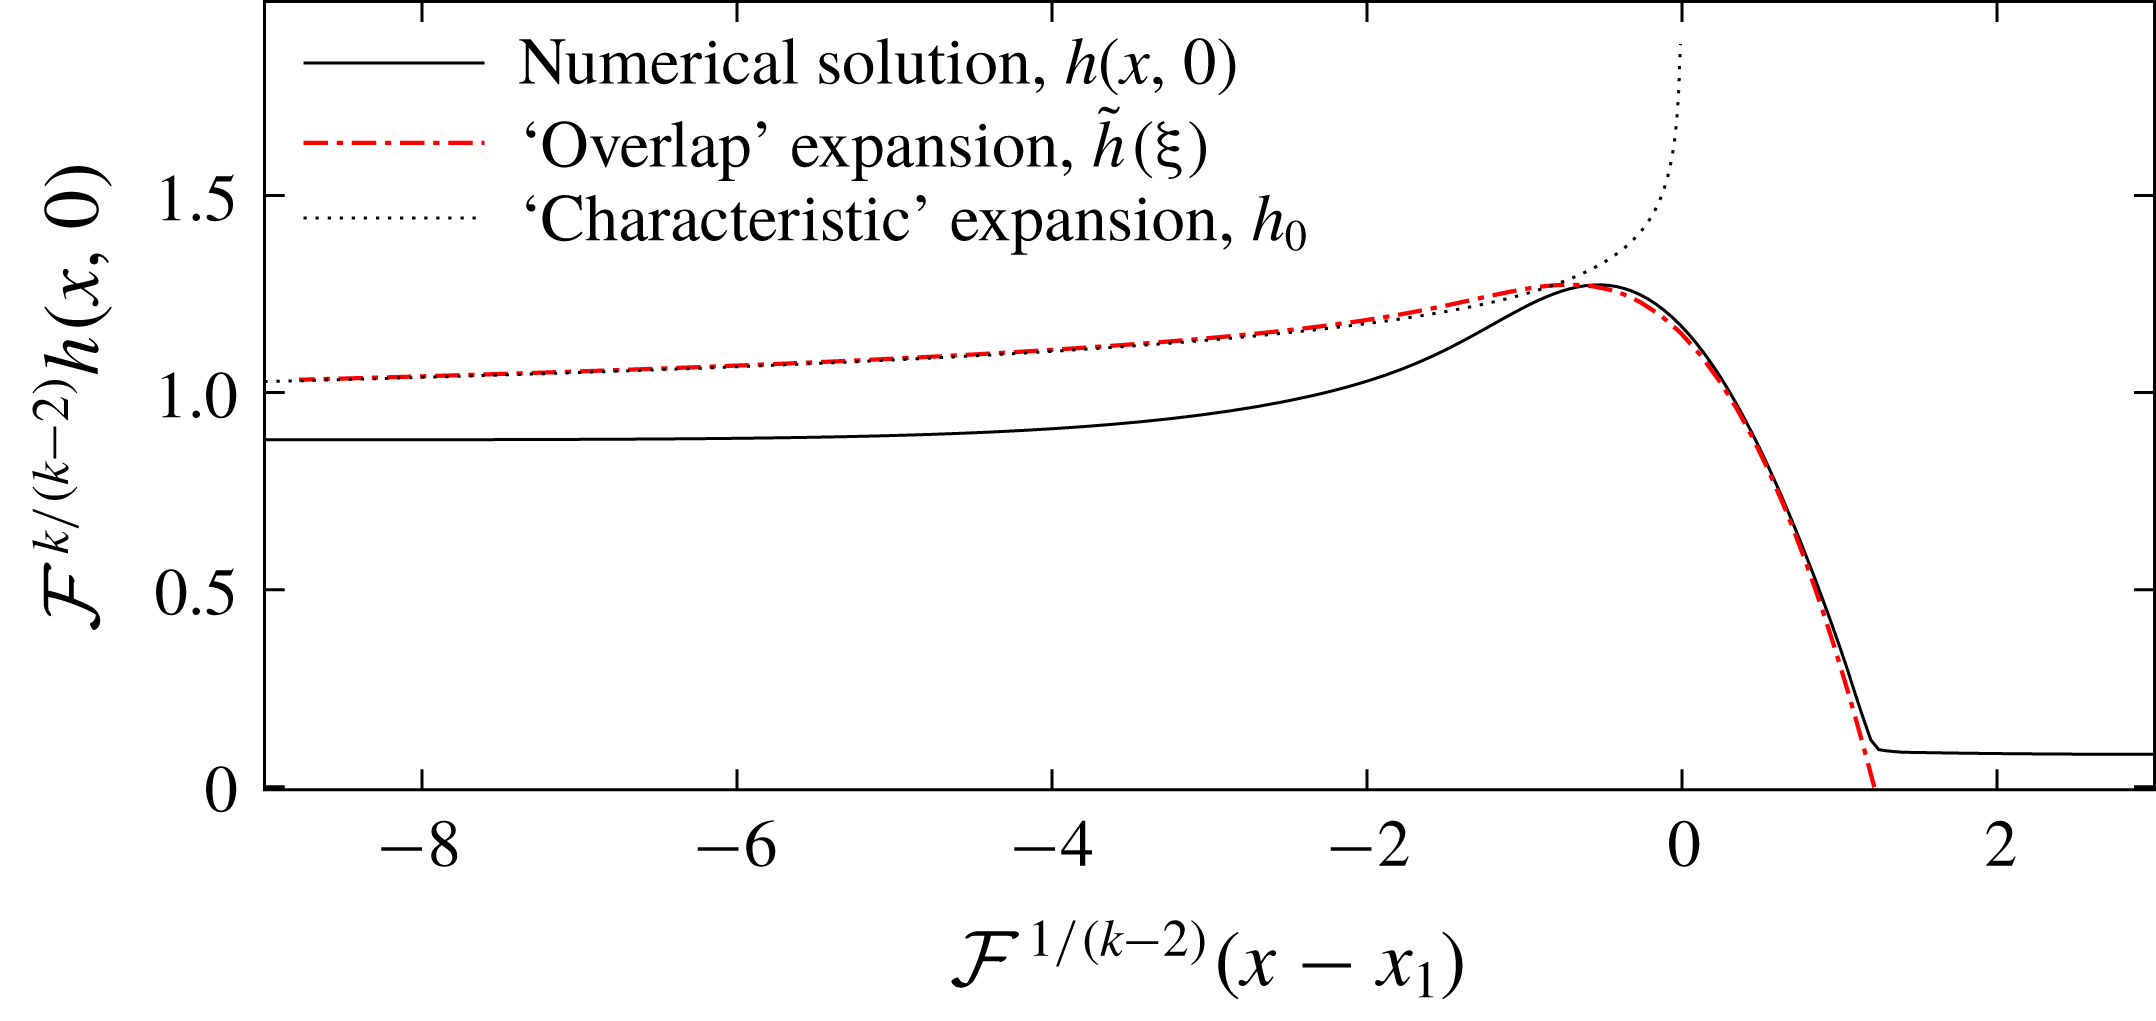
. We plot the solution to (5.11) in figure 14 for
 ${\mathcal{M}}=1.5$
as a red dashed line. The limiting behaviour, which we match to (given by (5.14)) is plotted as a black dotted line. Finally, we include a slice along the centreline of the numerical solution to the full governing equation with
 ${\mathcal{F}}=0.05$
(continuous black line). The solution to (5.11) shows excellent agreement with the numerical slice in a neighbourhood of
 $x_{1}$
. In particular, these results confirm that the downslope diffusive terms are crucial to the flow near
 $x_{1}$
but the cross-slope diffusive slumping which we have neglected is unimportant because the streamwise gradients are much larger than the lateral gradients.
Note that our analysis relies on the contact point where the depth is first zero occurring upstream of
 $x_{0}$
because the topography becomes downslope at
 $x_{0}$
in our simple mound. This corresponds to
 $$\begin{eqnarray}\displaystyle x_{1}+{\mathcal{F}}^{1/(2-k)}\unicode[STIX]{x1D709}_{0}<x_{0}, & & \displaystyle\end{eqnarray}$$
which is satisfied for sufficiently small
 ${\mathcal{F}}$
. If the contact point extends beyond
 $x_{0}$
then there is no dry region because fluid has flowed over the ‘steepest’ slope of the topography. In this case the analysis above is rendered invalid because shooting from
 $h=0$
at
 $\unicode[STIX]{x1D709}_{0}$
is incorrect. The inequality (5.16) can be used to determine the largest
 ${\mathcal{F}}$
for which dry regions occur for a given
 ${\mathcal{M}}$
. We investigate this result for elliptical mounds in § 6.
The rescaled thickness of the fluid layer as a function of distance along the line of symmetry (
 $y=0$
) for
 ${\mathcal{F}}=0.05$
and
 ${\mathcal{M}}=1.5$
for flow over the axisymmetric mound,
 $m=\exp (-r^{2})$
. We plot the solution to (5.11) with initial condition (5.15) as a red dotted dashed line. The location of
 $\unicode[STIX]{x1D709}_{0}$
is chosen to match with the limit of the characteristic solution near
 $x_{1}$
, which is plotted as a dashed black line. We include a slice along the centreline of the numerical solution from § 3, plotted as a continuous black line. It agrees well with the solution to (5.11) near
 $x_{1}$
, the depth does not become zero at
 $\unicode[STIX]{x1D709}_{0}$
in the numerical solution because of the small virtual source.

In the one-dimensional problem (§ 4) we found that beyond the critical mound height,
 ${\mathcal{M}}_{c}$
, ponding occurs and the flow thickness increases in proportion to the mound height. A regime change also occurs at this point in two dimensions because the topography becomes upslope and for the two-dimensional mound, this first occurs along the centreline,
 $y=0$
, where the mound slope is steepest. For a two-dimensional mound above the critical height,
 ${\mathcal{M}}_{c}$
, the depth in a neighbourhood of
 $x_{1}$
is given by the scaling in (5.10),
 $$\begin{eqnarray}\displaystyle h\sim {\mathcal{F}}^{k/(2-k)}. & & \displaystyle\end{eqnarray}$$
The exponent of
 ${\mathcal{F}}$
changes sign as
 $k$
changes sign. It is plotted as a function of
 ${\mathcal{M}}$
in figure 11(b). For
 ${\mathcal{M}}<{\mathcal{M}}_{d}$
, the exponent is positive and the depth of the flow is at most order
 $1$
. For a larger mound (
 ${\mathcal{M}}>{\mathcal{M}}_{d}$
), the depth along the centreline near
 $x_{1}$
is of order
 ${\mathcal{F}}^{k/(2-k)}$
, which grows as
 ${\mathcal{F}}$
becomes smaller. This corresponds to ponding upstream of the mound. The maximum flow thickness then occurs along
 $y=0$
, upstream of the mound, owing to this ponding. This is in contrast to the case of
 ${\mathcal{M}}<{\mathcal{M}}_{d}$
(see figure 13 and compare the two panels in figure 2). The ponding is much weaker than in the one-dimensional case and the mound height threshold at which it occurs is higher (for example, the exponent of
 ${\mathcal{F}}$
is
 $k/(2-k)\approx 0.04$
for
 ${\mathcal{M}}=1.5$
). This difference occurs because fluid is diverted away from the centreline and around the mound by the topography in the cross-slope direction, whereas in the one-dimensional problem, the pond has to grow until it overcomes the mound.
The flow thickness near
 $(x_{1},0)$
tends to zero and we anticipate that this dry edge is propagated by the characteristics as indicated in figure 9. Further downstream, the characteristics become parallel to the
 $x$
axis and we anticipate that the
 $y$
gradients are non-negligible here. Thus cross-slope diffusive slumping becomes important and this acts to ‘close’ the dry region downstream, which we investigate below.
5.1 Downstream ‘outer’ region
To leading order, the regular asymptotic expansion described above converges to a fixed shape in
 $y$
far downstream, i.e.
 $h\rightarrow h_{\infty }(\,y)$
as
 $x\rightarrow \infty$
(see figure 9, right-hand column). Cross-channel diffusive slumping, which was neglected at leading order, smooths this shape so that the depth converges to unity everywhere distant from the mound. This motivates an ‘outer’ region, in which we rescale only the downstream coordinate
 $x$
to incorporate the second-order derivative in
 $y$
 $$\begin{eqnarray}\displaystyle x=\hat{x}/{\mathcal{F}}. & & \displaystyle\end{eqnarray}$$
Then the leading-order terms in (2.12) are
 $$\begin{eqnarray}\displaystyle \frac{\unicode[STIX]{x2202}h^{3}}{\unicode[STIX]{x2202}\hat{x}}=\frac{1}{4}\frac{\unicode[STIX]{x2202}^{2}h^{4}}{\unicode[STIX]{x2202}y^{2}}, & & \displaystyle\end{eqnarray}$$
which represents a balance between downslope advection and cross-channel diffusive slumping. We use the far downstream shape of our ‘inner’ asymptotic solution,
 $h_{\infty }(\,y)$
, (see figure 9
aiii) as the ‘initial’ condition at
 $\hat{x}=0$
to solve the nonlinear diffusion equation (5.19) numerically. The cross-slope shape converges to
 $h=1$
everywhere, satisfying the far-field boundary condition.
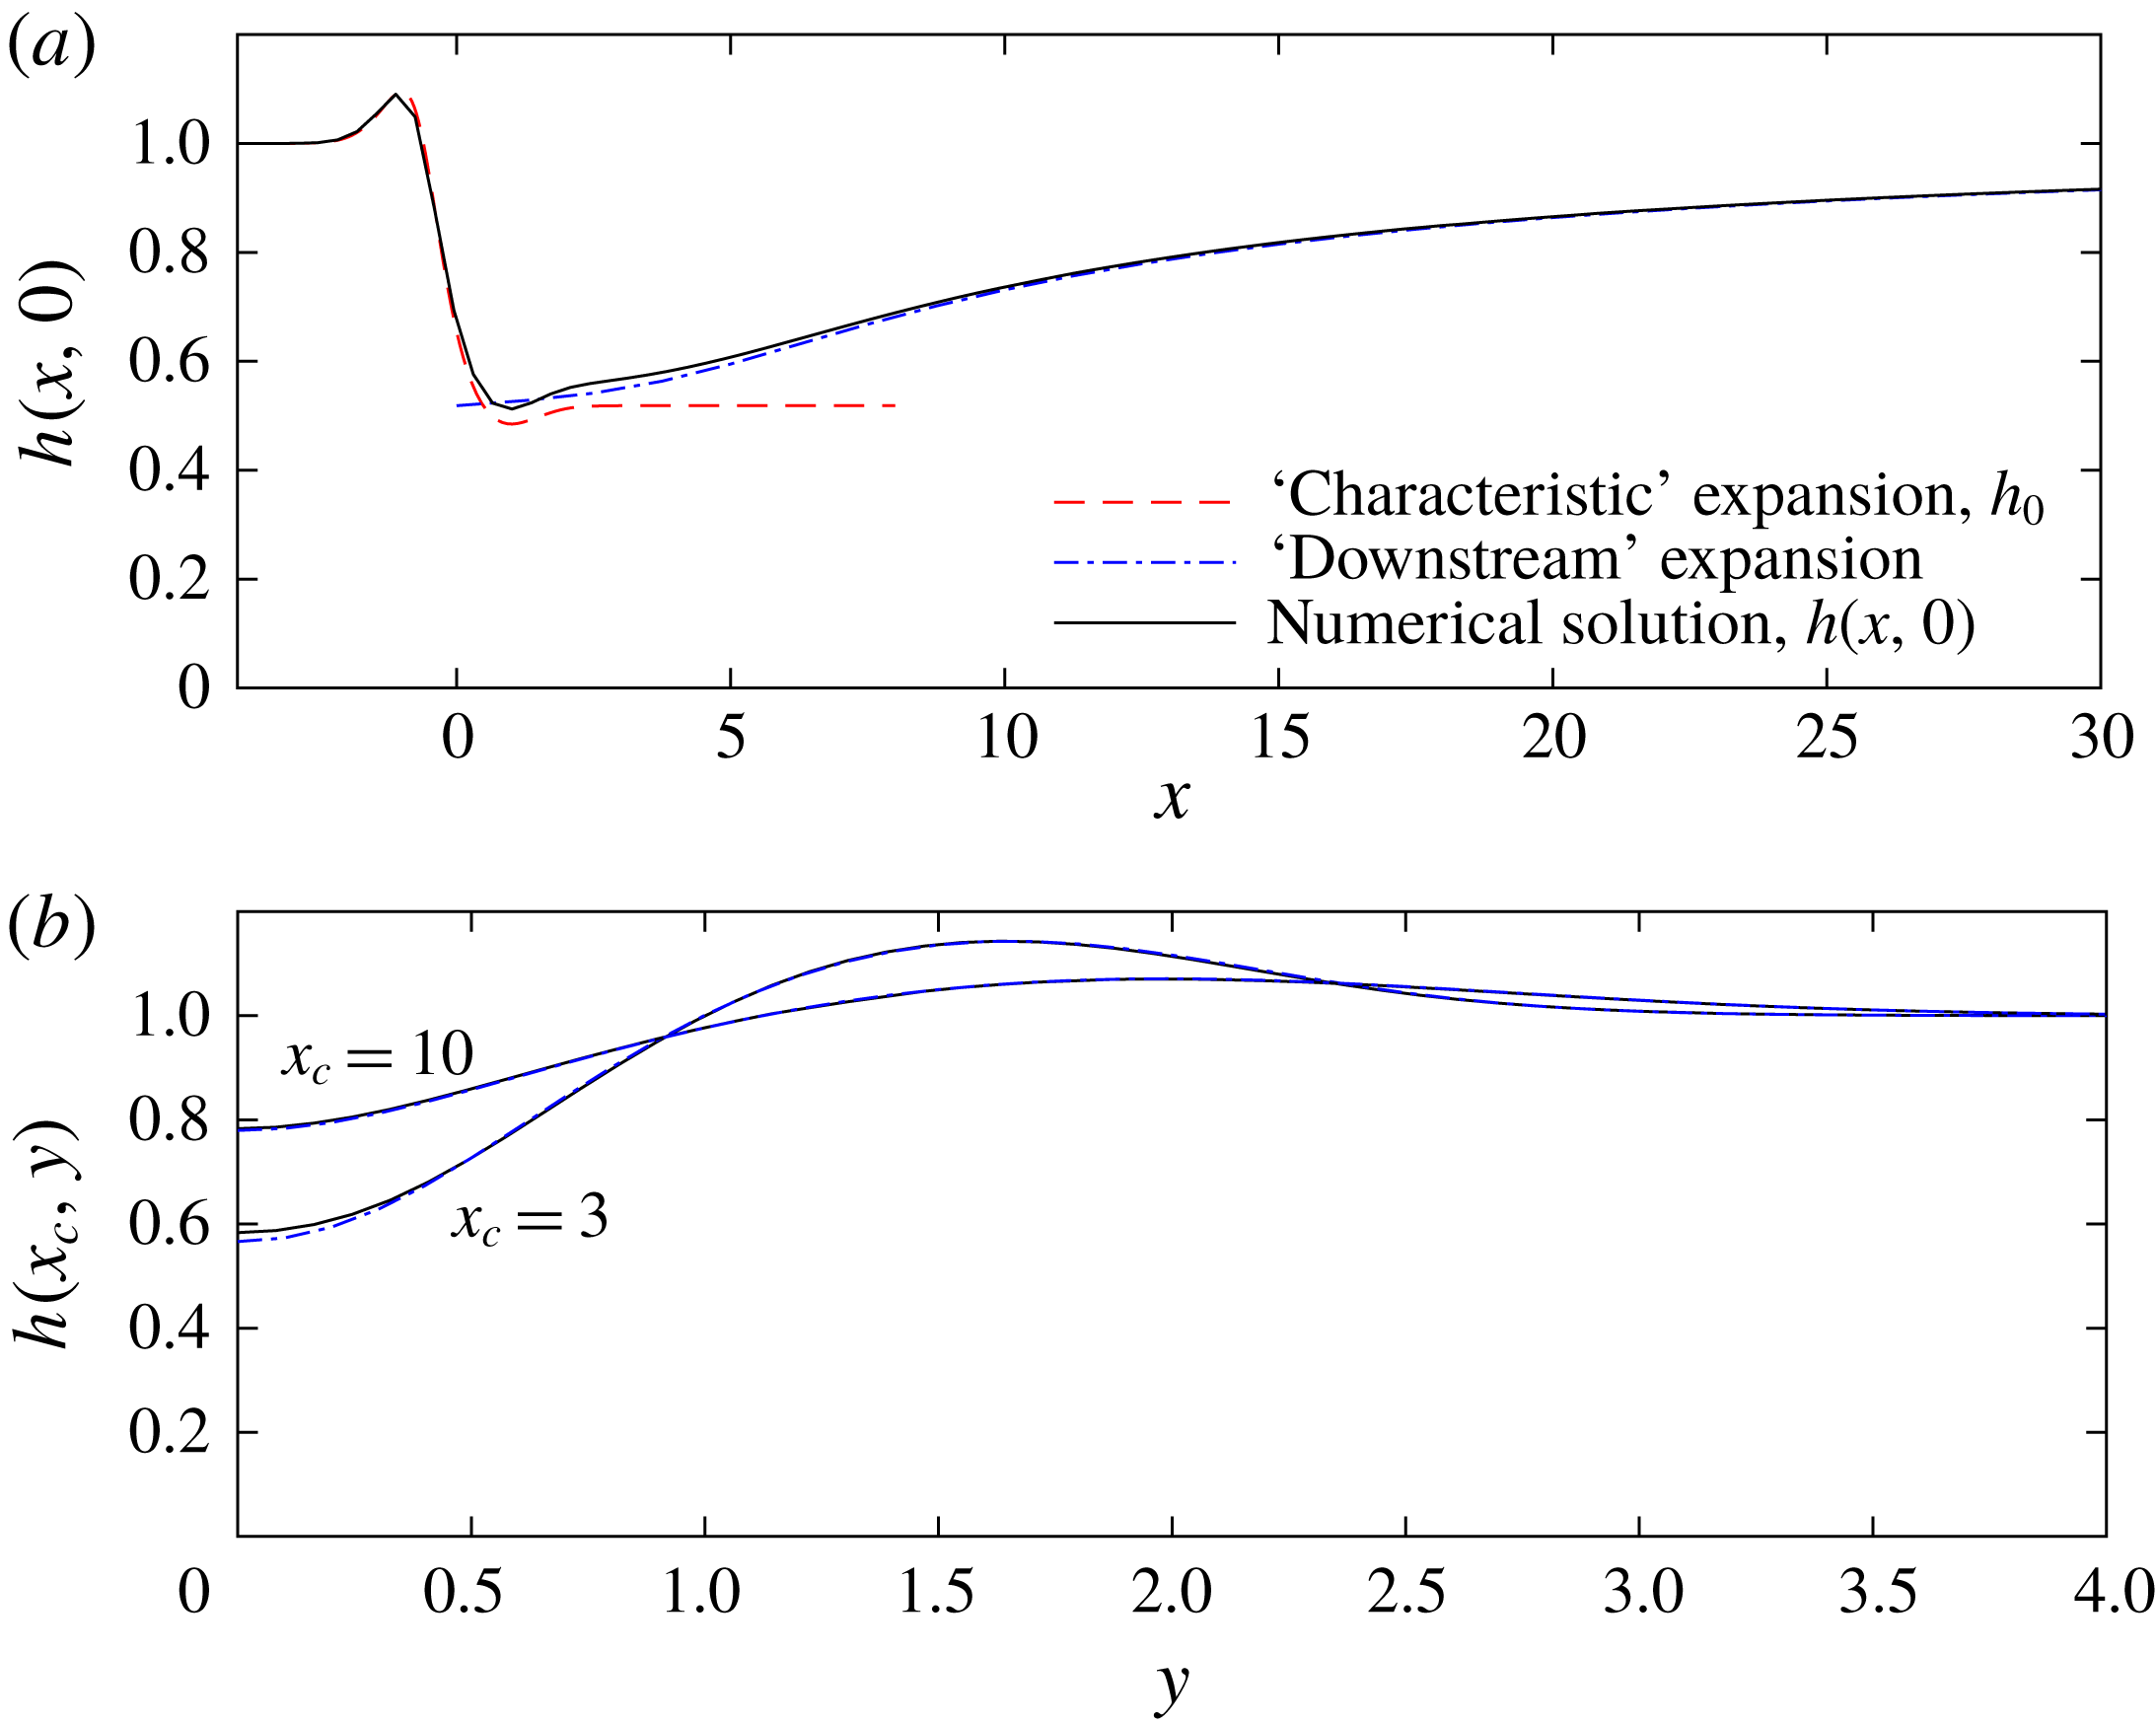
In figure 15(a), we compare this outer ‘downstream’ expansion (blue dotted-dashed line) to the numerical results from § 3 (black continuous line) along the centreline,
 $y=0$
for
 ${\mathcal{M}}=0.5$
. The inner ‘characteristic’ asymptotic expansion is included (red dashed line) to illustrate how it is accurate only upstream of the mound peak. In figure 15(b), we compare the ‘downstream’ expansion with the numerical results in the cross-slope direction at two locations, demonstrating how the flow thickness returns to unity downstream.
(a) Flow thickness along the centreline,
 $h(x,0)$
, as a function of streamwise distance. The cross-section of our numerical solution from § 3 for
 ${\mathcal{F}}=0.08$
,
 ${\mathcal{M}}=0.5$
is plotted as a continuous black line. The asymptotic ‘characteristic’ expansion that neglected the diffusive slumping terms (5.2) is plotted as a red dashed line and the ‘downstream’ expansion which balances the cross-slope slumping with the downslope advective term (see § 5.1) is plotted as a blue dashed-dotted line. (b) Flow thickness along cross-sections,
 $h(x_{c},y)$
, as a function of the cross-slope direction at various locations downslope from the mound, plotting the numerical solution (solid line) and the asymptotic solution (dot-dashed line).

For larger mounds in the domain
 ${\mathcal{M}}>{\mathcal{M}}_{c}$
, the same technique can be applied to determine the downstream shape, but care must be taken in selecting the correct ‘initial’ condition for (5.19). The downstream limit of the characteristic solution for
 ${\mathcal{M}}>{\mathcal{M}}_{c}$
(figures 9
biii and 9
ciii) has large gradients and is not an accurate approximation to the true depth near
 $x=0$
because the neglected diffusive terms are significant. The shapes in figures 9(biii) and 9(ciii) do not provide good initial conditions. Instead, we take a
 $y$
cross-section of the numerical solution at
 $x=0$
as the initial condition.
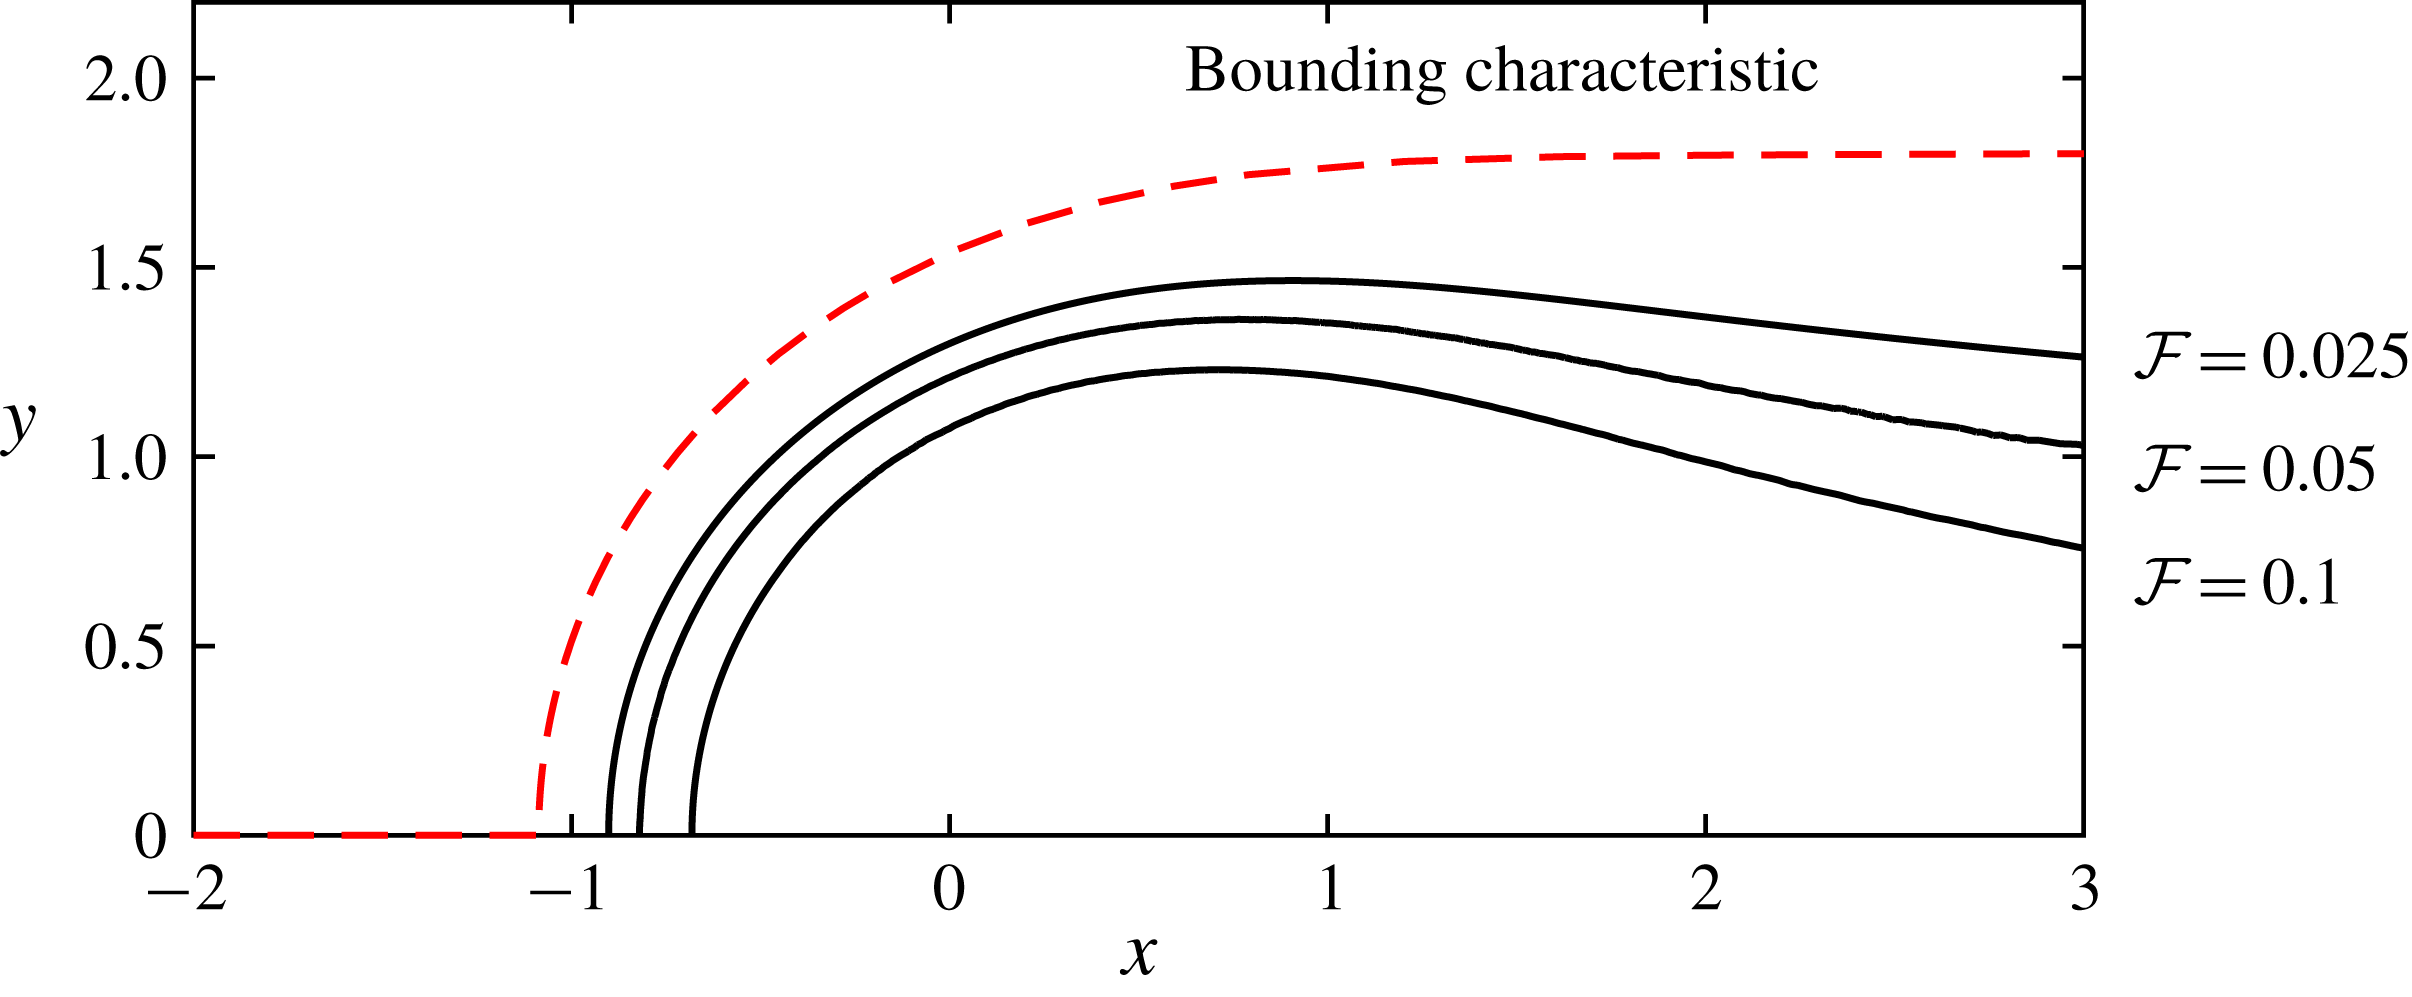
In figure 16, we compare the shape of the dry region predicted by the limiting characteristic and the shape of the dry region from the numerical results for
 ${\mathcal{M}}=1.5$
and three values of
 ${\mathcal{F}}$
. The importance of diffusive slumping is proportional to
 ${\mathcal{F}}$
and hence the closing of the dry region is faster for larger
 ${\mathcal{F}}$
.
Shape of the edge of the ‘dry’ region predicted by the characteristics (red dashed line) and the shape found from our numerical simulations for three values of
 ${\mathcal{F}}$
, with
 ${\mathcal{M}}=1.5$
.

5.2 Summary
We have found three regimes for a shallow oncoming flow (
 ${\mathcal{F}}\ll 1$
) over an axisymmetric mound. For small mounds in which the slope is nowhere uphill (
 ${\mathcal{M}}<{\mathcal{M}}_{c}$
), the flow goes over and around the mound and there are no dry regions. Mounds in the second regime, for which
 ${\mathcal{M}}_{c}<{\mathcal{M}}<{\mathcal{M}}_{d}$
, give rise to dry regions. The flow thickness is order
 $1$
with respect to
 ${\mathcal{F}}$
because sufficient flux of the fluid flows around the mound. For the larger mound regime,
 ${\mathcal{M}}>{\mathcal{M}}_{d}$
, there is a dry region and the depth upstream of the mound increases as
 ${\mathcal{F}}^{k/(2-k)}$
, with
 $k<0$
(see (5.10)). This weak dependence of the depth on
 ${\mathcal{F}}$
corresponds to the signature of ponding in two dimensions. We note that our analysis applies to any axisymmetric mound, although
 ${\mathcal{M}}_{c}$
and
 ${\mathcal{M}}_{d}$
may take different values. In the next section, we consider a more general class of mound.
6 Implications for barrier design
In this section we apply our analysis to inform efforts at designing barriers to protect towns and infrastructure from lava flows. To maximise the region downstream that is protected whilst minimising the overall size, barriers should be wider in the cross-flow direction than they are in the along-flow direction. This motivates considering mounds with elliptical contours; we suppose that the mound has cross-flow length scale
 $W$
and along-flow length scale
 $L$
. We use the same non-dimensionalisation as in § 2 and consider an elliptical Gaussian mound of profile
 $$\begin{eqnarray}\displaystyle m(x,y)=\exp [-(x^{2}+(y/w)^{2})], & & \displaystyle\end{eqnarray}$$
where
 $w=W/L$
is the aspect ratio of the elliptical contours of the mound. Note from (5.3) and (5.7) we deduce that this adjusts
 $k$
to
 $$\begin{eqnarray}\displaystyle k=\frac{2x_{1}^{2}-1-w^{-2}}{3(1-2x_{1}^{2})}. & & \displaystyle\end{eqnarray}$$
The asymptotic analysis for an axisymmetric mound from § 5 can be repeated for an elliptical mound. We can use the inequality (5.16) to determine how shallow the upstream flow must be for dry regions to occur. We plot the critical value of
 ${\mathcal{F}}$
at which a dry region first occurs,
 ${\mathcal{F}}_{c}$
, in figure 17 for an axisymmetric mound (
 $w=1$
) and three elliptical mounds. In the limit
 $w\rightarrow \infty$
, the critical line tends to
 ${\mathcal{F}}_{c}=0$
. Thus, in this limit, the mound is overcome by the flow, and we recover the results of § 4 for flow over a one-dimensional mound.
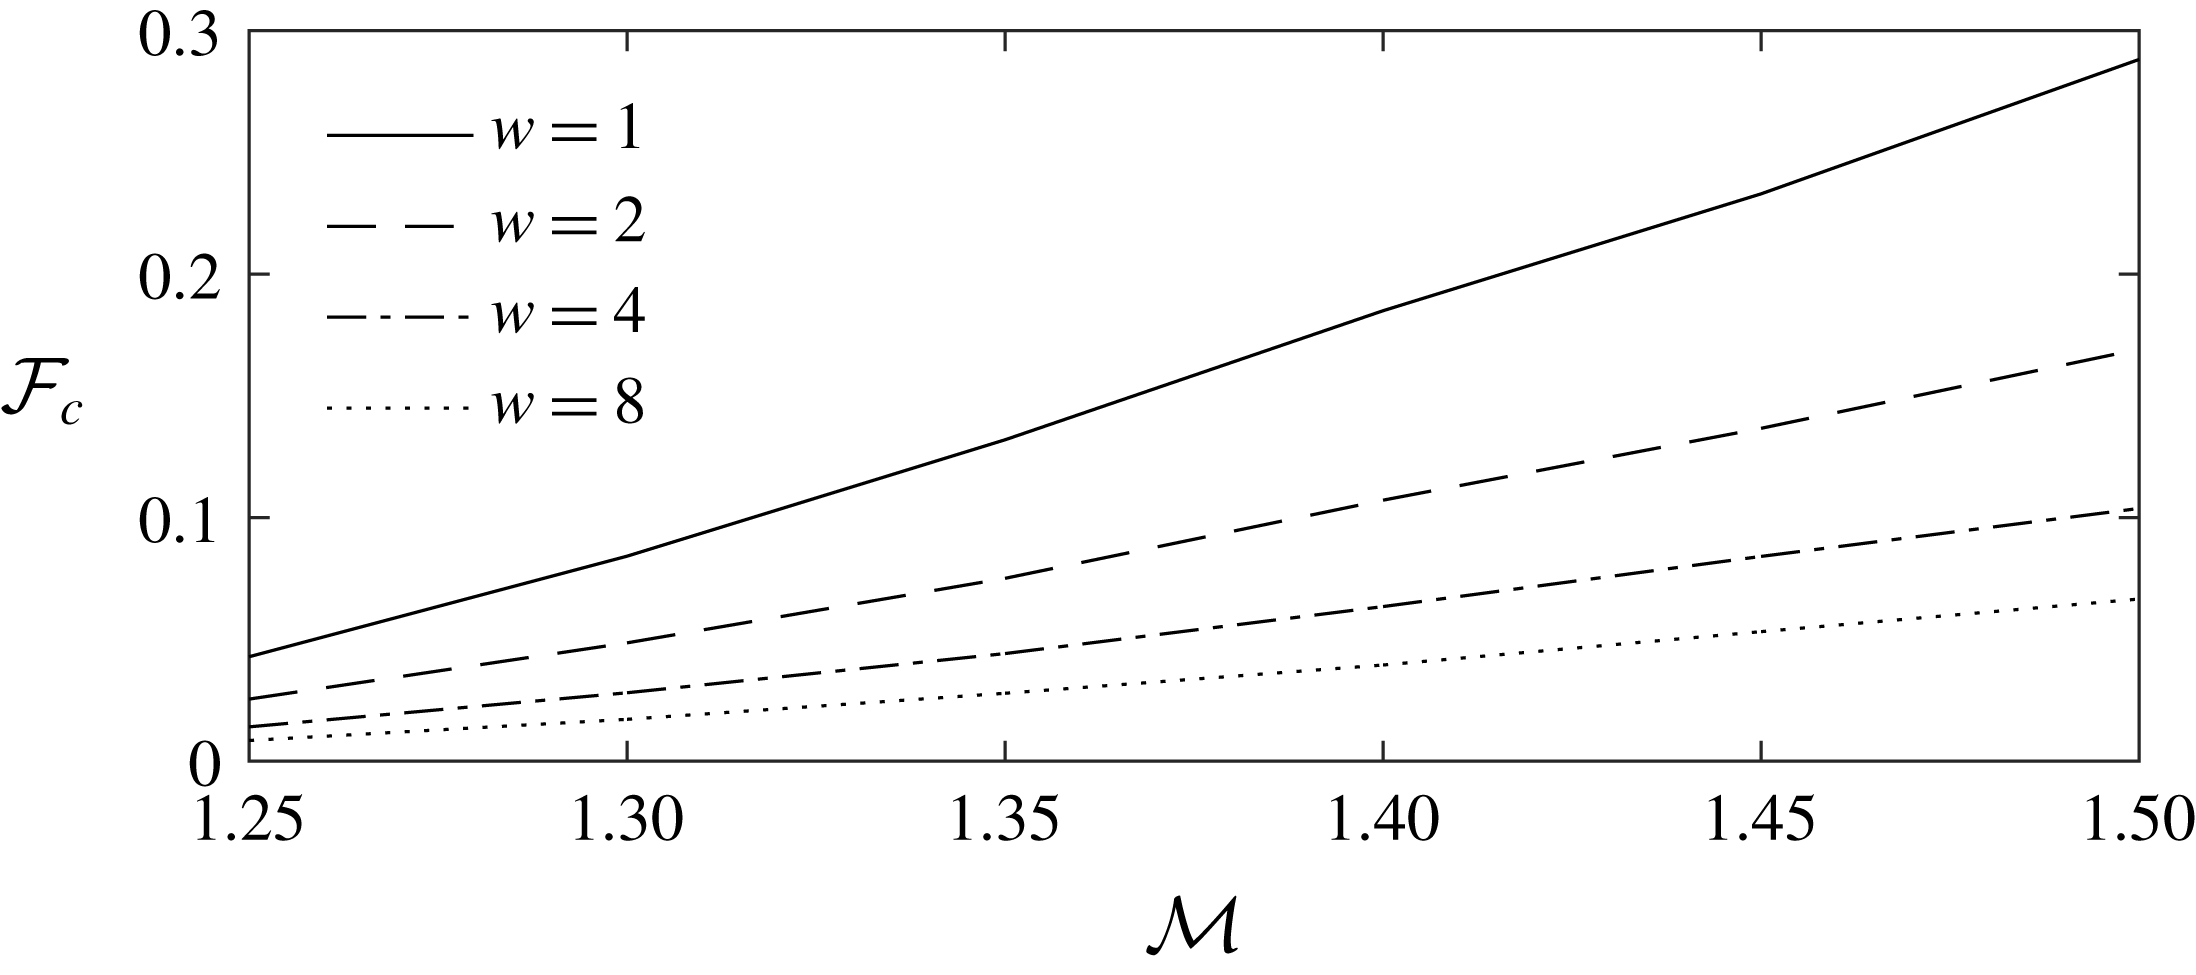
The dimensionless upstream depth,
 ${\mathcal{F}}_{c}$
at which dry regions first occur as a function of dimensionless mound size,
 ${\mathcal{M}}$
. For
 ${\mathcal{M}}>{\mathcal{M}}_{c}$
dry regions occur as the upstream flow depth (
 ${\mathcal{F}}$
) tends to zero. We plot how small the flow depth must be for dry regions to occur for different non-dimensional mound widths,
 $w$
. The results are obtained from the inequality (5.16). Wider mounds should be built taller to defend against the same depth flow because the upstream ponding, which can overtop the mound, is enhanced.

Figure 17 demonstrates that if a mound is widened but not heightened (i.e.
 $w$
is increased and
 ${\mathcal{M}}$
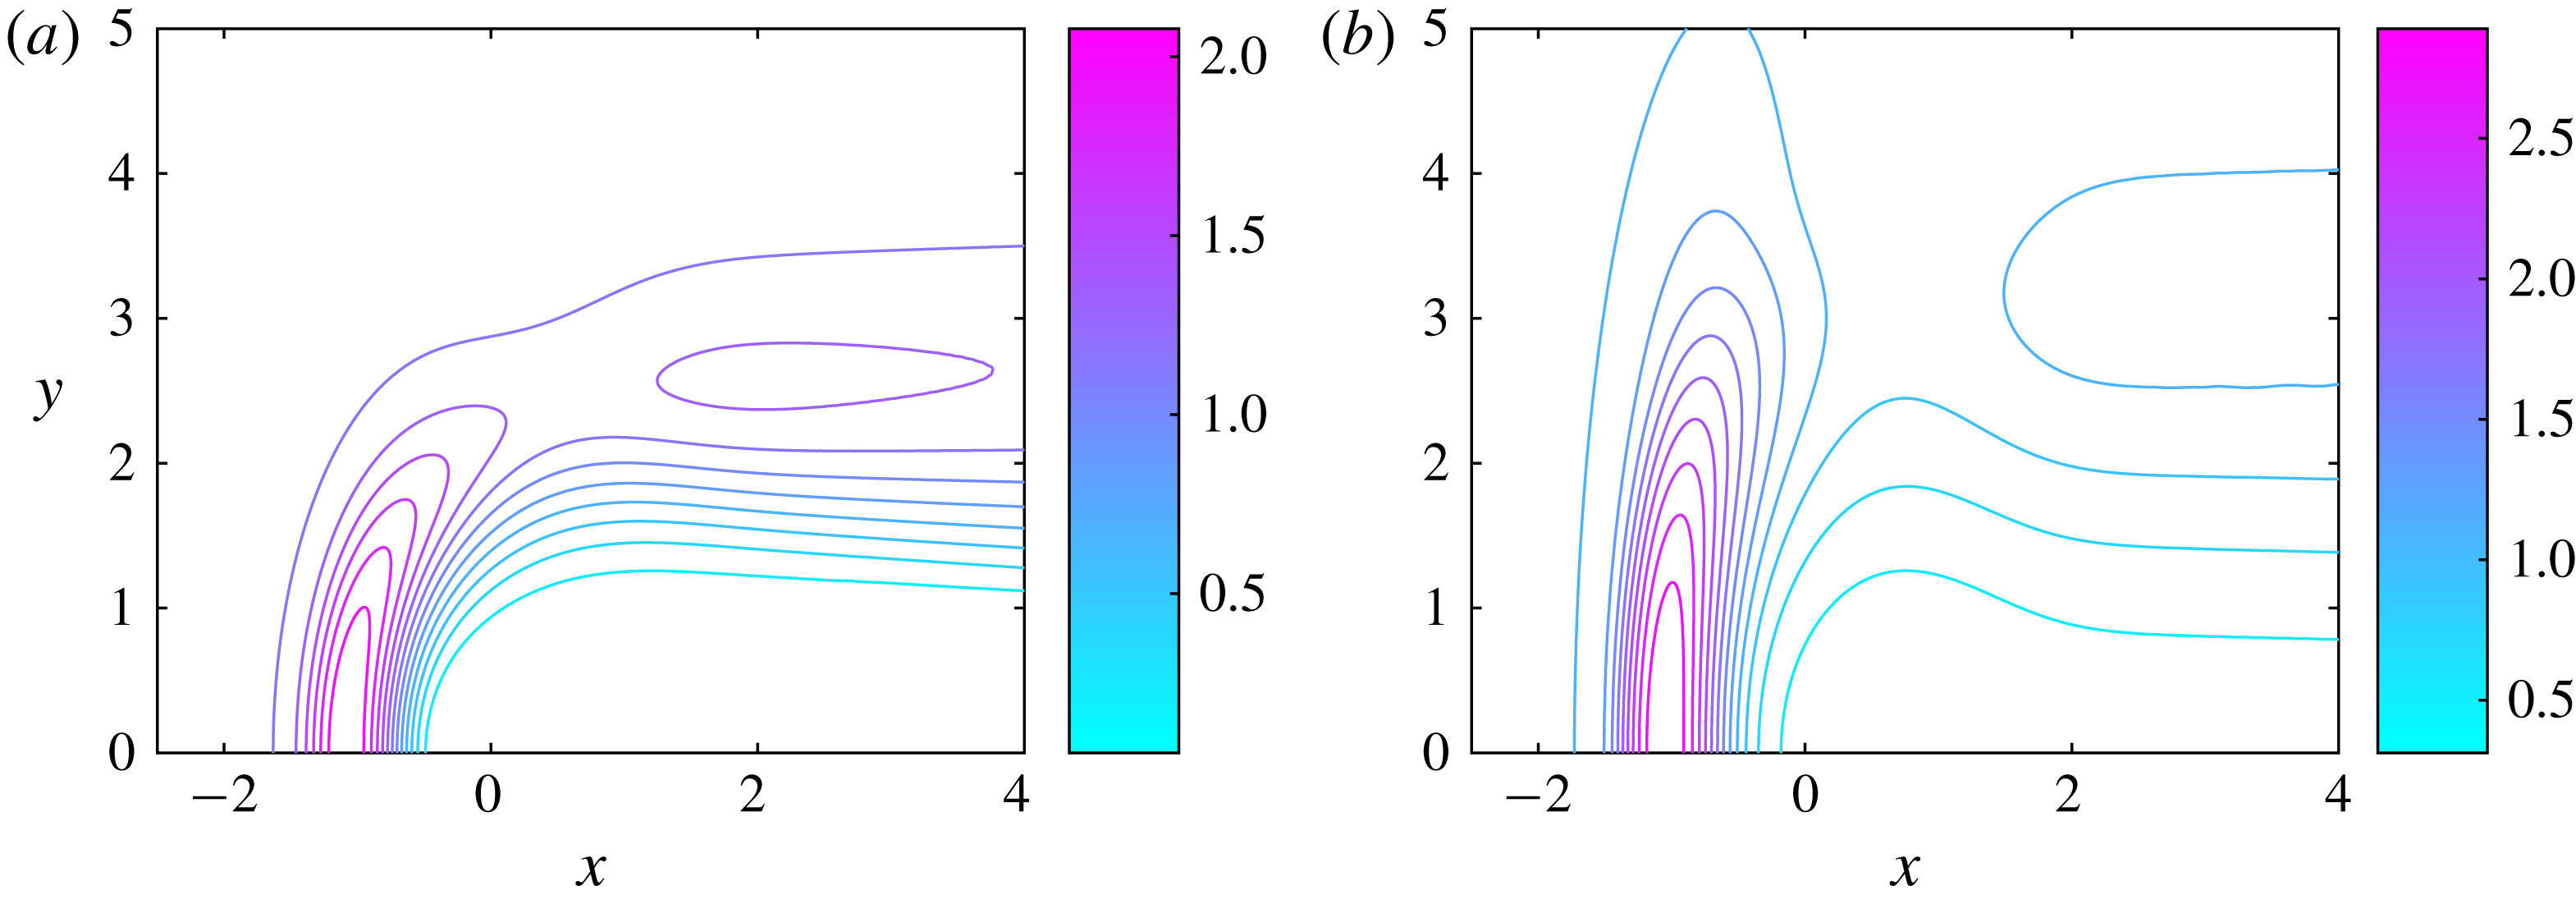
held fixed), then the depths of flows which it defends against is reduced. In figure 18, contours of the flow thickness are plotted for
 ${\mathcal{F}}=0.05$
and
 ${\mathcal{M}}=1.4$
for different mound widths,
 $w$
. In figure 18(a),
 $w=2$
and there is a dry region, whilst in figure 18(b)
 $w=4$
and there is no dry region. The difference arises because the ponding upstream is stronger for a wider mound. The increased ponding can overtop the mound. This effect is crucial for informing barrier construction (for example in the Mt. Etna 1991–93 eruption, see Barberi & Carapezza (Reference Barberi and Carapezza2013)).
We illustrate the importance of ponding by considering the necessary dimensions for an example Gaussian barrier which is 200 metres wide and has a streamwise length scale of 50 metres, on a slope with a gradient of 20 %. To defend against a one metre high flow, the barrier would need to be 15 metres high. If instead the barrier was only 50 metres wide, then it would need to be about 13 metres high to provide a safe, dry region. These results approximately agree with the simulations of Chirico et al. (Reference Chirico, Favalli, Papale, Boschi, Pareschi and Mamou-Mani2009), who suggested that barriers ought to be five to ten times the height of the average lava flow thickness.
Contour plots of the steady flow thickness above the topography in the case of an ‘elliptical’ mound with
 ${\mathcal{F}}=0.05$
and
 ${\mathcal{M}}=1.4$
: (a)
 $w=2$
; there is a dry region with boundary given by the contour of least thickness, (b)
 $w=4$
; for a wider mound, the ponding effect is stronger and the flow overcomes the mound (cf. figure 17). Note the different scales for the thickness.

6.1 Stress on mounds
We have used our results to suggest barrier dimensions but we can also calculate estimates of the force that barriers must withstand. A major engineering concern is that the lava pond which can develop upstream of a barrier exerts a large force and can even rupture the barrier (Moore Reference Moore1982).
To obtain an upper bound on the force exerted by the pond, we consider a very wide mound (
 $w\gg 1$
) which is on the verge of being overtopped by the oncoming flow. This situation is well approximated by the flow over a one-dimensional mound in which the flow thickness is much greater upstream of the mound than over the mound. Recall (see (4.18)) that in the ponding region
 $$\begin{eqnarray}\displaystyle h_{p}\sim {\mathcal{F}}^{-1}\{x-x_{0}+{\mathcal{M}}[m(x_{0})-m(x)]\}+\cdots & & \displaystyle\end{eqnarray}$$
the flow surface is horizontal (perpendicular to the direction of gravity) and hence the velocity is approximately zero (cf. (2.14)). Therefore, the leading-order contribution to the stress comes from the weight of the fluid in the pond. This can be calculated by integrating the depth between
 $x_{2}$
and
 $x_{0}$
(where
 $x_{2}$
is calculated from (4.22) by assuming
 ${\mathcal{F}}=0$
). The dimensional force per unit length in the downslope direction is given by
 $$\begin{eqnarray}\displaystyle \unicode[STIX]{x1D70C}gLH_{\infty }\sin \unicode[STIX]{x1D6FD}\int _{x_{2}}^{x_{0}}h_{p}\,\text{d}x=\unicode[STIX]{x1D70C}gL^{2}f({\mathcal{M}})\tan \unicode[STIX]{x1D6FD}\sin \unicode[STIX]{x1D6FD}, & & \displaystyle\end{eqnarray}$$
where
 $$\begin{eqnarray}\displaystyle f({\mathcal{M}})={\mathcal{M}}^{2}[m(x_{0})^{2}-m(x_{2})^{2}]/2-{\mathcal{M}}\int _{x_{2}}^{x_{0}}m(x)\,\text{d}x. & & \displaystyle\end{eqnarray}$$
This upper bound is independent of the upstream flow depth,
 $H_{\infty }$
, because it quantifies the stress exerted in the case of the deepest flow which does not overtop the mound.
Consider a mound barrier with
 $L=50~\text{m}$
and
 ${\mathcal{M}}=1.5$
for which
 $f({\mathcal{M}})\approx 0.83$
. We suppose the oncoming lava is two and a half times as dense as water and the slope is of gradient
 $0.25$
. With these parameters, equation (6.4) predicts that the maximum force per unit width exerted on the mound is
 $1.2\times 10^{7}~\text{N}~\text{m}^{-1}$
.
7 Conclusion
In this study we have investigated theoretically the interaction between a fully developed, free-surface flow of viscous fluid down an inclined plane with topographic features. Our results were derived on the basis that the flow is shallow, which in the context of this study requires that the flow thickness is much less than the downslope extent of the topographic feature. In this regime, the pressure is hydrostatic to leading order and we computed the steady flow around and over isolated mounds. Our study was in part motivated by the need to inform the design and dimensioning of barriers that deflect lava flows away from built infrastructure. Our results were computed numerically and very often we employed asymptotic analysis to examine some of their key features.
A particular feature of our study has been the ways in which the mound causes a significant perturbation to the oncoming flow through deflecting its passage around the barrier, the development of ‘dry’ zones in the downslope wake of the barrier or by the establishment of upstream, ponded regions within which the thickness of the flow is enhanced. We showed that a key discriminant of when the flow became significantly affected by the topography was when its gradient points upwards (i.e.
 $\unicode[STIX]{x1D735}h\boldsymbol{\cdot }\boldsymbol{g}<0$
, where
 $\boldsymbol{g}$
is gravitational acceleration). In such circumstances we showed for one-dimensional obstacles, namely those that do not vary with the lateral coordinate, that the flow develops a pond upstream as it deepens to overtop the barrier. However, for axisymmetric mounds, the flow may be deflected around the obstacle rather than just overtopping it, potentially leading to downslope dry zones into which the fluid does not flow. The existence and dimensions of the dry zones are controlled by the amplitude of the mound. Flow around non-axisymmetric mounds featured the same phenomena, although as the mound became wider, the deflection of the flow was reduced, ponding was enhanced, and the dry zone was potentially eradicated.
In future studies, it would be interesting to analyse further controls on the interactions with topography that emerge if the flowing material exhibit some of the non-Newtonian rheology associated with lava flows. Additionally, it would be interesting to analyse the motion around tall, surface-piercing obstacles and to carry out analogue laboratory experiments to complement our theoretical work; this work is currently underway (Hinton, Hogg & Huppert Reference Hinton, Hogg and Huppert2019). The application of our results to field data from real lava flows is another area of our concern. A key challenge is determining how the crust formation at the front of a lava flow influences the shape of the ‘safe’ zone downstream of an obstruction.
Acknowledgements
This work was initiated at the 2018 Geophysical Fluid Dynamics summer program, Woods Hole Oceanographic Institution, which is supported by the National Science Foundation (award no. 1332750) and the Office of Naval Research. We thank the participants for many helpful conversations on the porch of Walsh Cottage.