



Background
Cardiovascular disease is a leading cause of death and disability in the United States, accounting for one out of every three deaths.Reference Lloyd-Jones, Adams and Brown 1 Although clinical manifestations usually present in adulthood, the atherosclerotic process begins in the first decade of life. Pathologically, the process begins with accumulation of cholesterol and lipids in the intimal layer of the arterial wall, which stimulates inflammation. There is ensuing deposition of calcium and collagen, as well as decreased elastin in the wall, resulting in arterial stiffening over time. Comorbid conditions such as hypertension, diabetes, obesity, or dyslipidaemia accelerate these processes through wall shear stress, advanced glycation end products, or lipid deposition.Reference Zieman, Melenovsky and Kass 2
Accelerated atherosclerosis can be contained by preventing the onset of or by modifying risk factors such as obesity, hypertension, insulin resistance, dyslipidaemia, cigarette smoke exposure, and physical inactivity. 3 Such risk factors often cluster in children. Risk factor screening has been the primary mechanism for identifying children at risk for atherosclerosis. The effects of these risk factors on the vasculature can, however, vary based on the severity of the risk factor, length of exposure to the risk, interaction between risk factors, and interaction with known or unknown genetic and environmental predispositions. Thus, a single test that could quantify the effects of risk factors on the vasculature could serve as a robust tool for assessing arterial health in children.
Currently, there are various non-invasive tests that assess vascular health by examining arterial structure and function. These include arterial endothelial functional assessments such as flow-mediated vasodilatationReference Celermajer, Sorensen and Gooch 4 , structural assessments such as measurement of carotid artery intima–media thicknessReference Crouse, Craven and Hagaman 5 , or measurement of arterial stiffness and distensibility.Reference Riley, Barnes and Evans 6 Flow-mediated vasodilatation, a measure of vascular endothelial function, has been shown to be deranged in children in a variety of conditions such as obesityReference Kelly, Wetzsteon and Kaiser 7 , hypertensionReference Aggoun, Farpour-Lambert and Marchand 8 , type 1 diabetesReference Jarvisalo, Raitakari and Toikka 9 , dyslipidaemiaReference de Jongh, Lilien and op’t Roodt 10 , and chronic renal disease.Reference Kari, Donald and Vallance 11 Studies have shown that the presence of cardiovascular risk factors in childhood is also associated with structural changes in the arteries measured as increased carotid artery intima–media thickness during childhoodReference Meyer, Kundt and Steiner 12 , Reference Woo, Chook and Yu 13 and in young adults.Reference Freedman, Dietz and Tang 14 It is intuitive to assume that a damaged vascular endothelium would first alter vascular function and then progress to deranged vascular tone and structure. However, large-scale, cross-sectional and longitudinal studies comparing functional and structural arterial assessments using uniform methodology are not available in children, thus limiting our understanding of evolution of vascular disease in children.
Assessments of flow-mediated vasodilatation and carotid artery intima–media thickness require expensive equipment, a high level of technical expertiseReference Stoner, Young and Fryer 15 , and lack standard protocols for data acquisition and analysisReference Urbina, Williams and Alpert 16 , thus limiting their application. Arterial stiffness assessment can be performed without imaging equipment and with minimal training, has been widely studied in adults, and is easily reproducible. Such non-invasive and non-imaging techniques that measure arterial stiffness – pulse wave velocity and assessment of augmentation index – have recently gained traction as methods of assessing arterial health in children. In adults, pulse wave velocity and augmentation index are predictors of both cardiovascular events and all-cause mortality.Reference Blacher, Asmar and Djane 17 , Reference Vlachopoulos, Aznaouridis and Stefanadis 18 – Reference Laurent, Boutouyrie and Asmar 20 , Reference London, Blacher and Pannier 21 Studies in children have also described changes in pulse wave velocity and augmentation index in various, commonly prevailing chronic conditions in children. In this article, we describe pulse wave velocity and augmentation index measurements, methodology, and their relevance in commonly occurring chronic conditions in children.
Part I
What is pulse wave velocity?
As the left ventricle contracts, it generates a pulse wave that begins at the ascending aorta and gets propagated forward by the elastic properties of the vessel wall. The velocity of propagation of the pulse wave can be measured as the distance travelled divided by the time taken to travel that distance:
 $${\rm Pulse}\,{\rm wave}\,{\rm velocity}\,{\equals}\,\Delta {\rm L}{\div}\Delta {\rm t}$$
where ΔL is the distance travelled by pulse wave and Δt the time taken to travel this distance.
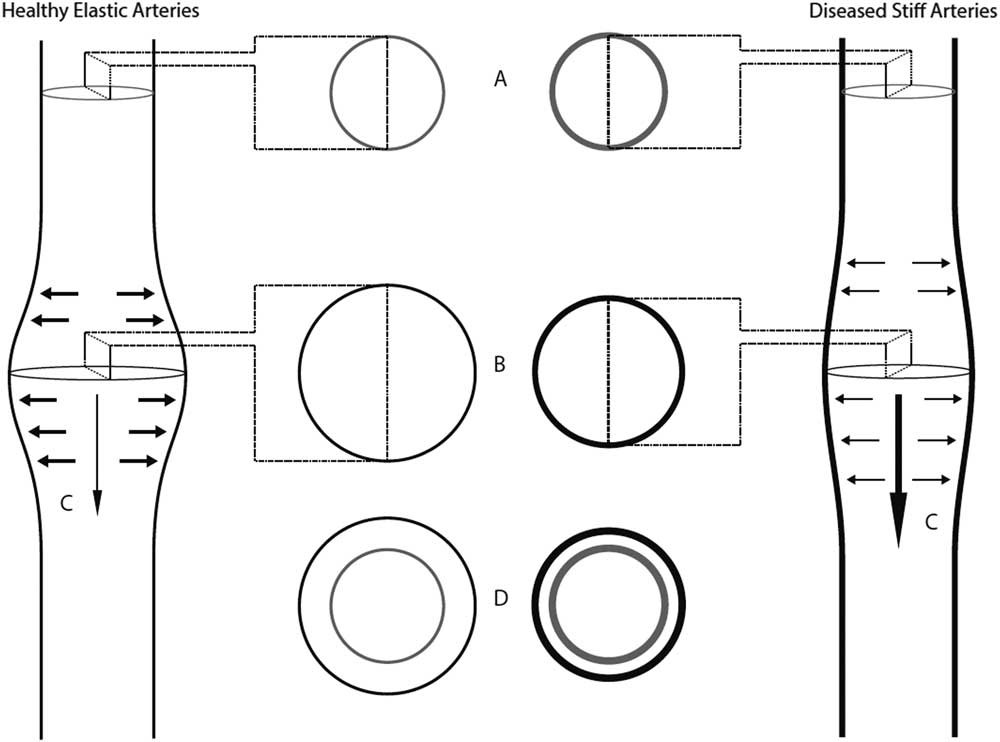
Stiffening of arteries or alteration of vascular tone owing to neurohumoral factors can lead to less elastic recoil, thereby increasing pulse wave velocity (Fig 1).
Pulse wave velocity physiology.A- The lumens of a healthy elastic artery (left panel) and a diseased stiff artery (right panel) during diastole.B- During systole, as the pulse wave travels through a healthy elastic artery, there is an increase in pressure within the artery, which exerts a force on the artery wall and leads to an increase in volume. Elastic arteries are more distensible, and thus have a greater increase in volume for a given amount of pressure than stiff arteries.C- The pulse wave travels slower in elastic arteries when compared to stiff arteries, as elastic arteries are more distensible.D- Diseased arteries have decreased distensibility.
How is pulse wave velocity measured?
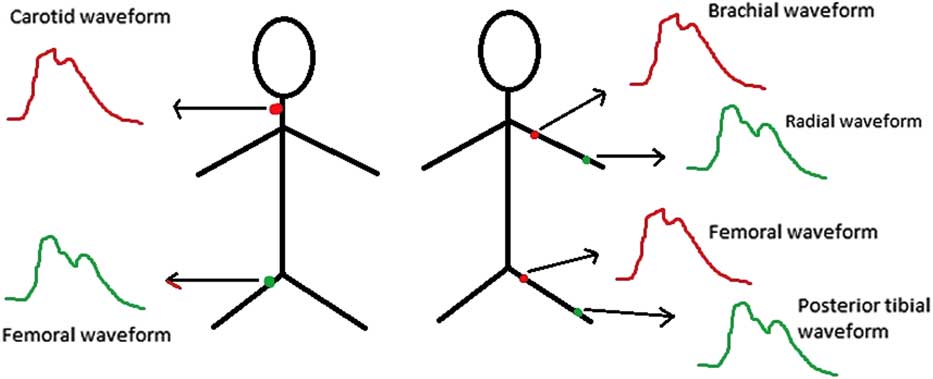
Pulse wave velocity can be measured between any two branches of the arterial tree. Central pulse wave velocity measures pulse wave velocity between larger arteries – for example, carotid–femoral – and peripheral pulse wave velocity measures pulse wave velocity of the more distal arterial segments – for example, brachial–radial or femoro–posterior tibialReference Laurent, Cockcroft and Van Bortel 22 (Fig 2).
Some examples of central (left panel) and peripheral (right panel) pulse wave velocity measurements.
Carotid–femoral pulse wave velocity
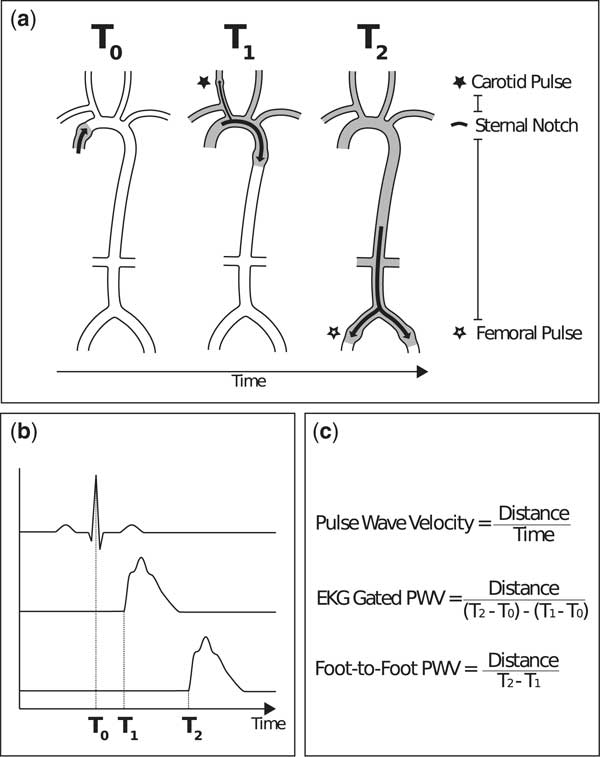
Carotid–femoral pulse wave velocity is most commonly used to assess pulse wave velocity (Fig 3). Waveforms of the right common carotid artery and the right femoral artery are obtained using non-invasive techniques. Transit time (Δt), the time for the pulse wave to travel from T1 and T2, is measured with one of two methods: the electrocardiogram-gated method or the foot-to-foot method. The electrocardiogram-gated method measures the time lapse between R wave of the electrocardiogram and the foot of the carotid artery waveform, and subtracts this value from the time lapse of the R wave and the foot of the femoral artery waveform. The foot-to-foot method uses simultaneously measured carotid and femoral artery waveforms; the lapsed time between the “feet” of these waveforms is the time taken for the pulse to travel the distance and serves as the denominator of the pulse wave velocity equation. The length (ΔL) that is travelled by the pulse wave is estimated by measuring the surface distance between the two recording sites. Pulse wave velocity is expressed as metres/second.Reference Laurent, Cockcroft and Van Bortel 22
Carotid–femoral pulse wave velocity.A- At systole (T0), contraction of the heart leads to propagation of the pulse wave.At T1, the pulse wave reaches the right common carotid artery, where it can be measured.At T2, the pulse wave reaches the right common femoral artery, where it can be measured.The distance between pulse points (* to *) can be measured by directly measuring the path length that the pulse wave travels. B- A graphical depiction of the timing of systole, measured with electrocardiogram (T0), the right common carotid artery waveform (T1), and the right common femoral artery waveform (T2).C- The denominator of the pulse wave velocity equation, the time for the pulse wave to travel from T1 and T2, is usually measured with one of two methods: the electrocardiogram-gated method or the foot-to-foot method. The electrocardiogram-gated method measures the time lapse between R wave of the electrocardiogram and the foot of the carotid artery waveform, and subtracts this value from the time lapse of the R wave and the foot of the femoral artery waveform. The foot-to-foot method uses tonometry or oscillometry to simultaneously measure the carotid and femoral artery waveforms; the lapsed time between the ‘feet’ of these waveforms serves as the denominator of the pulse wave velocity equation.
Techniques to obtain pulse wave velocity
Several non-invasive techniques are available to measure pulse wave velocity. In applanation tonometry, pressure is applied to distort or applanate (flatten) the artery using a special probe, creating a signal that approximates arterial pressure. This method is considered the gold standard for measuring pulse wave velocity.Reference Stoner, Young and Fryer 15 However, this technique requires a skilled operator and can be difficult to measure in obese or fidgety children. Oscillometric devices use a specialised blood pressure cuff to detect “oscillations” in pressure. This method is gaining traction as an easier and less operator-dependent method to assess pulse wave velocity.Reference Hickson, Butlin and Broad 23 Other less used techniques include magnetic resonance imagingReference Grotenhuis, Westenberg and Steendijk 24 and Doppler ultrasound.Reference Calabia, Torguet and Garcia 25 These require specialised imaging equipment and technical personnel training.
What is augmentation index?
Augmentation index is another measure of arterial stiffness that is frequently used alongside pulse wave velocity.Reference Laurent, Cockcroft and Van Bortel 22 As the pulse wave is transmitted through the arteries, it encounters resistance from multiple branch points, smaller arteries, and peripheral vascular beds. These reflections summate into a retrograde waveform. In an elastic vasculature, the reflected wave returns to the aortic root during diastole. The reflected wave returns sooner as the arteries stiffen, and the pressure in the aortic root is composed of both the antegrade and retrograde waves. The antegrade (P1) and retrograde (P2) waves create two pressure peaks in systole. The difference in magnitude between these peaks is defined as the augmentation pressure. The augmentation index is the augmentation pressure divided by the pulse pressure (systolic blood pressure minus diastolic blood pressure) and is expressed as % (Fig 4). Higher augmentation index values are associated with increased cardiovascular risk.Reference Nurnberger, Keflioglu-Scheiber and Opazo Saez 26
Augmentation index.A- The ejection wave travels forward through the artery.B- Due to resistance at branch points on the artery, the reflected wave is transmitted in a retrograde fashion.C- The ejection wave (P1) and reflected wave (P2) combine to form a waveform. In elastic arteries (left panel), the reflected wave returns later than with stiffer arteries (right panel), where reflected wave returns earlier and ‘augments’ the ejection wave. The difference between the ejection wave and the reflected wave is augmentation pressure (P3). The augmentation index is augmentation pressure divided by the pulse pressure.

How is augmentation index measured?
Using the pulse wave velocity analyser that is used to measure pulse wave velocity, the central arterial pulse pressure waveform is obtained. This composite waveform contains both the antegrade wave and the retrograde wave. Augmentation pressure is then calculated as follows:
Augmentation index (%)=(P2−P1)÷Pulse pressure
Pulse pressure=Systolic blood pressure–Diastolic blood pressure
Limitations/quality control
Table 1 lists the ideal conditions for measurement of pulse wave velocity and augmentation index.
Ideal conditions for measurement of pulse wave velocity and augmentation index.

Owing to ethical reasons, pulse wave velocity and augmentation index have not been validated in children by simultaneous intra-arterial stiffness measurements using catheters and pressure manometers.Reference Urbina, Williams and Alpert 16 Data regarding reproducibility of these techniques in children are also limited. Available reference values in children are from studies with small sample sizes and do not take into consideration any racial differences that may exist in arterial stiffness.Reference Urbina, Williams and Alpert 16 Correlation of pulse wave velocity and augmentation index measurements with future cardiovascular disease or mortality is not available as such long-term studies have not yet been conducted.
Placing a femoral probe often requires the patient to undress, which can be uncomfortable for some children. Thus, oscillometric technique may have an advantage over tonometry as direct palpation of the artery is not required. Pulse travel distance must be measured accurately, as a small error in measurement can influence the absolute value of pulse wave velocity.Reference Laurent, Cockcroft and Van Bortel 22 , Reference Chirinos 27 Direct measurement of the distance between the pulse points can also be challenging; hence, different methods are used to estimate the pulse wave travel distance. These methods for measuring distance are approximations of the true distance travelled by the pulse wave; therefore, comparing pulse wave velocity data between laboratories can be difficult unless distance measurements are accurate and specified.Reference Laurent, Cockcroft and Van Bortel 22 , Reference Van Bortel, Duprez and Starmans-Kool 28 Measuring the pulse travel distance in obese children is difficult and can lead to its overestimation leading to falsely elevated pulse wave velocity.Reference Van Bortel, Duprez and Starmans-Kool 28 Children add another layer of complexity owing to the shorter pulse travel distance, which can amplify any error in measurement.
Reference values for pulse wave velocity and augmentation index in children
Available reference values for pulse wave velocity and augmentation index for healthy children are presented in Figures 5 and 6, respectively. The pulse wave velocity reference values are based on age in years or height in centimetres {Reusz et al (n=1008, 49% males)Reference Reusz, Cseprekal and Temmar 29 }, whereas the augmentation index reference values are based on age in years {Hidvegi et al (n=4619, 54% males)Reference Hidvegi, Illyes and Molnar 30 }. In general, increasing age, height, weight, and blood pressure are associated with increased pulse wave velocity.Reference Reusz, Cseprekal and Temmar 29 , Reference Fischer, Schreiver and Heimhalt 31 , Reference Hidvegi, Illyes and Benczur 32 , Reference Elmenhorst, Hulpke-Wette and Barta 33 Pulse wave velocity is relatively constant in the very young (3–8-year-olds), but increases thereafter.Reference Hidvegi, Illyes and Benczur 32 Gender differences in pulse wave velocity tend to be minimal, and can generally be explained by discrepancies in height. As males outgrow females during adolescence, their pulse wave velocity increases comparatively.Reference Reusz, Cseprekal and Temmar 29 In contrast, augmentation index decreases gradually with increasing age in both boys and girls. This is likely owing to the shorter aortic length resulting in early return of the reflected wave in younger children. Augmentation index plateaus around the age of 12 years in girls and age of 15 years in boys. Augmentation index is higher in females indicative of the gender-specific aortic wall characteristics after puberty.Reference Hidvegi, Illyes and Molnar 30
Pulse wave velocity percentile curves according to age (a) and height (b). Adapted from Reusz et al29.

Augmentation index percentile curves based on age in boys (a) and girls (b). Adapted from Hidvegi et al30.

Part II
In this section, we will review pertinent studies that used pulse wave velocity or augmentation index to assess arterial health in commonly occurring conditions in children. Table 2 summarises the findings of pulse wave velocity and augmentation index measurements in various conditions in children.
Summary of pulse wave velocity and augmentation index measurements in various conditions in children.

↑=increased; ↓=decreased; ↔=no change
Obesity
Childhood obesity results in several morbidities that affect the cardiovascular system prematurely. In adults, obesity, specifically central adiposity, is associated with increased pulse wave velocityReference Recio-Rodriguez, Gomez-Marcos and Patino-Alonso 34 , Reference Scuteri, Orru and Morrell 35 and weight loss is reported to decrease central pulse wave velocity.Reference Dengo, Dennis and Orr 36
Obesity is associated with functional adaptations such as increased arterial diameterReference Cote, Harris and Panagiotopoulos 37 and volume overload, resulting in decreased total peripheral resistance. Some cross-sectional studies show either no association or an inverse relationship between obesity and pulse wave velocity in children.Reference Dangardt, Osika and Volkmann 38 , Reference Charakida, Jones and Falaschetti 39 , Reference Lurbe, Torro and Garcia-Vicent 40 A study of 501 children and adolescents aged 8–18 years assessed the impact of obesity and blood pressure on pulse wave velocity. The subjects were divided based on blood pressure into normotensive, borderline hypertensive, and hypertensive groups, and based on body weight into normal, overweight, and obese groups. There was a graded increase in pulse wave velocity with increasing blood pressure, but there was an inverse relationship between central pulse wave velocity and body mass index z score. In fact, obesity was noted to blunt the expected increment in pulse wave velocity of hypertensive and borderline hypertensive subjects.Reference Lurbe, Torro and Garcia-Vicent 40 In another large longitudinal birth cohort study, investigators performed a cross-sectional examination in 6576 children aged 10–11 years and found elevated heart rate and blood pressure in overweight children, but there was an inverse relationship with peripheral pulse wave velocity.Reference Charakida, Jones and Falaschetti 39 This is the largest reported study linking body weight and pulse wave velocity in pre-pubertal children. A small case–control study of 33 obese children and adolescents (13.9±1.6 years) and 18 lean controls (14.3±2.2 years) showed that peripheral pulse wave velocity was lower in obese than in lean controls (6.2±0.8 versus 7.0±0.9m/second, respectively).Reference Dangardt, Osika and Volkmann 38 These inverse relationships between obesity and pulse wave velocity perhaps reflect physiologic adaptations (i.e. larger arteries) in the short term. Thus, there is likely a window of opportunity in early childhood to target and potentially reverse obesity before adverse vascular changes manifest.Reference Charakida, Jones and Falaschetti 39
At some point, these functional adaptations can no longer compensate for the increased arterial pressures associated with obesity. The tension on the arterial wall eventually causes the wall to stiffen.Reference Cote, Harris and Panagiotopoulos 37 This phenomenon is supported by other cross-sectional studies in children that show increased pulse wave velocity in obesity.Reference Dangardt, Chen and Berggren 41 – Reference Urbina, Kimball and Khoury 43 A study of 670 youth aged 10–24 years recruited patients with type 2 diabetes mellitus and matched them to obese and lean controls. There was a stepwise increase in central pulse wave velocity and augmentation index from lean to obese to type 2 diabetics, but there were no significant differences in peripheral pulse wave velocity among the groups.Reference Urbina, Kimball and Khoury 43 The study was limited by its cross-sectional nature, thus making it difficult to determine the time course of involvement of various arterial sites. “Lifestyle of Our Kids” is an Australian prospective cohort study designed to investigate the effect of physical activity on health and development. Investigators performed cross-sectional measurements of pulse wave velocity and compared it with body composition and a 7-day pedometer count in 573 children (10.1±0.3 years). They found a positive correlation between central pulse wave velocity and body mass index, waist circumference, and adiposity, and a negative correlation with pedometer count.Reference Sakuragi, Abhayaratna and Gravenmaker 42 In another study of 193 children aged 13.2±0.7 years, central adiposity was associated with increased central pulse wave velocity.Reference Arnberg, Larnkjaer and Michaelsen 44
There are some longitudinal data linking obesity to increased arterial stiffness in children as well. In a Swedish study of 28 obese children aged 10.2–17.6 years (mean age 13.8 years) and 14 lean children aged 11.5–16.1 years (mean age 13.8 years), longitudinal measurements of pulse wave velocity were made over a period of 5 years. There was a 25% increase in peripheral pulse wave velocity in obese children compared with a 3% increase in age- and gender-matched lean controls during the study period.Reference Dangardt, Chen and Berggren 41 The Cardiovascular Risk in Young Finns Study recruited 1691 adultsReference Aatola, Hutri-Kahonen and Juonala 45 aged 30–45 years with known risk factor data since childhood. A favourable change in obesity status from childhood to adulthood was associated with a lower pulse wave velocity in adulthood.
These studies support the notion that while pulse wave velocity may not be increased at the outset in childhood obesity, obesity does aggravate arterial stiffening over time. All these findings also support early intervention in obesity – when the vascular changes may still be reversible.Reference Dangardt, Chen and Berggren 41 , Reference Aatola, Hutri-Kahonen and Juonala 45
Hypertension
Hypertension is a well-recognised cardiovascular risk factor and in adults pulse wave velocity evaluation is recommended in clinic settings for assessment of subclinical target organ damage.Reference Mansia, De Backer and Dominiczak 46 Childhood hypertension also causes early cardiovascular damage as evident by increased carotid artery intima–media thickness and left ventricular mass index.Reference Liang, Hou and Shan 47 Studies in children have found a direct association between blood pressure (both systolic and diastolic) and pulse wave velocity.Reference Hidvegi, Illyes and Benczur 32 , Reference Lurbe, Torro and Garcia-Vicent 40 , Reference Niboshi, Hamaoka and Sakata 48 , Reference Stergiou, Giovas and Kollias 49 , Reference Zhu, Yan and Ge 50 – Reference Urbina, Khoury and McCoy 52 Some studies have found an association between pre-hypertension in children and increasing pulse wave velocity as wellReference Lurbe, Torro and Garcia-Vicent 40 , Reference Zhu, Yan and Ge 50 , Reference Urbina, Khoury and McCoy 52 , indicating that vascular changes may occur even with subtle elevations in blood pressure. A study of 501 children and adolescents aged 8–18 years assessed the impact of blood pressure on pulse wave velocity and augmentation index. The investigators divided the subjects based on blood pressure into normotensive, borderline hypertensive, and hypertensive groups. There was a graded increase in pulse wave velocity with increasing blood pressure without any significant changes noted in augmentation index.Reference Lurbe, Torro and Garcia-Vicent 40 Another study of 970 Japanese children (52% boys) found similar increases in peripheral pulse wave velocity with increases in heart rate and blood pressure.Reference Niboshi, Hamaoka and Sakata 48 A study of 723 youth aged 10–23 years (29% with type 2 diabetes mellitus) divided patients by blood pressure level into normotensive, pre-hypertensive, and hypertensive groups. The investigators found a graded increase in pulse wave velocity, augmentation index, and left ventricular mass index as blood pressure increased.Reference Urbina, Khoury and McCoy 52
The effect of blood pressure on pulse wave velocity is thought to be multifactorial: increases in blood pressure results in a functional increase in pulse wave velocity (at higher afterload, the heart has to pump out blood at a higher velocity), and chronic high blood pressure causes structural changes in the arterial wall owing to shear stress, and stiffens arteries. Children of parents with hypertension have increased pulse wave velocity compared with children of normotensive parents independent of the child’s blood pressure status, indicating perhaps a blood pressure-independent, genetic component as well.Reference Kyvelou, Vyssoulis and Karpanou 53 In view of these data, further studies are needed utilising pulse wave velocity and augmentation index measures to determine the optimal management of hypertension in children.
Insulin resistance
Insulin resistance is associated with increased pulse wave velocity in adults.Reference Czernichow, Bertrais and Blacher 54 , Reference Kasayama, Saito and Mukai 55 Studies in children, however, have shown mixed results. In a study of 93 children, aged 10±0.1 years, insulin resistance was not associated with central pulse wave velocity.Reference Schack-Nielsen, Molgaard and Larsen 56 A study of 343 adolescents and young adults aged 15–28 years old showed an association between insulin resistance, central pulse wave velocity, and augmentation index. However, after adjusting for other cardiovascular risk factors such as age, sex, body mass index, and blood pressure, insulin resistance was no longer an independent predictor of central pulse wave velocity. Some limitations of this study were its cross-sectional design and a selection bias with exclusion of lean insulin-resistant individuals.Reference Urbina, Gao and Khoury 57 In another study including 241 obese youth, neither central pulse wave velocity nor augmentation index were increased in obese youth with glucose intolerance (18.0±3.6 years) compared with those with normal glucose tolerance (18.3±3.0 years). However, their brachial artery distensibility was decreased, indicating peripheral vascular dysfunction. This may suggest non-uniform progression of atherosclerosis, with peripheral arteries likely being affected earlier in the pre-diabetic state than central arteries.Reference Shah, Gao and Urbina 58 In contrast, in an Australian study conducted on a population-based birth cohort of 147 twin pairs (7–11 years), insulin resistance was associated with increased central pulse wave velocity.Reference McCloskey, Sun and Pezic 59
Thus, insulin resistance may play a role in modulating arterial stiffness, but other cardiovascular risk factors may be more important determinants of vascular health in these children.
Type 2 diabetes mellitus
In adults with type 2 diabetes mellitus, central pulse wave velocity is increased compared with controls.Reference Kimoto, Shoji and Shinohara 60 In a study of 670 youth aged 18.1±3.3 years, obese youth with type 2 diabetes mellitus had increased central and peripheral pulse wave velocity and augmentation index compared with those obese and without type 2 diabetes mellitus or lean controls. Multivariate analysis revealed type 2 diabetes mellitus to be an independent predictor of central pulse wave velocity.Reference Urbina, Kimball and Khoury 43
In summary, arterial stiffness is increased in children with type 2 diabetes mellitus especially if associated with obesity.
Type 1 diabetes mellitus
In adults with type 1 diabetes mellitus, central pulse wave velocity is increased even in the absence of cardiovascular disease.Reference Llaurado, Ceperuelo-Mallafre and Vilardell 61 Paediatric studies have found a similar association between Type 1 diabetes mellitus and pulse wave velocity.Reference Lieberman, Wadwa and Nguyen 62 – Reference Wadwa, Urbina and Anderson 65 A study of 30 children with type 1 diabetes mellitus found no difference in central pulse wave velocity when compared with controls, but found a significant increase in augmentation index, a combined measure of peripheral and central stiffness.Reference Heilman, Zilmer and Zilmer 66 SEARCH for Diabetes in Youth Study is a multicentre study aimed at understanding more about diabetes among children and young adults in the United States. Investigators recruited 535 youth with type 1 diabetes mellitus (14.6±3.3 years) and compared their pulse wave velocity, augmentation index, and brachial distensibility with 241 healthy controls. The average duration of diabetes was 68.4±8.3 months. About 10% of the type 1 diabetics had increased central pulse wave velocity and augmentation index, whereas 33% had decreased brachial artery distensibility – a measure of peripheral arterial stiffness.Reference Urbina, Wadwa and Davis 64 The authors concluded that arterial stiffness is increased in children with type 1 diabetes mellitus, with peripheral arteries likely affected more than the central arteries. Another subset of patients from the SEARCH for Diabetes in Youth study included youth (10–23-year-olds) with type 1 diabetes mellitus (n=535) and type 2 diabetes Mellitus (n=60). Youth with type 2 diabetes mellitus had higher central pulse wave velocity and augmentation index than youth with type 1 diabetes mellitus.Reference Wadwa, Urbina and Anderson 65 Pulse wave velocity was associated with central adiposity and blood pressure, independent of diabetes type. The authors concluded that worse arterial stiffness in type 2 diabetes mellitus may be related to its insidious onset that allows the arteries to stiffen before disease recognition and interventionsReference Wadwa, Urbina and Anderson 65 and clustering of cardiovascular risk factors such as obesity and hypertension that can evolve to type 2 diabetes mellitus. Some limitations of this study include limited number with type 2 diabetes mellitus, exclusion of healthy controls, and its cross-sectional design.
Further studies are needed to identify key modifiable risk factors that are associated with cardiovascular involvement in type 1 and type 2 diabetes mellitus and role of interventions including optimal glucose control in mitigating cardiovascular risk in such children.
Dyslipidaemia
Dyslipidaemia, specifically elevated low-density lipoprotein cholesterol, is associated with premature cardiovascular disease. 3 High-density lipoprotein cholesterol is known for its anti-atherosclerotic properties.Reference Rosenson, Brewer and Chapman 67 Apolipoprotein-B, also known for its atherosclerotic properties, is regarded as another important risk factor for ischaemic heart disease in adults.Reference Lamarche, Moorjani and Lupien 68 In a study of 267 adolescents aged 15.4±2.2 years, pulse wave velocity was significantly elevated in those with high low-density lipoprotein cholesterol. In those with borderline low-density lipoprotein cholesterol levels, subjects with high apolipoprotein-B had increased pulse wave velocity as compared with those with normal apolipoprotein-B levels.Reference Bjornstad, Nguyen and Reinick 69 However, in another study looking at 30 children (mean age 12±2 years) with familial hypercholesterolaemia (low-density lipoprotein cholesterol 213±52 mg/dL) and 30 controls (low-density lipoprotein cholesterol 89±18 mg/dL), there was no difference in central pulse wave velocity between groups.Reference Vlahos, Naka and Bechlioulis 70 The SEARCH for Diabetes in Youth Study examined 535 youth with type 1 diabetes mellitus (mean age 14.6±3.3 years) and 241 healthy controls (mean age 17.8±3.5 years), and found that those with high low-density lipoprotein cholesterol had increased augmentation index.Reference Urbina, Wadwa and Davis 64 In another large cross-sectional study of 893 youth (10–26 year-olds), laboratory, anthropometric, blood pressure, and arterial stiffness data were collected. Subjects were stratified into tertiles of triglyceride to high-density lipoprotein cholesterol ratio. There was a progressive increase in central pulse wave velocity and augmentation index as the triglyceride to high-density lipoprotein cholesterol ratio (a measure of small, dense low-density lipoprotein cholesterol) increased.Reference Urbina, Khoury and McCoy 71
Thus, dyslipidaemia may be associated with arterial stiffness, and measuring pulse wave velocity and augmentation index measures in such youth may be helpful in identifying those requiring aggressive interventions. Further studies are needed to determine the optimal timing for pharmacological intervention and key lipid markers to follow in children with dyslipidaemia and how that may influence arterial health.
Physical inactivity
In adults, aerobic exercise decreases pulse wave velocityReference Vaitkevicius, Fleg and Engel 72 , whereas combined aerobic and resistance training may have reduced beneficial effects.Reference Montero, Vinet and Roberts 73 Studies in children have examined the roles of different types and intensities of training or physical inactivity on pulse wave velocity and augmentation index using gadgets such as pedometers or accelerometers that objectively measure physical activity.Reference Sakuragi, Abhayaratna and Gravenmaker 42 , Reference Arnberg, Larnkjaer and Michaelsen 44 , Reference Urbina, Kimball and Khoury 43 One study showed an inverse relationship between the 7-day pedometer count and pulse wave velocity.Reference Sakuragi, Abhayaratna and Gravenmaker 42 Two studies showed an inverse relationship between physical activity and augmentation index, but not pulse wave velocity.Reference Arnberg, Larnkjaer and Michaelsen 44 , Reference Urbina, Kimball and Khoury 43
Other studies in children have used self-reported physical activity and/or physical activity questionnaires. A Canadian study recruited 485 youth aged ~12.5 years from the 1995 Manitoba birth cohort. The investigators used a 12-month recall instrument to assess physical activity and found no association between physical activity and peripheral pulse wave velocity or augmentation index.Reference Walker, MacIntosh and Kozyrskyj 74 A study from India of 250 youth aged 6–17 years (mean age 11.4 years) used a one-time activity questionnaire and found moderate physical activity to be inversely associated with pulse wave velocity.Reference Pandit, Khadilkar and Chiplonkar 75 In another report, in 10-year-olds, pulse wave velocity was inversely associated with a 24-hour self-reported physical activity.Reference Schack-Nielsen, Molgaard and Larsen 56 In a longitudinal Swedish study, pulse wave velocity in 241 children and adolescents (mean age 10 years at study entry) was assessed and repeat measurements were obtained in 162 of them 3 years later. Peripheral pulse wave velocity was increased in both males and females, but greater in males with decreased self-reported physical activity.Reference Chen, Dangardt and Osika 76
In summary, most studies show that increased aerobic physical activity has beneficial effects on arterial stiffness in children, although it is not entirely clear whether pulse wave velocity or augmentation index is more sensitive to measure these beneficial effects. Further studies should evaluate whether strategies to promote physical activity and reduce sedentary time in children optimise their arterial health and decrease premature cardiovascular disease.
Chronic kidney disease and renal transplantation
With advances in renal replacement therapy, premature cardiovascular disease is the leading cause of death in end-stage renal disease.Reference Groothoff, Gruppen and Offringa 77 Pulse wave velocity and augmentation index are strong predictors of mortality in adults with end-stage renal disease.Reference London, Blacher and Pannier 21 In children with end-stage renal disease receiving dialysis, central pulse wave velocity,Reference Covic, Mardare and Gusbeth-Tatomir 78 – Reference Dursun, Poyrazoglu and Gunduz 80 peripheral pulse wave velocityReference Shroff, Donald and Hiorns 81 , and augmentation indexReference Covic, Mardare and Gusbeth-Tatomir 78 were all increased. One study found a stepwise increase in central pulse wave velocity between 18 healthy controls, 33 children with end-stage renal disease not yet requiring dialysis, and 37 children with end-stage renal disease on dialysis.Reference Dursun, Poyrazoglu and Gunduz 80 Another study looking at 24 children with chronic kidney disease not requiring dialysis did not show any difference in central pulse wave velocity in these children when compared with 48 age-matched healthy controls.Reference Alghamdi, De Souza and White 82 Thus, while the more severe chronic kidney disease and end-stage renal disease requiring dialysis cause arterial stiffening, the arterial changes in less advanced stages of chronic kidney disease may not be significant.Reference Alghamdi, De Souza and White 82 Thus, early identification and intervention may preserve arterial health in children with chronic kidney disease.
A study looking at 85 children (5–18-year-olds) with end-stage renal disease on dialysis for ⩾6 months showed that peripheral pulse wave velocity was increased in these children compared with controls, and pulse wave velocity correlated with serum parathyroid hormone, phosphorus, and the calcium phosphate product. This suggests that a pro-calcific state may cause tunica–media calcification leading to arteriosclerosis – a process distinct from atherosclerosis – and this may play a role in increasing arterial stiffness as well.Reference Shroff, Donald and Hiorns 81 In another study examining uraemic children, CD144+ endothelial microparticle, which is a marker of endothelial dysfunction, and mean blood pressure were independently related to central pulse wave velocity.Reference Dursun, Poyrazoglu and Gunduz 80 Skin auto-fluorescence – a marker of advanced glycation end products – positively correlated with central pulse wave velocity in children with chronic kidney disease.Reference Makulska, Szczepanska and Drozdz 83 These studies suggest that metabolic dysfunction and pro-inflammatory states in uraemia may play a predominant role in causing arterial stiffening.
Studies in adults show that renal transplantation decreases the risk of cardiovascular complications, although the risk still remains three to five times higher than the general population.Reference Sarnak, Levey and Schoolwerth 84 Although renal transplantation improves uraemia, transplantation-associated immune suppression may also have consequences on the vasculature. To address the question of whether renal transplantation can ameliorate arterial stiffness in end-stage renal disease children, central pulse wave velocity and augmentation index were measured 6 months before and 6 months after renal transplantation in 15 children aged 11.1±4.8 years who were on dialysis for 12.9±7.4 months before transplantation. There was no significant difference in either measure after transplantation; however, there was an inverse relation between central pulse wave velocity and graft function in this prospective study.Reference Aoun, Lorton and Wannous 85 A major limitation of this study was its small sample size and a follow-up time period of only 6 months, which may be too short to evaluate vascular changes. Another study compared 25 children following renal transplant with 11 children with end-stage renal disease and found that only when a post-transplantation creatinine clearance of >90 ml/minute/1.73 m2 was achieved there was improvement in the central pulse wave velocity.Reference Cseprekal, Kis and Schaffer 86 Another study showed that central pulse wave velocity and augmentation index were higher in 36 children who had received renal transplantation compared with 49 age-matched healthy controls.Reference Briese, Claus and Querfeld 87 A study of 41 children examining whether weight gain following renal transplantation, likely due to corticosteroid use, is related to increased pulse wave velocity found no difference in central pulse wave velocity between lean and overweight groups.Reference Degi, Kis and Kerti 88
These studies together indicate that end-stage renal disease leads to arterial stiffening, which can partially be ameliorated by renal transplantation. Improvements may not be detected in the short term following renal transplantation, but better renal function may improve arterial health.
CHD
A variety of palliated or repaired congenital heart defects are associated with alterations in the vasculature.
Coarctation of the aorta
Despite anatomically successful repair of coarctation of the aorta, these patients are at an increased risk of developing hypertension and premature cardiovascular disease.Reference Gardiner, Celermajer and Sorensen 89 , Reference Trojnarska, Szczepaniak-Chichel and Mizia-Stec 90 Hypertensive adolescents (n=9) with repaired coarctation of the aorta had increased pulse wave velocity compared with 20 age-matched controls.Reference Kenny, Polson and Martin 91 This study excluded patients having any residual aortic narrowing. In another study of 40 normotensive children with anatomically successful repair of coarctation of the aorta (mean age 12±8 years), pulse wave velocity was increased compared with 20 age- and sex-matched controls. This study used magnetic resonance imaging to assess pulse wave velocity and excluded those with hypertension at rest and residual arch obstruction. This indicates that residual pathophysiologic abnormalities exist in the aorta even in the absence of hypertension or anatomic obstruction.Reference Ou, Celermajer and Jolivet 92
These findings emphasise the importance of continued follow-up, and further studies are needed to determine optimal medical and lifestyle management, especially in the absence of hypertension or anatomic obstruction.
Tetralogy of Fallot
In children with tetralogy of Fallot, the anatomic abnormalities also extend to the aorta with aortic root dilatation noted often. Histologic studies have shown arterial wall abnormalities such as medial necrosis, fibrosis, and elastic fibre fragmentation.Reference Niwa, Perloff and Bhuta 93 , Reference Tan, Davlouros and McCarthy 94 In adults who had surgical repair of tetralogy of Fallot during childhood, the aortic root is known to progressively dilateReference Niwa 95 , Reference Niwa, Siu and Webb 96 ; this can be associated with aortic valve regurgitation and aortic dissection.Reference Kim, Seo and Kim 97
A study measured pulse wave velocity during cardiac catheterisation in 37 infants and children before corrective surgery for tetralogy of Fallot and compared it with 55 controls who had ventricular septal defect or patent ductus arteriosus. Pulse wave velocity was significantly elevated in uncorrected tetralogy of Fallot, even after controlling for age, sex, and haemodynamic burden on the aortic wall.Reference Seki, Kurishima and Kawasaki 98 In a study of 161 children, the proximal aorta had increased pulse wave velocity in repaired and unrepaired tetralogy of Fallot compared with controls. Pulse wave velocity in distal aorta was similar in the repaired tetralogy of Fallot, unrepaired tetralogy of Fallot, and control groups. This suggests an intrinsic defect of the proximal aorta in children with tetralogy of Fallot that is present de novo and persists after surgical repair.Reference Saiki, Kojima and Seki 99 In a case–control study in 31 youth with surgically repaired tetralogy of Fallot, both central pulse wave velocity and augmentation index were increased and correlated with the aortic root size; there was no concomitant increase in peripheral pulse wave velocity, suggesting only central arterial stiffening.Reference Cheung, Ou and Wong 100 Similarly, in another study of 38 children with corrected tetralogy of Fallot (mean age 6.3±4.1 years) and 55 controls, the tetralogy of Fallot group showed significant association between pulse wave velocity and aortic root diameter.Reference Senzaki, Iwamoto and Ishido 101 Interestingly, pulse wave velocity at baseline in 32 children predicted increased aortic diameter at follow-up 7.6±2.0 years later, indicating that pulse wave velocity may be used as a marker for predicting aortopathy.Reference Seki, Kurishima and Saiki 102
In summary, proximal aortic arterial stiffness is noted in patients with tetralogy of Fallot. Further studies are needed to see whether interventions aimed at reducing arterial stiffness could reduce the rate of aortic root dilatation in this population.
Fontan
Children before completion of the Fontan procedure (mean age 28±25 months) had similar central pulse wave velocity as children with other congenital heart disease with two-ventricle physiology (mean age 35±24 months).Reference Natarajan, Heiss and Yeghiazarians 103 In 28 post-Fontan youth (mean age 14.8±1.3 years) and 54 age-matched controls, peripheral but not central pulse wave velocity was increased in Fontan youth compared with controls.Reference Sarkola, Jaeggi and Slorach 104 In another study of 22 Fontan youth (mean age 14.9 years) and 31 controls (mean age 15.2 years), central pulse wave velocity was increased in Fontan youth compared with controls.Reference Myers, Leung and Terri Potts 105
Thus, abnormal arterial stiffness may develop in teenage Fontan patients, although mechanisms and progression remain unclear. Future studies are needed to see whether strategies aimed at improving arterial stiffness by improving physical activity and fitness could delay the progression of ventricular dysfunction and improve the quality of life in this population.
Prematurity and small for gestational age
Preterm birth and being small for gestational age have been associated with hypertensionReference Johansson, Iliadou and Bergvall 106 , Reference Jarvelin, Sovio and King 107 , premature coronary artery diseaseReference Kaijser, Bonamy and Akre 108 , and increased cardiovascular mortalityReference Crump, Sundquist and Sundquist 109 in adulthood.
In a study of 68 children (age 11 years) who were born extremely premature (gestational age 24.9 weeks), augmentation index was increased when compared with 90 age- and sex-matched controls born at term, but central pulse wave velocity and blood pressures were not different between groups, suggesting preferential involvement of the peripheral muscular arteries in the extremely premature group.Reference McEniery, Bolton and Fawke 110 In a study looking at 34 girls born preterm (⩽34 weeks gestation) and 32 age- and sex-matched controls who were born term and appropriate weight for gestation, no between-group differences were found in either peripheral pulse wave velocity or augmentation index when tested at 16.5 years of age. However, resting peripheral skin blood flow, used to measure underlying resistance vessel smooth muscle tone, was reduced in preterm females, indicating increased peripheral vascular resistance.Reference Bonamy, Bendito and Martin 111 In 39 children who were small for gestational age (mean age 10.5±1.4 years) and 41 age- and sex-matched controls, central pulse wave velocity was increased in the small for gestational age group compared with controls despite no difference in blood pressures.Reference Bradley, Potts and Lee 112 A cross-sectional study of 86 children aged 8.2±1.7 years divided children into three groups: children who were both preterm and small for gestational age (n=15), children who were born preterm but appropriate weight for gestational age (n=36), and those born at term with appropriate weight for gestational age (n=35). Those preterm and small for gestational age had the highest peripheral pulse wave velocity, whereas children born preterm and term with appropriate weight for age had similar pulse wave velocities.Reference Cheung, Wong and Lam 113
In summary, being both preterm and particularly small for gestational age is detrimental to arterial health. Extreme prematurity and small for gestational age are associated with adverse vasculature emphasising the need for continued, long-term cardiovascular surveillance of this population.
Kawasaki disease
Kawasaki disease is a common acquired cardiovascular disease in children and affects medium-sized muscular arteries. Several studies show increased peripheral pulse wave velocityReference Lee, Ahn and You 114 – Reference Cho, Yang and Kim 116 in subjects with a history of Kawasaki disease when compared with controls; elevation in pulse wave velocity was, however, independent of coronary artery involvementReference Lee, Ahn and You 114 – Reference AlHuzaimi, Al Mashham and Potts 117 , indicating that all children with history of Kawasaki disease may be at an increased risk of vascular complications. Encouragingly, in one study there was a significant decrease in pulse wave velocity in 11 patients (age 7–25 years) with Kawasaki disease following treatment with statins for 12 months.Reference Hamaoka, Hamaoka and Yahata 118
Conclusion
Risk factors such as obesity, hypertension, insulin resistance, dyslipidaemia, and physical inactivity often cluster in children who are otherwise healthy or have underlying CHD or acquired heart diseases, leading to accelerated atherosclerosis. Pulse wave velocity and augmentation index are easy-to-use non-invasive tools that measure arterial stiffness – a measure of arterial function and structure – and can quantify the effects of such risk factors on the vasculature. In this article, we have reviewed the physics and techniques for measurement of pulse wave velocity and augmentation index and summarised current knowledge of these measurements in children with prevailing chronic conditions. At this time, there are not enough data to suggest that these tools should be used as routine, clinical testing modalities in children. Methodological consistencies are crucial as heterogeneity in methods can greatly influence the measurements. Although some published reference values for pulse wave velocity and augmentation index exist in children, larger studies are needed comparing these measurements in various populations including different races.
Studies narrated in this review have shown that pulse wave velocity and augmentation index (arterial stiffness measures) are deranged in various, commonly prevailing medical conditions in children and adolescents. Adult data linking arterial stiffness to cardiovascular events and mortality are causes for concern, and suggest that these vascular measures when deranged are likely to be detrimental to the child’s long-term cardiovascular health. Thus, even though longitudinal data correlating deranged arterial health in childhood with cardiovascular mortality are lacking at this time, one could consider selectively using these testing modalities to risk-stratify children and target the ones with the highest risk for the most aggressive interventions. Further studies are needed to assess whether such interventions can improve arterial health in children and whether this indeed optimises long-term cardiovascular health.
Acknowledgements
None.
Financial Support
This research received no specific grant from any funding agency, commercial or not-for-profit sectors.
Conflicts of Interest
None.



