


Introduction
According to the nutrition transition thesis proposed by Popkin (Reference Popkin1993), food (in terms of quantity and quality) changes over time, with the major shifts occurring in periods of sustained income growth linked to industrialisation, urbanisation and demographic changes. This theoretical framework identified that the main changes go from a less varied diet with cereals predominant to a diet with more animal proteins, fruits and vegetables. However, there is also evidence of different patterns of nutrition transition, suggesting that there was not just one unique way in which this transition occurred and that additional factors other than income are important to explain how diet has changed (Grigg, Reference Grigg1999; Serrano and Pinilla, Reference Serrano and Pinilla2011; Pujol and Cussó, Reference Pujol-Andreu and Cussó2014). It is also important to introduce other variables from the demand side, such as prices and preferences, but also, technological change, the gains in productivity and the endowments to understanding the effects from the supply side (Pujol and Cussó, Reference Pujol-Andreu and Cussó2014; Delgado and Pinilla, Reference Delgado and Pinilla2022).
Most of the research about nutrition transition, from a historical perspective, has focused on European countries (Popkin, Reference Popkin1993; Grigg, Reference Grigg1995; Serrano and Pinilla, Reference Serrano and Pinilla2011; Pujol and Cussó, Reference Pujol-Andreu and Cussó2014, Nicolau and Pujol, Reference Nicolau and Pujol2005). According to the literature, the Atlantic and the Mediterranean countries showed different experiences (Pujol and Cussó, Reference Pujol-Andreu and Cussó2014). Central and northern Europe started the nutrition transition early and was characterised by a sustained increase in the consumption of meat and dairy products, while cereal consumption decreased. The nutrition transition started later in the Mediterranean regions and was characterised by a higher and more stable consumption of calories, proteins and fats of vegetable origin, complemented by a greater consumption of fish, eggs and milk (Pujol and Cussó, Reference Pujol-Andreu and Cussó2014). There is less historical research about what happened in developing countries, particularly in Latin America. For México, Serrano and Cussó (Reference Serrano and Cussó2012) analyse the diet changes during the second half of the twentieth century (between 1960 and 2009) and identify two phases. First, an increase in the supply of basic foods, such as cereals. Second, a diversification of the diet, reducing some traditional components (beans), to the benefit of other vegetable products such as potatoes and products of animal origin (poultry, milk or eggs). More recently, Llorca et al. (Reference Llorca-Jaña, Nazer, Navarrete-Montalvo and Morales2020) and (Reference Llorca-Jaña, Nazer, Navarrete-Montalvo and Morales2022) analyse the case of Chile during the twentieth century and up to the present. The research about Chile is one of the first studies from a long-run perspective, and shows that the nutrition transition in this country followed a similar pattern to that of the developed countries, in terms of the changes in the composition of the diet (the consumption of legumes and potatoes declined while meat and dairy products increased), but within a short period (similar to the late developed countries).
There are, then, major gaps in our knowledge, not least in relation to Latin America. To this end, this article offers a major new perspective and focus: the example of Uruguay, a small country in the southern cone of Latin America. This may be an interesting case to study as the food diet of the population was based on higher consumption of animal protein foods – beef – at the very early stages of its development, before industrialisation, at the beginning of the twentieth century. Uruguay, due to its natural conditions, benefits from an abundance of natural resources suitable for raising cattle and crops (Barrán and Nahum, Reference Barrán and Nahum1967; Finch, Reference Finch2005; Moraes Reference Moraes2008). This fact makes it possible for much of the domestic demand for food to be supplied by domestic production – almost all food originating from livestock and a high proportion from agricultural products. In particular, beef was available all over the territory and had a predominant role in the rural and urban diet, at least from the eighteenth century (see for instance Moraes, Reference Moraes2020 and Fournier, Reference Fournier1936).
The objective of this article is to discuss the evolution and changes in food consumption in Uruguay between 1900 and 1970. From a historical point of view, the period studied includes two key stages of the country’s economic development, from the agro-export model to the rise and decline of the import substitution industrialisation- also known as State-led industrialisation. We pursue two specific objectives. First, we present new evidence on the consumption per person of the main food items in the Uruguayan diet between 1900 and 1970. The information available previously only started in the 1960s with FAO balance sheets. Second, we describe the major changes and try to identify the main causes, from a demand and supply perspective. Our main hypothesis is that the nutrition transition in Uruguay presents a different pattern compared to the literature. Uruguay shows a diversification in food consumption but in the opposite direction to that seen in most of the regions that experienced the nutrition transition, from a high consumption of meat proteins to more fats and carbohydrates.
Based on the commodity flow approach and the food balance sheet methodology, we estimate the apparent consumption of five types of food: meat – beef, sheep, pork – wheat (flour and its derivatives), milk, potatoes, and sweet potatoes. This selection constitutes an important part of the household consumption basket and is the major food source of calories in the diet.
The rest of the article is structured in six other sections. Section 1 presents a historical context with some of the main features of the period, which is useful to better understand the evolution of food consumption. Section 2 describes the sources and methods. Section 3 analyses the evolution of food consumption and identifies the more important shifts during the period. The final section concludes, and then a list of the references is provided. The article includes a link to supplementary material with the per capita apparent food consumption time series between 1900 and 1970.
1. Uruguayan historical context
During the First Globalisation, Uruguay experienced its agro-export model. Exports were the most dynamic activity and were concentrated in a few primary products (beef, leather, and wool). At the same time, the country received a significant flow of European immigrants – mostly from Spain and Italy – and capital. All together benefited material well-being in Uruguay, which stood out for high living standards in the Latin American context: high levels of income (GDP per capita, real wages) and human development index (Bértola and Ocampo, Reference Bértola and Ocampo2012). The First World War and, with even greater repercussions, the 1929 Crisis, and the Great Depression, were breaking points in this model of development. Beginning in the 1930s, a process of import substitution industrialisation, that is, State-led Industrialisation, took place (Bértola and Ocampo, Reference Bértola and Ocampo2012), and important changes occurred in the production structure.
The agricultural sector represented almost 40 per cent of the country’s GDP at the beginning of the twentieth century (Román and Willebald, Reference Román and Willebald2021), and employed around 45 per cent of the total labour force (Siniscalchi and Willebald, Reference Siniscalchi and Willebald2018). The primary sector declined rapidly in relative terms and, in the 1930s, the industrial sector overtook the primary sector activities, approaching proportions of around 30 per cent up to the 1980s (Román and Willebald, Reference Román and Willebald2021).Footnote 1 By 1975, the share of the agricultural sector in GDP and in employment was 14 per cent and 16 per cent, respectively (Martínez Galarraga et al., Reference Martínez-Galarraga, Rodríguez Miranda, Siniscalchi and Willebald2019). Industrial production, in addition to supplying inputs to the industrial sector itself, played a fundamental role in the provision of some consumer goods for the population. This model peaked between the mid-1940s and the second half of the 1950s, when it became exhausted. The economy then faced a period of stagnation and serious inflation episodes until the 1970s, which damaged the power parity of the population’s income and led to important shifts in the relative prices.
In terms of economic growth, between 1870 and 1930, per capita GDP grew at an annual cumulative rate of 1.8 per cent (Román and Willebald, Reference Román and Willebald2021). In the period of industrialisation, the evolution of per capita GDP showed two phases. First, a dynamic period between 1931 and 1958, where per capita GDP had an annual cumulative growth rate of 2.6 per cent, higher than the performance of the export-led model decades. Then, after 1958, the economy faced a period of stagnation that lasted until the late 1960s (per capita annual growth rate of 0.4 per cent). If we focus on the evolution of real wages, there is a positive trend until the First World War, when the consequences of this conflict were very negative for the working-class income. There was a recovery in the 1920s, which ended in the 1930s. During the industrialisation period, real wages showed two trends: a bad period during the 1930s and an improvement during the 1940s (Bertino et al., Reference Bertino, Bertoni, Tajam and Yaffé2001: 29). Between 1945 and 1950, real wages increased by an annual growth rate of 9 per cent. After 1950, a relative stagnation of real wages can be observed that would last for the next twenty years. In terms of income distribution, the industrialisation process meant an improvement towards a more egalitarian society compared to the agro-export model (Bértola, Reference Bértola2005; Siniscalchi and Willebald, Reference Siniscalchi and Willebald2018).
Uruguay presents an unequal distribution of the population in the territory, and a high degree of urbanisation, with a predominant role of the capital city (Pellegrino, Reference Pellegrino2010; Finch, Reference Finch2005). The development process of Uruguay, between 1850 and 1930, increased the pre-existing differentiation between the two great macro-regions, Montevideo and the Interior, and accentuated it in such a way that by 1930, three zones could be clearly distinguished: Montevideo, the Urban Interior, and the countryside, which was practically empty (Rial, Reference Rial1983). The censuses of 1852 and 1860 testify to the existence of a country with a predominantly rural landscape, little encroached upon by urban centres, and a largely agrarian population. In 1930 the rural landscape was still predominant in terms of area, but its inhabitants were eminently urban, mostly concentrated in the capital cities of the nineteen departments. By 1908, between 40.5 per cent (with more than two thousand inhabitants) and 44.7 per cent (with more than five hundred inhabitants) of the population lived in urban agglomerations or in areas in the process of urbanisation (Rial, Reference Rial1983). According to Rial (Reference Rial1983), Montevideo was fully urbanised in 1908, followed later by Paysandú (44.3 per cent), Salto (42.5 per cent), Soriano (40.85 per cent), Flores (37.39 per cent) and Río Negro (30.42 per cent). The others did not exceed 24 per cent of the urban population.
The impact of modernisation and the creation of a railway network led to the foundation of a substantial number of new agglomeration centres. The extensive livestock; innovations in rural production; the important predominance of the capital city (with its port and the political and economic administration base); and the industrialisation process were some of the main driving forces towards an intensification of urbanisation in two main directions. First, the migration from rural areas to urban areas. In 1908, 24.1 per cent of the population lived in rural areas; in 1937 the rural population was 16.4 per cent of the total population, and by 1970 it was 11.3 per cent of the total population (according to MGA 1967a, 1967b and the Agricultural Census of 1980).Footnote 2 Second, the country was advancing in terms of urban concentration, from the Interior cities to Montevideo (Finch, Reference Finch2005). According to the Population Census, in 1908, 30 per cent of the population resided in the capital city. By 1963 this percentage had increased to 46 per cent.
The population increased significantly between the end of the nineteenth century and the beginning of the twentieth, which can be explained by the important migratory flows (mainly European) and the vegetative growth of the inhabitants. Immigration was very important until the 1930s, at which point it stopped, largely as a result of the effects of the 1929 crisis and the Great Depression. After the Second World War, immigrants re-entered until the 1960s, when European movements stopped.
2. Methods and sources
Our approach for studying the main features of the nutritional transition in Uruguay stands on the reconstruction of food consumption series, and the subsequent discussion of the main factors that led to their observed behaviour. In the first phase, we estimate annual per capita apparent food consumption of a sample of food items between 1900 and 1970. We selected the most important products in terms of the average household budget and their contribution of calories, proteins, and carbohydrates. Those items are wheat flour (including its derivatives), meat (beef, sheep, and pork), milk, potatoes, and sweet potatoes. The selection of foods is based on information generated by three household expenditure surveys. The information reported by the Ministerio de Industrias (1927) for 1914 and the Ministerio de Industria y Trabajo (1946) for 1937, bring the composition of the average diet of a working family – of the commercial and industrial sectors – composed of four members (a couple and two children). Both food baskets have similarities in terms of variety and the items that comprise them, and allow us to identify the most relevant foods, considering the weight they have in the household budget. Beef and bread stand out as the most important components of the diet of a working-class family in Montevideo, accounting for more than half of the total spent on food in 1914, and 42 per cent in 1937. The expenditure on milk was 12 per cent of total expenditure in 1914 and 16 per cent in 1937. Between the two baskets, potatoes represent 5 per cent, and sweet potatoes 2 per cent of total food expenditure. Data for 1937 shows some differences between food consumption in Montevideo and the rest of the country, namely the type of meat consumed (with sheep being consumed more in the Interior) and the quantity of milk consumed (the consumption in Montevideo being 50 per cent greater than in the Interior). The items selected account for 85 per cent of the total household expenditure on food in 1914 and 69 per cent in 1937. Then, by 1962, according to the Survey on Family Consumption and Income in the Metropolitan Area of Montevideo (Instituto de Estadística, 1968), the items chosen accounted for 46 per cent of total food expenditure.
The sample studied lost representativeness in terms of household expenditure, when we compared the information in 1914, 1937, and 1962. This is the result of two effects. First, comparing 1914 and 1937, we observe similar baskets in terms of the type of components, although the 1930s basket includes lower quantities of some of the foods and has lower prices. On the other hand, the basket for 1962 belongs to a statistical sample for Montevideo, and includes many more items than the previous studies, which may help to explain a lower allocation of the expenditure on the items selected. In addition, after 1940, there is a greater supply of agricultural and industrial products that increased the consumption of a range of foods (Camou, Reference Camou1996).
In the second phase, we utilised the commodity flow approach commonly used in the estimation of Historical National Accounts (see, for example, Prados de la Escosura, Reference Prados de la Escosura2003) and the criteria used in food balance sheets proposed by FAO (2001) in order to construct annual series of apparent consumption. Starting with domestic production statistics and following the commodity flow approach, we included imports and excluded exports to obtain the apparent consumption of the studied items. Then, following the food balance sheets methodology we adjusted the rough series, when possible, for changes in stocks, non-human consumption and waste, and thus obtained the available quantities for human consumption. Finally, for each food, we built a series in physical units (Kilograms and Litres) and expressed them in per capita terms. As Llorca et al. (Reference Llorca-Jaña, Nazer, Navarrete-Montalvo and Morales2022) recalls, food balance sheets methodology is good enough for long-term analysis, which is our current purpose, even though it has some caveats, in short-run analysis for example, since it fails to take some kinds of variations into account.
Given the characteristics of the territorial distribution of the population in Uruguay, differences between the food demand in Montevideo and the Interior, distribution of production and its commercialisation, and between urban and rural, we tried to differentiate between the varying demands for some products. We calculated per capita series distinguishing Montevideo and the Interior (urban and rural) for meat and milk. In the case of roots and tubers, we were able to distinguish between urban and rural consumption, whereas in the case of wheat and its derivatives, no disaggregation was possible.
We used primary and secondary sources to estimate each component of the apparent consumption of each item. Among the former, Statistical Yearbooks of Uruguay (Anuarios Estadísticos), Agricultural Statistics, Agricultural and Population Censuses, and information from the National Accounts System are the main sources used. Among the secondary sources consulted are several sector studies, as well as other reconstructions of historical series: Bértola (Reference Bértola1991), Bertino and Tajam (Reference Bertino and Tajam2000a), Christophersen (Reference Christophersen1948, Reference Christophersen1950), BROU (1966), MGA (1967a, 1967b) and OPYPA (1972). We used the Hodrick-Prescott filter to estimate the trends of each of the aforementioned series.
Finally, following the literature (Pujol and Cussó, Reference Pujol-Andreu and Cussó2014; Delgado and Pinilla, Reference Delgado and Pinilla2022), we highlight some aspects related to income, prices, and preferences, on the one hand, and changes in productivity on the other hand, that help to understand the major shifts in food diet in Uruguay. In the following paragraphs, we present a brief description of the elaboration of series for each food. For the complete methodology and sources see Presa and Román (Reference Presa and Román2020).
2.1. Milk
The apparent consumption for the whole country is based on milk production data taken from the Agricultural Censuses of 1900, 1908, 1930, 1937, 1951, 1956, 1961, 1966, and 1970.Footnote 3 Milk for dairy products (cream, butter, and cheese) was subtracted from total production based on information from Bertino and Tajam (Reference Bertino and Tajam2000b) and CONAPROLE.Footnote 4 The quantities for the mentioned years were linearly interpolated in the period 1900–37 and then using the variations in the total milk production constructed by BROU (1966). The reason to consider Agricultural Censuses levels instead of BROU (1966) levels, in the period 1937–65, is that BROU data could be underestimating the quantities produced for self-consumption.
The series for Montevideo is constructed with the deliveries of milk to CONAPROLE since 1937, adjusted for the quantities produced in urban and suburban dairies that were not pasteurised (which represented almost 20 per cent at the beginning of the period and declined thereafter). Prior to 1937, the main sources of data were sectoral studies about milk supply in Montevideo (Bertino and Tajam, Reference Bertino and Tajam2000b; Asociación Nacional de Productores de Leche, 1934). Those studies estimate the daily consumption of the city for several years (1903, 1913, 1918, 1928, 1934), usually based on the number of primitive dairies and the average productivity of cows, together with the production of larger and more advanced factories. Then, the series of 1903–37 was obtained by linear interpolation of the mentioned benchmark years; values for 1900–02 are the same as 1903. Finally, milk for the Interior is obtained by considering the difference between milk for the whole country and for Montevideo. The series obtained are consistent with the literature and the historical context, and we did not identify any clear bias due to the sources.
2.2. Meat
To cover 1900–35, for beef and sheep, and up to 1940 in the case of pork, the primary information corresponds to the Statistical Yearbooks on the slaughter destined for the supply of Montevideo and the Interior (DGEC 1930; 1940; 1941–4; 1944; 1945–9; 1950–4; 1955–60). The information is expressed in the number of animals, so we converted them into kilograms of meat per animal.Footnote 5 To fill missing values, we use linear interpolation. In order to get estimates of the non-regulated slaughter, we assumed the average proportion between non-regulated and regulated slaughter that arises from the data available in BROU (1966), between 1935 and 1938, and used it for 1900–35. Then, we distributed the non-regulated slaughter between Montevideo and the Interior. Figures for beef and sheep between 1935 and 1964, and for pork from 1940 to 1964, belong to BROU (1966: 124). The BROU series cover slaughters regulated by official (and registered) agencies, as well as non-regulated (absent from the official records and estimated by BROU, 1966). From 1965 to 1970 figures of beef belong to Barbato (Reference Barbato1977) and for sheep and pork, we use the information from the food balance sheets of FAO.
The main limitations of the estimations correspond to the period previous to 1937. In the first place, the statistics do not bring information on the non-regulated slaughter, so we made some assumptions to control for this omission. In the second place, we expect the figures for Montevideo to be more reliable than the ones for the Interior, as the supply of meat for the capital was under a stronger control of the state. Both types of restrictions may introduce some biases in the levels during the first three decades of the twentieth century, a potential underestimation, but we are confident about the general evolution of meat consumption.
2.3. Wheat
The series of apparent consumption of wheat flour followed five steps. In this case, as quantities of domestic production, imports and exports of wheat and wheat flour are presented at the national level, there was no chance of further disaggregation of apparent consumption. First, annual domestic wheat production data was taken for each agricultural year from official Agricultural Statistics data. Second, we subtracted the amounts of sowed wheat series to production series of the previous year, based on the same previously mentioned data sources. Third, we subtracted exports and added imports of wheat and obtained annual series of wheat available for human consumption. To smooth the high variability of this series, two assumptions were made. In the first place, in the absence of information on wheat stocks, we calculated three-year moving averages. In the second place, we assumed that the series of total wheat availability is for human consumption, given the lack of annual data on wheat for animal feed. We hypothesised that those represent minor quantities, since in 1951 fodder represented around 3 per cent of total wheat according to data from the Agricultural Census of that year. Finally, domestic wheat flour production was obtained by applying a transformation (or extraction) coefficient of wheat into flour (based on secondary sources), which varied between 0.70 and 0.76 (with an exceptional year of 0.82, 1946). Figures for wheat flour apparent consumption were finally obtained by adjusting for the export and import of wheat flour. The main limitation of the estimation of wheat consumption is its volatility, which persists despite the calculations made to smooth the levels. This result warns us to be cautious when analysing very short-run periods and better focus on the trends of the time series.
2.4. Potatoes and sweet potatoes
We obtained series of apparent per capita consumption of potatoes and sweet potatoes. First, we took domestic production from Agricultural Censuses and Agricultural Statistics (Christophersen, Reference Christophersen1948, Reference Christophersen1950; BROU, 1966; OPYPA, 1972), and use linear interpolation to fill missing data in some years: 1900–07, 1909–15 and 1917. Then, we added imports of potatoes taken from the same sources except for the 1960s, when we used FAO’s food balance sheets. In the case of potatoes, exports were low in volume and located in specific periods of particularly good harvests, and for that reason, no larger adjustments were made. There are no records of foreign trade for sweet potatoes, so we assume they were null for that food.
Once we obtained the annual availability of potatoes and sweet potatoes, we calculated the amounts dedicated for sowing for each year, which are assumed as reproductive consumption for the previous year and deducted from the quantities available for human consumption. Available quantities of potatoes and sweet potatoes were also adjusted for waste, following FAO methodology. At this point, three assumptions were made. First, quantities dedicated to fodder were assumed as null. Secondly, no adjustments were made due to inter-annual stock variations, due to the limited use of refrigeration for tubers. Third, potato contained in processed products, like canned stews, was assumed to be included in the apparent consumption.
Finally, we calculated self-consumption based on the records about consumption on rural farms (Agricultural Census 1916, 1946, 1951). This adjustment is of great importance in the case of sweet potatoes since the volume of self-consumption is almost the same as the production destined for markets (Agricultural Census 1946, 1951). Self-consumption was also adjusted for waste.
In both root vegetable estimations, rural consumption has a greater margin of error because records on rural establishments are often difficult to obtain. This limitation may be more evident in the case of sweet potatoes, as it has greater penetration in rural areas during this period, and it is possible that the censuses underestimated this type of consumption.
2.5. Population and prices
Series of population were taken from Nathan (Reference Nathan2014) and Pellegrino (n.d.). The figures for Montevideo correspond to Cabella and Pollero (Reference Cabella and Pollero2000), who kindly gave us their unpublished estimates, while the data for the Interior was obtained by difference. To disaggregate between urban and rural population, we used data from agricultural censuses (MGA, 1967a), available only for a few years, and interpolated that data using changes in urban population with data from Klein and Van Drecht (Reference Klein Goldewijk and Van Drecht2006).
We collected information about the prices of the selected items. Consumer-level prices of milk, meat, wheat flour, bread, potatoes, and sweet potatoes are available for the years between 1907 and 1970, on an annual basis. For most of the time the information belongs to Montevideo, but for some years, we were able to find prices for the whole country. We deflated current prices with consumer prices index to avoid the large changes seen in the 1960s due to the inflationary process carried out in those years (all prices are expressed in pesos at 1913 rates).Footnote 6 From 1907 to 1939, average prices were taken from the Statistical Yearbooks of 1920, 1929, and 1940 for Montevideo and whole country data, except the values in 1939 for Montevideo, which were taken from DGEC (1940). From 1940 to 1948, current prices for Montevideo were estimated with indexes available in the Statistical Yearbooks (1940–44 and 1945–50). From 1949 to 1959 Montevideo prices are available in DGEC (1959). Prices between 1960 and 1970 were obtained using the information on relative prices from COMCORDE (1975).
3. Evolution of per capita food consumption
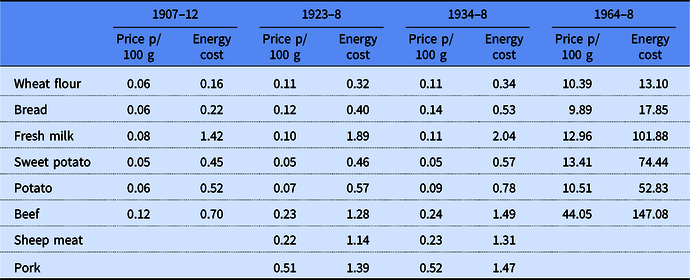
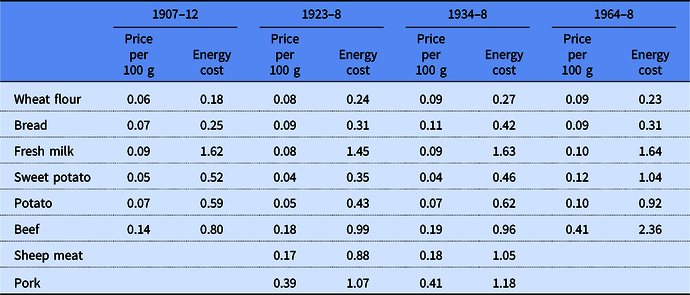
In this section, we describe the major trends and the most important shifts during the period for each of the foods studied. We also introduce some explanations, according to the changes in demand and supply, mostly described in section 1, that may help us to understand the evolutions observed. First, in order to understand the evolution of food consumption it is important to analyse the cost of living and, in particular, what happened with food prices. On average, the general price consumer index shows a picture of relatively low inflation – for both food on its own and the total consumer price index – until 1946.Footnote 7 During the industrialisation process, there was a state policy to control the prices of beef, milk, and wheat so as to guarantee the consumption of these food items. However, the picture changed after the Second World War. Food prices showed several episodes of increase reaching annual rates of 50 per cent during the 1960s. Inflation determined other hierarchies of prices, which may have affected demand. Table 1 presents the food prices between 1907 and 1968 expressed in cents of Uruguayan pesos (five-year average). Table 2 displays the figures at constant prices of 1913. On average, prices for meat were higher than any other food. Prices for bread and wheat flour were higher than that of milk. Prices for sweet potatoes (until the 1950s) and potatoes were lower than those for milk and cereals. After the 1950s, the main change was that the price of beef increased the most, becoming much more expensive than the other food. In the next section, we will discuss how these movements in unit prices may help to explain some of the changes we observed in the per capita apparent consumption.
Food price measures. Price per 100 g and energy cost (price/100 kcal). Prices are expressed as cents of Uruguayan Pesos. Five-year averages

Source: Based on Ministerio de Trabajo y Seguridad Social (2002) and Statistical Yearbooks.
Food price measures. Price per 100 g and Energy cost (price/100 kcal). Prices are expressed as cents of Uruguayan Pesos of 1913 (constant prices). Five-year averages

Source: See Table 1.
It is useful to add an evaluation of the cost of food considering their nutritive value. In order to evaluate the relation between the costs of different foods considering their nutritive value, we calculated the energy cost as the price of 100 calories of each food in cents of Uruguayan pesos (cents of Uruguayan pesos/kcal: see Table 1 for current prices and Table 2 for constant prices).Footnote 8 Overall, we find that the proteins from animals – milk and meat – were more expensive than potatoes and sweet potatoes and the cereals food group. As we discussed before, we identified two scenarios along the period of study: before and after the mid-1950s. Up to the 1950s, the results show the energy cost for milk was higher than for any other food. Cereals – wheat flour and bread – supplied the lowest energy cost, followed by potatoes and sweet potatoes. In the middle, the meat group supplied higher cost-dietary energy than cereals and vegetables, but lower than milk. Focusing on the meat group, the price of beef was very similar to pork until the late 1940s, and more expensive than sheep. After 1950, important shifts, considering the energy cost, took place. The cost of beef increased and became the highest energy cost (we could not find prices for other types of meat). Sweet potato turned out to be more expensive than potato. Bread and wheat flour remain the lowest energy-cost food. The results concerning meat are consistent with findings for other regions. According to Drewnowski (Reference Drewnowski2010), several studies showed that fats, grains, sugar, beans, and potatoes had substantially lower energy costs than did lean meat, lettuce, or fresh fruit.
3.1. Milk consumption
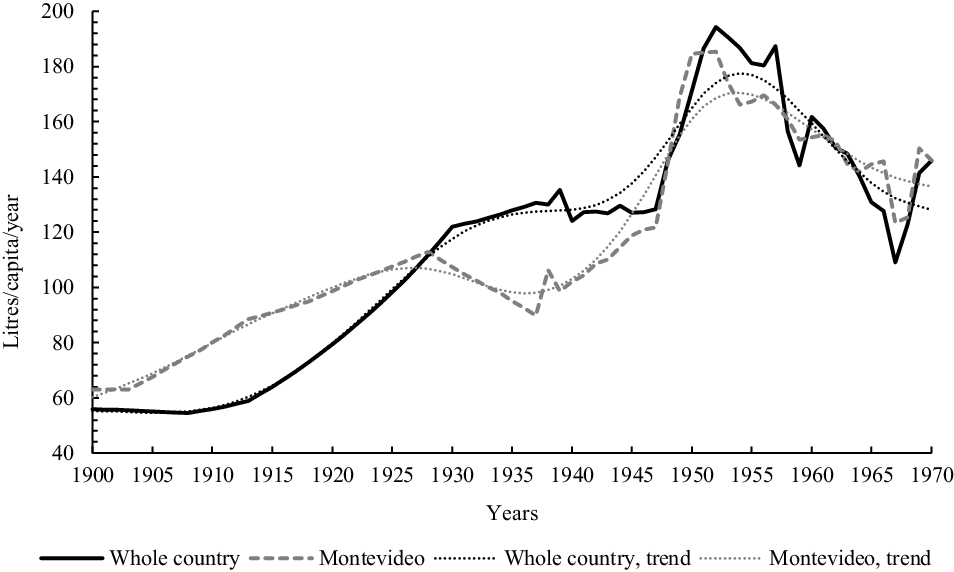
The series of milk show an important increase in the 1910s and 1920s, where per capita consumption doubled. Between 1930 and 1947 the apparent consumption at the country level remained practically stagnant, with a rate of growth of only 5 per cent (Figure 1). On average, during this period, consumption was around 128 L per year per capita, equivalent to around 350 ml of milk per person per day. In Montevideo, in 1930, individual consumption was below the national average, at around 105 L per year, whereas in 1937 it was only slightly below the national average (122 L per year per person). Then, milk consumption went up significantly between 1947 and 1952, increasing by nearly 50 per cent at the country level and especially in Montevideo. Milk consumption reached 500 ml per capita per day in 1951–2 in Montevideo, and a bit higher for the whole country. Finally, by 1970, the scenario changed, and consumption decreased by approximately 20 per cent, which is the result of stagnation in total milk production and a growing population, mainly in Montevideo.
Consumption of milk per capita, annual litres (1900–70).
Source: Authors’ own data elaboration.

The level reached in 1930 was the result of a long and steady process of expansion of the consumption of milk in Montevideo and its surroundings and in the department of Colonia, which is an important centre of cheese production distributed among small farms. Then, for most of the 1930s, milk consumption per capita decreased slightly. The dairy sector of Montevideo was going through profitability problems both for commercial-scale producers and industrialisation plants, mainly due to the large intermediation margins received by operators in the distribution chain (see Asociación Nacional de Productores de Leche, 1934). Another major problem was the lack of hygiene of milk, widely discussed in several studies by health professionals and agronomists (see, for instance, Asociación Nacional de Productores de Leche, 1934). Moreover, the large percentage of idle capacity in the pasteurisation plants in Montevideo, which were in strong competition among themselves, along with the maintenance of raw milk production in farms, also contributed to the stagnation of the total amount of milk produced and therefore contributed to the reduction observed in individual consumption.
This situation began to reverse with the centralisation of the industrialisation and supply of milk in Montevideo by CONAPROLE in 1937. The monopolisation in a milk producers’ cooperative supervised by the State allowed not only to quickly improve hygiene standards, but also ensured a daily supply to families and generated a gradual process of product diversification. In addition, a price administration system was established, which ensured a minimum price for producers, reduced the distribution margin, and made the consumption of this product possible by low-income classes in Montevideo at an affordable price. This new context fostered the acceleration in per capita consumption towards the end of the 1940s and the beginning of the 1950s. It is during this period that milk finished its consolidation as an essential product for the nutrition of the citizens in the capital and also in several other urban centres, especially those that had pasteurising plants.
The consumption of milk at the country level shows nearly the same changes as Montevideo, especially the notable increase at the end of the 1940s. While the production of CONAPROLE, mainly for Montevideo, was expanding, in the rest of the country pasteurising plants began to proliferate in the main urbanised areas, which was essential to expand consumption in those places. It should also be noted that this expansion of production at the national level was mainly driven by the increase in the number of dairy cattle, rather than increases in productivity (MGA, several years; MGA, 1967a). One open question is whether changes in consumption at the national level were driven by a greater production at a national level encouraged by increased demand from Montevideo, or if the opposite process occurred.
Later, from the supply side, the evolution after 1952 seems to be linked to the almost null growth in productivity per milked cow due to a lack of innovation in the dairy sector (Barbato, ed., Reference Barbato1987). This tendency to low growth or stagnation would not be completely reversed until the establishment of the export promotion industrialisation model in the 1970s, in which CONAPROLE once again played a key role. It should be noted that a part of the fall observed in the series for the whole country starting in the early 1950s could be due to changes in preferences, as the demand for derivatives increased at the expense of a lower consumption of milk. Another possible cause of this decrease could be attributed to prices. Expressed at 1913 values, prices decreased significantly in the 1940s and 1950s (Table 2). Particularly in Montevideo, the price of milk was highly regulated for the whole period studied, which means that the government of Montevideo could set an affordable price by subsidising the production of milk. This process intensified with the unification of pasteurised milk production in CONAPROLE, and it is fundamental to explain the growth in apparent consumption seen in the late 1940s.
3.2. Meat consumption
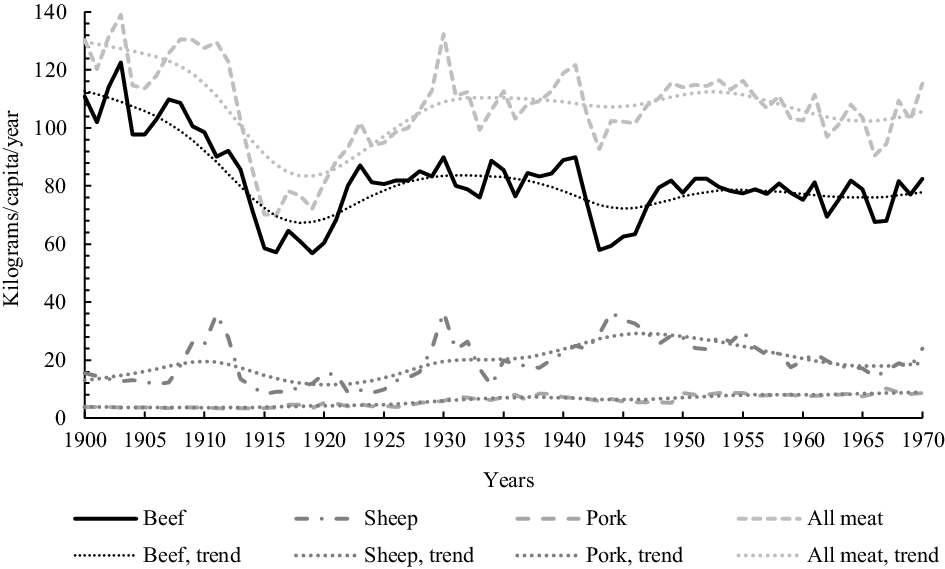
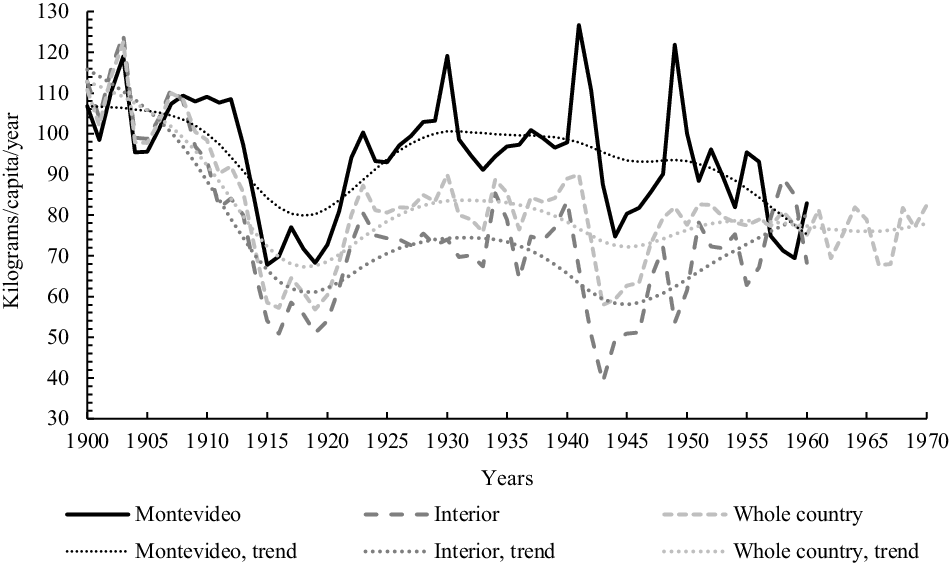
At the beginning of the twentieth century, per capita consumption of meat – beef, sheep, and pork – was around the highest levels of our sample: 125 kilos per year on average. Towards the end of the 1960s, per capita consumption was reduced to an average of 102 kilos per year. Among meats, beef has been the most consumed (76 per cent), followed by sheep (18 per cent) and finally pork (6 per cent) (Figure 2). Throughout the period, on average, the consumption of sheep and pork increased, without displacing the predominant role that beef occupies. However, different patterns are observed in the evolution of meat depending on whether it is Montevideo or the rest of the country, where one or other types of meat face different demands. Between 1900 and 1970, the distribution of meat consumption in Montevideo was the following: 89 per cent beef; 4 per cent sheep, and 7 per cent pork. In the Interior, the share of each type of meat was: 54 per cent beef, 27 per cent sheep, and 5 per cent pork. In Montevideo, the decrease in meat is explained by a fall in beef and sheep, while there was an increase of pork in the food basket. In the rest of the country, throughout the period we find a decrease in the consumption of beef against an increase in sheep and pork.
Consumption of meat per capita, annual kilograms (1900–70).
Source: Authors’ own elaboration.

It is important to account for external demand fluctuations in order to fully understand the evolution of meat consumption. Beef is one of the main export products of the country, with livestock products having accounted for more than 80 per cent of exports since the late nineteenth century – and up to 1970s – and beef accounted for 26 per cent, on average, of total exported goods (Moraes, Reference Moraes2008: 119–20). From the point of view of livestock production, three phases can be distinguished between 1900 and 1970 (Moraes, Reference Moraes2008): a period of growth (from the last decades of the nineteenth century until the First World War), a period of slowing down (1914–30) and stagnation (1930–70). In addition, the meat industry has gone through different stages, from its growth and expansion with the spread of refrigeration in the early twentieth century to its decline and stagnation towards the end of the 1950s. These industry fluctuations, some marked by external factors – the Ottawa treaties and preferential changes in the United Kingdom, and later an increase in external demand caused by the Second World War, – and others by internal factors – livestock stagnation, institutional difficulties of meatpacker industries – directly affected the availability of meat for domestic consumption (BCU, 1974).
The high levels in meat consumption observed at the beginning of the century fell around the First World War, when livestock production was destined for the external market, driven by a dynamic foreign demand and high prices (Figure 3). After the war, the evolution of beef followed a period of stability until the mid-1940s, when per capita availability decreased by about one-third. This fall and slow recovery could be explained by several factors (Bertino and Tajam, Reference Bertino and Tajam2000a). First, due to the impact of the Second World War on demand and prices that encouraged the slaughter of livestock for the supply of the external market. In fact, between 1941–3 external demand represented 72 per cent of the destination of the production, whereas before and after the war, it did not exceed 30 per cent on average (MGA, 1967b). Second, the summer drought of 1942–3 had a negative impact on the number of livestock and in the following years the shortage of calves. At the end of the same decade the availability increased, but was unable to return to the previous values, remaining close to 80 kg per capita until the mid-1950s when it began to decrease.
Consumption of beef per capita, annual kilograms (1900–70).
Source: Authors’ own elaboration.

If we focus on the average consumption of beef between 1930 and 1970, there is a stable trend of around 80 kilograms per capita (a level that would remain up to the 1990s, based on INAC, 2007). However, there were differences between Montevideo and the Interior. In the case of Montevideo, per capita consumption decreased, from 100 kilos per capita in the early twentieth century to 86 kilos in the 1950s, which partially drove the changes in the whole country’s consumption. Increasing prices seem to be the main factor of this decrease: beef prices showed a stable trend up to 1947 when they started to increase, multiplying by three and four times in constant terms (Tables 1 and 2). On the other hand, consumption in the Interior shared this negative trend until the end of the 1940s, but then increased in the 1950s, reaching 74 kilos of beef per capita. Unfortunately, we were unable to obtain prices for this period for the Interior of the country.
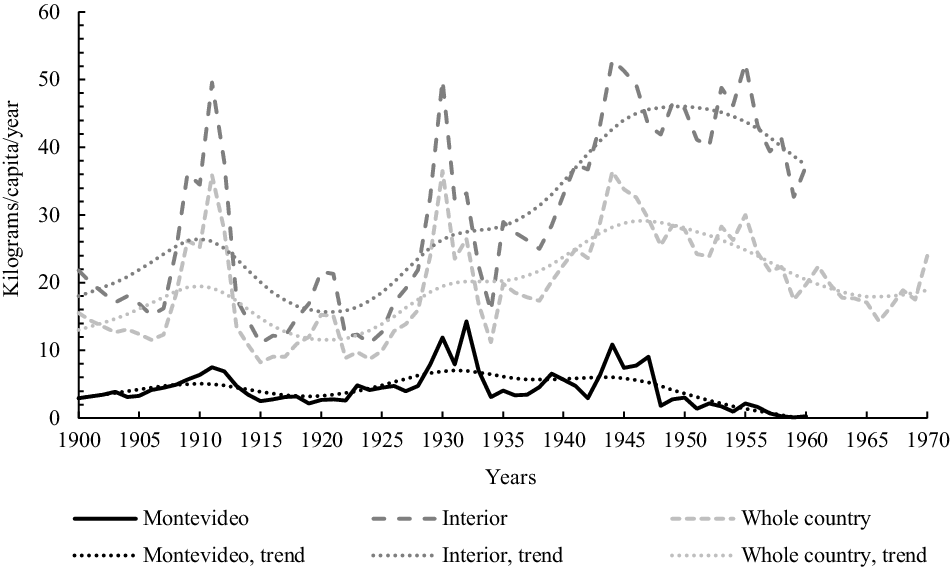
The per capita consumption of sheep increased from 15 kilograms per person per year on average at the beginning of the twentieth century to 29 kilograms in the 1940s, and then decreased to 18 kilograms on average in the 1950s (Figure 4). We identified asymmetric evolutions between Montevideo and the rest of the country. While lamb and mutton are not greatly consumed in the capital, with consumption not exceeding 7 kilograms per capita annually on average throughout the period (and which has fallen since), in the Interior, especially among the rural population, it is a fundamental component of the diet. In these regions, the consumption of sheep increased systematically, from 20 kilograms per person per year between 1900 and 1910 to 43 kilograms between 1950–60.
Consumption of sheep per capita, annual kilograms (1900–70).
Source: Authors’ own elaboration.

Sheep consumption grew intensively during three particular periods. Around 1910 and 1930, when sheep stock recovered after various factors that affected livestock production (Bertino and Tajam, Reference Bertino and Tajam2000a). Then, during the Second World War, there is an important increase in the consumption per capita. In this specific context, sheep meat took the place of a good substitute for beef while the consumption of beef fell, as the slaughter of bovine meat had the external supply as its main destination (Bertino and Tajam, Reference Bertino and Tajam2000a). Although these behaviours are observed in Montevideo and the Interior, the intensities were very different between both regions. In the capital city, as sheep meat is a small share of total meat consumption, the substitution effect was less intensive and temporary. After the beef supply normalised, the consumption of sheep in Montevideo fell. However, in the Interior, sheep consumption grew at a faster rate, even surpassing the levels of beef during those years. Afterward, the consumption of sheep kept at a higher level than in previous the war but, without replacing the predominance of beef in the household diet.
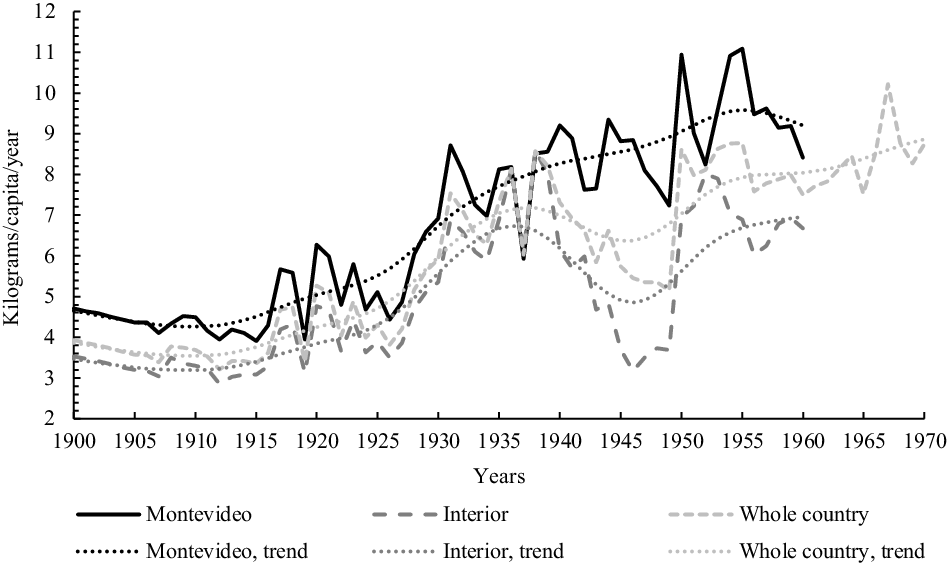
Finally, pork, while representing a minor share of meats, has occupied an increasing place in the consumption habits of the population, although it was a little more evident in the case of the Capital (Figure 5). At the beginning of the twentieth century, 4 kilograms per person per year were consumed on average in Montevideo, and 3 kilograms in the Interior; by the 1950s, these levels increased to 10 and 7 kilograms per capita per year, respectively.
Consumption of pork per capita, annual kilograms (1900–70).
Source: Authors’ own elaboration.

The trend in total consumption of pork meat has been positive, except for the short-term episode of the drought of 1942–3, which had a negative impact that lasted for several years until it recovered. From the graphical analysis, a substitution effect of this meat in relation to that of sheep or beef is not observed, but rather would be a result of the diversification of consumption patterns. In any case, it is an aspect to deepen in future research.
3.3. Wheat flour
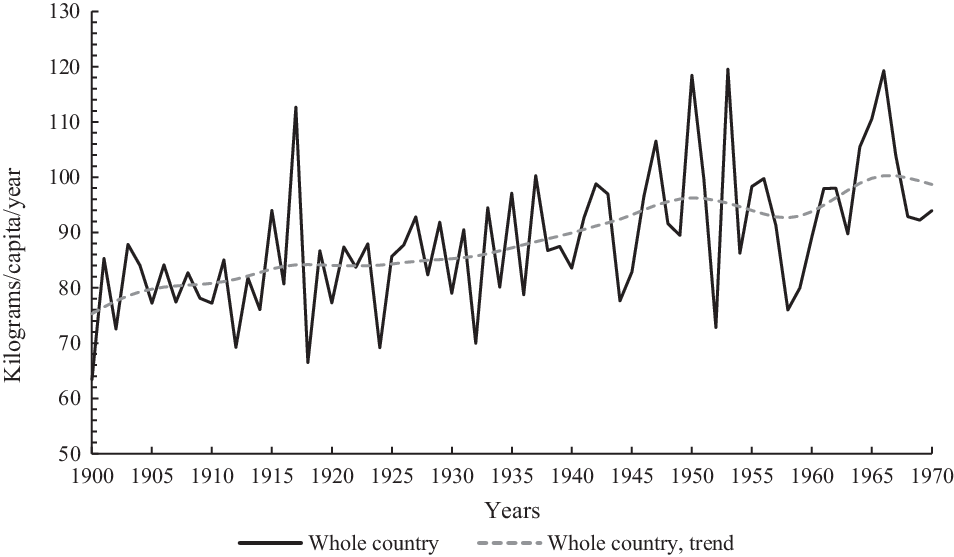
The evolution of apparent per capita consumption of wheat flour shows a relatively low annual growth. Annual consumption was almost 80 kilograms per person at the beginning of the twentieth century and reached 100 kilograms in the 1960s (Figure 6). Through the period, we distinguish a specific period of decrease, between the late 1950s and early 1960s, associated with certain climatic events (i.e., heavy floods in 1959), and then a new rise in the late 1960s.
Consumption of wheat flour per capita, annual kilograms (1900–70).
Source: Authors’ own elaboration.

Wheat products, especially bread and pasta, became relevant foods in the Uruguayan diet at the very beginning of the twentieth century. Its evolution is strongly linked to that of the wheat sector, which is defined by Bértola (Reference Bértola1991) as the set of wheat production, wheat flour production, and flour industrialised products (bakeries, noodles, and pasta factories). The growth of wheat production is linked to the expansion of cultivated areas at the end of the nineteenth century (Millot and Bertino, Reference Millot and Bertino1996) and between 1914 and 1928, which were periods of increases in productivity. The production expansion was also grounded on the establishment of protectionist laws, mainly that of 1891 that closed the wheat and flour market to foreign competition except for years with poor harvests (Millot and Bertino, Reference Millot and Bertino1996). The proliferation of large-scale mills at the end of the nineteenth century allowed for an increase in milling capacity, which in any case ended up exceeding both the needs of the domestic and the external markets (Millot and Bertino, Reference Millot and Bertino1996).
Growth in the demand for wheat flour was mainly due, until 1930, to the expansion of the internal market due to a larger population and a general increase in income. In addition, there were important changes in the preferences of consumers stemming from European immigration. Bértola (Reference Bértola1991) highlights a process of import substitution after 1913 linked to noodles and pasta, complemented by an external market which played a fundamental role in setting prices of the exportable surpluses in times of large wheat harvests and creating an incentive to increase the cultivated area in situations of high international prices, which made crops profitable in less productive lands.
After 1930, the supply of wheat increased until the end of the 1950s, although some volatility is observed with several setbacks in the 1940s. This increase was particularly strong in the 1950s, explained by significant expansions of the cultivated area and higher yields. The role of agricultural policy was fundamental in this performance (Bértola, Reference Bértola1991): the State set prices of crops, intermediate products, and consumer goods. This policy was supported by high international prices of grain, particularly in the 1950s, which also directly encouraged increases in production destined for exportation.
On the demand side, even though there was a considerable increase in per capita consumption of wheat flour (about 10 per cent between the 1930s and 1950s), the domestic market was unable to absorb the increases in supply described above (Bértola, Reference Bértola1991), given the low-income elasticity of wheat flour and its industrialised products and the non-availability of substituting imports, a process that had been completed by the beginning of the century. In any case, increases in income in the whole economy and in particular a process of progressive income distribution that occurred during the State-led industrialisation (Siniscalchi and Willebald, Reference Siniscalchi and Willebald2018) may have driven the slight increase observed in apparent consumption of wheat flour and its industrialised forms. This stems from the fact that the low-income elasticity of those products causes a more than proportional increase in consumption by low-income groups when income is redistributed.
Finally, the volatility that the consumption series presents could be linked, through the production and commercialisation of wheat and flour, to at least four things. First, wheat storage capacity, which could not be measured in the construction of this series, would allow smooth consumption especially when large crops are followed by large falls in planted areas. Indeed, several times the largest mills bought and stored large amounts of wheat to reduce prices paid to producers (Galán, Reference Galán2002). Second, apart from its low trend growth, the evolution of land productivity is extremely variable, not only because of exogenous factors such as bad weather or pests, but also due to low technological progress in this crop: low use of pesticides and fertilisers, poor quality seed, among others (MGA, 1967b). Third, short-term movements in international prices, as already mentioned, may have affected the planting decision in relation to marginal lands that require higher export prices to be profitable. Finally, we should recall that imports are limited to only the years of deep falls in production and did not compensate for the entire shortfall, while the export of surpluses was subject to external prices and, therefore, was not totally linked to the needs of the internal market.
Wheat prices – as expressed in constant pesos of 1913 – do not seem to explain much of the short-term variations in consumption, even though there seems to be a period of price increases after the First World War (see Table 2). Movements in constant prices until the second half of the 1940s are mostly due to changes in the consumer price level, whereas an important increase is verified in bread price in Montevideo between 1945 and 1947, even though the general price level had not increased previously. This could have caused an increase in the relative price of bread in Montevideo, but we were unable to check if consumption decreased in Montevideo due to this change. In any case, consumption of wheat flour and its industrialised products increased, denoting the importance of this set of products in the Uruguayan consumption basket. Finally, a significant decrease in the 1950s is observed, as in other products of the analysed basket, but in this case, we do not observe a clear correlated increase in wheat consumption.
3.4. Potato and sweet potato
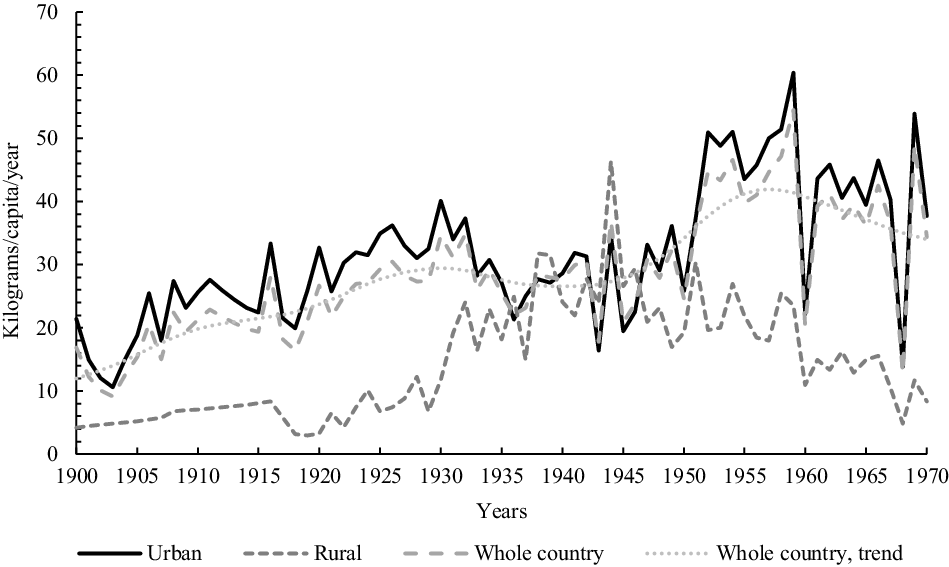
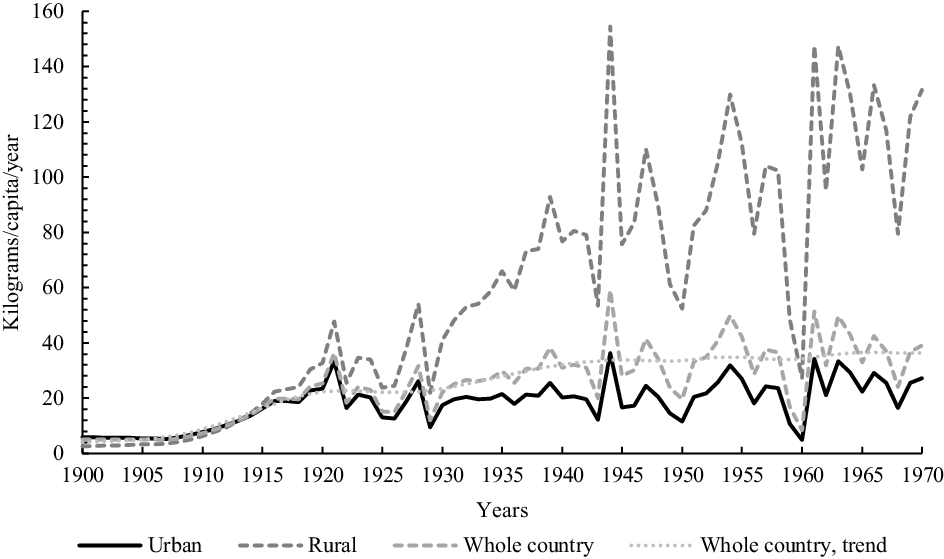
Potato consumption per person steadily increased until the mid-1920s, reaching approximately 30 kilograms per year per person, and remained relatively stable until 1950 (Figure 7). Then, it jumped significantly during the first half of the 1950s, stabilising afterward in the range of 40 kilos per capita, despite having some specific decreases mainly due to climatic events. On the other hand, the consumption of sweet potatoes started the first decade of the twentieth century with a per capita level of 5 kilograms per year and reached 20 kilograms per capita by 1920 (see Figure 8). Then, it grew consistently to reach almost 40 kilos in the 1960s.
Consumption of potatoes per capita, annual kilograms (1900–70).
Source: Authors’ own elaboration.

Consumption of sweet potatoes per capita, annual kilograms (1900– 70).
Source: Authors’ own elaboration.

Explanations of performances are quite different for each of the two crops. In the case of potatoes, urban demand is more important than rural consumption. Although there seems to be some convergence in the 1940s between both demands, in the 1950s this process is not so clear. Import figures show how important potatoes were in the Uruguayan diet. Potato production increased at a slower rate than imports, which shows that domestic market demand was clearly greater than domestic production. This situation changed by the 1930s when the domestic production became more dynamic. Cultivated areas started to grow from 1916 and with a faster growth in the first half of the 1930s and in the 1940s. Productivity, measured by the yield of the crop per hectare, increased significantly in the 1920s and 1930s due to an active agricultural policy.
As Figure 7 shows, between the mid-1930s and early 1950s, there was a period of relative depression in potato consumption. In these years, imports were significantly reduced, due to the steep rise of the prices of Uruguay’s main supplier, Argentina (MGA, 1938). This imposed an external restriction on the supply side that explains the decrease in apparent consumption of potatoes during the 1930s, which was partially offset by domestic production.
Unlike the potato, the sweet potato was not of specific interest for public policies. However, from the 1930s on it seemed to be an important food in rural areas. In fact, according to the Agricultural Census of 1946 and 1951, about half of the production was for self-consumption. Beyond the high level reached by the series of rural consumption from the 1940s on, which may be reflecting problems in the construction of the series, at the same time, urban consumption of sweet potato remained stable, which reinforces the relative role of the potato in urban areas (Figure 8).
The 1950s showed a significant increase in the apparent consumption of potatoes and a slight increase in the consumption of sweet potatoes, both at the whole country level. In those years, tubers became an established part of the Uruguayan diet. Its supply grew firstly according to the expansion of the cultivated area during the 1950s, and then in the 1960s due mainly to better yields, which was made possible by better use of the land.
Finally, prices should shed light on the role played by changes in relative prices that made the consumption of roots and tubers more affordable and attractive, or if the increase in per capita consumption was due to changes in the preferences of individuals, especially due to a greater diversification of the basket. At a first glance, prices in 1913 pesos (Table 2) seem to reflect moments of scarcity in the available quantities of potatoes and sweet potatoes. Also, in the 1950s potatoes had a relatively lower price growth when compared with other products, mainly meat (MGA, 1967a, 1967b).
3.5. General trends in food consumption
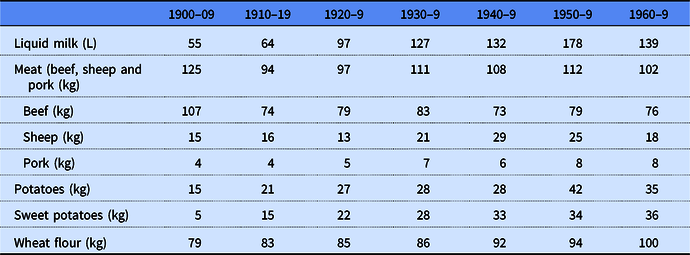
Looking at the general trends, we can conclude that during the first seventy years of the twentieth century, the apparent consumption for the products studied increased, with the exception of beef that suffered a decline. Table 3 shows the per capita levels of annual consumption considering the average of each decade. Sweet potatoes, followed by milk, potatoes, and pork are the foods with larger increases. Wheat flour and sheep grew, but at a lower rate, while beef declined.
Annual consumption per capita, ten-year average

Source: Authors’ own elaboration.
The general trends in the evolution of food in Uruguay show that the goods that grew the most are those that were beginning to spread massively among the urban population at the beginning of the twentieth century, while beef, wheat flour (and its derivatives) mainly and milk secondly, were already consolidated foods in the Uruguayan diet. In this sense, we observe a particular kind of diversification of food during the period, particularly, from the 1930s, towards a larger consumption of tubers and meat other than beef. We also identified different kinds of demand depending on the region (Montevideo or the Interior, urban or rural).
The high levels of consumption of meat and milk from the beginning of the twentieth century, compared to the low levels of cereals and roots and tubers, make the country somewhat of an exception from the perspective of the theory of nutrition transition. From an international perspective, compared with countries from Latin America and Europe, Uruguay stands out for its high levels of food rich in animal proteins such as beef and milk, but lower levels of cereals and tubers. Beef consumption at the beginning of the twentieth century was very high when compared to other countries. Uruguay consumed 125 kilograms on average in 1900, and 97 kilograms in the 1930s. Considering another country of the Southern Cone of Latin America, such as Chile, the per capita consumption of meat was 30 kilograms in the 1930s and it was not until the twenty-first century that it reached 70 and 80 kilograms per capita (Llorca et al., Reference Llorca-Jaña, Nazer, Navarrete-Montalvo and Morales2020). Compared with a European country, like Spain, in 1930, the consumption of beef was between 16 and 28 kilograms, depending on the source (Cussó and Garrabou, Reference Cussó and Garrabou2007).
The consumption of milk has also placed the country in a favourable situation by international standards. Uruguayans consumed almost 100 L of milk yearly during the 1930s, a level that Chilean inhabitants reached a decade later. The annual consumption of milk in the 1950s approaches almost 180 L, 20 L higher than the highest milk consumption of Chile in the twenty-first century. This can be also compared to Spain where, on average, annual per capita milk consumption in 1933 was 63 L and 128 L in 1981 (Muñoz-Pradas, Reference Muñoz-Pradas2011). Uruguay started the twentieth century with a per capita annual consumption of 80 kilograms of wheat flour and reached 100 kilograms during the 1960s. These levels are below those of the cereals-based diet of Spain that consumed between 142 and 150 kilograms of flour in 1930 (Cussó and Garrabou, Reference Cussó and Garrabou2007). When comparing with Chile, the consumption of wheat is also somewhat lower, with the Chilean consumption being around 105–15 kilograms per year between the 1930s and the 1960s (once we adjust the quantities given by Llorca et al. (Reference Llorca-Jaña, Nazer, Navarrete-Montalvo and Morales2022) to compare in terms of wheat flour). We can see the same picture with the consumption of potatoes. In Uruguay it was 28 kilograms during the 1930s, peaking to 42 kilograms per person during the 1950s, while Spain consumed between 109 and 164 kilograms per person in 1930 (Cussó and Garrabou, Reference Cussó and Garrabou2007) and Chile 72 kilograms in the 1930s and 67 kilograms in the 1960s (Llorca et al., Reference Llorca-Jaña, Nazer, Navarrete-Montalvo and Morales2022). Despite the lower relative prices of the calories obtained from cereals and tubers, the Uruguayan diet, rich on proteins from an early beginning, took several years to adopt a consumption of cereals, roots and tubers more similar to that of other peripheral economies like Chile in the twentieth century, an aspect which deserves a deeper look in a comparative perspective.
Conclusions
In this article, we have presented the evolution of food consumption in Uruguay during a very important period in its economic transformation, from an agricultural-based economy towards a model of import-substitution industrialisation. Based on the commodity flow approach and the food balance sheet methodology, estimates of the apparent consumption of five types of food were elaborated: meat (beef, sheep, and pork), wheat flour (and its derivatives), milk, potatoes, and sweet potatoes. These are the main food items in the household consumption basket, and we assumed that the measure we provide reflects the available supply to meet the household’s demand. We estimated the series in physical and per capita terms, considering the country as a whole and in some cases also dividing Montevideo vs Interior or urban vs rural areas, according to the available data.
The evidence found gives some general results about the major shifts in food consumption. Uruguay started the twentieth century with internationally high levels of apparent consumption of meat – especially beef – and milk, a feature that has been verified and highlighted by previous research. During the period it is observed that the apparent consumption for the considered products increased, except for meat that suffered a setback – explained by what happened with the consumption of beef, especially, due to higher relative prices. From the analysis of the performance by items, it follows that the foods that increased most in per capita consumption were potatoes and sweet potatoes and, in second-order, wheat flour, while milk maintained a stable growth path until the 1950s. Improvements in the agrarian sector helped to explain the increase in the production of wheat, potatoes, and sweet potatoes, while industrialisation was important to explain the increase in the availability of wheat products and milk.
In terms of diet, there was a diversification of food that could be explained by changes in income, relative prices, preferences, and productivity. During industrialisation, the state policy to control prices of beef, milk, and wheat may have played an important role in guaranteeing the consumption of these food items. This picture changed towards the end of the industrialisation period when real wages started to decline, and a process of higher food prices was observed. Notably, beef became more expensive in relative terms than the other food groups – milk, tubers, and bread. Meat was historically the main food of the diet, but as we showed, it was not the cheapest source of calories. In this sense, the geographical conditions appear to be a determining factor for the type of food, and natural resources of the countries become a crucial element for the consumption of the population, at least in the early stages of development and prior to the food trade expansion (Yates, Reference Yates1960).
Going back to the nutrition transition, the consumption in Uruguay of meat was very high at the beginning of the twentieth century and showed a decreasing trend leading to a diet more diverse with an increase in the consumption of vegetables, cereals and milk. These evolutions make the country somewhat of an exception from the perspective of the theory of nutrition transition. The case studies differ from what is observed for the developed countries and for the case of Latin America, at least for Chile, which is the country with evidence more suitable for the comparison. The changes in the food diet in Chile shows similarities to the nutrition transition about developed countries, with some specificity regarding the speed of the changes (Llorca et al., Reference Llorca-Jaña, Nazer, Navarrete-Montalvo and Morales2020, Reference Llorca-Jaña, Nazer, Navarrete-Montalvo and Morales2022). So, it is a different case than Uruguay. It is true, that Chile was not an agricultural producer like Australia or Argentina, and received less immigration (Lewis, Reference Lewis1978). So, it will be even more interesting to incorporate the other settlers’ economies to see if Uruguay is an exception, or if it shares its exceptionality together with Argentina, New Zealand, and Australia, for instance. Some scholars argue about the main differences in terms of politics (Lewis, Reference Lewis1978); institutions, natural capital; between Argentina and Uruguay, on the one hand, and Australia and New Zealand, on the other hand (Willebald and Bértola, Reference Willebald and Bértola2013). This is another topic to address; if we can find differences between both ‘clubs’ in terms of nutrition transition.
In addition, when looking at the main drivers of the food changes it seems that not only income is important to explain the main shifts in the food diet, but also prices and productivity. Moreover, industrialisation and urbanisation led to changes in two ways. From the demand side, they caused changes in preferences linked to immigration, a higher income, and a more equal distribution of it. From the supply side, they amplified the number of common items and their quantities, as well as improving the commercialisation chains that connect supply and demand. At this point, we introduced into the discussion these arguments, but a deeper analysis is needed to evaluate the magnitude of the impact of each factor.
The results of this study support the literature about different ways in which food transition occurs between countries. The developed countries show diverse experiences about the main changes of the diet and the timing that they occur. For the developing regions, and in particular, in the Latin American economies, the evidence, although is still scarce, goes in the same direction. Food transition presents diverse trajectories depending on the characteristics of the country. Although income is an important variable to explain changes in food demand, in the case of countries with endowments of natural resources that are very favourable for meat production, price appears as a relevant variable to take into account. In turn, the increase in certain foods in the diet, such as milk, vegetables and cereals, seems to respond to factors more closely linked to improvements in the supply side. Also, it is worth highlighting the importance of differentiating regional trajectories of food transitions within countries.
In future steps of the research, we aim to estimate other food items, especially fruits and other vegetables, in order to complete our knowledge about food consumption and study the diet in terms of nutrition. We also would like to go in-depth about the timing of the nutrition transition and the main shifts in the second half of the twentieth century where more evidence is available for other developing economies, allowing us to expand the international comparative analysis.
Supplementary material
To view the online supplementary material, please visit: https://doi.org/10.1017/S0956793322000231
Acknowledgements
We would like to thank the comments of the participants of CLADHE 6 (Session 19), the Seminar of the Department of Applied Economics (University of Zaragoza), the Economic History workshop of the Economic Institute (Facultad de Ciencias Económicas y de Administración, Universidad de la República), the Seminar of the Economic and Social History Program (Facultad de Ciencias Sociales, Universidad de la República), RIDGE Economic History Workshop, and the ESSHC 2021. We give special thanks to Fernando Collantes, María Inés Moraes, Peter van Dam and Henry Willebald for their suggestions. We are also very grateful for the detailed comments and suggestions offered by three anonymous reviewers, as well as to the journal’s editors for their generosity and helpful advice.