Introduction
Lichens are organisms with wide ecological amplitude, occurring in almost all terrestrial ecosystems (Sillett et al. Reference Sillett, McCune, Peck, Rambo and Ruchty2000; Barreno & Pérez-Ortega Reference Barreno and Pérez-Ortega2003; Ravera et al. Reference Ravera, Genovesi, Falasca, Marchetti and Chirici2010). They appear to have specific tolerance towards extreme environments that limit vascular plant growth (Thomas Reference Thomas1961). On the other hand, due to their poikilohydric lifestyle and dependence on atmospheric deposition for supplies of nutrients (Garty et al. Reference Garty, Kloog, Cohen, Wolfson and Karnieli1997; Belinchón et al. Reference Belinchón, Martínez, Escudero, Aragón and Valladares2007), lichens are excellent bioindicators of atmospheric pollution, including both man-made and natural sources (Hawksworth & Rose Reference Hawksworth and Rose1970, Reference Hawksworth and Rose1976; LeBlanc & De Sloover Reference LeBlanc and De Sloover1970; Kirschbaum & Wirth Reference Kirschbaum and Wirth1997; Nimis et al. Reference Nimis, Scheidegger and Wolseley2002).
The Colombian Andes form part of the Pacific Ring of Fire, characterized by numerous volcanoes. This includes Puracé Volcano in Cauca, Colombia, which otherwise could be described as an Andean subalpine páramo life zone (Sykes Reference Sykes1971; Kelleher Reference Kelleher1972; Monasterio Reference Monasterio1980). Páramos are fragile ecosystems that exhibit a marked daily temperature cycle: high temperatures and high irradiance during daytime and low temperatures at night, together with highly changeable moisture availability (Azócar & Monasterio Reference Azócar and Monasterio1980; Hofstede et al. Reference Hofstede, Coppus, Mena, Segarra, Wolf and Sevink2002). Due to these conditions, páramos represent an extreme environment that restricts vascular plant growth and favours cryptogamic life forms, such as lichens and bryophytes (Monasterio Reference Monasterio1980). The páramo studied here is influenced by a large number of thermal vents of the Puracé volcanic formation; these emit a mixture of sulphur compounds of pyroclastic origin (generated by movement of fluids in the inner walls of the volcano) that create a geothermal gradient of high pressures and temperatures (Sánchez & Samboní Reference Sánchez and Samboní2000; Naundorf & Escobar Reference Naundorf and Escobar2006). The low ambient temperatures restrict gas expansion, generating an uneven dispersion of sulphur compounds and areas of high and low SO2 concentration, among which there are differential effects on plant diversity (Sánchez & Samboní Reference Sánchez and Samboní2000). This applies particularly to lichens which are known to be sensitive to natural volcanic emissions (Moser et al. Reference Moser, Swafford and Nash1983; Bargagli & Barghigiani Reference Bargagli and Barghigiani1991; Grasso et al. Reference Grasso, Clocchiatti, Carrot, Deschamps and Vurro1999; Varrica et al. Reference Varrica, Aiuppa and Dongarra2000). Nonetheless, some species appear to be tolerant to high temperatures and high concentration of solutes, as well as strongly acid pH levels (Loppi & Bonini Reference Loppi and Bonini2000; Sánchez & Samboní Reference Sánchez and Samboní2000). In addition, the acidity or alkalinity of the substratum favours the establishment of acidophilic or nitrophilic lichen communities (Spier et al. Reference Spier, Dobben and Dort2010).
Páramos are ecosystems that are vital for water supply to urban areas but are currently threatened, endangered by the harmful effects of anthropogenic intervention and global warming (Luteyn Reference Luteyn1999; Hofstede et al. Reference Hofstede, Coppus, Mena, Segarra, Wolf and Sevink2002; Crespo et al. Reference Crespo, Celleri and Buytaert2010). Hence, the use of lichens as bioindicators of páramo conservation status could be extremely valuable in human impact assessment of these ecosystems. In addition, the current proliferation of mining in Colombia threatens the persistence of páramos (Hofstede et al. Reference Hofstede, Coppus, Mena, Segarra, Wolf and Sevink2002). In the present work, the study area was selected around a mining zone but the current contaminant source is natural. Measuring the effect of natural SO2 pollution on lichen species diversity and composition provides important baseline data and gives an insight into the ecology of lichens in an extreme environment with a daily night-frost páramo climate combined with extreme high daytime temperatures and atmospheric pollution produced by volcanic thermal vents. The aim of the study was to evaluate the spatial effect of SO2 pollution on the species diversity, richness and distribution of corticolous lichens in a páramo area at the ‘El Vinagre’ mine (Puracé, Cauca, Colombia).
Materials and Methods
Study area
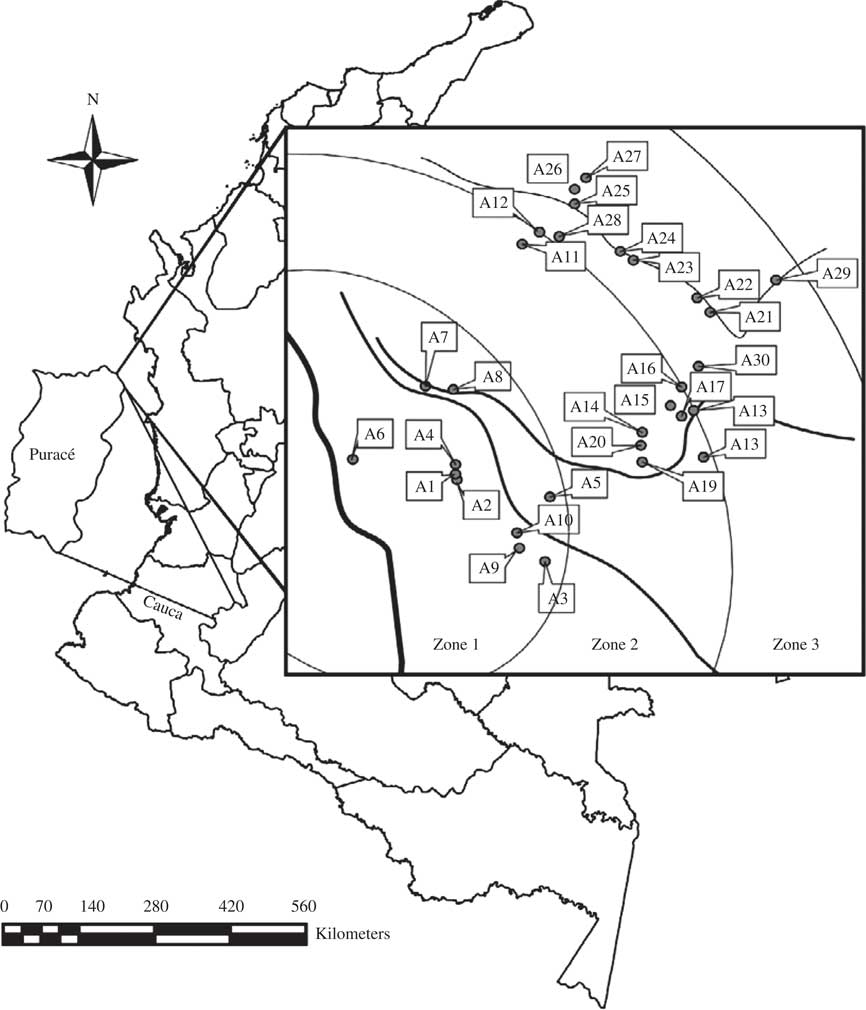
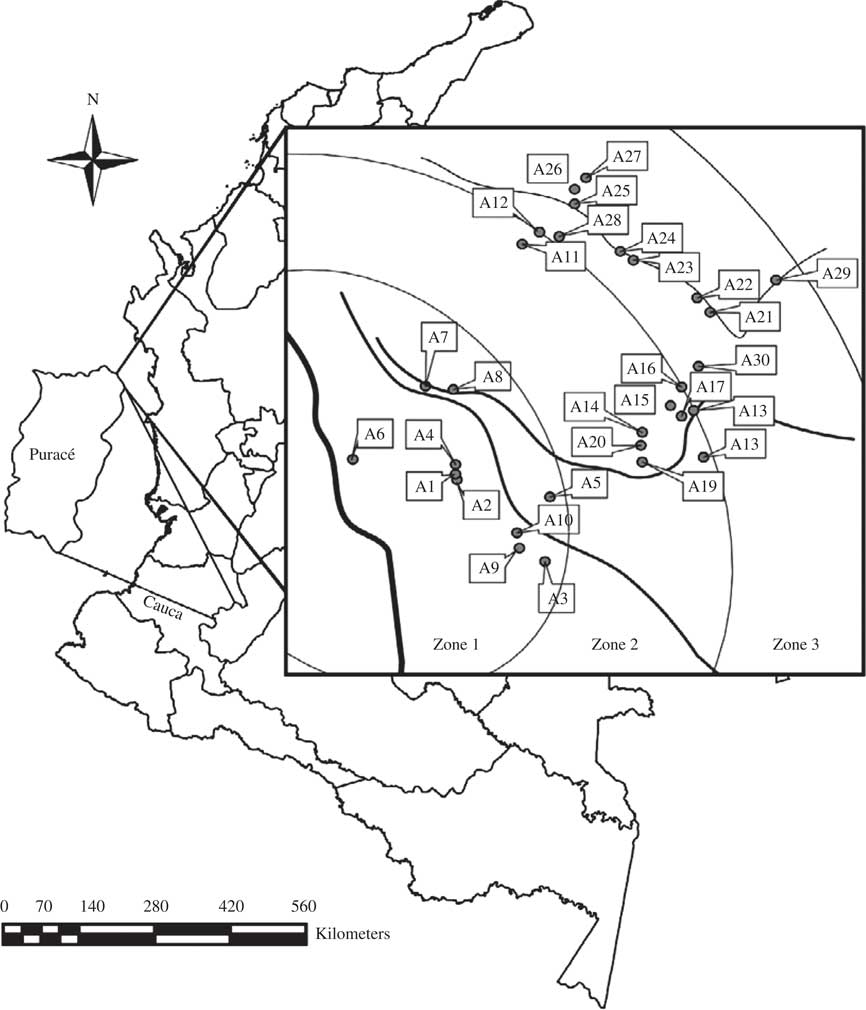
Puracé Volcano is part of the volcanic chain ‘Los Coconucos’, situated in the Cordillera Central, and is located in the Puracé National Natural Park close to the town of Puracé, 44 km from Popayán. The area includes a thermal volcanic spring, ‘La Mina’, and a nearby sulphur mine, ‘El Vinagre’, at the coordinates 02º21·45'N and 76º24·82'W (Fig. 1). The mean altitude of the area is 3600 m and the temperature ranges between 12 °C and −2 °C, which corresponds to a subalpine páramo in accordance with the life zone system proposed by Holdridge (Monasterio Reference Monasterio1980). We delimited the study site beside an area surrounding a river where several thermal springs converge, generating high acidity levels in the air.
Map of study area showing the distribution of the sampled trees within each of three zones at different distances from a sulphur mine, the pollution source.
Sampling
We sampled 30 trees of Weinmannia microphylla Kunth (Cunoniaceae), located at different distances from the pollutant-emitting source. Only trees with a diameter at breast height (DBH) over 6 cm were considered. Three sampling zones were established forming concentric ellipses around the pollutant source, following the geography of the area, at the following distances (Fig. 1): 0–125 m (zone 1), 125–225 m (zone 2), and 225–350 m (zone 3). Actual sample areas in these zones were patchy due to rivers, roads and polluted soils that supported no trees for sampling.
Samples of all corticolous lichens on the trees selected were collected in a vertical transect between 50 and 200 cm above ground. The transects were placed on the side of the tree with the highest lichen cover. Each lichen thallus was assessed by measuring the portion of the transect covered by it, to establish relative lichen coverage per sample. Portions of the observed thalli were removed from the trees using a knife and placed in paper bags for subsequent identification and curation. The following parameters were measured or estimated: bark pH (measured in a suspension of 1 g bark in 40 ml of distilled water using an Orion 3-Star benchtop Thermo pH meter; Soto Medina et al. Reference Soto Medina, Lücking and Bolaños2012), DBH and distance from sulphur source. Bark pH was used as a proxy for atmospheric sulphur levels.
Data analysis
We determined alpha diversity by assessing lichen species richness and a quantitative diversity measure, the Shannon index, per phorophyte sample. Beta diversity (species turnover between trees) was measured using the complement of Sørensen’s similarity index (McCune et al. Reference McCune, Grace and Urban2002). We performed Kruskal-Wallis and Mann-Whitney pairwise comparisons (Bonferroni corrected) to compare distance from source, bark pH, lichen morphotype coverage, lichen species richness, beta diversity, and Shannon diversity between areas. For post-hoc comparisons, we evaluated assumptions of normality and homogeneity of variances, employing Levene’s or Bartlett’s test for each variable studied. In addition, we classified all lichen species into four morphotypes (crustose, foliose, fruticose, or dimorphic) and computed Spearman rank correlations between distance from source, bark pH, lichen morphotype coverage, lichen species richness, and Shannon index, and NMS axes (see below). To further investigate the effect of distance from the pollution source on lichen species composition, we employed non-metric multidimensional scaling (NMS) with the Sørensen index, to find associations between samples (phorophytes) based on lichen species composition. The analysis was performed with 100 replicates, with a stability criterion of 0·00001 and 50 iterations per replicate (McCune et al. Reference McCune, Grace and Urban2002). The selection of the number of dimensions was based on the stress for each solution; we chose the number of dimensions at which the observed stress was significantly different from solutions for randomized data. We performed a linear Spearman rank correlation analysis between the scores on the first two NMS axes and the parameters measured for each phorophyte, to determine the degree of correlation between the structure in the NMS diagram and these variables. We also performed indicator species analysis (Monte Carlo simulation) to detect lichen species specific to each designated sampling zone (McCune et al. Reference McCune, Grace and Urban2002). Statistical analyses were performed with STATISTICA® 7.0 (StatSoft 2004), PAST® 4.0 (Hammer et al. Reference Hammer, Harper and Ryan2001) and PC-ORD® 5.0 (McCune & Mefford Reference McCune and Mefford2006).
We estimated the index of atmospheric purity (IAP), which establishes air quality using the coverage, frequency, and diversity of lichen species. Two different methods were used for this test: the traditional method (IAP) proposed by LeBlanc et al. (Reference LeBlanc, Rao and Corneau1972), and the modified Swiss method (IAP(f) proposed by Kricke & Loppi (Reference Kricke and Loppi2002)). We also calculated the Environmental Rating Factor or FCA (Fator de Classificação Ambiental in Portuguese) which was proposed by Käffer et al. (2011) to complement the IAP; it takes into consideration thallus morphology to reduce noise, higher importance to fruticose forms.
Results
Species diversity and distribution patterns
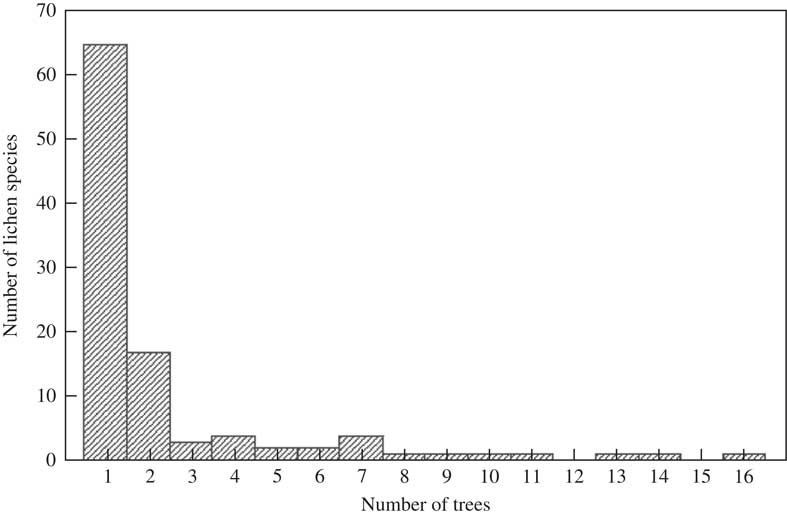
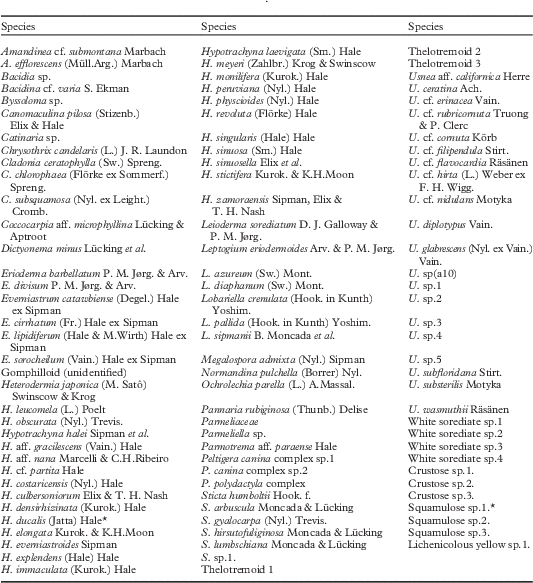
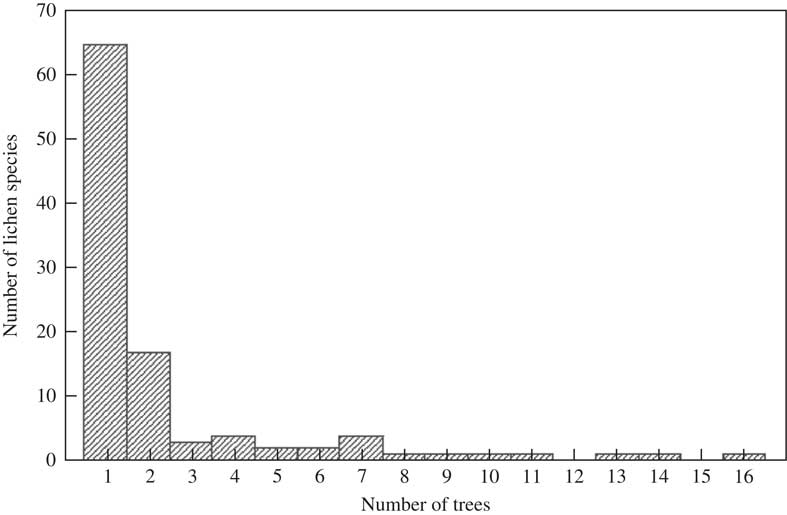
A total of 104 lichen species were found on the 30 phorophytes sampled in the three zones (Table 1), of which 72 were identified to species (three to species complex), 17 to genus, four to family, and 11 that were not identified because of the absence of reproductive structures or due to unresolved taxonomy. The four trees with the highest alpha diversity had between 13 and 15 species, followed by another four with 11–13 species, and seven trees which harboured 9–11 lichen species. The vast majority of the species were rare (63%), and 65 lichen species were found on a single phorophyte only (Fig. 2). Ochrolechia parella (L.) A. Massal. was the most frequent species in the sampling units (15 trees), followed by the sorediate sp. 1 morphospecies (14 phorophytes) and the sorediate sp. 3 morphospecies.
The number of lichen species that were found on only 1, 2, 3, etc trees in the survey area.
Epiphytic lichens recorded on Weinmannia microphylla in the study area

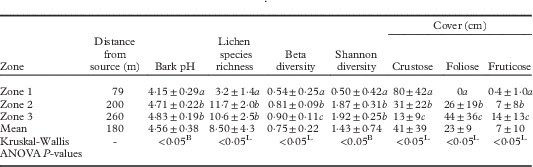
Zone 1 showed a significantly lower average species richness and Shannon diversity than the other two zones (Table 2). Zones 2 and 3 had similar species richness and Shannon diversity (Tukey: P>0·05).
Mean values for distance from source, bark pH, lichen species richness, beta diversity, Shannon diversity, and morphotype cover values per zone (values are means±1SD), and differences per zone as measured by Kruskal-Wallis ANOVA
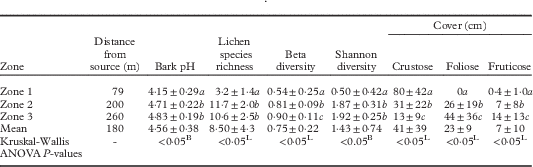
Values in each column with the same letter are not significantly different at the P=0·05 level; BNormal distribution and Bartlett’s test; LNon-normal distribution and Levene`s test; n=10 for each zone
Regarding beta diversity, we found that 61% of comparisons per sample pair were >0·6, indicating a high level of sample heterogeneity and a substantial contribution of beta diversity to total diversity. When comparing zones, average beta diversity (1–Sørensen index) progressively increased in the order 1 < 2 < 3 (Table 2). Thus, the trees in zone 1 tended to have more similar lichen communities with higher variance, while zones 2 and 3 tended to have a higher average turnover among lichen species between trees but lower variance within each zone.
Distance, bark pH and lichen diversity and coverage
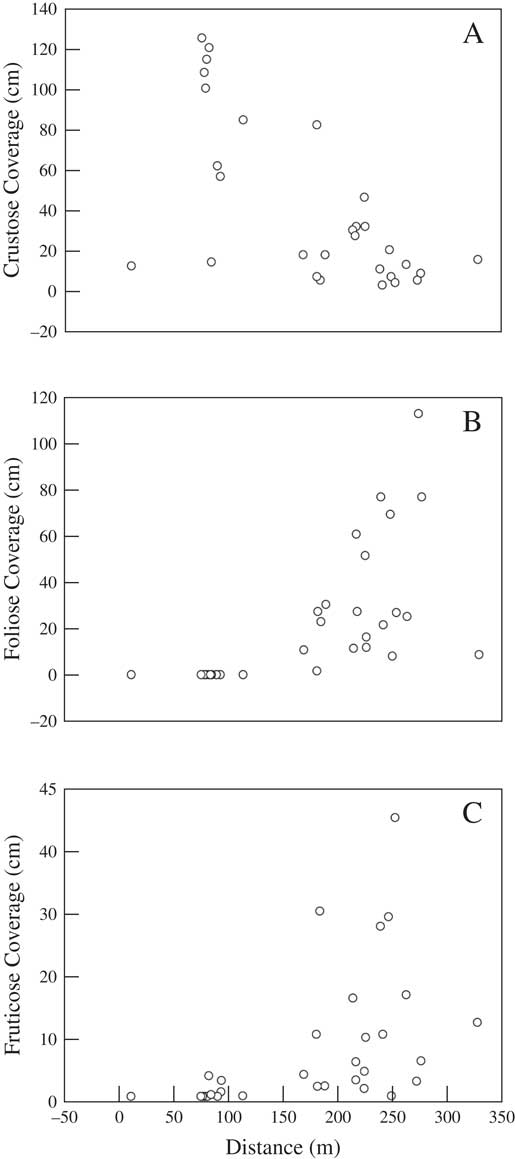
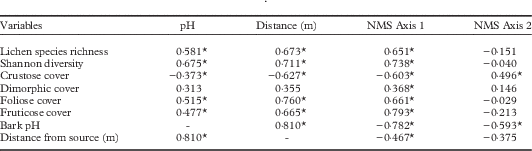
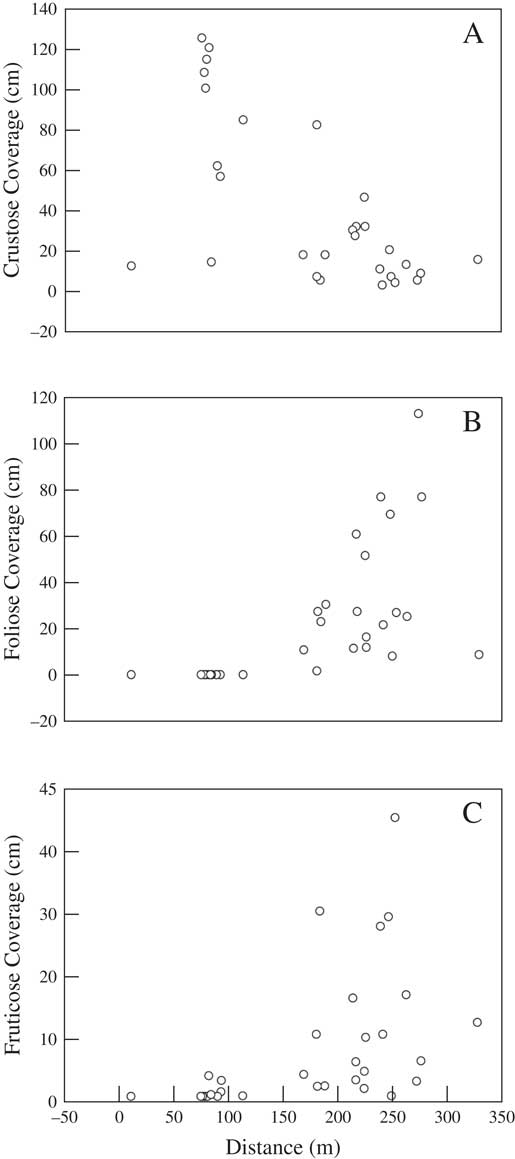
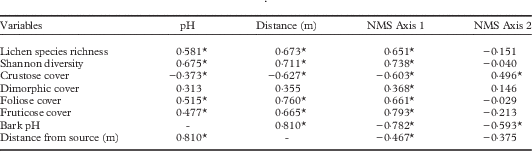
Bark pH was positively correlated with distance to the contamination source (Table 3), which allowed us to use it as a proxy for atmospheric sulphur levels. The results of the Spearman correlation analysis showed that the variables diversity and species richness were positively related to pH and distance from the sulphur source (Table 3). These results reflected primarily the strong difference between zone 1 and zones 2 and 3. For coverage by morphotype, significant correlations were also found (with the exception of dimorphic lichens): the coverage of crustose lichens was negatively correlated with pH and distance, while the coverage of foliose and fructicose lichens was positively correlated (Tables 2 & 3). This correlation is shown in the coverage pattern for each type of thallus per zone, where foliose and fruticose coverage tended to increase from zone 1 through zone 3, while crustose coverage presented an opposite pattern (Fig. 3). Again, differences were strongest between zone 1 and zones 2 and 3.
Relationships between distance from pollution source and cover of (A) crustose, (B) foliose and (C) fruticose lichens on trunks of Weinmannia microphylla sampled in the study area.
Summary of pairwise Spearman’s correlation coefficients between lichen species richness, Shannon diversity, lichen morphotype cover values, bark pH, distance from the source, and NMS axes
* significant correlations, P<0·05
NMS and indicator species analysis
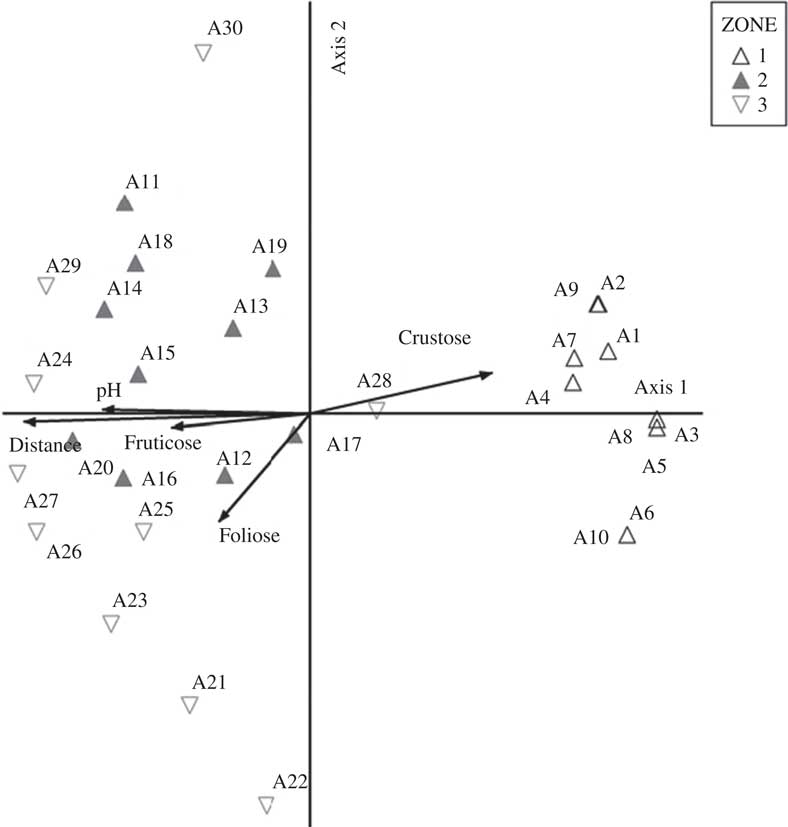
The three-dimensional solution for the non-metric multidimensional scaling (NMS; stress=0·145, instability=0·0646) accounted for 62·4% (axis 1=36·7%, axis 2=19·8%, axis 3=12·1%) of the variation among the data. The ordination plot showed a sample grouping pattern relative to the distance from the pollutant source (Fig. 4), with the three areas clearly distinguished. Trees in zone 1 grouped very closely and were separated from the other zones along axis 1. Trees of zone 2 also clustered together, but with more distance between each other compared to zone 1, and were partially separated from those of zone 3 along axis 2. Zone 3 trees presented an even wider separation between phorophytes within that zone. These clustering patterns correspond to those found for the variation of alpha and beta diversity by zone (Table 2).
Two-dimensional NMS ordination plot for the studied tree samples, displaying significant correlations of measured parameters with lichen species composition.
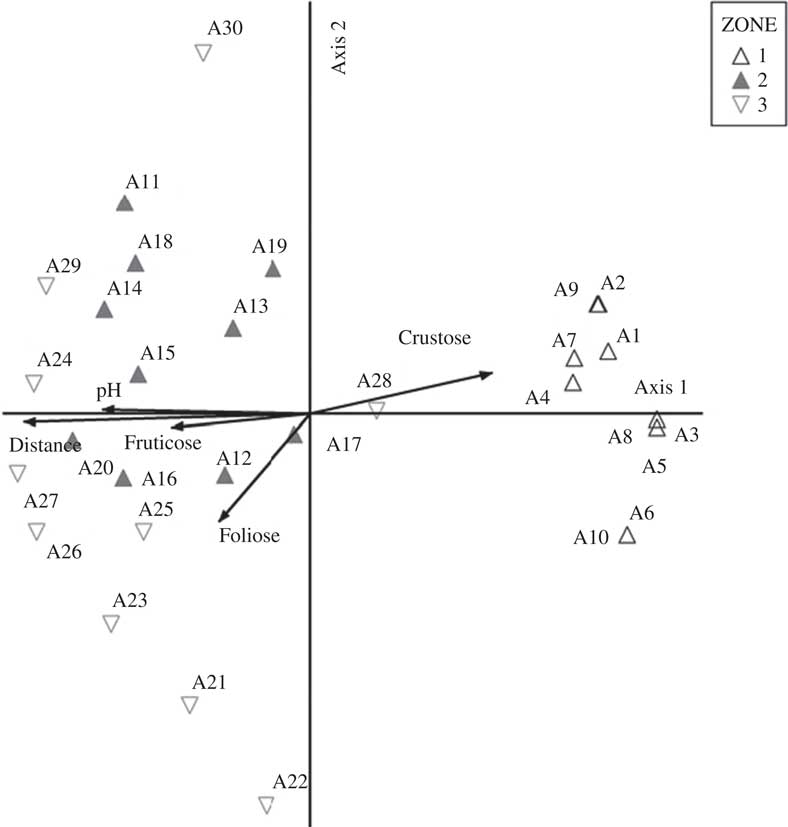
Morphology showed finer distinctions between trees by zones. The crustose morphotype was negatively correlated with distance, showing a clear relationship with zones. Fruticose and foliose morphotypes were correlated with distance but were related primarily to the difference between zone 1 trees and those of zones 2 and 3 combined (Tables 2 & 3). Zone 2 showed slightly lower coverage of these two morphotypes, compared to zone 3 (Table 2).
Bark pH and distance from the pollutant source (Table 3) were correlated with groupings along the first dimension (axis 1) of the NMS plot (Fig. 4). Bark pH tended to be lower in zone 1 and higher in zones 2 and 3. Distance was also negatively related to axis 1. Significant correlations between bark pH and distance from the pollutant source suggests a sulphur gradient along the sampled zones, with zone 1 most influenced by current pollution, and zones 2 and 3 much less impacted. Lichen community differences between zones 2 and 3 were expressed mostly along axis 2, which was correlated with bark pH (although less than axis 1) but not with distance from pollution source (Table 3).
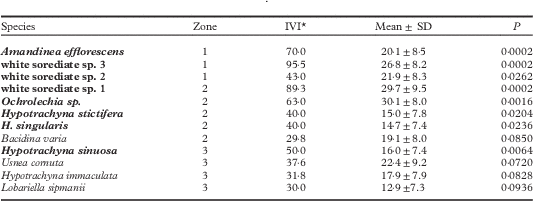
Species indicator analysis revealed that Amandinea efflorescens, white sorediate sp. 2 and white sorediate sp. 3 showed a preference for zone 1; Hypotrachyna singularis, H. stictifera, Ochrolechia parella and white sorediate sp. 1 for zone 2; and Hypotrachyna immaculata, H. sinuosa and Usnea cornuta for zone 3. Two species were also found with marginal preferences (0·05>P>0·1): Bacidina varia (zone 2) and Lobariella sipmanii (zone 3) (Table 4).
Lichen indicator species analysis per zone, arranged by zone and increasing P-value. Species with P<0·05 are highlighted in bold; species with P>0·05 and <0·10 are also listed
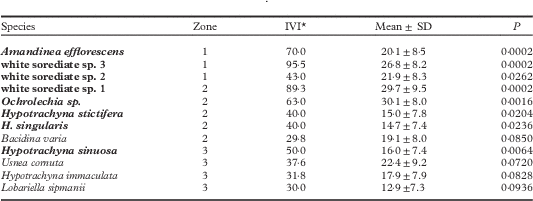
* Importance Value Index
IAP and FCA
Traditional IAP analysis suggested zones 2 and 3 were largely devoid of any effect of sulphur pollution, with values of 386·9 and 462·5, respectively. Zone 1 was classified as a transition zone with a value of 44·5. These ranges follow LeBlanc et al. (Reference LeBlanc, Rao and Corneau1972) for a well-studied area, but that research recommends the use of established scales based on previous studies on the same area to set values that fit with the area conditions, which was not possible here. The modified IAP(f) results using the Swiss method categorized zone 3 as an unaffected area with a value of 76, zone 2 as normal with a value of 70, and zone 1 as lichen-poor with a value of 14.
FCA values were 8·9 for zone 1, 104·5 for zone 2 and 148·1 for zone 3, which classifies zones 2 and 3 as unaffected and zone 1 as poor in lichens. The variation in the magnitude of the values is significant, but is proportional to the change in scale with respect to that used by LeBlanc et al. (Reference LeBlanc, Rao and Corneau1972).
Discussion
The results suggest that cover and diversity of lichens are strongly affected by the low substratum pH produced by natural sulphur fumes (James et al. Reference James, Hawksworth and Rose1977; Scott et al. Reference Scott, Hutchinson and Feth1989; Spier et al. Reference Spier, Dobben and Dort2010). That this effect decreases markedly with increasing distance from the source may be due to sulphur gases being shielded by trees closer to the source (Castillo et al. Reference Castillo, Valdes, Sibaja, Vega, Alfaro, Morales, Esquivel, Barrantes, Black and Lean2011). Our results indicate that this effect operates over very short distances.
The high correlation between bark pH and distance from the sulphur source suggests that atmospheric sulphur deposited on tree bark might lower the pH of the lichen cortex in areas close to the sulphur source (Rice et al. Reference Rice, Pye, Boldi, O’Loughlin, Tourangeau and Gordon1978). This was often apparent as a blackish ash-like layer on the bark surface and was more noticeable in areas close to the sulphur source. Natural sulphur pollution due to thermal volcanic vents caused a decrease in the cover, diversity and species richness of lichens in the studied areas surrounding the source of the contamination. The low presence or even absence of lichen species in zone 1 suggests high levels of contamination (Brodo Reference Brodo1966; De Sloover & LeBlanc Reference De Sloover and LeBlanc1968; LeBlanc et al. Reference LeBlanc, Rao and Corneau1972; Wetmore Reference Wetmore1981; Bretschneider & Marcano Reference Bretschneider and Marcano1995; Hawksworth et al. Reference Hawksworth, Iturriaga and Crespo2005). Sulphur is a pollutant that easily enters the lichen thallus, which may affect photosynthesis, reducing lichen growth or leading to death, an effect further increased by higher substratum acidity which accompanies sulphur deposition (Gilbert Reference Gilbert1970; Moser et al. Reference Moser, Swafford and Nash1983; Harris et al. Reference Harris, Mack and Ku1987; Scott et al. Reference Scott, Hutchinson and Feth1989; Loppi Reference Loppi1996; Alvárez-Castro & Pridybailo-Chekan 2010). Also, in areas affected by sulphur emissions, lichen spores will have a low probability of germinating, favouring a few sulphur-tolerant species (Gilbert Reference Gilbert1970; James et al. Reference James, Hawksworth and Rose1977; Moser et al. Reference Moser, Swafford and Nash1983). Thus, in the vicinity of the pollutant source, acidophilic and sulphur-tolerant species predominate, while in more distant, less affected or unaffected areas, relatively high lichen diversity can develop (James et al. Reference James, Hawksworth and Rose1977; Lewis-Smith Reference Lewis-Smith1984, Reference Lewis-Smith2005; Scott et al. Reference Scott, Hutchinson and Feth1989; Grishin et al. Reference Grishin, Del Moral, Krestovm and Verkholat1996; Álvarez-Castro & Pridybailo-Chekan Reference Álvarez-Castro and Pridybailo-Chekan2010; Spier et al. Reference Spier, Dobben and Dort2010). In the present case, a marked transition was found between zones 1 and 2 but not between zones 2 and 3, suggesting that the border between zones 1 and 2 marks the extent of direct contamination from the source. It was also found that high levels of pollution tend to homogenize the lichen species composition between phorophytes, reducing the community to fewer, more tolerant species that then appear on a higher number of phorophytes.
Crustose lichens dominated in zone 1, while in zones 2 and 3 foliose and fruticose species prevailed. Accordingly, crustose lichen coverage diminished with increased pH, whereas foliose, dimorphic and fruticose lichen coverage increased. This is consistent with the idea that crustose lichens are more tolerant to pollution, while fruticose, foliose and dimorphic forms are highly sensitive (De Sloover & LeBlanc Reference De Sloover and LeBlanc1968; Sugiyama et al. Reference Sugiyama, Kurokawa and Okada1976; James et al. Reference James, Hawksworth and Rose1977; Wetmore Reference Wetmore1981; Scott et al. Reference Scott, Hutchinson and Feth1989; Saipunkaew et al. Reference Saipunkaew, Wolseley, Chimonides and Boonpragob2004; Hawksworth et al. Reference Hawksworth, Iturriaga and Crespo2005; Hauck et al. Reference Hauck, Jürgens, Brinkmann and Herminghaus2008; Spier et al. Reference Spier, Dobben and Dort2010). However, crustose forms did not entirely disappear further from the pollution source. Instead we observed a species turnover, with crustose forms in distant areas representing mostly thelotremoid Graphidaceae, a group known for its sensitivity to disturbance (Rivas-Plata et al. Reference Rivas-Plata, Lücking and Lumbsch2008). Thus, pollution levels help to shape lichen species community composition, favouring crustose species which under natural conditions would not be able to compete well with other, mostly foliose and fruticose lichens characteristic of páramo vegetation (Sipman Reference Sipman1989, Reference Sipman2002, Reference Sipman2011). Apparently, Amandinea efflorescens is more tolerant to pollution; other species of this genus have been reported as acidophilic and pollution-tolerant (Loppi et al. Reference Loppi, Ivanov and Boccardi2002). In contrast, Usnea species have been listed as sensitive to contamination (De Sloover & LeBlanc Reference De Sloover and LeBlanc1968; Eversman Reference Eversman1978; Wetmore Reference Wetmore1981). Lobariella sipmanii presented a marginal preference for zone 3, and many species of Lobariaceae have been listed as sensitive to pollution (Hawksworth et al. Reference Hawksworth, Iturriaga and Crespo2005; Hauck et al. Reference Hauck, Jürgens, Brinkmann and Herminghaus2008). It appears that the photosynthetic system of cyanobacteria, commonly found in Lobariaceae and other Peltigerales, is more susceptible to the acidifying effect of SO2 entering into the cytoplasm, potentially inhibiting ATPase (United States Forest Service). Hauck et al. (Reference Hauck, Jürgens, Brinkmann and Herminghaus2008) found a strong negative correlation between SO2 sensitivity and surface hydrophobicity in 50 lichen species tested: those with the lowest reported level of hydrophobicity and the highest SO2 sensitivity included species of Lobaria and Nephroma (Peltigerales), whereas most Parmeliaceae exhibited intermediate levels and species of Lecanora, with low SO2 sensitivity, ranged in the upper level of surface hydrophobicity.
The data showed a strong separation between zone 1 and the other zones in terms of lichen diversity and indices based on pollution indicator species, with zones 2 and 3 quite similar (even using the FCA). However, coverage based on morphology or lichen species composition suggests that zones 2 and 3 are at least slightly different from each other, although both zones had almost identical pH values on average. These differences between zones 2 and 3 are thus more difficult to explain ecologically. One reason could be that zone 2 was in the past affected by sulphur pollution which then receded and the zone has since been in the process of regeneration. The higher coverage of the crustose morphotype in zone 2 as compared with zone 3 would support this hypothesis. Normally, crustose morphotypes tend to be uncompetitive in páramo vegetation due to the abundance of macrolichens (Sipman Reference Sipman1989). Historically, before the new administration in the 1990s, El Vinagre mine was a major pollution source for the area, and the El Vinagre River along which zone 2 is located was almost dead due to high levels of pollution, with no control applied to pollution from the mine (Diego Velazco, pers. comm.). However, these conditions have changed, and now almost all pollution impact is from more limited, natural sources, and the area corresponding to zone 2 is returning to a state similar to that before it was affected. Zone 3 was probably not affected by the higher historical pollution, due to both distance from source and its situation above the sulphur mine, since pollutants such as CO2, H2S and NO2 are generally deposited near the source.
High overall beta diversity and the high proportion of rare species suggest a greater input of beta diversity to total diversity at the study site, compared to alpha diversity per tree. Part of this pattern is explained by the sampling technique, which only covers part of a tree and hence generates stochastic heterogeneity between samples (Cáceres et al. Reference Cáceres, Lücking and Rambold2007; Soto Medina et al. Reference Soto Medina, Lücking and Bolaños2012). However, we also found deterministic patterns correlated with distance from the source of pollution. Zone 1 had lower beta diversity, indicating a homogenizing effect of high pollution levels on species composition. This effect is related to the stochastic effect of the sampling technique, since low-diversity communities, such as those under the influence of pollution, tend to have a higher probability of a large portion of the community being present within a small sample, whereas for high-diversity communities (with low pollution levels), only a small fragment of the entire community is present within each sample (McCune et al. Reference McCune, Grace and Urban2002). The higher variance of beta diversity within zone 1 is probably a consequence of the low alpha diversity there; the presence or absence of one species on one tree has a greater effect on beta diversity values.
We thank Diego Velazco for permission and support for this research, as well as workers at the mine for assistance during sampling. The biology laboratories at Universidad del Valle are thanked for placing equipment at our disposal. Philip Silverstone and Ana Bolaños Rojas assisted in portions of this work. Parts of the taxonomic work for this study were supported by a grant from the National Science Foundation: Neotropical Epiphytic Microlichens – An Innovative Inventory of a Highly Diverse Yet Little Known Group of Symbiotic Organisms (DEB-0715660 to The Field Museum; PI R. Lücking). Bibiana Moncada from the Universidad Distrital Francisco José de Caldas helped with the identification of Lobariaceae.