1. INTRODUCTION
The gap between rural and urban educational performance is a consistent characteristic of countries and regions. In general, rural schooling presents lower levels of attainment, revealing situations of disadvantage in the countryside (Camarero and Oliva Reference Camarero and Oliva2019). However, studies in economic history have identified differences across countries. For example, Andersson and Berger (Reference Andersson and Berger2019), Mamadaliev et al. (Reference Mamadaliev, Svechnikova, Miku and Médico2019) and Vivier (Reference Vivier2008) show how, in the 18th and 19th centuries, Sweden, Prussia and France implemented rural educational systems that were successful in terms of enrolment and quality. Unlike these experiences, the performance of rural education in countries such as Spain and Italy was weak and backwards (Civera Cerecedo and Costa Reference Civera Cerecedo and Costa2018; Westberg and Cappelli Reference Westberg and Cappelli2019).
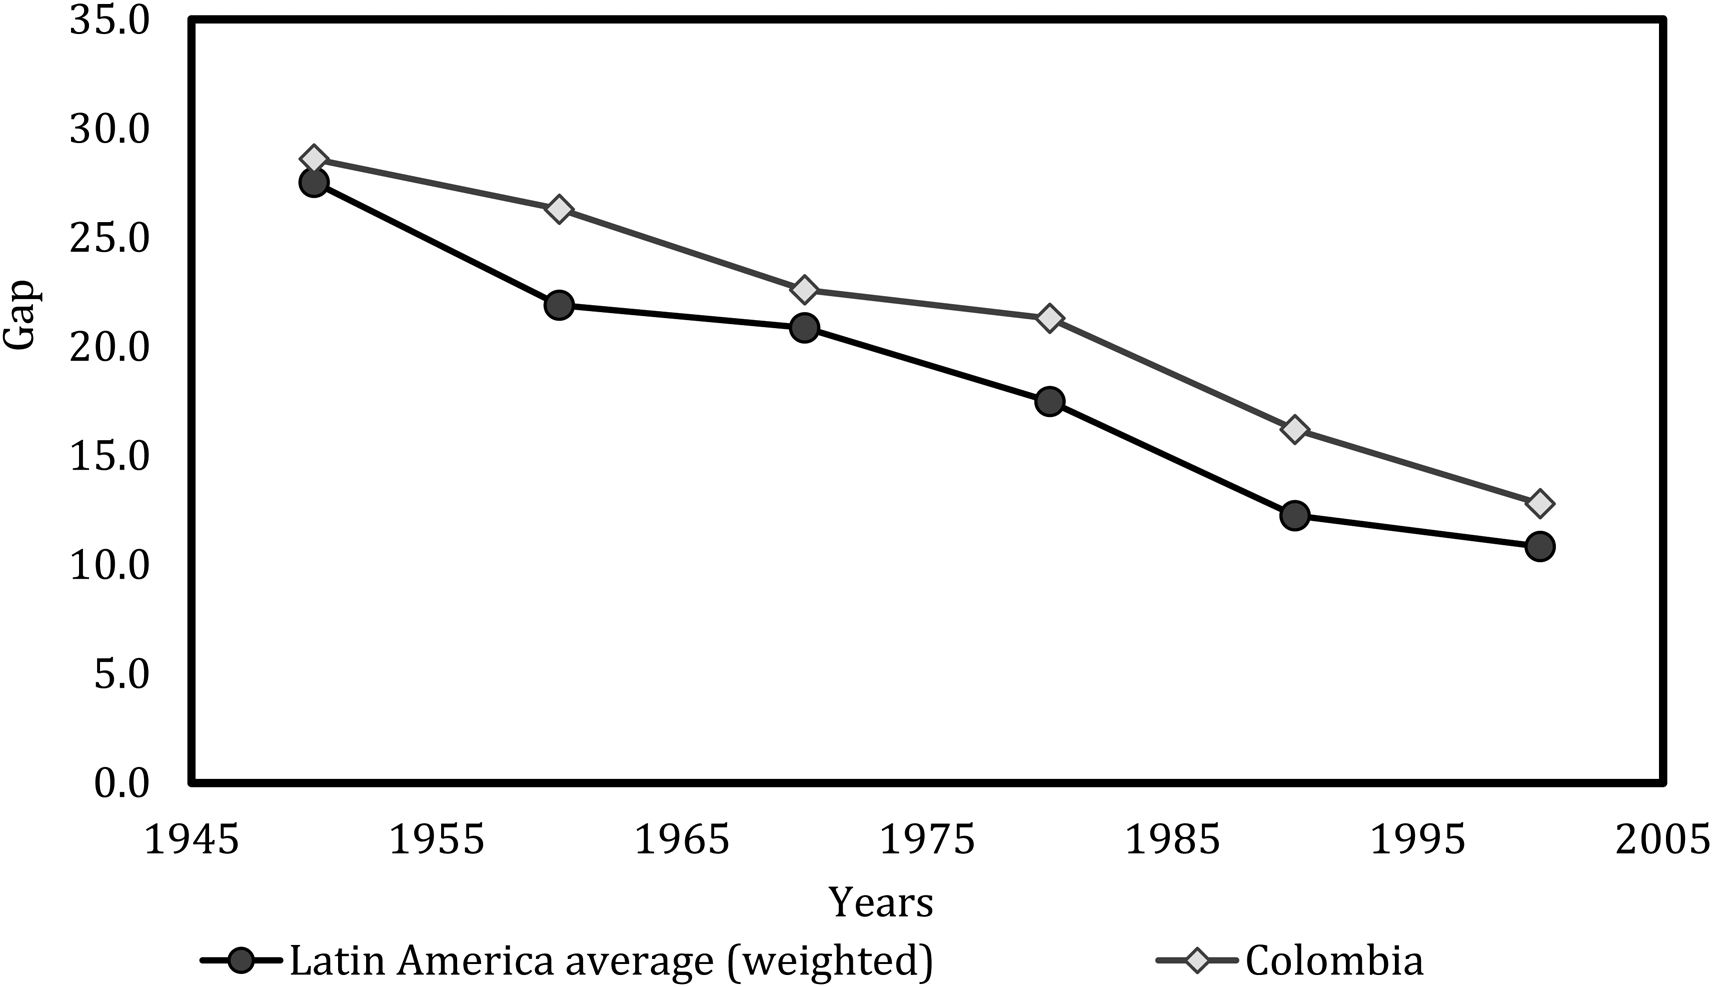
As for Latin America, inequalities in rural education also evolved unevenly across countries. While Argentina, Chile, Costa Rica and Uruguay showed early achievements, other countries consistently lagged far behind. Colombia is a typical example of this. Figure 1 shows how, relative to the Latin American average, Colombia persistently experienced wider differentials between rural and urban illiteracy rates. This also corresponds to lower indicators historically in primary coverage of rural areas and educational attainment in works by Padua (Reference Padua1979) and Wilkie et al. (Reference Wilkie, Alemán and Guadalupe Ortega2002). Why has Colombia developed these larger rural–urban gaps in education? Or better, why do some countries have persistently larger deficits in rural educational performance? In this paper, we analyse the long-term evolution of these larger rural–urban gaps in Colombia, arguing that the role of national governments is a source of these educational inequalities.
DIFFERENCE BETWEEN RURAL AND URBAN ILLITERACY RATES IN COLOMBIA AND THE LATIN AMERICAN AVERAGE.
Source: See text.

The literature usually explains this educational underperformance with reference to income levels, that is, a lower income tends to represent lower educational funding, supply and attainment. Bértola and Ocampo (Reference Bértola and Ocampo2013) indeed suggest that in Latin America, countries with higher GDPs had more resources including the supply of education, which may explain the achievements of Argentina or Uruguay as opposed to the precarious rural educational development of Colombia. Other factors contributing to lower rural performance are geographical isolation and elements of demand such as rural poverty, high opportunity costs or the failure of rural parents to educate their children (Cataño Reference Cataño1984; Ramírez and Salazar Reference Ramírez, Salazar, Meisel Roca and Ramírez2010; Baker et al. Reference Baker, Blanchette and Eriksson2020).
Nevertheless, these different explanations have more structural roots. Andersson and Berger (Reference Andersson and Berger2019), Lindert (Reference Lindert2010) and Engerman et al. (2002) claim that, rather than income levels, educational attainment is rooted in early decisions taken by societies, which may or may not promote education for the masses. Camarero and Oliva (Reference Camarero and Oliva2019) also question the geographical argument since the rural–urban gaps relate to socio-territorial constructions of inequalities in which rural citizens have fewer rights. Similarly, Cataño (Reference Cataño1984), Lindert (Reference Lindert2010) and Arroyo Abad (Reference Arroyo Abad2015) question the demand aspects since social groups in situations of disadvantage are not equal when it comes to shaping their educational preferences.
Rural–urban educational gaps are, therefore, a matter of structural inequalities. On this subject, extremely unequal societies early neglected strategies for universal schooling, such as redistributive tax support to finance basic education, consequently delaying mass schooling (Engerman et al. 2002; Lindert Reference Lindert2010)Footnote 1. Frankema (Reference Frankema2009), for instance, claims that in Latin America, countries that experienced intensive colonial involvement developed more unequal societies than countries where the influence of the colonial system was weaker. Once mass education took off, more equal societies prioritised policies for universal schooling. In contrast, extremely unequal societies neglected the importance of mass education, leading to their being positioned as «late movers» in developing schooling (Frankema Reference Frankema2009, p. 368).
This fact may have particularly affected educational outcomes in the rural areas of «late-mover» countries. Here, the limited supply of rural education matches the interests of certain powerful actors and elites, especially rural aristocracies, higher-income families and latifundistas (Lindert Reference Lindert2004; Frankema Reference Frankema2009; Wegenast Reference Wegenast2010). These elites have institutionalised oppressive structures that mainly affect the rural world (e.g. slavery, commodity-based production, latifundios). They do not prioritise schooling for rural areas because they fear that having more educated people will undermine their own interests (Galor et al. Reference Galor, Moav and Vollrath2009; Wegenast Reference Wegenast2010). As Lindert (Reference Lindert2004) suggested, the consequence is highly hierarchised rural societies with an elitist bias providing rural schooling.
Moreover, the elite may feed the elitist bias by, among other things, shaping or controlling those who run the country, that is, the national government, whose role has proved to be of great importance for mass education (Newland Reference Newland1994; Engerman et al. Reference Engerman, Mariscal, Sokoloff, Eltis, Lewis and Sokoloff2009; Teng Reference Teng2019; Cappelli Reference Cappelli2020). National governments decide policies, programmes and norms for educational funding, teachers, establishments and quality. More importantly, they bring out the political voice of the elites, which may be concerned either with providing or preventing education according to their interests (Helg Reference Helg2001; Lindert Reference Lindert2004).
In the more egalitarian Latin American countries, elites and national governments were early concerned with providing rural schooling on a mass basis. Delio Machado (Reference Delio Machado2014) and Naranjo Gutiérrez (Reference Naranjo Gutiérrez2001) show that in Uruguay and Costa Rica the 19th-century elites realised the importance of education in promoting agrarian competitiveness and economic growth; hence, the national government adopted policies oriented towards providing functional rural schools for the masses. In Argentina, from the mid-19th to early 20th centuries, the elites were also interested in modernising the agro-export sector and encouraging immigration, for which the national government was eager to invest in rural public education with stimuli for teachers and training focused on agrarian skills (Spalding Reference Spalding1972; Elis Reference Elis2011; Gutierrez Reference Gutierrez, Alfonseca-Guines, Civera and Escalante2011). Similarly, Ponce de León et al. (Reference Ponce De León, Rengifo, Serrano, Civera Cerecedo, Alfonseca-Gines de los Rios and Escalante Fernández2011) describe how the national government early prioritised schooling in Chile even in remote rural areas.
While national governments in these countries prioritised rural schooling policies, the literature suggests that more unequal nations failed to do so. These nations are characterised by the late, sporadic and ineffective efforts of national governments to develop rural education. However, despite the potential of national governments in shaping rural under-performance, it remains unclear what their role was in perpetuating such educational inequalities.
This paper examines this role with reference to the case of Colombia. As previously mentioned, the rural inhabitants of Colombia live in a state of extreme educational injustice. Social studies have examined the prevalence of poor education in rural areas (e.g. FES 1987; Helg Reference Helg2001; Triana Reference Triana2009). Similarly, works in economic history have studied the long-term development of schooling (Ramírez-Giraldo and Téllez-Corredor Reference Ramírez-Giraldo, Téllez-Corredor, Robinson and Urrutia2007; España-Eljaiek Reference España-Eljaiek, Mitch and Cappelli2019; Fuentes-Vásquez Reference Fuentes-Vásquez2019). However, although social studies do not provide a long-term perspective, the literature in economic history focuses neither on the rural sector nor on the role of national governments in perpetuating educational disparities. This paper, therefore, seeks to contribute to the debate by unpacking how national governments have helped delay rural schooling in contexts of severe inequality, thus producing or amplifying the rural–urban gaps in education.
Following Fuentes-Vásquez (Reference Fuentes-Vásquez2019), Kang et al. (Reference Kang, Paese and Felix2021) and Lindert (Reference Lindert2004), this research searches for traces of this role by conducting a long-term descriptive analysis. We identify the long-term patterns of rural–urban gaps by using a new historical dataset containing information on pupils, teachers and establishments from 1920 to 2019, disaggregated into national and subnational categories. No previous reconstruction of this dataset exists for such an extended period, this being another main contribution made to the literature by this paper. Finally, we complement the data analysis with a revision of qualitative sources providing evidence of national governments' actions regarding rural education and political economy.
The main results reveal that, despite the overall improvements in education in Colombia, the national government systematically implemented education in rural areas late and with deficiencies. In a context of severe inequality, the government delayed the provision of education to the rural parts of the country. Moreover, even when implemented, these rural educational initiatives proved deficient due to their lack of funding, lower quality, curricula detached from the rural context and a design that amplified regional disparities, thus producing and maintaining large and persistent educational inequalities in rural areas.
The paper is divided into five sections. Following this Introduction, section 2 describes the historical background of Colombian education. Section 3 explains the methodology and sources used in the research, while the main results are given in section 4. The conclusion is contained in section 5.
2. HISTORICAL BACKGROUND
Colombia is a middle-income country in which agriculture, specifically coffee exports, was the basis of the economy until the second half of the 20th century. Subsequently, socio-economic changes transformed Colombia from a rural into an urban society. For example, the population censuses show that agricultural activities accounted for 74 per cent of the labour force in 1938 but only 20.7 per cent in 1993. The censuses also show that while in 1938 70.9 per cent of Colombians lived in rural areas, by 2018 this figure was down to 20 per cent.
Although Colombia has had different forms of government, it is currently a unitary and decentralised republic divided geographically into five natural regions and organised administratively into departments, and smaller units called municipalities (see Map 1). Regarding the distribution of its population and economic activities, the country has long had a concentration of inhabitants in the departments of the Andina region, this being the location of its main urban and economic centres, including the capital Bogotá. Next, the departments in the Caribbean and Pacifica regions have lower concentrations of population and level of economic activities. Finally, the old National Territories are located in isolated regions such as Amazonía, Orinoquía and La Guajira, which are more rural, rich in natural resources, and with the lowest population densities (see online Appendix 1).
COLOMBIA.

Historically, Colombia belonged to the group of Latin American countries that were falling behind the continent's educational leaders. In 1900, Colombia had lower enrolment and literacy rates than Argentina, Costa Rica, Uruguay or Chile (Ramírez-Giraldo and Téllez-Corredor Reference Ramírez-Giraldo, Téllez-Corredor, Robinson and Urrutia2007; Lindert Reference Lindert2010). Aware of the country's backwardness, in 1903, the national government implemented Law 39, which enforced a Catholic and decentralised system of education that delegated the responsibility for primary mass schooling to subnational governments. This arrangement lasted for most of the mid-20th century, despite generating inequalities since only regions with a sufficient income could invest in schooling (Fuentes-Vásquez Reference Fuentes-Vásquez2019).
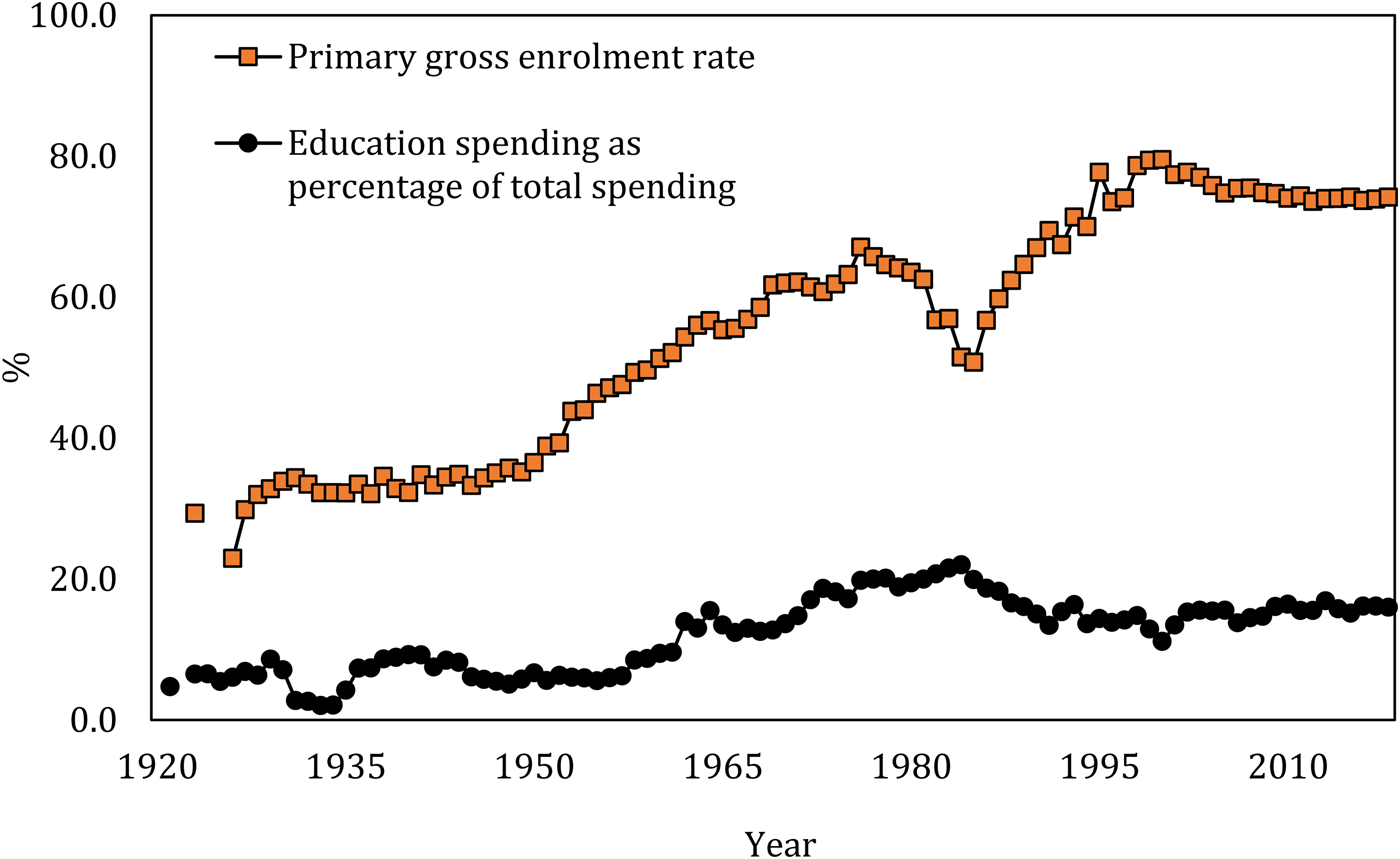
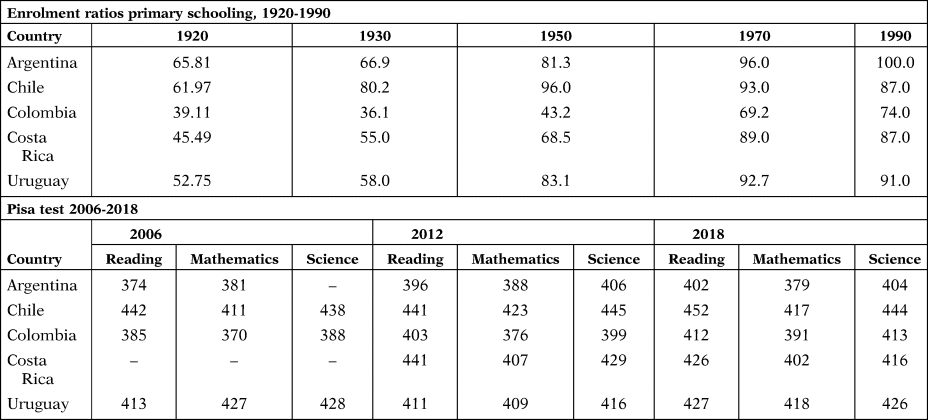
Between 1930 and 1946, the Liberals took power and prompted educational reforms to reduce the Catholic Church's influence and counter racial and gender exclusion from schooling. However, since these reforms were not accompanied by sufficient funding, the extent of mass schooling remained low (see Figure 2 and Ramírez-Giraldo and Téllez-Corredor Reference Ramírez-Giraldo, Téllez-Corredor, Robinson and Urrutia2007). In addition, an intense civil war between Liberals and Conservatives in the period called La Violencia (1947-1953) followed. Although La Violencia had diverse causes, the Conservatives claimed that the secular education introduced by the Liberals had caused disrespect for authority, thus encouraging more violence (Triana Reference Triana2009). Hence, once back in power between 1950 and 1958, the Conservatives carried out counter-reforms that introduced strict Catholic principles into education (Triana Reference Triana2009). Given these complex circumstances, the first half of the 20th century was a period of instability and a lack of priority for mass schooling, leading to the country's poor educational performance (see Table 1 and Newland Reference Newland1994).
EDUCATIONAL SPENDING AS A PERCENTAGE OF TOTAL NATIONAL SPENDING AND PRIMARY GERs 1920-2018.
Source: MEN, Ramírez and Tellez (2007) and World Bank.
Note: School population aged 7-14. Calculated enrolment rates are reasonably consistent with those in Ramírez-Giraldo and Téllez-Corredor (Reference Ramírez-Giraldo, Téllez-Corredor, Robinson and Urrutia2007).

ENROLMENT RATIOS IN PRIMARY SCHOOLING 1920-1990 AND PISA TEST RESULTS 2006-2018

Source: Enrolment ratios obtained from Lee and Lee (Reference Lee and Lee2016) in www.barrolee.com/. PISA data from: pisadataexplorer.oecd.org/ide/idepisa/dataset.aspx. Colombia has been assessed in PISA since 2006.
Note: Lee and Lee (Reference Lee and Lee2016) calculate enrolment ratios using country-specific primary-school-age populations.
Colombia nevertheless pursued the expansion of mass schooling in the second half of the 20th century (see Figure 2). This expansion coincided with the political period of the National Front (Frente Nacional) from 1958 to 1974. In education, the National Front implemented the government's obligation to invest at least 10 per cent of the national budget in education, thus increasing the resources for schooling. Other reforms included the nationalisation of spending on primary education, the launch of literacy programmes and international support (Arvone Reference Arvone1978).
The expansion nevertheless suffered a setback between the mid-1970s and 1980s. Figure 2 shows that the decline began in primary pupils after 1976 and in the budget by 1985Footnote 2. The lag in the budget is explained by the nationalisation of spending on primary education and the new regulation on teachers' salaries. These fiscal compromises kept the budget high until the impact of the 1980 crisis (Ramírez-Giraldo and Téllez-Corredor Reference Ramírez-Giraldo, Téllez-Corredor, Robinson and Urrutia2007)Footnote 3. Regarding the reasons for the setback, FES (1987) and Ramírez-Giraldo and Téllez-Corredor (Reference Ramírez-Giraldo, Téllez-Corredor, Robinson and Urrutia2007) argue that more than lower demand, the explanation lies in the supply factors, as the national government implemented fiscal adjustments that froze teaching positions and reduced the number of establishments.
Finally, by the 1990s and 2000s, structural transformations were having an impact on schooling in Colombia. First, the 1991 constitution declared education a constitutional right and decentralised it. Second, globalisation demanded greater training of the country's labour force. Third, the increasing internal violence generated forced displacements, undermining education access (DNP 1998). To face these challenges, the national government introduced different strategies. Decentralisation, for instance, resulted in fiscal indiscipline and inequality since the subnational entities, facing more significant costs, hoarded national funding without improving coverage or quality (MEN 2010). The practice of allocating resources by coverage goals then became the norm, thus forcing subnational governments to increase enrolment (MEN 2010). Other strategies included the new General Law of Education (Law 115 of 1994) and the Decennial Plans intended to improve the quality and training of the labour force (DNP 1991; MEN 1996; MEN 2010). Also, the national government tried to respond to the forced displacement by introducing greater flexibility and virtual instruction (MEN 2010). These strategies were insufficient. For instance, virtual instruction continues to be flawed, especially in public schools. Similarly, despite increases in school enrolments, Corvalán (Reference Corvalán2006) and Lindert (Reference Lindert2010) show that there is still much work to be done on quality. International educational tests prove that contemporary Colombia is performing behind countries such as Chile or Uruguay (see Table 1). That is, from the early 20th century into the 2000s, Colombia still lags behind Latin America's educational leaders, though this time in what Lindert (Reference Lindert2010) considers to be a more critical state of schooling disparities, that is, differences in quality.
3. METHODOLOGY AND SOURCES
We analyse the long-term evolution of Colombia's rural–urban educational gaps by constructing long-term series. The research focuses on the analysis of primary education since this approach captures the effectiveness of an educational system in providing basic instruction (UNESCO 2009).
The research involves collecting data on primary pupils, teachers and establishments from 1920 to 2019, disaggregated into rural, urban, national and subnational levels. The data were collected from the Memoirs of the Minister of Public Instruction to the National Congress (hereafter MMPI), and subsequently the Minister of Education (hereafter MMEN) from 1920 to 1951. Data were also taken from different sources of the National Administrative Department of Statistics (DANE). Specifically, we use DANE (1985), the General Statistical Yearbooks (1934-1966), the DANE Statistical Bulletin (1975-1976), Colombia Statistics Vol. II (1978-1987, municipal), Primary Education in Colombia 1967-1974 and the DANE Statistical Bulletin 444 (1988). From 1990 to 2019, we use the statistics available on the DANE website and DANE Statistical Bulletin 579 (1995-1999). The primary education category is collected as specified in the official sources of the Ministry of Education, which follow laws such as Law 39 of 1903, Decree 1487 of 1932, and Decree 1710 of 1963. Since this last decree, rural and urban primary education has been divided into five grades.
We also utilise Colombia's official population censuses to collect data on the population. The series begins in the 1920s since this date has the oldest memoir of education with sufficient information to disaggregate the data into urban and rural areas.
Regarding the subnational data, Colombia had different administrative arrangements during the analysed period. Before 1991, subnational entities were classified into departments, intendancies and comisarías (National Territories). Therefore, the data for these subnational units are collected as recorded in the different sources.
The database allows us to construct indicators of educational outputs and inputs (Vos Reference Vos1996). For example, we calculate the primary gross enrolment rates (GERs) for educational outputs, that is, the number of students enrolled in primary education divided by the population aged 7-14. We also present pupils' results in standardised tests and dropout and completion rates. These indicators shed light on the primary schooling system's needs, support, achievements and quality (Vos Reference Vos1996; Frankema Reference Frankema2009). Finally, to assess the means allocated to education, we use input markers such as pupil–teacher ratios, educational expenditure and schools per school-age population (Vos Reference Vos1996). More detailed information is contained in the section discussing our sources.
The analysis, therefore, contributes by filling the space left by other long-term studies that lack this level of assessment. The work of Ramírez-Giraldo and Téllez-Corredor (Reference Ramírez-Giraldo, Téllez-Corredor, Robinson and Urrutia2007) constructs long-term series for primary and secondary education during the 20th century and presents data on students, establishments and teachers. However, it does not disaggregate the rural level. Hence, we add supplementary information. Similarly, España-Eljaiek (Reference España-Eljaiek, Mitch and Cappelli2019) and Fuentes-Vasquez (Reference Fuentes-Vásquez2019) analyse regional disparities by constructing a series for students. However, their works focus on the period from 1905 to 1958 and lack any analysis of teachers or establishments.
Finally, the analysis is descriptive, with its aim being to identify the role of the national government in perpetuating the rural–urban gap in education by examining the patterns in the long-term series. Moreover, the analysis of the dataset is complemented by a rigorous review of official sources that offer qualitative evidence on the political economy of rural education. We use mainly the Memoirs of the Minister to the National Congress (1914-1973), the National Plans of Development from 1974 to 2018 and different plans of the Ministry of Education.
4. THE LONG PATH TO INEQUALITY
4.1. Rural–Urban Gaps in Colombian Education
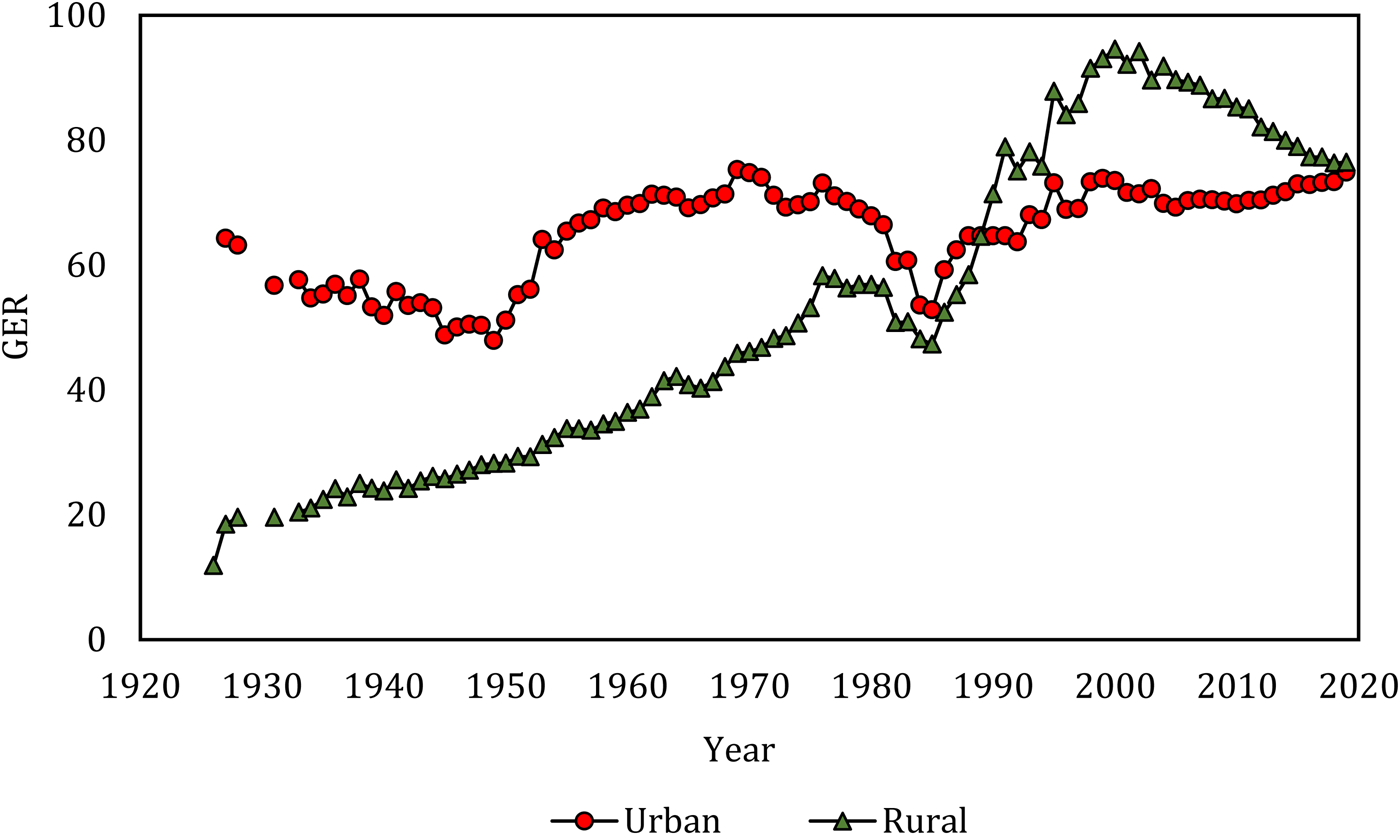
Figure 3 shows an initial approach to assessing Colombia's long-term evolution of rural and urban education. The figure shows the performance of the urban and rural GERs and indicates the backwardness of rural areas in Colombia until the 1990s. The rural indicator then experienced an expansion, overtaking the urban GERs until the 2000s when the rural and urban GERs started to convergeFootnote 4.
PRIMARY GERs 1926-2019.
Source: See text.

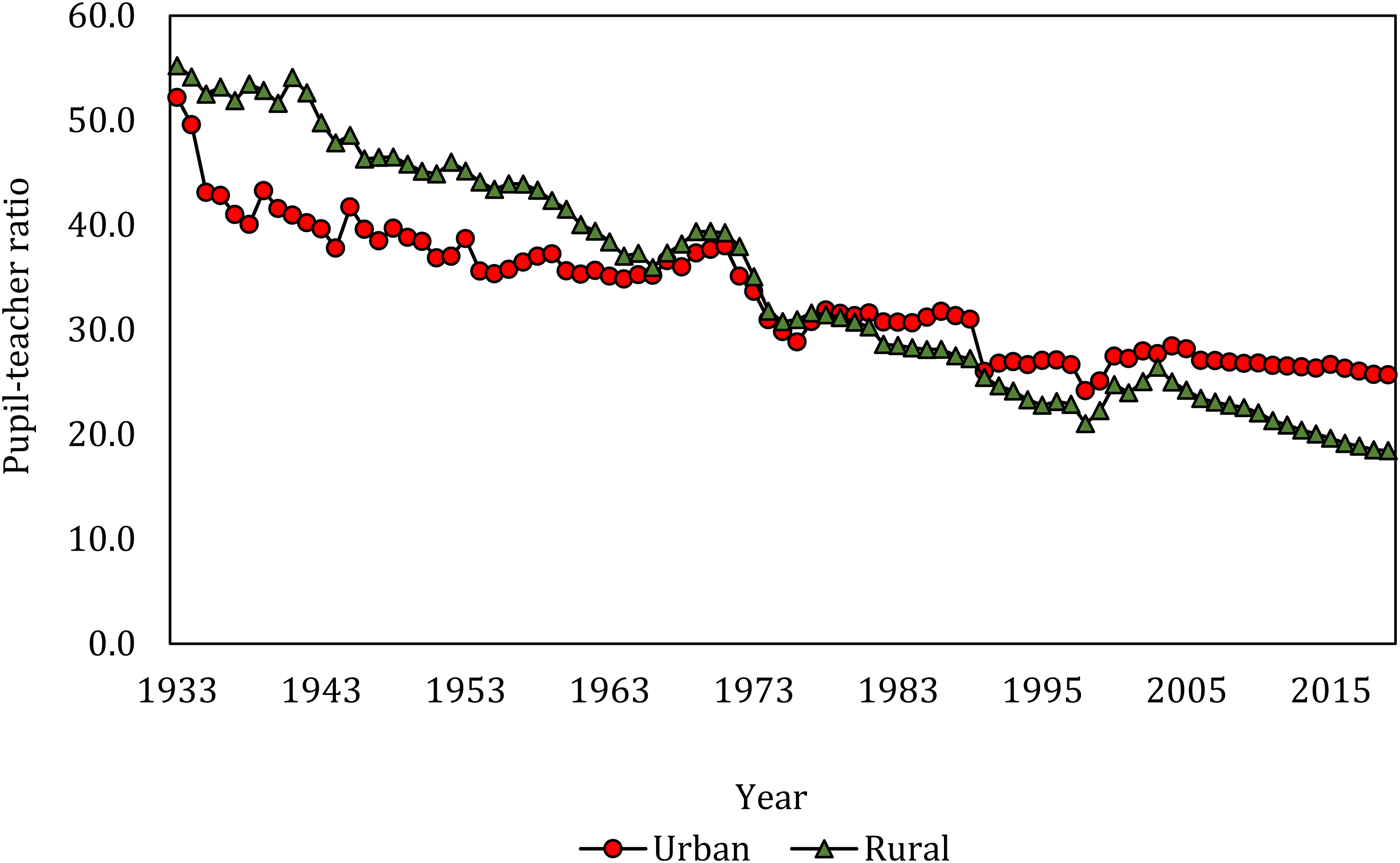
Figure 4 shows the urban and rural pupil–teacher ratios, which shed light on the provision of human resources: that is, fewer pupils per teacher suggest a greater supply of instructors relative to pupils, while more pupils per teacher indicate the opposite (Vos Reference Vos1996; UNESCO 2009; MEN 2013). Figure 4 shows that urban areas presented lower pupil–teacher ratios than urban areas until the late 1970s, after which the indicator changed to favour rural areas.
PUPIL–TEACHER RATIOS 1933-2019.
Source: See text.

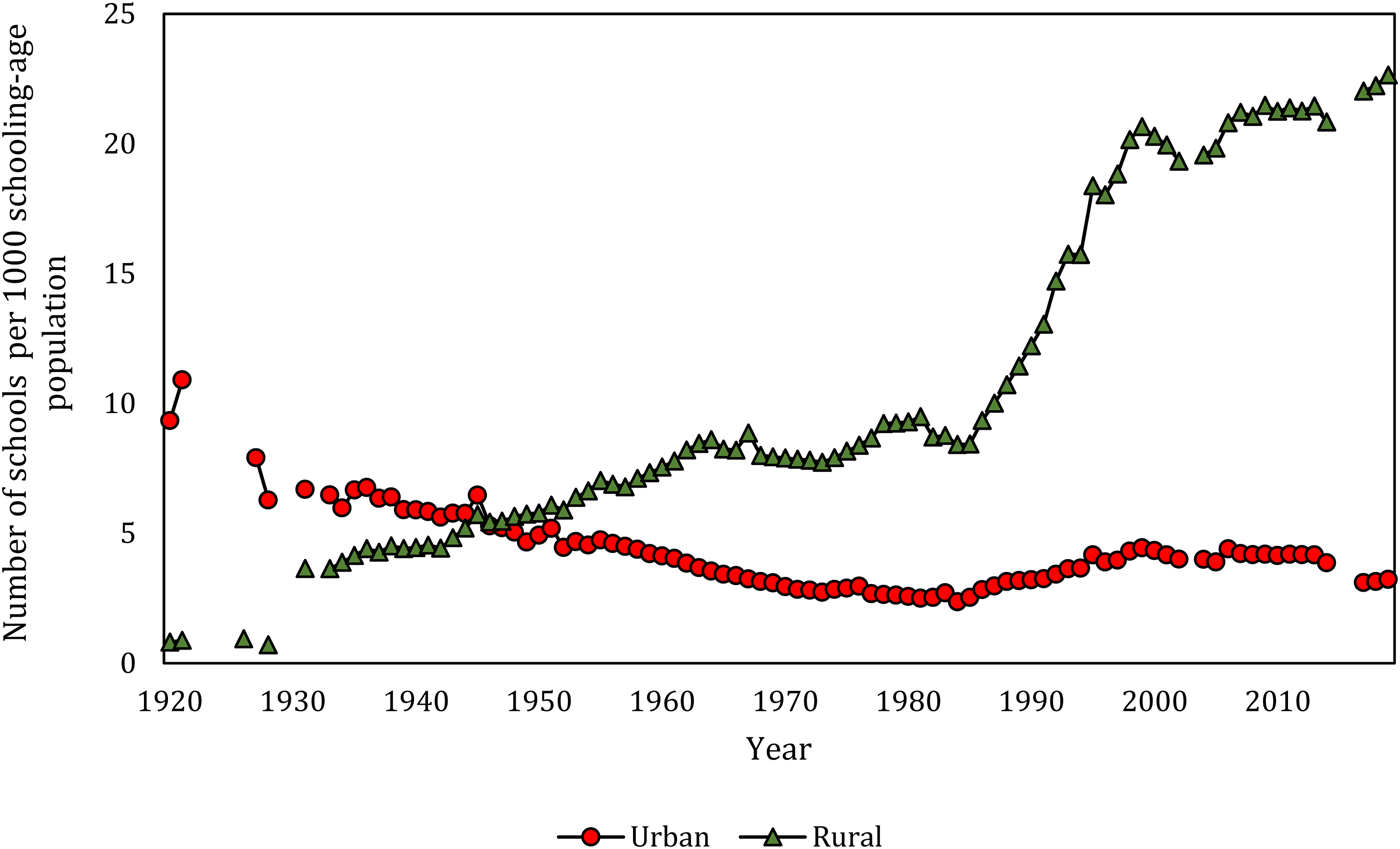
Similarly, Figure 5 shows the number of primary schools per 1,000 school-age population. The figure reveals the existence of rural–urban gaps, though, in contrast to pupil and teacher indicators, this rural–urban gap closed in the late 1940s. This early closing corresponds to the larger provision of establishments for the scattered rural population common in Latin American countries, as well as the special educational programmes after the mid-20th century that crowded pupils into the rural schoolsFootnote 5.
PRIMARY SCHOOLS PER 1,000 SCHOOLING-AGE POPULATION (7-14) 1920-2019.
Source: See text.

As for the long-term subnational performance, Figure 6 depicts the difference between the urban and rural GERs in Colombian departments. The results indicate a pattern of the initial backwardness of rural areas, followed by an expansion of rural education, particularly after the 1990s. Likewise, departments such as Caldas, Bolívar, Atlántico, Antioquia or Valle del Cauca show lower and early closure of the rural–urban gap, while La Guajira, Chocó, Meta and Caquetá (old National Territories) are more volatile and with larger urban–rural gaps.
DIFFERENCE BETWEEN RURAL AND URBAN GERs 1928-2019.
Source: See text.

Figures 3–6, therefore, show an initial backwardness in rural education, followed by an expansion in the rural educational system over time. Nonetheless, under closer inspection, Colombia continues to display persistent backwardness in rural education. In this regard, first, although Figures 3–6 show that rural parts of Colombia experienced educational expansion after the late 20th century, the rural disadvantage continued in what Lindert (Reference Lindert2010) calls more critical indicators such as poor quality, fiscal support, dropout and completion rates (see Corvalán Reference Corvalán2006, Figure 7 and online Appendix 2). Second, rural education in Colombia shows sharp regional disparities regarding performance at the subnational level. That is, the Andean departments experience a better rise and more progress, while departments in the old National Territories present a slower rise and development. Third, among the Latin American countries, Colombia is a special case of persistent and larger rural–urban educational gaps. Figure 1 already shows the country's backwardness in rural illiteracy rates. Equally, this backwardness is apparent in other aspects. For example, Padua (Reference Padua1979) shows that in the 1970s, 75 per cent of rural primary schools in Argentina, Costa Rica, Uruguay and Chile offered a complete cycle of primary schooling, while in Colombia, this percentage was 25 per cent. Wilkie et al. (Reference Wilkie, Alemán and Guadalupe Ortega2002) also show that in 1970, 38.4 per cent of Colombian adults in rural areas had no schooling, the equivalent being 29.8 per cent in Chile. Similarly, while in the 1990s, rural areas of Uruguay had 34.4 schools per 1,000 school-age population, the figure in Colombia was 18.
PRIMARY URBAN AND RURAL DROPOUT RATES BY GRADE 1943-1998.
Source: See text.
Note: Negative dropout rates indicate the greater capacity of the urban educational system to incorporate students after the economic crisis of 1999 (Baldión Waldrón et al. Reference Baldión Waldrón, Victor Vergara and García2000).

Why did Colombian rural education remain in this state of persistent backwardness? The lower rural performance is usually related to the poverty and apathy of rural inhabitants (Triana Reference Triana, Civera Cerecedo, Alfonseca-Gines de los Rios and Fernández2011). Rural pupils came from the poorest backgrounds, and their parents did not have enough resources or interests to cover their education costs (Cataño Reference Cataño1984). The educational reports, for example, mention how parents withdrew children from schools because of a lack of resources, the need to employ their offspring in agrarian tasks, or peasant indifference to schooling (Memorias 1914, p. 106; MMEN 1958, p. 69). These arguments nevertheless contrast with evidence of rural peasants demanding education for their children. The educational reports also note that the rural schools stimulated the interest of many peasants, leading to higher attendance rates and increased demand for schools (MMPI 1919, p. 15; 1924, p. 149).
The literature and the archival material also suggest that, more than poverty and apathy, the lower performance of rural areas relates to national policy decisions. For example, Corvalán (Reference Corvalán2006) and Gutiérrez de Pineda (Reference Gutiérrez de Pineda1958) discuss the national inefficiencies in organising and planning a contextualised rural education as reasons that delayed rural mass schooling. Similarly, the official sources state that rural educational backwardness relates to how the national government failed to provide «sufficient» and «timely» efforts for rural education (MMEN 1928, p. 284). This then leads us to consider the role of the national government.
The role of the national government is of great importance in ensuring mass education (Newland Reference Newland1994; Engerman et al. Reference Engerman, Mariscal, Sokoloff, Eltis, Lewis and Sokoloff2009; Teng Reference Teng2019; Cappelli Reference Cappelli2020). It seems to have been critical in the expansion of rural education in Colombia after the late 20th century. The expansion in rural GERs in Figure 3, for instance, coincides with the implementation of national policies such as the New School (1970s)Footnote 6 or rural programmes implemented after the 1990s to increase educational coverage in rural areasFootnote 7. Similarly, the expansion of rural teachers in Figure 4 corresponds with national efforts such as the introduction of a National Teacher Classification or Decree 707 of 1996, providing for additional benefits to rural teachers, such as private insurance, access to housing and monetary incentives, thus improving their status and salariesFootnote 8.
The role of national governments is, therefore, a source of educational progress; however, it might also be responsible for educational disparities, especially in highly hierarchised societies with an elitist bias in the provision of mass schooling (Lindert Reference Lindert2004 and Frankema Reference Frankema2009). In this regard, the next section, following Lindert (Reference Lindert2004), traces the ways in which this role might have produced and maintained the persistent backwardness of rural education in Colombia.
4.2. The Influence of the National Government in Rural Educational Inequalities
As a first point, the analysis identifies the late implementation of rural educational policies. That is, Colombia being an extremely unequal society, its national governments showed an elitist bias in providing rural schooling by delaying the introduction of educational policies for rural areas. The Organic Decree of 1870 and the General Law of Education of 1892 are among Colombia's earliest regulations on schoolingFootnote 9. Regarding rural education, these norms paid no special attention to the sector beyond the local governments' implicit decentralised responsibility for primary schooling in rural areas (see online Appendix 4 on the main regulations in rural schooling).
This fact contrasts with countries in which the interests of the elites and, therefore, the policies of national governments were aimed at the provision of mass schooling for rural areas at an early stage, with either a centralised or a decentralised form of organisation. In Costa Rica, for instance, Naranjo Gutiérrez (Reference Naranjo Gutiérrez2001) asserts that the elite adopted the values of progress fairly early. In turn, the national government translated this into the laws of education of 1886 with explicit rural educational policies. Similarly, legislation such as Law 1420 of 1884 in Argentina, Law 1350 of 1877 in Uruguay and the Law of Primary Instruction of 1860 in Chile explicitly drew up national regulations aimed at providing primary schooling for the inhabitants of the countryside.
Second, when implemented, rural educational policies proved to be deficient. At the turn of the century, Colombia introduced rural educational policies through Law 39 of 1903 and Regulatory Decree 491 of 1904. This regulation stipulated that rural education would last 3 years against the 6 years of urban schooling, could be conducted in «alternate» schoolsFootnote 10, and specified different primary curricula for urban and rural areasFootnote 11. These norms prevailed during the first half of the 20th century, apart from some attempts at reform. For example, some initiatives homogenised rural and urban instruction or introduced educational programmes in the form of ambulatory schools or scholar's gardens (Helg Reference Helg1980, Reference Helg2001)Footnote 12.
After the mid-20th century, the National Front governments (1958-1974) also introduced programmes of rural schooling, such as the Unitary Schools (Decree 150 of 1967), later transformed into the New Schools. Other strategies pursued during the 1970s and 1980s include educational initiatives to increase education supply, reduce dropout rates and identify rural needs (DNP 1975)Footnote 13.
Countries with better educational achievements in rural areas had similar strategies, which they implemented effectively. Argentina and Uruguay introduced different instructions for rural and urban primary schools and programmes such as the New Schools (Carro and Fernández Reference Carro and Fernández2012; Billorou Reference Billorou2015). Costa Rica, Uruguay and Chile also implemented ambulatory and «alternate» rural schools, as well as differences in school timetables (Angione et al. Reference Angione, Brindisi, Castrillon and Demarchi1987; Ponce de León et al. Reference Ponce De León, Rengifo, Serrano, Civera Cerecedo, Alfonseca-Gines de los Rios and Escalante Fernández2011). In Colombia, the rural strategies presented deficiencies such as limited coverage, low viability and a lack of precision and coordination (DNP 1977; Toledo et al. Reference Toledo, Niño, Buriticá, Díaz and Bueno1978; Helg Reference Helg2001). For example, according to the archival documents, the prevalence of «alternate» schools in rural areas «breaks the continuity of studies», limits learning time and undermines pupils' interest (MMPI 1926, p. 65, MMEN 1931, p. 241)Footnote 14.
A third factor is that the national government designed a rural school with a curriculum detached from rural contexts. In nations with better rural educational achievements, education was an instrument for modernising the agrarian sector; therefore, these countries oriented primary rural education towards practical knowledge, cultivation methods and basic but functional literacy skills (Spalding Reference Spalding1972; Goldin and Katz Reference Goldin and Katz2003; Nilsson and Pettersson Reference Nilsson, Pettersson and Nadine2008). In Uruguay, the interests of the elite were focused on promoting rural productivity and competitiveness; hence, the national government concentrated on rural instruction with practical knowledge in agriculture (Carro and Fernández Reference Carro and Fernández2012; Delio Machado Reference Delio Machado2014). Similarly, Jiménez (Reference Jiménez2007) mentions the efforts of the elite and the national government in Costa Rica to implement training in agriculture early.
In Colombia, among the first pieces of legislation in this respect was Decree 491 of 1904, which mandated the teaching of agriculture and the establishment of scholar's gardens. These programmes nevertheless failed due to insufficient resources and a lack of teachers able to train pupils in agricultural skills (Helg Reference Helg2001). Changes in primary-school content in rural areas occurred throughout the 20th century, with Decrees 1487 of 1932 and 1710 of 1963 unifying rural and urban primary instruction. The official sources refer to these contents of rural schooling as detached from local problems, as it centred on mechanical learning, religious instruction and skills that did not fit with rural needs, hence frustrating the expectations of rural communities (e.g. MMEN 1958, p. 68, 1931, p. 181, 1934; DNP 1986). The conclusion that emerges from the literature is similar. For Helg (Reference Helg2001), rural education's design consisted of a condensed version of urban school subjects without adapting to the peasant way of life. Consequently, the rural school increased frustration and dropout rates and reduced attendance in the Colombian countryside (Gutiérrez de Pineda Reference Gutiérrez de Pineda1958; MMEN 1934, p. 318).
Fourth, most of the failures in rural educational policies are due to budgetary discrimination, that is, an elitist bias in fiscal support for rural areas. For Latin America's educational leaders, the redistributive policies of their national governments determined the educational achievements of rural areas. In Argentina, Elis (Reference Elis2011) describes the greater financial efforts made by the national government in terms of expenditure and subsidies, which resulted in greater educational gains for rural areas. This situation was also present in areas of high urbanisation. Azar (Reference Azar2021, p. 7) claims that, despite low educational funding levels in Uruguay, 75 per cent of the new school provision between 1914 and 1954 was concentrated on rural schools. As for Colombia, by contrast, Ramírez-Giraldo and Téllez-Corredor (Reference Ramírez-Giraldo, Téllez-Corredor, Robinson and Urrutia2007) show that in the 1930s, rural schooling was allocated on average between 30 and 40 per cent of the educational budget, even though Colombia was mainly a rural country at that time. Likewise, the lack of fiscal support continued even after the rural educational expansion of the late 20th century. Corvalán (Reference Corvalán2006) highlights the increasing resources that went into educational funding at that time. However, the unequal distribution of national funds, with 35 per cent for rural areas and 65 per cent for urban ones, combined with the interests of the elites in prioritising urban sectors, became a disadvantage in financing primary rural education (Corvalán Reference Corvalán2006; Serrano Ordóñez Reference Serrano Ordóñez2007; Triana Reference Triana2009).
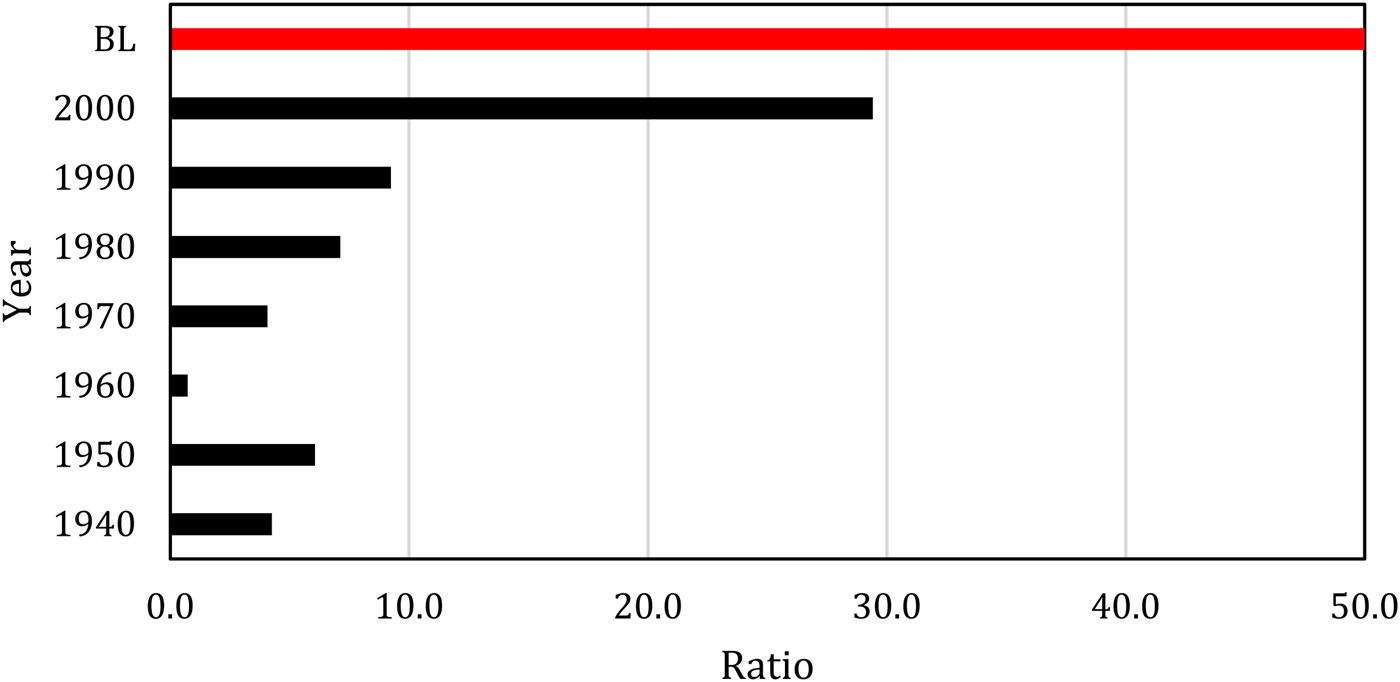
Lindert (Reference Lindert2010) proposes identifying the elitist bias in fiscal support by using a ratio between public support for primary education per pupil and public support for higher schooling per pupil. This indicator is crucial since, regardless of income levels, ratios below 50 per cent would give a preference to higher education, hence demonstrating that, rather than scarce resources, the backwardness in education originates in different social priorities (Lindert Reference Lindert2010). An important remark here is that in Colombia, primary rural education depends significantly on public support and is mainly demanded by poor peasants. For example, 95.2 per cent of primary schooling provision in rural areas was official in 1935, while in 1983, it was still 86.2 per cent. In contrast, tertiary education was restricted to urban inhabitants or the offspring of the rural aristocracy (Cataño Reference Cataño1984). Therefore, an approximation to the Lindert (Reference Lindert2010) double ratio may shed light on an elitist bias in rural educational resources.
Figure 8 shows the ratios. The figure suggests that the ratio improved during the 20th century while remaining lower than Lindert's baseline (50 per cent), indicating lower fiscal support for primary education. Moreover, comparing the results with Lindert (Reference Lindert2010), the figure confirms that Colombia performs less well than more egalitarian Latin American countries, validating the social preference for higher education in Colombia.
RATIO OF PUBLIC EXPENDITURE PER STUDENT IN PRIMARY EDUCATION TO HIGHER EDUCATION.
Source: Educational reports 1941, 1951, 1960, 1972, DNP (1991), DANE, Niño (Reference Niño1998) and Ruiz et al. (Reference Ruiz, Cano and Montes2008).
Note: BL: Linder's based line of 50 per cent.

Fifth, the lower level of fiscal support translated into lower quality in the provision of rural mass schooling. In assessing quality, we can initially consider teachers' qualifications since this variable might tell us about the skills of teachers in educating and identifying students' needs, and therefore impacting pupils' performance (Darling-Hammond Reference Darling-Hammond2000, p. 8). Figure 9 shows the qualifications of rural and urban primary teachers. The figure indicates that rural teachers dominate at the lowest levels of qualification (primary and secondary), while urban teachers dominate at the highest levels (graduate levels and normal schools). Such differences in training remained during the rural educational expansion of the late 20th century. According to official sources, the quality of training of rural teachers after the 1990s remains lower to the point that children in rural areas end up learning half of what they should be learning (Schifelbein et al. Reference Schifelbein, Vera, Aranda, Vargas and Corco1994; DNP 1998).
SHARE OF URBAN AND RURAL TEACHERS BY QUALIFICATION 1943-1983.
Source: See text.

The national government played a role in this outcome. In Colombia, national policies embedded rural teachers in precarious professional status and working conditions, leading to many positions remaining vacant or being occupied by unqualified teachers (Cataño Reference Cataño1984). For example, the fiscal responsibility for providing teachers in rural areas was delegated to subnational governments, entities characterised by patron–client hiring systems, and with low fiscal capacity when it came to fulfilling this obligation (Helg Reference Helg2001). Also, if the lack of resources was not an issue, the elitist bias limited quality since the local authorities undermined any real sense of rural education being a priority by delaying salary payments (Ramírez-Giraldo and Téllez-Corredor Reference Ramírez-Giraldo, Téllez-Corredor, Robinson and Urrutia2007). A 1931 report on education, for instance, describes how, although rural teachers earned similar salaries to public construction workers, the government paid construction workers punctually, which was not the case for rural teachers (MMEN 1931, p. 227). Therefore, as the official sources state, no competent person would voluntarily migrate to rural areas to work in these unpleasant conditions (MMEN 1931, p. 163, 1928, p. 327)Footnote 15.
These characteristics again contrast with the situation of rural educational leaders, which focused on strategies to improve quality and attract diligent rural teachers (Mamadaliev et al. Reference Mamadaliev, Svechnikova, Miku and Médico2019). In 1904, Argentina implemented policies to attract graduates to rural areas with salary premiums and land grants (Gutierrez Reference Gutierrez, Alfonseca-Guines, Civera and Escalante2011). Since the late 19th century, Costa Rica also implemented policies to provide training and support to encourage the «ruralisation» of the teaching profession (Jiménez Reference Jiménez2007). Similarly, in Uruguay, the introduction of normal rural schools increased the number of qualified teachers in rural areas to the point that, while in Colombia by 1950, non-graduate rural teachers were the rule, in Uruguay they were the exception (Angione et al. Reference Angione, Brindisi, Castrillon and Demarchi1987).
The introduction of normal rural schools in the 1930s was an attempt to correct this problem. The normal rural schools nevertheless arrived late, in low numbers, and with a lack of incentives for working in rural areas; hence graduates barely worked in rural territories (Triana Ramírez Reference Triana Ramírez2010). After the 1970s, national efforts such as the National Teacher Classification and Decree 707 of 1996 produced an increase in the number of rural teachers. Despite this progress in the supply of rural teachers, however, Pearlman et al. (Reference Pearlman, Schulmeyer, Tedesco, Tenti and Aguerrondo2004) show how rural teachers in Colombia still have on average 12.6 years of education, while this figure in Chile is 15.6, in Uruguay 13.2 and in Costa Rica 15.6.
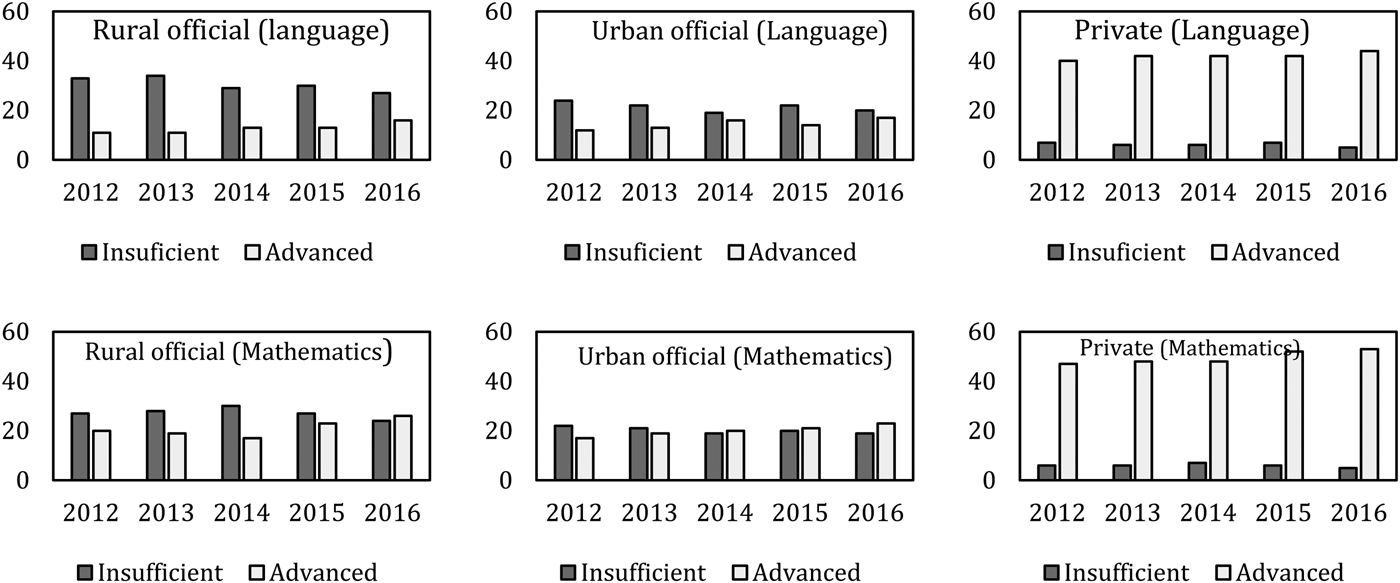
The questionable quality of teacher training corresponds with pupil performance (Darling-Hammond Reference Darling-Hammond2000). In this respect, we can analyse the results of the national standardised tests for primary pupils in mathematics and language competencies. An important caveat here is that the results are only available for the rural–urban disaggregation from 2012 to 2016. Figure 10 depicts the results, showing that rural pupils have both higher levels of insufficient achievement and lower levels of advanced attainment, especially compared with private education, which is mainly located in urban areasFootnote 16.
PERCENTAGE OF STUDENTS IN LEVELS OF ACHIEVEMENT OF THE STANDARDISED NATIONAL TESTS SABER 3° IN LANGUAGE AND MATHEMATICS 2012-2016.
Source: ICFES (2017).

Sixth, the national government may also produce and amplify regional inequalities in rural education due to the relationship between the organisation of national schooling and subnational dynamics in Colombia. To understand this aspect better, we can classify Colombian regions into three subnational categories. First are the Andean (Andina) departments, for which the national government implemented decentralised schooling during most of the 20th century. Second, there are the peripheral departments located in the Caribbean and Pacific regions with similar schooling arrangements to the Andean departments. Finally, there are the National Territories in which schooling was administered by the national government, unlike the departments.
Following Fuentes-Vásquez (Reference Fuentes-Vásquez2019), the decentralised organisation of schooling favoured education provision in regions with larger resources such as the Andean departments while delaying education in peripheral departments and the National Territories. Nonetheless, the peripheral departments and National Territories have an additional, potentially critical, characteristic in determining educational inequalities. Historically, they are the areas with greater concentrations of Afro-descended and indigenous people (see online Appendix 5).
As Arroyo Abad (Reference Arroyo Abad2015) claims, this racial composition produced stratified societies, which, combined with an elite bias against mass schooling, might contribute to boosting regional disparities in rural education. Specifically, in peripheral departments, the national decentralised schooling system discouraged rural education since the national government delegated it to local elites, which did not show any interest in redistributive policies for places with racially heterogeneous majorities. Analysis of the sources shows examples of this. For instance, in the peripheral department of Bolívar, the educational reports explicitly state that there was no interest in making adequate provision for rural schools, despite having the resources (Memoria 1914, p. 50). Likewise, in the National Territories, the national government determined the organisation of schooling. However, its direct administration of schooling was racialised (España-Eljaiek et al. 2023). In this regard, the Catholic mission was at the heart of the national educational strategy in the late 19th and mid-20th centuries. This was an educational project to «civilise savages» by providing them with basic literacy. Still, it also meant culturally homogenising and controlling non-white people, for example, replacing indigenous languages and traditions with «white» values such as the Spanish language and the Catholic religion (España-Eljaiek Reference España-Eljaiek, Mitch and Cappelli2019, p. 135). The national government also allowed national policies to be combined with subnational decisions, though without producing significant changes. For example, in Chocó, initially a National Territory but upgraded to a (peripheral) department in 1947, the Catholic mission was part of its educational project combined with local decisions. The educational reports for Chocó nevertheless describe local elites as not having much interest in redistributive educational policies, for example, suggestions for closing rural schools due to their poor organisation or their effects in detaching rural inhabitants from the countryside; authorities justifying social hierarchies in mixed-race schooling setting; or officers demanding limited provision of education because of the predominance of non-white races (MMIP 1914, p. 31 MMEN 1934, p. 323, 1933, p. 452)Footnote 17. Local conditions undoubtedly explain subnational differences since local elites may adopt national policies according to their interests, thus generating regional disparities (Arroyo Abad Reference Arroyo Abad2015). However, the impact of the national schooling organisation on this racially stratified society could also have had its effects. Rural education was already weak, but national policies that took the form of delegating responsibilities or racialised educational projects imposed even more disadvantages on the peripheral departments and National Territories.
Figure 11 provides more precise information on regional disparities in rural education. In contrast to Figure 6, Figure 11 compares the evolution of rural departmental GERs with national GERs, showing that departments in the central Andean territory, such as Antioquia, Caldas or Cundinamarca, performed better during periods in which rural areas were educationally backwards. In contrast, peripheral departments such as Bolívar, Magdalena or Atlántico tended to perform worse than the national GERs. Even worse results are observed for the lower levels of the National Territories during most of the 20th century, especially in Meta, Caquetá and La Guajira.
GERs 1928-2019.
Source: See text.

Figure 11 also shows educational expansion in rural areas of peripheral departments and National Territories during the last decades of the 20th century, especially in Magdalena, Chocó, Meta and Caquetá. Is this evidence of eliminating rural educational backwardness in peripheral departments and National Territories? Map 2 suggests that as Lindert (Reference Lindert2010) and Frankema (Reference Frankema2009) claim, regional inequalities were perpetuated in other indicators. Map 2 provides a sample of the results in standardised quality tests during the expansion of rural education, confirming how this expansion coincided with poor quality for the peripheral departments and National Territories. Likewise, the expansion also corresponds to larger over-age rates and lower qualifications of teachers in these territories (see online Appendixes 6 and 7).
AVERAGE SCORE OF RURAL PUPILS IN THE STANDARDISED NATIONAL TESTS SABER 3° in 2017.
Source: Data provided by ICFES.

Finally, violence was another structural issue that the national government was unable to counter and in which we can see connections between the previously discussed aspects of the problem. Internal Colombian conflicts have been more intensive in rural areas, deeply impacting rural school performance. The censuses of the population indeed show an increase in the national illiteracy gaps in rural areas during La Violencia (1947-1953), passing from a gap of 9.3 percentage points in 1938 to one of 12 percentage points in 1951. Another intensive period of violence began in the 1990s, producing a combination of political conflict, drug trafficking and displacement. In combating internal violence, the national government pursued its rural educational policies through literacy campaigns, the diffusion of educational primers, prevention of the drift to the cities from rural areas and flexible schooling programmes. For instance, in 1951, the national government decided to re-edit educational primers to promote awareness of national heroes and natural resources (MMEN 1951, pp. X-XII). After the 1990s, national programmes implemented a policy of flexible educational supply for rural residents in the context of intensive forced displacement. Helg (Reference Helg1989) shows that these types of policies were insufficient and ineffective for a countryside undergoing a humanitarian crisis, one that demanded a solution to structural problems and sources of violence, such as discrimination against rural inhabitants and the unequal distribution of land.
5. CONCLUSIONS
The present research has shown that, despite some progress, Colombia belongs to the group of countries with large rural–urban gaps in education. Furthermore, the analysis showed how these gaps are linked to the role of the national government in contexts of inequality in Latin American countries. In Latin America, national governments have a critical role in schooling (Teng Reference Teng2019). However, since national governments also represent powerful groups' political voices and interests (Lindert Reference Lindert2004), rural education evolves unevenly across countries. Hence, in egalitarian contexts, the elites and the receptive national governments prioritise the policies for universal rural schooling. In contrast, in highly hierarchised societies, the elitist bias in providing schooling delays rural educational attainment.
We have shown that Colombia corresponds to this latter case, as governments rarely demonstrate any real sense of rural education being a priority. On the contrary, their policy designs tend to accord a secondary place to rural schooling, thus reinforcing the backwardness of rural education. The national government deliberately provided a rural basic education with lagged initiatives, which, even when implemented, were detached from rural contexts, with scarce funds, lower quality and a design that amplified regional disparities.
Confirming the arguments of Frankema (Reference Frankema2009) and Lindert (Reference Lindert2010), this situation persisted even in periods when rural education expanded. In other words, when basic rural education experienced an increase in pupils, teachers and establishments, its backwardness persisted in terms of more critical indicators such as lower quality.
SUPPLEMENTARY MATERIAL
The supplementary material for this article can be found at https://doi.org/10.1017/S0212610923000058.
ACKNOWLEDGEMENTS
The authors want to specially thank María José Fuentes-Vásquez for her valuable remarks. We are also grateful to the members of DESL Dayana Parra, María Camila Palacio, Zwei Ramos, José Loaiza, Luís Sánchez, Martín Vanegas and Santiago Parada for their support in the data collection stage. Finally, the authors want to thank the editor and the anonymous reviewers for their efforts in making thoughtful comments that significantly improved this version.