INTRODUCTION
Sea cucumber fisheries have been developed rapidly in tropical waters during the last few decades due to high demand from the international market, ease of harvesting and low cost related to processing (Conand, Reference Conand, Lovatelli, Conand, Purcell, Uthicke, Hamel and Mercier2004; Lovatelli et al., Reference Lovatelli, Conand, Purcell, Uthicke, Hamel and Mercier2004; Choo, Reference Choo, Toral-Granda, Lovatelli and Vasconcellos2008). These characteristics make sea cucumbers highly susceptible to overexploitation and fisheries are showing signs of severe depletion in many sea cucumber producing countries (Lovatelli et al., Reference Lovatelli, Conand, Purcell, Uthicke, Hamel and Mercier2004; Bruckner, Reference Bruckner2006; Kinch et al., Reference Kinch, Purcell, Uthicke, Friedman, Toral-Granda, Lovatelli and Vasconcellos2008). Thus, sustainability of the fishery is further jeopardized as the recovery of heavily exploited stocks is slow and sporadic (Kinch, Reference Kinch2002; Uthicke et al., Reference Uthicke, Welch and Benzie2004). As such, the management of sea cucumbers has now become a worldwide concern (Uthicke & Benzie, Reference Uthicke and Benzie2000; Conand, Reference Conand, Lovatelli, Conand, Purcell, Uthicke, Hamel and Mercier2004, Reference Conand, Toral-Granda, Lovatelli and Vasconcellos2008).
Holothuria atra and Holothuria edulis are the most abundant and widely distributed sea cucumber species in most parts of the Indo-Pacific region (Harriott, Reference Harriott1985; Uthicke, Reference Uthicke2001; Conand & Mangion, Reference Conand and Mangion2002; Taddei, Reference Taddei2006; Choo, Reference Choo, Toral-Granda, Lovatelli and Vasconcellos2008; Conand, Reference Conand, Toral-Granda, Lovatelli and Vasconcellos2008) including the coastal waters of Sri Lanka (Dissanayake et al., Reference Dissanayake, Athukorala and Amarasiri2010). They inhabit a wide range of depths and a broad variety of habitat ranging from rocky reefs to mudflats (Conand & Mangion, Reference Conand and Mangion2002; Conand, Reference Conand, Toral-Granda, Lovatelli and Vasconcellos2008; Purcell et al., Reference Purcell, Gossuin and Agudo2009). As a result of increasing demand most of the high-value sea cucumber stocks have been overexploited, thus fisheries seem to be shifted towards these low value species (Lovatelli et al., Reference Lovatelli, Conand, Purcell, Uthicke, Hamel and Mercier2004; Conand & Muthiga, Reference Conand and Muthiga2007; Choo, Reference Choo, Toral-Granda, Lovatelli and Vasconcellos2008). Therefore, appropriate management measures need to be implemented to ensure the sustainable utilization of these low-value species. Preliminary biological and ecological information about sea cucumbers are important in developing combined management approaches (Wiedemeyer, Reference Wiedemeyer1994; Mercier et al., Reference Mercier, Battaglene and Hamel1999; Purcell, Reference Purcell, Lovatelli, Conand, Purcell, Uthicke, Hamel and Mercier2004; Conand & Muthiga, Reference Conand and Muthiga2007). Though the biology of these two sea cucumber species has been studied in detail, the knowledge of the spatial distribution patterns, habitat and ecological preference are scant, except for the work of Uthicke & Karez (Reference Uthicke and Karez1999) and Conand & Mangion (Reference Conand and Mangion2002). According to Sloan & von Bodungen (Reference Sloan and von Bodungen1980) and Slater & Jeffs (Reference Slater and Jeffs2010), bottom sediment characteristics are one of the crucial components affecting the habitat preference of sea cucumbers but the relationships between the bottom sediment characteristics and the spatial distribution pattern of these species still remain unclear. Hence, the present study was designed to determine the influence of bottom sediment characteristics and some environmental variables on the habitat preference of H. atra and H. edulis off the north-west coast of Sri Lanka.
MATERIALS AND METHODS
Study area
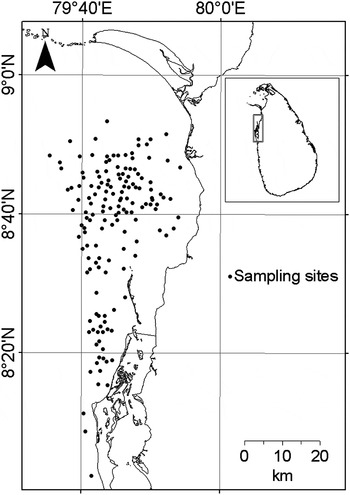
Underwater visual census (UVC) was carried out at 500 randomly selected sampling sites off the north-west coast of Sri Lanka in October 2008. The study area was between 7°55′N–8°55′N latitudes and 79°35′E − 79°57′E longitudes and the study area extended 112 km along the shore. Due to logistical and practical constraints, the study was confined to 1–30 m depth. The information collected at 151 sampling sites (Figure 1) was used for this analysis as required information and the bottom sediment samples were not able to collect from all the sampling sites.
Distribution of sampling sites (N = 151) on the north-west coast of Sri Lanka.

Field surveys
The survey employed the rapid marine assessment technique that has been used for sea cucumber surveys in the Torres Strait (Long et al., Reference Long, Skewes, Dennis, Poiner, Pitcher, Taranto, Manson, Polon, Karre, Evans and Milton1996). Fieldwork was undertaken by a team of divers operating from small boats and locating the sampling sites using a portable Global Positioning System (GPS) device. On each sampling site one or two divers swam along a 100 m transect, counting sea cucumbers on a 1 m strip to each side of the transect line. At the same time, bottom substrate within each transect was visually estimated in terms of the percentage cover of sand, rubble, limestone platform, coral, terrestrial rock, mud, seagrass and macroalgae.
Eleven microhabitat types: sandy; seagrass; macroalgae; sandy habitat with rocks/corals; sandy habitat with macroalgae; sandy habitat with seagrass; rocky habitat with algae/seagrass; muddy habitat; sandy and muddy habitat with corals; muddy and sandy habitat; and muddy habitat with macroalgae were described initially. Each sampling site was categorized into one of these microhabitats by considering the estimated percentage cover of each component. When defining a single microhabitat for sampling site, the percentage cover of each component was added together and the dominant component or components were taken into account.
In each station sediment samples were collected using a Ponar grab (400 cm2) sampler. In all the cases, penetration of the grab was 12 to 15 cm and three replicate samples were collected. These samples were first stored in ice and then frozen (−4°C) until the subsequent analysis. In the laboratory, sediments were analysed by a standard sieve fractionation method (Folk, Reference Folk1966). The sediment samples were washed through a 0.062 mm mesh sieve to separate the silt–mud and sand fractions. The sand fraction was dried and fractionated on a mechanical shaker with sieves spanning from 16 to 0.062 mm. The mean grain size was calculated using the method described by McBride (Reference McBride and Carver1971). Total organic matter (TOM) was determined using a variation on the combustion method as recommended by Luczak et al. (Reference Luczak, Janquin and Kupka1997). Sub-samples of surface sediment (approximately 1g) were dried in a 50°C oven to constant weight. Pre-weighed dry samples were burned in a muffle furnace at 500°C for 6 hours and then reweighed. Total organic matter was calculated as percentage weight loss following combustion.
Analytical approach
The generalized additive model (GAM) was used to examine the relationships between the habitat variables and the density of each sea cucumber species. A GAM is a non-parametric generalization of multiple linear regression (GAMs; Hastie & Tibshirani, Reference Hastie and Tibshirani1990) which has been widely used in describing the complex relationships between animals and their environment (Maravelias, Reference Maravelias1999; Stoner et al., Reference Stoner, Manderson and Pessutti2001).
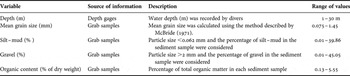
The number of sea cucumbers in each transect (numbers 200 m−2) was used as the dependent variable and the variables summarized in Table 1 served as the independent variables. It was assumed that the response variable (density) follows a Poisson distribution which is normally appropriate for describing the count data (Faraway, Reference Faraway2006). The Poisson response with the log-link function (scale = –1) was used to construct the GAMs. In the first step, a GAM was constructed using single predictor to identify the relationship between individual habitat predictor and the density of each sea cucumber species. Each predictor was prioritized according to the percentage deviance explained (0–100%, the highest deviance was taken as the best) and the generalized cross- validation (GCV) score (the lowest was considered as the best). The best predictors for the final model were selected based on the above prioritization.
Parameters serve as the independent variables when constructing the generalized additive models for the two sea cucumber species (Holothuria atra and Holothuria edulis) on the north-west coast of Sri Lanka.

As GAMs allow for fitting a single response variable to multiple predictors, a series of GAMs were constructed with multiple predictors to model the density of H. atra and H. edulis. The ‘best’ model for each species was again selected on the basis of GCV score and the level of deviance explained. The GAMs smoothing predictors were selected following the method proposed by Wood & Augustin (Reference Wood and Augustin2002), using the ‘mgcv’ library in the R statistical software (R Development Core Team, 2009, www.rproject.org).
The density of each species in different habitat types was also compared using the Kruskal–Wallis test. The relationships between the environmental parameters and the density of each species were assessed by Pearson correlation analysis.
RESULTS
Spatial distribution
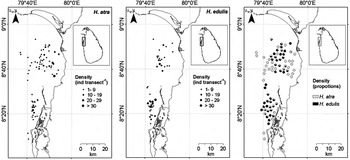
The density of each sea cucumber species varied markedly among the survey sites. Both species were highly abundant close to the lagoon mouth and the northern part of the survey area while these species were rarely observed in the middle portion (Figure 2). Hence, the spatial distribution of these species appears to be uneven. Both species were observed within the same survey site but in different proportions.
Spatial distribution of density (ind transect−1) of Holothuria atra, Holothuria edulis and the proportional density distribution of both H. atra and H. edulis on the north-west coast of Sri Lanka.

Distribution in different habitat
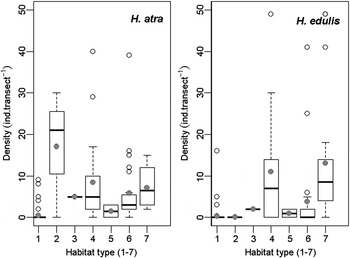
Seven out of 11 microhabitat categories defined under the methodology were encountered at the 151 sampling sites and both H. atra and H. edulis were found in all these habitat categories (Figure 3). The density of each sea cucumber species varied significantly among the habitat (P < 0.01). The highest density of H. atra was reported in the seagrass habitat followed by the sandy habitat with rocks/corals, rocky habitat with algae/seagrass. Holothuria edulis was also commonly found in the latter two habitat categories. For both these species, sandy bottom yielded the lowest densities.
Box and whisker plot to show the density (ind transect−1) of Holothuria atra and Holothuria edulis in the different microhabitat categories (1, sandy; 2, seagrass; 3, macroalgae; 4, sandy habitat with rocks/corals; 5, sandy habitat with macroalgae; 6, sandy habitat with seagrass; 7, rocky habitats with algae/seagrass) on the north-west coast of Sri Lanka. The filled circle represents the mean density in each habitat.

Generalized additive model
Single predictor fits
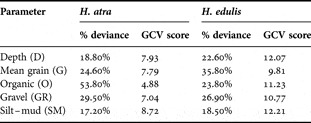
Organic content (% of dry weight) had the highest influence on the density of H. atra followed by gravel (%), mean grain size, depth and the amount of silt–mud (%). Mean grain size was the best predictor that can be used to explain the differences in spatial distribution of H. edulis. Furthermore, gravel (%), organic content (% of dry weight), depth and silt mud (%) were the other variables that affect the density of H. edulis (Table 2).
The percentage of deviance and the generalized cross-validation (GCV) score of each predictor of the generalized additive model constructed for Holothuria atra and Holothuria edulis.

Multiple predictor fits
Holothuria atra
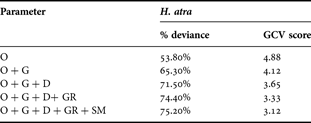
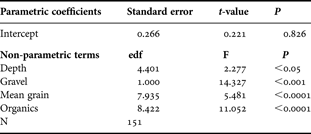
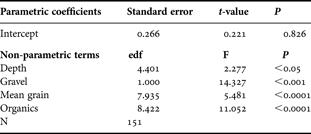
For H. atra GAMs were constructed by combining 1 to 5 predictors and the best combination in each step was selected by considering the deviance explained (%) and the GCV score. Though the quality of the model increased up to five predictors, the latter combination resulted in little gain to the final model (Table 3). The combination of four predictors; depth, mean grain size, percentage organic contents (% of dry weight) and percentage gravel contents have a significant effect on the density of H. atra (P < 0.05). These four predictors explained 74.4% of the deviance in the final model (Table 4).
Multiple predictors generalized additive model fits for Holothuria atra. For each predictor, the percentage of deviance and the generalized cross-validation (GCV) score is given.
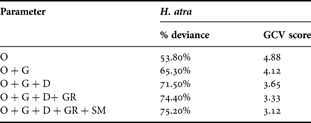
O, organic; G, mean grain; D, depth; GR, gravel; SM, silt–mud.
Results of the final generalized additive model constructed for the density of Holothuria atra observed in the underwater visual census on the north-west coast of Sri Lanka.
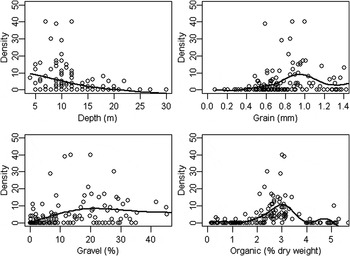
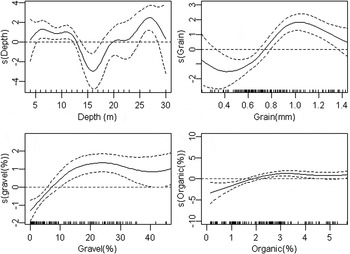
There were great variations of the density of H. atra in relation to the individual variables (Figure 4). According to the GAM outputs, the highest densities of H. atra were concentrated in shallow depths (<10 m) and the deeper areas were carrying very low sea cucumber densities. Holothuria atra densities were highest in association with the mean grain size of about 0.7–1.2 (mm) and the organic contents between 2 and 3.5% of dry weight (Figure 5). The density of H. atra increased with an increase in gravel percentage and the highest densities were observed in the areas where there was 15–25% of gravel.
Relationship between density (ind transect−1) of Holothuria atra and individual variables depth (m), grain size (mm), gravel (%) and organic (% dry weight) on the north-west coast of Sri Lanka.

Generalized additive models obtained for Holothuria atra on the north-west coast of Sri Lanka. Plots show the additive effect of each variable: depth (m), grain size (mm), gravel (%) and organic (% dry weight) on the density of Holothuria atra. Confidence intervals represent two standard error ranges around the main effect and the horizontal line indicates the zero level. Vertical dashes at the bottom of the plots show the distribution of points entering into the model.

Holothuria edulis
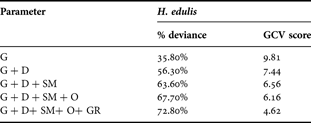
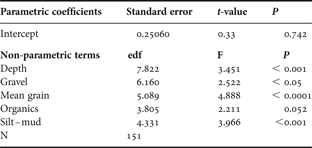
The quality of the model increased with increasing number of predictors (Table 5). The four variables; depth, mean grain size, gravel (%) and silt–mud (%) have significant influence on the density of H. edulis (P < 0.05) while the organic content (% dry weight) has marginal effect (Table 6). The final model explained 72.8% deviance and 4.6 GCV score.
Multiple predictors generalized additive model fits for Holothuria edulis. For each predictor, the percentage of deviance and the generalized cross-validation score is given.
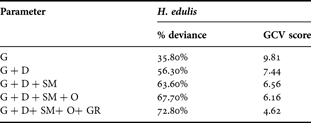
G, mean grain; D, depth; SM, silt–mud; O, organic; GR, gravel.
Results of the final generalized additive model constructed for the density of Holothuria edulis observed in the underwater visual census on the north-west coast of Sri Lanka.
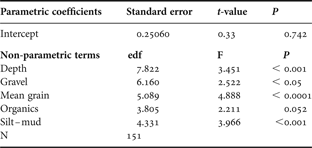
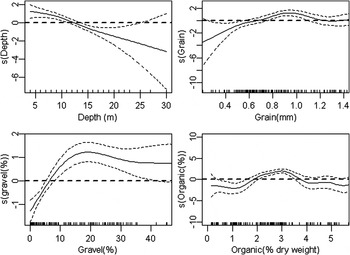
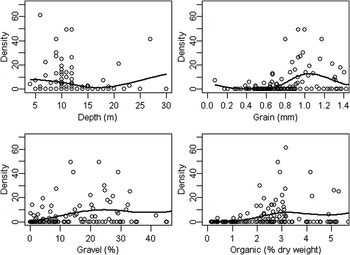
The relationship between the density of H. edulis and the water depth was not clear. The high densities were concentrated in shallow depths (<10 m), declined at depths of 12–15 m, and again increased towards the deeper depths (>25 m). Moreover, the highest densities of H. edulis occurred in the sediments with coarse sand (0.8–1.1 mm mean grain sizes) and relatively lower gravel percentage (15–25%). There was no distinct organic preference by H. edulis and the relationship between % organic contents and the density of H. edulis was almost flat beyond the 2% organic content (Figures 6 & 7).
Relationship between density (ind transect−1) of Holothuria edulis and individual variables depth (m), grain size (mm), gravel (%) and organic (% dry weight) on the north-west coast of Sri Lanka.

Generalized additive models obtained for Holothuria edulis on the north-west coast of Sri Lanka. Plots show the additive effect of each variable: depth (m), grain size (mm), gravel (%) and organic (% dry weight) on the density of Holothuria atra. Confidence intervals represent two standard error ranges around the main effect and the horizontal line indicates the zero level. Vertical dashes at the bottom of the plots show the distribution of points entering into the model.

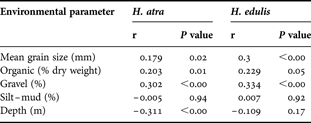
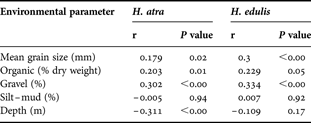
The densities of H. atra and H. edulis were positively correlated with the mean grain size (r = 0.179, r = 0.30), percentage organic content (r = 0.203, r = 0.229), gravel percentage (r = 0.302, r = 0.334) and negatively correlated to the depth (r = –0.31, r = –0.109). The correlation between the density of H. atra and all environmental variables was significant (P <0.05), except the silt–mud which showed negative correlation (r = –0.005). However density of H. edulis has shown positive correlation with silt–mud (r = 0.007) (Table 7).
Results of the Pearson correlation (r) analyses between the environmental descriptors and the density of the two sea cucumber species; Holothuria atra and Holothuria edulis on the north-west coast of Sri Lanka.
DISCUSSION
An uneven or patchy distribution is a quite common phenomenon among the sea cucumbers and a similar distribution pattern has been reported in: LaGrande Terre in New Caledonia (Purcell et al., Reference Purcell, Gossuin and Agudo2009); the Torres Strait (Skewes et al., Reference Skewes, Taylor, Dennis, Haywood and Donovan2006); Milne Bay Province (Skewes et al., Reference Skewes, Kinch, Polon, Dennis, Seeto, Taranto, Lokani, Wassenberg, Koutsoukos and Sarke2002) and most parts of the Indian Ocean (Conand & Mangion, Reference Conand and Mangion2002; Conand & Muthiga, Reference Conand and Muthiga2007; Conand, Reference Conand, Toral-Granda, Lovatelli and Vasconcellos2008). The patchiness of spatial distribution of these species could be attributed to variety of factors such as substrate types, bottom sediment characteristics, food availability, depth and predator avoidance (Sloan & von Bodungen, Reference Sloan and von Bodungen1980; Young & Chia, Reference Young and Chia1982; Hammond, Reference Hammond1983; Massin & Doumen, Reference Massin and Doumen1986; Bulteel et al., Reference Bulteel, Jangoux and Coulon1992; Uthicke & Karez, Reference Uthicke and Karez1999; Mercier et al., Reference Mercier, Battaglene and Hamel2000; Uthicke et al., Reference Uthicke, Welch and Benzie2004; Abdl Razek et al., Reference Abdl Razek, Ael-Shimy, Abdel Rahman and Omar2006; Eckert, Reference Eckert2007; Entrambasaguas et al., Reference Entrambasaguas, Pérez-Ruzafa, García-Charton, Stobart and Bacallado2008; Shiell & Knott, Reference Shiell and Knott2010; Slater & Jeffs, Reference Slater and Jeffs2010).
The habitat preference of sea cucumbers has been reported to vary from species to species and even within the different life stages of the same species (Conand, Reference Conand1990; Mercier et al., Reference Mercier, Battaglene and Hamel2000; Purcell, Reference Purcell, Lovatelli, Conand, Purcell, Uthicke, Hamel and Mercier2004; Shiel, Reference Shiel2004; James, Reference James2005; Yamana et al., Reference Yamana, Hamano and Miki2006; Conand, Reference Conand, Toral-Granda, Lovatelli and Vasconcellos2008; Purcell et al., Reference Purcell, Gossuin and Agudo2009; Slater & Jeffs, Reference Slater and Jeffs2010). According to the present study, the highest density of H. atra was observed in the seagrass areas. Most sea cucumbers are deposit feeders and dense aggregation in seagrass associated habitat could be directly related to their feeding, as seagrass areas are rich in accumulation of particulate matter and detritus. Dense aggregation of Holothuria species (H. atra, H. edulis, Holothuria leucospilota and Holothuria scabra) in the shallow water seagrass habitat has been previously reported in several studies (Zhou & Shirley, Reference Zhou and Shirley1996; Forbes et al., Reference Forbes, Ilias, Baine, Choo and Wallbank1999; Mercier et al., Reference Mercier, Battaglene and Hamel2000). Though, wide occurrence of H. edulis in the seagrass habitat was commonly reported (Choo, Reference Choo, Toral-Granda, Lovatelli and Vasconcellos2008; Conand, Reference Conand, Toral-Granda, Lovatelli and Vasconcellos2008), low numbers of H. edulis were collected at the seagrass habitat during this study. The reason for this observation was not quite clear but some possible reasons could be: existence of more favourable habitat than the seagrass, or poor visibility of this species during the survey due to their sheltering or hiding behaviour. The higher aggregation of both H. atra and H. edulis in the reef flats and the rocky substrates was consistent with the findings of Conand (Reference Conand, Toral-Granda, Lovatelli and Vasconcellos2008) and Purcell et al. (Reference Purcell, Gossuin and Agudo2009) and this aggregation could be related to the protection from waves and currents (Conand & Mangion, Reference Conand and Mangion2002; Deroski & Drumm, Reference Deroski and Drumm2003). Very few animals were present on open sand and this result confirmed the findings of Moriarty (Reference Moriarty1982) and Massin & Doumen (Reference Massin and Doumen1986).
The present study revealed that the highest sea cucumber densities were concentrated at the shallow stations (<10 m) together with decreasing densities with depth. Several studies have shown that low-value species including H. atra and H. edulis are more abundant in shallow waters due to the presence of preferable habitat conditions for these species (Conand, Reference Conand1990; Kinch et al., Reference Kinch, Purcell, Uthicke, Friedman, Toral-Granda, Lovatelli and Vasconcellos2008; Purcell, et al., Reference Purcell, Gossuin and Agudo2009). Further, there is a relationship between bottom sediment characteristics and depth. With increasing depth, silt–mud content increases and gravel content is reported to be decreased (Martin et al., Reference Martin, Fernandez-Arcaya, Tirado, Dutrieux and Corbera2009). Hence, the variations of sea cucumber densities with depth seem to be related to the bottom sediment characteristics. However, increasing densities of H. edulis in the deeper depths need to be interpreted carefully as we did not have sufficient data.
As sea cucumbers feed on bacteria, microalgae and dead organic matter (Yingst, Reference Yingst1976; Massin, Reference Massin, Jangoux and Lawrence1982; Moriarty, Reference Moriarty1982), sediment organic content seems to have great influence on the habitat preference of sea cucumbers. As there is a close relationship between the sediment grain size and the level of organic matter (Longbottom, Reference Longbottom1970; Hargrave, Reference Hargrave1972; Dale, Reference Dale1974; Cammen, Reference Cammen1982), the sediment grain size could be considered as another important factor which governs the habitat preference of sea cucumbers. Previous investigations have shown that fine grained sediments are nutritionally rich food source in the marine environment (Mayer et al., Reference Mayer, Rahaim, Guerin, Macko, Watling and Anderson1985; Yamamoto & Lopez, Reference Yamamoto and Lopez1985). According to the present study, H. atra was densely associated in coarse sand (0.7–1.2 mm) with 2–3.5% organic content and they avoid the bottom substrates with high levels of silt–mud content (<1%). The highest aggregation of H. atra in these habitat conditions provides some evidence of their preference towards the particular level of sediment organic materials, grain size and silt–mud content. Previous studies have also shown that H. atra has slight selection on sediment organic and sediment patches rich with microalagae (Webb et al., Reference Webb, D'Elia and Dupaul1977; Roberts, Reference Roberts1979; Wiedemeyer, Reference Wiedemeyer1992; Uthicke, Reference Uthicke1999).
Favourable bottom sediment conditions of H. edulis seem to be mainly similar to the conditions preferred by H. atra, except in the level of organic contents. Uthicke & Karez (Reference Uthicke and Karez1999) have revealed that there is not any selectivity towards the sediment organic content by H. edulis. Though these two species favoured similar habitat conditions, they have different preferences towards the sediment organic contents and this makes possible for them to have particular niches.
Although some sea cucumber species have selection towards the certain grain size to obtain required food (Rhoads & Young, Reference Rhoads and Young1971; Haukson, Reference Haukson1979; Roberts, Reference Roberts1979), such evidence was not available for H. atra and H. edulis. Hence, the effect of sediment grain size in facilitating the feeding of these species is unclear. However, the favourable grain size probably supports to maintain the preferable levels of organic materials as well as the required space in the sediments.
Avoidance of high level of silt–mud substrates by both these species could be due to several reasons. As these substrates are extremely fine, there is a possibility of having anoxic environment (Mercier et al., Reference Mercier, Battaglene and Hamel2000). Further, sea cucumbers may have difficulties in locomotion on the soft featureless muddy substrates (Sloan & von Bodungen, Reference Sloan and von Bodungen1980). These two species usually cover their bodies with sand and this behaviour could be interrupted within the muddy substrate.
The habitat preference and spatial distribution of the two sea cucumber species seemed to be influenced by the depth and bottom sediment characteristics, and the optimum conditions have varied from species to species. The GAM used in this study achieves an acceptable level of accuracy by giving higher deviance.
The management implications of this study include the information of habitat preference and environmental influence on the distribution of commercial sea cucumber species H. atra and H. edulis in the coastal waters of Sri Lanka; and this will assist to identify and conserve the preferable habitat of each species. Further, the information on habitat and ecological requirements of these species is important to implement successful rehabilitation programmes and precise stock assessment surveys. Model application can be easily extended for the other sea cucumbers especially for the high-value category. Incorporation of important oceanographical variables such as turbidity, water temperature, salinity and tidal influence will further improve the model.
ACKNOWLEDGEMENTS
The authors wish to thank all the staff members of the Marine Biological Resources Division of NARA for their assistance in the field and laboratory work. Thanks to Dr Brian Long, Dr C. Amarasiri, Mr H.S.G. Fernando, Ms S.H. Athukorala, Ms D.R. Herath and all the colleagues who gave enormous support during this study. The referees are thanked for their useful comments. This research was financially and technically supported by the Canadian International Development Agency (CIDA), the International Fund for Agricultural Development (IFAD) and Food and Agriculture Organization (FAO). The first author was supported by a Doctoral scholarship under the United Nations University Fisheries Training Programme (UNU-FTP).