Introduction
Most cells have the capacity to catabolize proteins and lipids through macroautophagy (Kon & Cuervo, Reference Kon and Cuervo2010). Phagocytic cells have the additional burden of degrading the ingested material. In the retinal pigment epithelia (RPE), phagocytosis serves as a homeostatic regulator; in addition to the daily degradation of photoreceptor outer segment (POS) proteins, it is also responsible for the breakdown of POS-derived lipid components (Bazan et al., Reference Bazan, Calandria and Serhan2010; Kevany & Palczewski, Reference Kevany and Palczewski2010). Critical in the digestion of engulfed POS is the soluble lysosomal aspartic endopeptidase (EC 3.4.23.5) cathepsin-D (Cat-D) (Hayasaka, Reference Hayasaka and Hsa1975; LaVail, Reference LaVail1978; LaVail, Reference LaVail1980; Besharse et al., Reference Besharse, DeFoe, Marmor, Wolfensberger and Besharse1998). Cat-D is synthesized in the rough endoplasmic reticulum as a pre-pro-enzyme and upon removal of the signal peptide forms a 52 kDa pro-Cat-D. Pro-Cat-D is targeted to intracellular structures including phagosomes, lysosomes, endosomes, and melanosomes (Hasilik & Neufeld, Reference Hasilik and Neufeld1980; Kornfeld, Reference Kornfeld1990; Azarian et al., Reference Azarian, McLeod, Lillo, Gibbs, Yates and Williams2006), where the pro-peptide is cleaved resulting in a 48 kDa intermediate minimally active form. Further proteolytic cleavage yields the mature active protease which is composed of heavy (34 kDa) and light (14 kDa) chains linked by noncovalent interactions (Deguchi et al., Reference Deguchi, Yamamoto, Yoshimori, Sugasawa, Moriyama, Futai, Suzuki, Kato, Uyama and Tashiro1994; Delbruck et al., Reference Delbruck, Desel, von Figura and Hille-Rehfeld1994; Steinfeld et al., Reference Steinfeld, Reinhardt, Schreiber, Hillebrand, Kraetzner, Bruck, Saftig and Gartner2006).
Unlike other proteases, Cat-D retains dual functionality exhibiting both degradative and growth factor-like properties, involved in cell proliferation and angiogenesis (Vetvicka et al., Reference Vetvicka, Vektvickova and Fusek1994; Fusek & Vetvicka, Reference Fusek and Vetvicka2005; Benes et al., Reference Benes, Vetvicka and Fusek2008; Zaidi et al., Reference Zaidi, Maurer, Nieke and Kalbacher2008; Vetvicka & Vetvickova, Reference Vetvicka and Vetvickova2011). Active forms of Cat-D can be released together with other proteases from lysosomes into the cytosol in response to apoptotic stimuli thus contributing to cell death. The dysregulated sorting and maturation of Cat-D are linked to progressive neurodegenerations, including retinal degeneration and Alzheimer’s disease (Capurso et al., Reference Capurso, Solfrizzi, D’Introno, Colacicco, Capurso, Bifaro, Menga, Santamato, Seripa, Pilotto, Capurso and Panza2008; Haque et al., Reference Haque, Banik and Ray2008; Urbanelli et al., Reference Urbanelli, Emiliani, Massini, Persichetti, Orlacchio, Pelicci, Sorbi, Hasilik, Bernardi and Orlacchio2008) as well as breast cancer metastasis (Garcia et al., Reference Garcia, Platet, Liaudet, Laurent, Derocq, Brouillet and Rochefort1996; Benes et al., Reference Benes, Vetvicka and Fusek2008).
The toxic effects of defective Cat-D processing are most often progressive. For example, mice with loss of functional Cat-D develop progressive retinal atrophy over a 12-month period (Saftig et al., Reference Saftig, Hetman, Schmahl, Weber, Heine, Mossmann, Koster, Hess, Evers and von Figura1995). Transgenic mice that overexpress mutant minimally active Cat-D acquire features that resemble age-related retinal degenerative changes, including geographic atrophy, accelerated photoreceptor cell death, the presence of basal laminar deposits, and accumulation of POS breakdown products in the RPE (Rakoczy et al., 1996a). Furthermore, up-regulation of normal Cat-D results in the secretion of unprocessed pro-Cat-D into the media (Rakoczy et al., 1996b; Rakoczy et al., 1996c; Rakoczy et al., Reference Rakoczy, Lai, Baines, Di Grandi, Fitton and Constable1997, Reference Rakoczy, Zhang, Robertson, Barnett, Papadimitriou, Constable and Lai2002). Missense mutations in the human CTSD gene that result in minimally active Cat-D due to disrupted intracellular trafficking exhibit phenotypes characteristic of retinal degeneration and progressive psychomotor disability, further highlighting the progressive nature of Cat-D functional deficiency (Steinfeld et al., Reference Steinfeld, Reinhardt, Schreiber, Hillebrand, Kraetzner, Bruck, Saftig and Gartner2006). Cat-D maturation is highly regulated. Among the regulators is a newly described protein, melanoregulin (MREG) that is required for processing of active Cat-D. We have shown that defective Cat-D processing contributes to the accumulation of opsin positive phagosomes in the RPE of Mreg dsu/dsu mice (Damek-Poprawa et al., Reference Damek-Poprawa, Diemer, Lopes, Lillo, Harper, Marks, Wu, Sparrow, Rachel, Williams and Boesze-Battaglia2009). Concomitant with lack of Cat-D processing was the accumulation of retinal debris in the form of the lipofuscin component, pyridinium bisretinoid, A2E (Damek-Poprawa et al., Reference Damek-Poprawa, Diemer, Lopes, Lillo, Harper, Marks, Wu, Sparrow, Rachel, Williams and Boesze-Battaglia2009). We now extend those studies to determine consequences of MREG depletion on extracellular Cat-D levels. In these studies, we show that loss of MREG expression leads to the accumulation and basolateral secretion of immature Cat-D (46–48 kDa) both in vivo and in vitro (Damek-Poprawa et al., Reference Damek-Poprawa, Diemer, Lopes, Lillo, Harper, Marks, Wu, Sparrow, Rachel, Williams and Boesze-Battaglia2009). Secretion of the 46–48 kDa Cat-D is correlated with enhanced laminin in Bruch’s membranes (BMs). Collectively, the Mreg dsu/dsu phenotype possess the hallmarks of retinal degenerations due to aging, including lipofuscin accumulation, delayed phagosome maturation, and basal laminar thickening and suggests a protective role for MREG against age-related degenerative eye disease.
Materials and methods
Materials and primer sets
Commercially available antibodies were purchased as follows: for Western blot analysis, goat anti-Cat-D and goat anti-Actin from Santa Cruz Biotechnology (Santa Cruz, CA), rabbit anti-MREG from Abnova (Taipei City, Taipei), rabbit antigoat and goat antirabbit horseradish peroxidase-conjugated secondary antibody from Thermo Scientific (Rockford, IL). For immunofluorescence analysis, we used mouse anti-MREG from Novus Biologicals (Littleton, CO) and rabbit antilaminin (Sigma-Aldrich). Secondary antibodies were Alexa-Fluor 594 donkey antirabbit and Alexa-Fluor 488 donkey antimouse from Invitrogen (Grand Island, NY). For double-labeling in immune-electron microscopy, we used a polyclonal Cat-D antibody from Dr. Dean Bok (Bosch et al., Reference Bosch, Horwitz and Bok1993) and mouse mAb anti-MREG 165 (Boesze-Battaglia et al., Reference Boesze-Battaglia, Song, Sokolov, Lillo, Pankoski-Walker, Gretzula, Gallagher, Rachel, Jenkins, Copeland, Morris, Jacob, Yeagle, Williams and Damek-Poprawa2007). The polyclonal Cat-D antibody was also used in immunohistochemistry (IHC) analysis of Mreg dsu/dsu and Mreg +/+ eyecups. The following Mreg primers were used in these studies, hMREG, 5′-TTTGGAGCAACTCTGGTGAGGGAT-3′ (forward) and 5′-GTGCAATGAGACGGTCCACAACAA-3′ (reverse).
Cell culture
ARPE-19 cells (ATCC, CRL-2302) were grown in Dulbecco’s modified Eagle medium (DMEM) supplemented with 10% fetal calf serum as described (Ahmado et al., Reference Ahmado, Carr, Vugler, Semo, Gias, Lawrence, Chen, Chen, Turowski, da Cruz and Coffey2011). For secretion experiments, shRNA-treated (MREG or nontarget control) ARPE-19 cells were grown as described (Dunn et al., Reference Dunn, Aotaki-Keen, Putkey and Hjelmel1996). Cells in suspension (0.5 ml) were added to the upper chamber of a 12-well plate, containing polycarbonate Transwell inserts, with a 3.0-m-pore diameter (Costar, Corning, NY). They were maintained in the growth medium (GM) containing DMEM (high glucose) supplemented with 1% fetal bovine serum (FBS). Cells were cultured until confluent colonies were present. Cells were then maintained at 37°C/5% CO2 for analysis. Media were collected from the basal chamber for analysis. Trans epithelial resistance was routinely 45–48 ohms/cm2.
Primary RPE cell culture
Primary RPE cells were isolated from Mreg dsu/dsu and Mreg +/+ (C57BL6/J) mice at 6 weeks old and cultured as described (Gibbs et al., Reference Gibbs, Kitamoto and Williams2003). Briefly, intact eyes were removed and lots of 10–12 eyes were washed twice in 5 ml DMEM containing high glucose, then incubated with 5 ml of 2% (w/v) Dispase in DMEM for 45 min at 37°C. Eyes were washed twice in the GM. Posterior eyecups were isolated and incubated in the GM for 20 min at 37°C to facilitate separation of the neural retina from the RPE. The neural retina was removed and intact sheets of RPE cells were peeled off the underlying basement membrane (BM) and transferred into a sterile 60-mm culture dish, containing 5 ml of the fresh GM. The sheets of RPE were washed three times with GM, twice with Ca+2 and Mg+2 free Hanks’ balanced salt solution (5 mM KCl, 0.5 mM KH2PO4, 4 mM NaHCO3, 150 mM NaCl3 mM, Na2HPO47H2O 5 mM glucose, pH 7.4) and briefly triturated by using a fine point Pasteur pipette. RPE cells were sedimented by centrifugation at 200 × g for 5 min and resuspended in the GM to a final concentration of 50,000 cells per ml and plated. Cells in suspension (0.5 ml) were plated on Transwell plates (Corning Costar, Corning, NY) using 12-mm diameter inserts with 0.4 µm pores on polyester membranes (Thermo-Fisher Scientific, Pittsburgh, PA) and maintained as described above.
Lentiviral shRNA transduction
ARPE-19 cells were passaged and subsequently (within 24 h) transduced with MISSION shRNA lentiviral particles (Sigma-Aldrich, St. Louis, MO) with a multiplicity of infection (MOI) of five in the presence of 8 µg/ml hexadimethrine bromide and incubated at 37°C for 18–20 h (Zufferey, Reference Zufferey1997; Stewart et al., Reference Stewart, Dykxhoorn, Palliser, Mizuno, Yu, An, Sabatini, Chen, Hahn, Sharp, Weinberg and Novina2003). Fresh media were added and cells incubated overnight. Media were then replaced with media containing 2 µg/ml puromycin for selection purposes and changed every 3–4 days until resistant colonies could be identified. Control cells were transduced with pLKO.1-puro shRNA control particles containing no shRNA insert (C1) or nontarget (nonhuman) shRNA insert (C2). MREG knockdown cells were transduced with Mreg shRNA lentiviral particles, clone IDs TRCN0000133942, TRCN0000134116, TRCN0000134266, TRCN0000134495, TRCN0000134842 (Sigma-Aldrich), designated M1–M5, respectively. Knockdown of the Mreg dsu gene was confirmed by agarose gel with products from real-time polymerase chain reaction (RT-PCR) and of MREG protein by Western blot analysis.
Animals
Melanoregulin is the product of the Mreg dsu gene locus [previously known as dilute suppressor (dsu)- or whn-dependent transcript 2 (wdt2)]. Mreg dsu/dsu mice carry the Mreg dsu allele (mouse accession number, Q6NV65) in which deletion of the first two exons results in an effective null allele (O’Sullivan et al., Reference O’Sullivan, Wu, Rachel, Huang, Swing, Matesic, Hammer, Copeland and Jenkins2004). Mreg −/− mice (on C57BL6/J genetic background) used in these studies were originally maintained and propagated at the NCI, National Institutes of Health, and were generous gifts from Drs. Jenkins and Copeland (Texas Medical Center). Both Mreg dsu/dsu and Mreg +/+ (C57BL/J6 genetic background, obtained from the Jackson Laboratory) mice were housed under cyclic light conditions: 12-h light/12-h dark and fed ad libitum. All procedures involving animals were approved by the University of Pennsylvania, Institutional Animal Care and Use Committee and were in accordance with the Association for Research in Vision and Ophthalmology guidelines for use of animals.
Immunoblotting
Cleared RPE lysates were prepared as described (Damek-Poprawa et al., Reference Damek-Poprawa, Diemer, Lopes, Lillo, Harper, Marks, Wu, Sparrow, Rachel, Williams and Boesze-Battaglia2009). Briefly, ARPE-19 or primary RPE cells were lysed in cell lysis buffer containing 20 mM Tris–HCl (pH 7.5), 150 mM NaCl, 1 mM Na2EDTA, 1 mM EGTA, 1% Triton, 2.5 mM sodium pyrophosphate, 1 mM beta-glycerophosphate, 1 mM Na3VO4, 1 µg/ml leupeptin (Cell Signaling, Danvers, MA) and protease inhibitor cocktail (Roche, Nutley, NJ) and centrifuged at 13,500 rpm for 15 min at 4°C. Protein concentrations were determined using a BioRad assay. Conditioned media isolated form the basolateral chamber were also centrifuged at 13,500 rpm for 15 min at 4°C and supernatant collected prior to analysis. Conditioned media and protein lysates were loaded in each lane in sample buffer (2% SDS, 10% glycerol, 0.001% bromophenol blue, and 0.05 m Tris–HCl, pH 6.8), separated on 4–12% SDS–PAGE (Invitrogen) under reducing conditions and to transferred nitrocellulose using an iBlot system (Invitrogen). Blots were probed with anti-Cat-D (1:500) or anti-MREG (1:500) or anti-Actin (1:500) antibody. Appropriate horseradish peroxidase-conjugated secondary antibodies were subsequently used for detection. β-actin (Santa Cruz) was used as a loading control. Visualization of the primary antibody was performed by incubating membranes with the corresponding peroxidase-conjugated secondary antibody (1:4500; Thermo Scientific) for 1 h at room temperature. Blots were developed by enhanced chemiluminescence (ECL-West-Pico) (Thermo Scientific) either on a film or captured on ImageQuant™ LAS 400 image reader (GE Healthcare, Mickleton, NJ). Immunoblots were scanned and relative band density was determined using ImageJ v1.34 software.
Cat-D activity
Cat-D activity was measured in conditioned media from shRNA Control (C2) and MREG (M5) using a fluorogenic substrate according to the manufacturer’s protocol (Sigma-Aldrich) and our previous studies (Damek-Poprawa et al., Reference Damek-Poprawa, Diemer, Lopes, Lillo, Harper, Marks, Wu, Sparrow, Rachel, Williams and Boesze-Battaglia2009). The substrate is a fluorogenic decapeptide, MCAc–Gly–Lys–Pro–Ile–Leu–Phe–Phe–Arg–Leu–Lys–(Dnp)D–Arg–NH2, in which MCA is quenched by DNP. Upon proteolytic cleavage by Cat-D, the substrate is dequenched, and MCA peptide fluorescence is followed over time. Substrate was added to the samples at a final concentration of 20 µM, and fluorescence (λ ex = 328 nm, λ em = 393 nm) was followed for 30 min at 37°C at 2-min intervals. The fluorescence of 1.0 nmol of the fluorogenic substrate was determined from a standard curve using known concentrations of MCA peptide. The Cat-D activity of each sample was calculated using the following equation;
 $${\rm{Units/ml = }}\Delta F/T \times D/V_{{\rm{enz}}} \times 1/F{\rm{(1 nmol),}}$$
where ΔF = increase in fluorescence during the time period of linearity in fluorescence measurement; T = time (min), when increase in fluorescence is linear; D = dilution factor of enzyme sample; V enz = volume of enzyme sample (ml); F (1 nmol) = fluorescence of 1 nmol of fluorogenic substrate. One unit of activity is defined as nmol of MCA peptide release per min per ml of enzyme sample. Activities were normalized to the amount of secreted Cat-D determined by immunoblot.
LDH cytotoxicity assay
Cell membrane integrity was determined by measuring lactate dehydrogenase (LDH) activity released into the culture medium using an assay kit (Cayman Chemical, Ann Arbor, MI). Here LDH catalyzes the reduction of NAD+ to NADH and H+ by oxidation of lactate to pyruvate. In the second step of the reaction, diaphorase uses the NADH and H+ formed to catalyze the reduction of a tetrazolium salt (INT) to formazan, which absorbs strongly at 490–520 nm. The amount of formazan produced is proportional to the amount of LDH released into the culture media as a result of cytotoxity or cell lysis. LDH activity was measured in conditioned media from C2 and M5 cells up to 10 days in culture as formazan produced detected at 492 nm using an automated microplate reader. The amount of LDH was calculated using linear regression of the LDH standard curve. One unit of activity was defined as the amount of LDH that catalyzes the reaction of 1 µmol of substrate/min.
Gel RT-PCR analysis
RNA was isolated using Qiagen RNeasy Mini Kit (Valencia, CA) and yield determined by measuring absorbance at 260 nm (Gee et al., Reference Gee, Angel, Ma, Mishra, Gajanayaka, Parato and Kumar2006). 1 µg of total RNA was converted into cDNA using superscipt first strand synthesis system for RT-PCR (Invitrogen). PCR amplification for gel PCR analysis was performed using PCR mastermix solution (Sigma-Aldrich) and primers specific for human MREG and glyceraldehyde-3-phosphate (GAPDH) used as an endogenous control. cDNA samples were run on 1% agarose gels containing ethidium bromide and imaged under UV light.
Confocal microscopy
Immunohistochemistry was performed on frozen sections of 6- and 18-month-old mouse retinas (Boesze-Battaglia et al., Reference Boesze-Battaglia, Song, Sokolov, Lillo, Pankoski-Walker, Gretzula, Gallagher, Rachel, Jenkins, Copeland, Morris, Jacob, Yeagle, Williams and Damek-Poprawa2007). Eyecups were fixed in 4% paraformaldehyde in PBS (pH 7.4) overnight at 4°C, cryoprotected in 30% sucrose, and embedded in OCT. The 7 μm sections were successively stained with antilaminin (1:100) followed by secondary antibody, Alexa 594 donkey–antirabbit (1:500), followed by Alexa Fluor 488 phalloidin (1:100). In parallel studies, sections were stained with anti-Cat-D (1:100) followed by Alexa 555 antirabbit secondary antibody (1:1000). Controls were incubated with secondary antibodies only. Nuclei were visualized with Hoechst 33258. Images were captured on a Nikon A1R live cell confocal imaging system. Data were analyzed using Nikon Elements AR Software ver.3.2
Immunoelectron microscopy
Ultrathin sections for transmission electron microscopy were obtained from LR White-embedded mouse (Mreg +/+) retinas. They were double-labeled with Cat-D and MREG antibodies, generated in rabbit and mouse, respectively (see above). Rabbit IgG antibodies, conjugated to 15-nm gold particles, and mouse IgG antibodies, conjugated to 10-nm gold particles, were used as secondary antibodies.
Statistical analyses
Data were analyzed using SigmaStat version 3.1. Data are reported as mean ± s.d. or SEM as indicated. Statistical analysis used a one-way ANOVA Dunn’s test, results with P < 0.05 were considered significant.
Results
MREG co-localizes with the aspartyl protease, Cat-D in degradative compartments
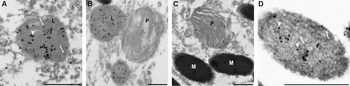
Our previous studies documenting reduced Cat-D activity with the subsequent accumulation of lipofuscin in aged RPE cells isolated from Mreg −/− mice, suggest a protective role for MREG in maintaining RPE health. Although MREG is known to be associated with small intracellular vesicles, its distribution profile relative to Cat-D is unknown. Therefore, in order to decipher the relationship between MREG function and Cat-D processing, we analyzed the distribution profile of MREG and Cat-D in RPE cells by Immuno-EM. Cat-D and MREG were both abundant in lysosomes and to a lesser extent in phagosomes (Fig. 1A and 1B). MREG was also localized to melanosomes (Fig. 1C and 1D) consistent with its putative role as a cargo receptor on these organelles (Damek-Poprawa et al., Reference Damek-Poprawa, Diemer, Lopes, Lillo, Harper, Marks, Wu, Sparrow, Rachel, Williams and Boesze-Battaglia2009; Ohbayashi et al., Reference Ohbayashi, Maruta, Ishida and Fukuda2012; Rachel et al., Reference Rachel, Nagashima, O’Sullivan, Frost, Stefano, Marigo and Boesze-Battaglia2012).
MREG localizes to Cat-D containing vesicles. (A–D) Immuno-EM of MREG localization in RPE cells. Ultrathin sections obtained from LR White-embedded Mreg +/+ mouse retinas were double-labeled with rabbit Cat-D polyclonal antibody and mouse MREG mAb165. Goat antirabbit IgG antibodies, conjugated to 15 nm gold particles, and antimouse IgG, conjugated to 10-nm gold particles, were used as secondary antibodies, respectively. Arrowheads indicate examples of Cat-D labeling (large particles), and arrows indicate examples of MREG label (small particles). Panel A. Labeling of a lysosome, L. Panel B. Labeling of lysosomes and a phagosome, P. Panel C, labeling of a phagosome and melanosomes, M. Panel D is a higher magnification of the melanosome on the left in panel C; the image has been made brighter so that the gold particles are evident against the darkly staining melanin. Scale bars = 500 nm.

Mreg knockdown leads to aberrant secretion of Cat-D (48 kDa)
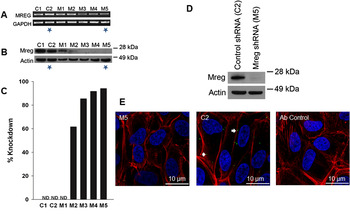
To determine the effect of diminished MREG expression on the disposition of Cat-D, we generated several stable ARPE19 MREG knockdown cell lines using shRNA lentiviral particles. The gene silencing efficiency from five different clones designated M1–M5 (Sigma-Aldrich) was analyzed by agarose gel RT-PCR (Fig. 2A) and western blotting (Fig. 2B). MREG protein knockdown varied from none (M1) to <60% (M2) to over 90% knockdown in M5 cells (Fig. 2C). In these studies, we used M5 (MREG knockdown) and C2 (nontarget shRNA) as a control (Fig. 2D). MREG expression in control cells (C2) was further confirmed as the appearance of intracellular MREG positive puncta, with almost a complete absence of these structures in the M5 clone (Fig. 2E).
Mreg shRNA gene silencing efficiency in ARPE19 cells. (A) Quantitation of MREG mRNA. RT-PCR products separated on agarose gels from five MREG lentiviral clones designated M1–M5, control shRNA with no shRNA insert (C1) and control shRNA containing nontarget shRNA (C2) demonstrating MREG shRNA knockdown efficiency. GAPDH is shown as an endogenous control. Stars indicate cells used in subsequent studies. (B) Immunoblot analysis showing MREG protein knockdown in shRNA ARPE19 cells. Actin is shown as a loading control. (C) Quantitation of % knockdown of MREG protein normalized to actin. (D) Immunoblot of control (C2) and MREG knockdown (M5) ARPE19 cells used for immunofluorescence. (E) Immunofluorescence localization of MREG in shRNA ARPE19 cells. Control (C2) and MREG knockdown (M5) ARPE19 cells were double labeled with anti-MREG mAb and 647-phalloidin (actin) Hoescht 33382. Bar, 10 µm.

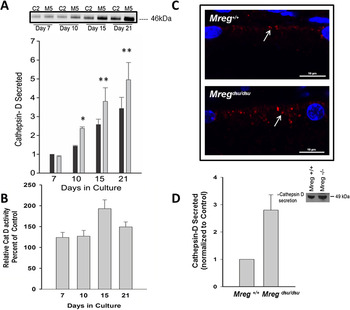
It is well documented that defective Cat-D processing leads to its mis-sorting and nonspecific secretion in MCF-7 cells (Capony et al., Reference Capony, Braulke, Rougeot, Roux, Montcourrier and Rochefort1994; Kokkonen et al., Reference Kokkonen, Rivinoja, Kauppila, Suokas, Kellokumpu and Kellokumpu2004), Human umbilical vein endothelial cells (HUVEC), and endothelial cells types (Erdmann et al., Reference Erdmann, Ricken, Hummitzsch, Merkwitz, Schliebe, Gaunitz, Strotmann and Spanel-Borowski2008). To determine if this was the case in the absence of MREG, we analyzed extracellular Cat-D from M5 and C2 ARPE19 cells. ARPE19 cells were cultured for up to 21 days and basolateral conditioned media analyzed for Cat-D levels and activity on day 7, 10, 15, and 21. MREG knockdown (M5) cells exhibited increased secretion of the 48 kDa, intermediate form of Cat-D. Within 10 days, there was a 40% increase in secreted Cat-D with subsequently more Cat-D secreted by 15 and 21 days (Fig. 3A). Increased Cat-D secretion was also observed in C2 control cells albeit to a lesser extent than in M5. Similar results were obtained with RPE-J cells using a rat-specific shRNA (data not shown). The increase in Cat-D in the C2 cells is not entirely unexpected, given the extensive secretion of Cat-D in transgenic mice (Rakoczy et al., 1996a). The increase in Cat-D secretion by the M5 cells was not due to increased cell lysis since there was no change in LDH release between C2 and M5 cells (Table 1). Furthermore, loss of MREG did not alter Cat-D mRNA levels in either the Mreg dsu/dsu RPE (Damek-Poprawa et al., Reference Damek-Poprawa, Diemer, Lopes, Lillo, Harper, Marks, Wu, Sparrow, Rachel, Williams and Boesze-Battaglia2009) or the M5 cells (data not shown).
Elevated Cat-D secretion in ARPE19 cells and primary cultures of Mreg dsu/dsu RPE. (A) Conditioned media from basolateral side was collected from shRNA ARPE19 control (C2) and MREG (M5) knockdown cells after 7, 10, 15, and 21 days in culture and analyzed for Cat-D secretion. Cat D secreted is presented as mean ± SEM, n = 4. *Significantly different in M5 cells compared with controls (C2); at 10 days, P < 0.01 and **significantly different at 15 and 21 days, P < 0.05. (B) Cat-D activity (units/ml) in conditioned media from C2 and M5 cells after 7, 10, 15, and 21 days in culture. Presented as mean ± SEM, n = 3. *Activity is significantly different at all time points, P < 0.05. (C) Cat-D labeling in eyecups isolated from 4-month old Mreg dsu/dsu and Mreg +/+ mice. This is a representative image (two animals, four eyes, assessment of 10 areas in each eye). (D) Quantitation of pro-Cat D secretion from primary RPE cells extracted from 6-week old Mreg +/+ and Mreg dsu/dsu mice. Inset, Western blot of data shown in D.

Cell lysis

Lactate dehydrogenase activity, expressed as mUnits/ml, was determined in conditioned media isolated from C2 and M5 cells at the indicated time points. Results are an average of four analyses ± SEM.
* P > 0.050.
To determine if the secreted Cat-D had activity, fluorogenic substrates were used to quantify activity of the secreted Cat-D. Based on the size of the secreted enzyme, 48 kDa (Fig. 3A) and activity levels (Fig. 3B), we suggest that the isolated Cat-D variant is not the inactive pro-enzyme but an intermediate (minimally active) form of Cat-D. Activity of the secreted Cat-D was increased upon MREG depletion (Fig. 3B), however, when normalized to the levels of Cat-D protein, this increase was only moderately significant at days 10 and 15 (Table 2).
Normalized Cat-D activity

Degradation of a fluorogenic Cat-D substrate was measured in basolateral conditioned media isolated from C2 and M5 cells at the indicated time points. Activity was normalized to Cat-D protein as determined by quantitative Western blots. Results are an average of three experiments ± SEM.
** P > 0.100 for days 7 and 21, *P < 0.05 for days 10 and 15.
Missorting and incomplete maturation of Cat-D is associated with neurodegenerative disorders characterized by lipofuscinosis (Woessner, Reference Woessner1977; Koike et al., Reference Koike, Shibata, Ohsawa, Nakanishi, Koga, Kametaka, Waguri, Momoi, Kominami, Peters, Figura, Saftig and Uchiyama2003; Siintola et al., Reference Siintola, Partanen, Stromme, Haapanen, Haltia, Maehlen, Lehesjoki and Tyynela2006). In the Mreg dsu/dsu mouse, concomitant with lack of Cat-D processing, there was accumulation of retinal debris in the form of lipofuscin (Damek-Poprawa et al., Reference Damek-Poprawa, Diemer, Lopes, Lillo, Harper, Marks, Wu, Sparrow, Rachel, Williams and Boesze-Battaglia2009). To correlate our in vitro results with the Mreg dsu/dsu mouse model, we analyzed Cat-D distribution in RPE cells and secretion from cultures of primary RPE cells isolated from Mreg dsu/dsu and Mreg +/+ mice. Cat-D positive puncta were observed in RPE from both mice. However, there was substantially more Cat-D containing puncta and aggregates in the Mreg dsu/dsu mice (Fig. 3C). Furthermore, when RPE cells from these mice were cultured and Cat-D secretion measured over a 10-day period, an almost twofold increase in pro-Cat-D secretion was observed (Fig. 3D, Western blot inset). Loss of MREG results in increased laminin deposits in the BM by IHC.
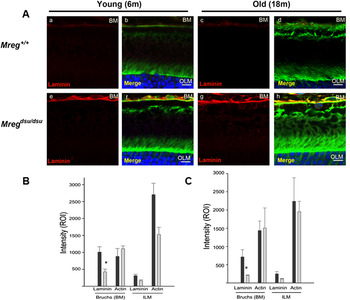
In the RPE, accumulation of Cat-D results in features that resemble age-related retinal degenerative changes including the presence of basal laminar deposits and accumulation of POS breakdown products. We have already observed an accumulation of POS breakdown products as well as defective Cat-D processing in RPE devoid of MREG. In this next study, we sought to determine if the stability of the RPE-BM interface was compromised with the excessive secretion of Cat-D by assessing laminin in BM and choroid. Laminin was found to be localized to the choroid and BM of both Mreg dsu/dsu and Mreg +/+ mice (Fig. 4A). Quantification of the intensity of laminin in these two regions (Erdmann et al., Reference Erdmann, Ricken, Hummitzsch, Merkwitz, Schliebe, Gaunitz, Strotmann and Spanel-Borowski2008) showed an enhancement of laminin in the Mreg dsu/dsu mice when compared with Mreg +/+ mice in BM (Fig. 4B) as early as 6 months of age, with a statistically significant increase in laminin levels in the Mreg dsu/dsu retinas [relative mean fluorescence intensity (ROI), 1008. 335 ± 159.6 and 424.50 ± 82.3 with P < 0.05, respectively]. Laminin staining remained elevated in the Mreg dsu/dsu BM at 18 months old with an ROI of 715.63 ± 196.19, compared with Mreg +/+ mice 211.45 ± 6.10 (P < 0.05).
Increased laminin in Bruch’s membrane in Mreg dsu/dsu mice. (A) Immunofluorescence analysis of laminin in eyecups isolated from young (6 months) and old (18 months) Mreg dsu/dsu and Mreg +/+ mice. Panels a, b: Mreg +/+ 6 m; Panels c, d: Mreg +/+ 18 m; Panels e, f: Mreg dsu/dsu 6 m; Panels g, h: Mreg dsu/dsu 18 m; Nuclei are stained with Hoescht 33258 and sections counterstained with phalloidin (actin) bar, 10 µm. (B) Analysis of laminin levels in 6-month old animals. ROI of laminin in area of BM and OLM (as control). Values are average from four animals, four eyes and assessment of 10 areas in each eye. *Significant difference between Mreg dsu/dsu and Mreg +/+ mice of laminin in BM, P < 0.05. (C) Analysis of laminin levels in 18-month old animals. ROI of laminin in area of BM and OLM (as control). Values are average from four animals, four eyes, and assessment of 10 areas in each eye. *Significant difference between Mreg dsu/dsu and Mreg +/+ mice of laminin in BM, P < 0.05.

Discussion
The involvement of minimally processed Cat-D in the pathogenesis of metastatic breast and prostate cancer, neurodegenerative disease as well as retinal degeneration seen in age-related macular degeneration (AMD) is well documented (Woessner, Reference Woessner1977; Rakoczy et al., 1996a; Koike et al., Reference Koike, Shibata, Ohsawa, Nakanishi, Koga, Kametaka, Waguri, Momoi, Kominami, Peters, Figura, Saftig and Uchiyama2003; Siintola et al., Reference Siintola, Partanen, Stromme, Haapanen, Haltia, Maehlen, Lehesjoki and Tyynela2006). In these studies, we further describe a novel regulator of Cat-D processing, a small intracellular protein called MREG. This protein appears to be required for the efficient processing of Cat-D; loss of MREG is linked to decreased intracellular mature (34 kDa) Cat-D activity as well as the accumulation of Cat-D substrate in the RPE (Damek-Poprawa et al., Reference Damek-Poprawa, Diemer, Lopes, Lillo, Harper, Marks, Wu, Sparrow, Rachel, Williams and Boesze-Battaglia2009). In this study, we explore the disposition of Cat-D in the extracellular media, we demonstrate that a minimally processed 48 kDa form of Cat-D is secreted in RPE cells devoid of MREG, concomitant with this secretion is an increase in extra cellular matrix (ECM) proteins, specifically, laminin and an apparent thickening of BM.
The relationship between loss of MREG function and Cat-D dysfunction and Cat-D secretion in the Mreg dsu/dsu mouse and age-related pathological changes are particularly relevant to our understanding of RPE health given the rapidly accumulating evidence suggesting that age-associated progressive retinal dystrophy is a multifactorial disease with numerous environmental stressors contributing to the pathology (Tikellis et al., Reference Tikellis, Robman, Dimitrov, Nicolas, McCarty and Guymer2007; Kanda et al., Reference Kanda, Abecasis and Swaroop2008). The metabolic demands on the RPE alone are considerable and further exacerbated by their location in the highly oxygenated environment of the outer retina and their exposure to light (Delcourt et al., Reference Delcourt, Cristol, Leger, Descomps and Papoz1999; Cai et al., Reference Cai, Nelson, Wu, Sternberg and Jones2000; Zarbin, Reference Zarbin2004; Kanda et al., Reference Kanda, Abecasis and Swaroop2008) and references therein. Environmental and metabolic factors are known to re-program protein sorting and processing decisions in disease models (Rakoczy et al. 1996a; Haque et al., Reference Haque, Banik and Ray2008; Hu et al., Reference Hu, Roth, Brooks, Luty and Karpatkin2008; Khalkhali-Ellis et al., Reference Khalkhali-Ellis, Abbott, Bailey, Goossens, Margaryan, Gluck, Reuveni and Hendrix2008; Zaidi et al., Reference Zaidi, Maurer, Nieke and Kalbacher2008). A similar paradigm may contribute to RPE dysfunction due to altered lysosomal hydrolase trafficking and sorting as illustrated best by Cat-D. Although the main physiological housekeeping role of Cat-D is protein turnover, in pathogenic lesions, Cat-D actively degrades proteins, boosts inflammatory responses and thereby may promote the initiation or advancement of blinding diseases (Rakoczy et al. 1996a; Haque et al., Reference Haque, Banik and Ray2008; Hu et al., Reference Hu, Roth, Brooks, Luty and Karpatkin2008; Khalkhali-Ellis et al., Reference Khalkhali-Ellis, Abbott, Bailey, Goossens, Margaryan, Gluck, Reuveni and Hendrix2008; Zaidi et al., Reference Zaidi, Maurer, Nieke and Kalbacher2008). The critical change that converts Cat-D from a physiological to a pathological player is not known although several lines of evidence suggest that stress-mediated protein missorting of trafficking proteins plays a role in the switch. For example, uptake of oxidized-LDL (low density lipoprotein) results in diminished Cat-D maturation with subsequent secretion of Cat-D into the ECM (Hoppe et al., Reference Hoppe, Marmorstein, Pennock and Hoff2001, 2004a,Reference Hoppe, O’Neil, Hoff and Searsb). Treatment of primary cultures with oxidized LDLs impairs intracellular Cat-D trafficking (Hoppe et al., Reference Hoppe, Marmorstein, Pennock and Hoff2001) and alters MREG levels (Frost, 2011).
The pathogenic impact of improperly processed inactive or minimally active Cat-D occurs both intracellularly and extracellularly, thereby affecting RPE as well as BM and choroid health. Intracellular Cat-D regulates cholesterol efflux from LE/Lys-mediated by the ATP-binding cassette protein ABCA1, a cholesterol transporter. This observation is of particular relevance to our studies because allelic variants of ABCA1 have recently been associated with susceptibility to AMD (Zareparsi et al., Reference Zareparsi, Buraczynska, Branham, Shah, Eng, Li, Pawar, Yashar, Moroi, Lichter, Petty, Richards, Abecasis, Elner and Swaroop2005; Tikellis et al., Reference Tikellis, Robman, Dimitrov, Nicolas, McCarty and Guymer2007). In addition, cholesterol and cholesteryl ester deposits are observed beneath the RPE in AMD thus implicating abnormal cholesterol trafficking regulated by Cat-D in disease progression (Malek et al., Reference Malek, Li, Guidry, Medeiros and Curcio2003; Li et al., Reference Li, Chung, Presley, Malek, Zhang, Dashti, Li, Chen, Bradley, Kruth and Curcio2005). In our own studies, MREG-mediated loss of Cat-D activity resulted in delayed phagosome maturation which over time (18 month old mice) lead to lipofuscinosis in these mice (Damek-Poprawa et al., Reference Damek-Poprawa, Diemer, Lopes, Lillo, Harper, Marks, Wu, Sparrow, Rachel, Williams and Boesze-Battaglia2009). Transgenic mice overexpressing inactive Cat-D show a similar phagosome accumulation as well as age-dependent photoreceptor degeneration (Rakoczy et al., 2002). The secretion of either unprocessed or minimally active Cat-D is also expected to shift the balance of RPE–BM-choroid health over time. For example, transgenic mice expressing nonfunctional Cat-D develop retinal abnormalities that resemble age-related macular degenerative changes including basal laminar deposits (Rakoczy et al., 2002). In the studies presented here, increased laminin staining indicative of BM thickening was observed in aging Mreg dsu/dsu mice.
On a molecular level, the generation of active Cat-D involves several posttranslational modifications; Cat-D is expressed in a full-length inactive form (52 kDa) which then undergoes a series of proteolytic processing steps to produce an active 34 kDa form (Deguchi et al., Reference Deguchi, Yamamoto, Yoshimori, Sugasawa, Moriyama, Futai, Suzuki, Kato, Uyama and Tashiro1994; Delbruck et al., Reference Delbruck, Desel, von Figura and Hille-Rehfeld1994; Zaidi et al., Reference Zaidi, Maurer, Nieke and Kalbacher2008). In the inactive Cat-D transgenic mouse, there was a subsequent elevation of Cat-S (Rakoczy et al., 2002). Whether elevated Cat-S in our in vitro studies could represents a compensatory mechanism or is due to lysosome alkalinization secondary to the accumulation of debris due to large amounts of minimally active Cat-D is unknown (Damek-Poprawa et al., Reference Damek-Poprawa, Diemer, Lopes, Lillo, Harper, Marks, Wu, Sparrow, Rachel, Williams and Boesze-Battaglia2009). Similar in vitro studies are underway in which A2E is added to C2 and M5 cultures to help to clarify this relationship.
The molecular mechanism by which diminished MREG may contribute to increased Cat-D secretion while speculative likely involves the newly described role of MREG as a cargo receptor for dynein-dependent processes (Ohbayashi et al., Reference Ohbayashi, Maruta, Ishida and Fukuda2012). Cat-D maturation in the Mreg dsu/dsu RPE may be affected by the inefficient retrograde trafficking of intermediate transport vesicles to the perinuclear region of the cell where lysosomes are typically abundant. Secretory lysosomes are commonly found in cells of hematopoietic lineage with exceptions including pigmented cells and contain the relevant degradative proteins. ARPE19 cells, for example, release Fas ligand-containing microvesicles derived from secretory lysosomes (McKechnie et al., Reference McKechnie, King, Fletcher and Braun2006). In the absence of MREG, we propose that lysosome-related organelles including secretory lysosomes may be enhanced and proteases secreted (Blott & Griffiths, Reference Blott and Griffiths2002). Furthermore, we have shown that loss of MREG function facilitates an increase in the size of micromelanosomes in the choroid of the HPS BLOC-2 mutants ruby, ruby2, and cocoa, while a transgenic mouse overexpressing melanoregulin corrects the size of RPE macromelanosomes in Oa1(ko/ko) mice. Collectively, these results suggest that MREG levels regulate aspects of the enzymatic machinary involved in melanosomogenesis (Rachel et al., Reference Rachel, Nagashima, O’Sullivan, Frost, Stefano, Marigo and Boesze-Battaglia2012). Herein, we propose that one aspect of loss of MREG function is enhanced secretion of CatD containing lysosomes.
Collectively, these studies, in combination with our previously published work, suggest that the Mreg dsu/dsu mouse is a viable model in which to understand the implications of age-related changes in RPE degradative function. Because loss of the Mreg dsu allele is not lethal, it leads to slow age-dependent changes in RPE and has the potential to allow us to differentiate between the housekeeping and pathogenic functions of Cat-D. In summary, these studies suggest that loss of function Mreg dsu gene mutations may confer enhanced susceptibility to age-related retinal degenerative diseases, either due to specific genetic abnormalities or due to environmental stressors.
Acknowledgments
We would like to thank the SDM-live cell-imaging core for data analysis, Dr. Nancy Philp for her critical reading of the manuscript and insight into retinal pathology, and Dr. Alan Laties for helpful discussions. This work was supported by NIH grant R01 EY010420 and R21EY018705 to KBB, R01 EY013434 to CHM, Vision Research Core Grant EY001583 (KBB and CHM), and R01 EY07042 to DSW. DSW is an RPB Jules and Doris Stein Professor.