Introduction
Fetal exposure to a hostile intrauterine environment can lead to permanent structural and/or functional damage in tissues and organs. Emerging evidence suggests that significant alterations in maternal nutrition may cause severe injuries in fetal development.Reference Langle-Evans1 Additionally, several studies have shown that high maternal caloric intake is one of the main factors that predispose to child obesity and metabolic syndrome.Reference Parrino, Vinciguerra and La Spina2 According to a recent report of the World Health Organization,3 the global prevalence of obesity among children and adolescents aged 5–19 years increased from 0.8% in 1975 to 6.8% in 2016. Other complications may also affect the offspring in adult life, such as altered glucose homeostasis, hypertension, dyslipidaemia, altered vascular endothelial function and impairment of renal function.Reference Armitage, Taylor and Poston4–Reference Buettner, Schölmerich and Bollheimer6
Several animal models have been developed with the aim of studying obesity and metabolic syndrome. Studies indicate that prolonged treatment of rodents with a high-fat diet (HFD) can lead to an increase of 10%–20% in body weight of these animals, when compared to control groups,Reference Buettner, Schölmerich and Bollheimer6–Reference Ikemoto, Takahashi, Tsunoda, Maruyama, Itakura and Ezaki9 and the lipid contents of these diets vary within the range of 30%–78%Reference Buettner, Schölmerich and Bollheimer6,Reference Hariri and Thibault10 . Curiously, the metabolic responses of these animals submitted to HFDs containing different amounts of lipids varies considerably,Reference Schemmel, Mickelsen and Tolgay11–Reference Chalkley, Hettiarachchi, Chisholm and Kraegen14 including those that are fed with HFD during pregnancy.Reference Kereliuk, Brawerman and Dolinsky15
Evidences from human and animal studies shows that maternal obesity increases the risk of chronic kidney disease in the offspring.Reference Hsu, Hou, Lee, Chan and Tain16−Reference Glastras, Chen and Teh19 Furthermore, a sudden weight gain in experimental models may result in glomerular hyperfiltration in dams and in the offspring.Reference Hall20,Reference Paixão and Alexander21 In the long term, this problem can lead to a significant loss in the number of nephrons and a reduction of renal function.Reference Hall, Carmo, Silva, Juncos, Wang and Hall22 Thus, the aim of this study was to investigate the renal and metabolic effects of a maternal diet with different lipid contents for the offspring of Wistar rats.
Material and methods
Male (350 g) and female (>180 g) Wistar rats (90–120-d-old) were housed separated by sex in cages under standard conditions with a 12 h light/dark cycle, controlled temperature (22 ± 2 °C) and free access to water and standard show diet. The female rats were put in the same cage as males overnight for mating. Pregnancy was confirmed by the presence of sperm in the vaginal smear. Once pregnant, the females were housed in individual cages and allowed free access to water, standard chow diet or HFD (28% or 40% of lipids) during gestational and lactation periods. After birth, the female offspring of 1, 7, 30 and 90-d-old were divided into the following groups:
1) Control (CNT) – offspring of dams (n = 7) that consumed a standard chow diet (3.5% of lipids) and water ad libitum;
2) Experimental 1 (EXP1) – offspring of dams (n = 6) that were exposed to a HFD (28% of lipids) and water ad libitum;
3) Experimental 2 (EXP2) – offspring of dams (n = 9) that were exposed to a HFD (40% of lipids) and water ad libitum.
During treatment, maternal parameters were evaluated such as food intake, daily caloric intake, estimated macronutrient intake (carbohydrates, proteins and lipids), weight gain, number of pups per litter and blood glucose. Regarding food intake, the chows were weighted over five consecutive days at the same hour. The difference between the amount of chow consumed in the first and second measure were considered as the daily dietary consumption. The body weight variation was obtained by the difference between the measures of the initial (day 1 of pregnancy) and final weight (day 20 of pregnancy). The blood glucose was verified with a glucometer (Accu-Check® Active, Santo André, SP, Brazil) by a blood sample collected from the animal tail on gestational day 20. After weaning (21-d-old), the offspring were allowed free access to water and standard chow diet. Offspring of 1, 7 and 30-d-old were submitted to evaluations such as body weight, and renal weight–body weight ratio. Before surgery for kidney removal, the adult offspring (90-d-old) were submitted to functional experiments such as blood glucose, total cholesterol (TC), triglycerides (TGL), systolic blood pressure (SBP), renal function evaluation and morphometric analysis.
Dietary composition
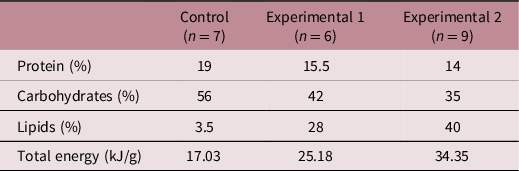
The centesimal composition of the three diets and its total energy content are shown in Table 1. The HFD of the EXP1 dams consisted of the addition of hypercaloric food to 48 g of a standard chow diet in the following proportions: 12 g of roasted peanuts, 4 g of milk chocolate, 2 g of corn starch and 17 g of lard.Reference Duarte, Fonseca and Manzoni23 All of these ingredients were mixed and offered to the animals as pellets. The HFD of the EXP2 dams consisted of the addition of 18 g of roasted peanuts, 5 g of milk chocolate, 3 g of corn starch and 26 g of lard to 64.65 g of a standard chow diet.Reference Correia-Santos, Suzuki and Anjos24
Diet composition of Control, Experimental 1 and Experimental 2 groups

Dietary composition of the Control (standard chow diet), Experimental 1 (high-fat diet – 28%) and Experimental 2 (high-fat diet – 40%) diets. Protein, carbohydrates and lipids content in percentage and total energy in kJ/g.
Surgery and histology
The 1, 7, 30 and 90-d-old offspring of Control (1D = 10, 7D = 8, 30D = 11 and 90D = 11), Experimental 1 (1D = 6, 7D = 7, 30D = 7 and 90D = 8) and Experimental 2 (1D = 6, 7D = 12, 30D = 9 and 90D = 14) groups were anaesthetised with Halothane (Cristália, Produtos Químicos e Farmacêuticos Ltda; Itapira, SP, Brazil) and had their kidneys carefully removed and weighted. After surgery, the animals were euthanised with an anaesthesia overdose (Thiopental 2.5%, 150 mg/kg). Kidneys were placed in methacarn fixative solution for 24 h, followed by a 70% alcohol solution, until its paraffin inclusion. After obtaining the paraffin blocks, they were cut into 5 µm thick sections using a microtome. Then, the sections were extended on glass slides, previously gelatinised and stored at 60 °C for 24 h to remove the excess of paraffin.
Morphometric analysis
The kidney tissue sections were stained with Toluidine Blue and the images were obtained by a scanning optical microscope (Leica Biosystems, Wetzlar, Hessen, Germany) and evaluated using the s HL Image++ 97 software (Western Vision Software, Salt Lake City, Utah, USA). Twenty renal corpuscles were selected for analysis of the following parameters: renal corpuscle, glomerular tuft and capsular space areas of Control (n = 11), Experimental 1 (n = 8) and Experimental 2 (n = 14) groups.
Renal function evaluation: glomerular filtration rate (GFR) and urinary protein excretion (UPE)
These experiments were performed on the 90-d-old pups of Control (n = 11), Experimental 1 (n = 8) and Experimental 2 (n = 14) groups. The analysis of GFR was performed by Creatinine Clearance, an enzyme-colorimetric method (Labtest Diagnóstica Ltda, Lagoa Santa, Minas Gerais, Brazil). The pups were housed in metabolic cages for 24 h for adaptation. Then, their urine samples were collected for the 24 h following the adaptation period. A tail blood sample was also collected for plasma creatinine evaluation. The UPE was obtained by a colorimetric method using pyrogallol red (Labtest Diagnóstica Ltda, Lagoa Santa, Minas Gerais, Brazil). Creatinine concentrations and UPE were measured spectrophotometrically through the specified protocol absorbances, as previously described by Roza et al.Reference Roza, Possignolo and Palanch25
TC and TGL
These experiments were performed on the 90-d-old pups of Control (n = 11), Experimental 1 (n = 8) and Experimental 2 (n = 14) groups and were determined by the enzymatic-Trinder method (Labtest Diagnóstica Ltda, Lagoa Santa, Minas Gerais, Brazil). The concentrations were measured spectrophotometrically through the specified protocol absorbances, as previously described by Tanko et al.Reference Tanko, Eze, Daja, Jimoh, Mohammed and Musa26
SBP
The SBP was determined in 90-d-old pups of Control (n = 11), Experimental 1 (n = 8) and Experimental 2 (n = 14) groups and performed by plethysmography. The signals were detected with a pneumatic pulse transducer/amplifier coupled to the PowerLab software (ADInstrutments, Dunedin, New Zealand) for amplification and converted by the LabChart 7 Pro software (ADInstrutments, Dunedin, New Zealand) as previously described by Roza et al.Reference Roza, Possignolo and Palanch25 The values were obtained in mmHg. The measurements were performed for five consecutive days at the same hour, and the arithmetic mean of the values per day were considered. After the last day, a new arithmetic mean was obtained and this value was considered as definitive.
Statistical analysis
The statistical analysis was performed using the GraphPad Prism software (version 5.00). First, it was verified whether the data presented a normal distribution or not using the Kolmogorov–Smirnov test. For data with a normal distribution, the ANOVA with a Newman–Keuls’ post-test was used as a parametric test. For those that did not present this distribution pattern, a non-parametric test was used (Kruskal–Wallis with Dunn’s post-test). Data are expressed as mean ± SEM. The significance level was p < 0.05.
Results
Maternal outcomes
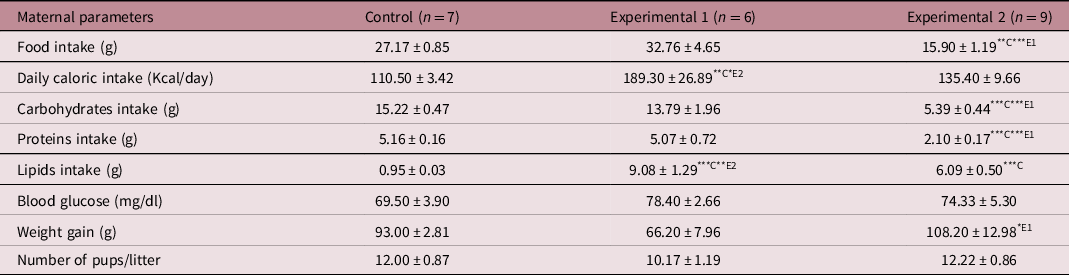
There was no significant difference in food intake between the CNT and EXP1 groups. However, EXP2 consumed less chow when compared to the other groups. Regarding daily caloric intake, we observed that EXP1 consumed more calories than the other groups. When we analysed the estimated consumption of macronutrients (proteins, carbohydrates and lipids), we observed a lower ingestion of carbohydrates and proteins in EXP2 when compared to the others. Both experimental groups ingested more lipids when compared to the CNT, moreover EXP1 consumed more lipids than EXP2. However, EXP2 showed a higher weight gain in comparison to EXP1. There was no significant difference in blood glucose levels and number of pups per litter among the studied groups (Table 2).
Maternal food, daily caloric, carbohydrates, proteins and lipids intake, blood glucose, weight gain and number of pups per litter of Control, Experimental 1 and Experimental 2 groups

Maternal food, daily caloric, carbohydrates, proteins and lipids intake and blood glucose, weight gain and number of pups per litter: values are expressed as mean ± SEM (ANOVA with Newman–Keuls post-test). Significance level: p < 0.05. ***C: p < 0.001 versus Control; **C: p < 0.01 versus Control; **E2: p < 0.01 versus Experimental 2; *E2: p < 0.05 versus Experimental 2; ***E1: p < 0.001 versus Experimental 1; *E1: p < 0.05 versus Experimental 1.
Offspring outcomes
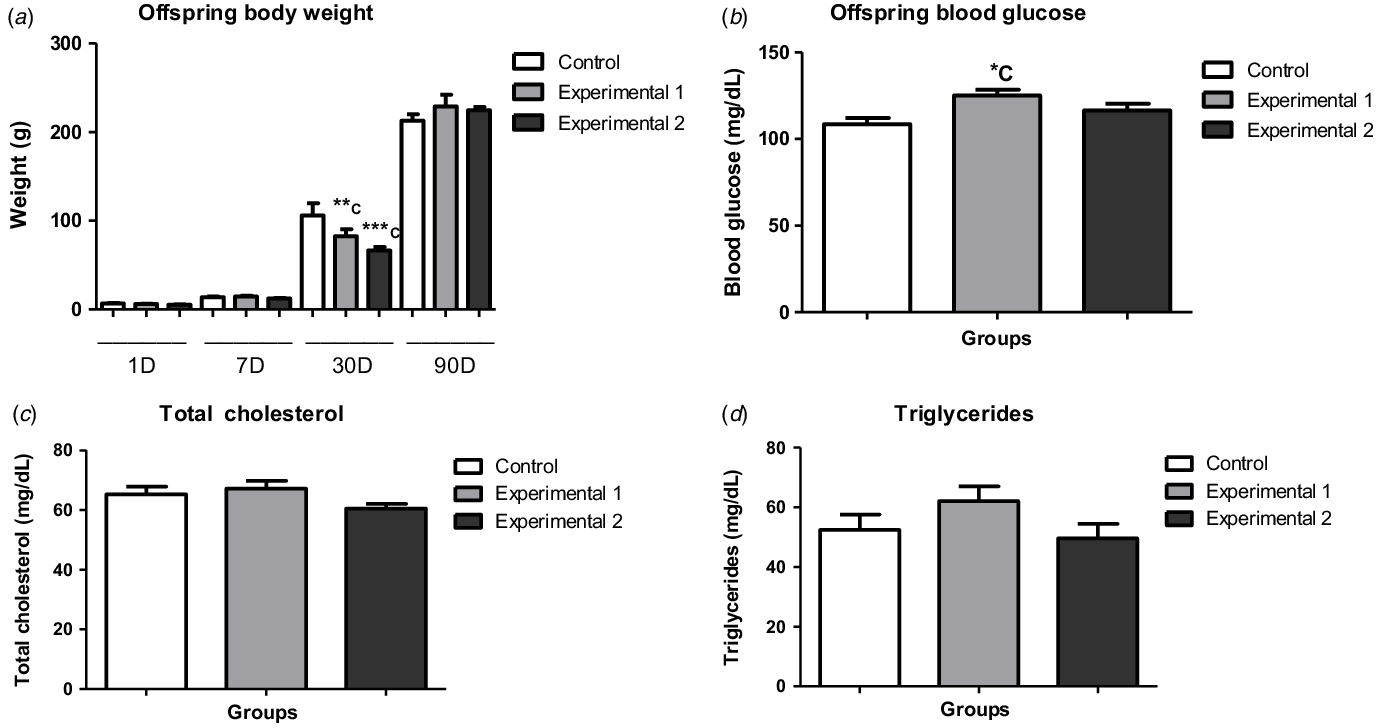
Offspring body weight and renal weight–body weight ratio were evaluated in the pups of all ages. Regarding offspring body weight, we observed weight gain in all groups, as the offspring were developing. However, when comparing groups of the same age, the 30-d-old pups of both experimental groups had a lower body weight in comparison to the CNT group (Fig. 1a), although there was no significant difference in renal weight–body weight ratio (Fig. 2a).
Offspring body weight, blood glucose, total cholesterol and triglycerides of Control, Experimental 1 and Experimental 2 groups. Offspring body weight (a), blood glucose (b), total cholesterol (c) and triglycerides (d): values are expressed as mean ± SEM (ANOVA with Newman–-Keuls pPost-tTest). Significance level: p < 0.05. ***C: p < 0.001 versus Control 30D; **C: p < 0.01 versus Control 30D; *C: p < 0.05 versus Control. Total number of animals: Control (1D = 10, 7D = 8, 30D = 11 and 90D = 11), Experimental 1 (1D = 6, 7D = 7, 30D = 7 and 90D = 8) and Experimental 2 (1D = 6, 7D = 12, 30D = 9 and 90D = 14) groups.
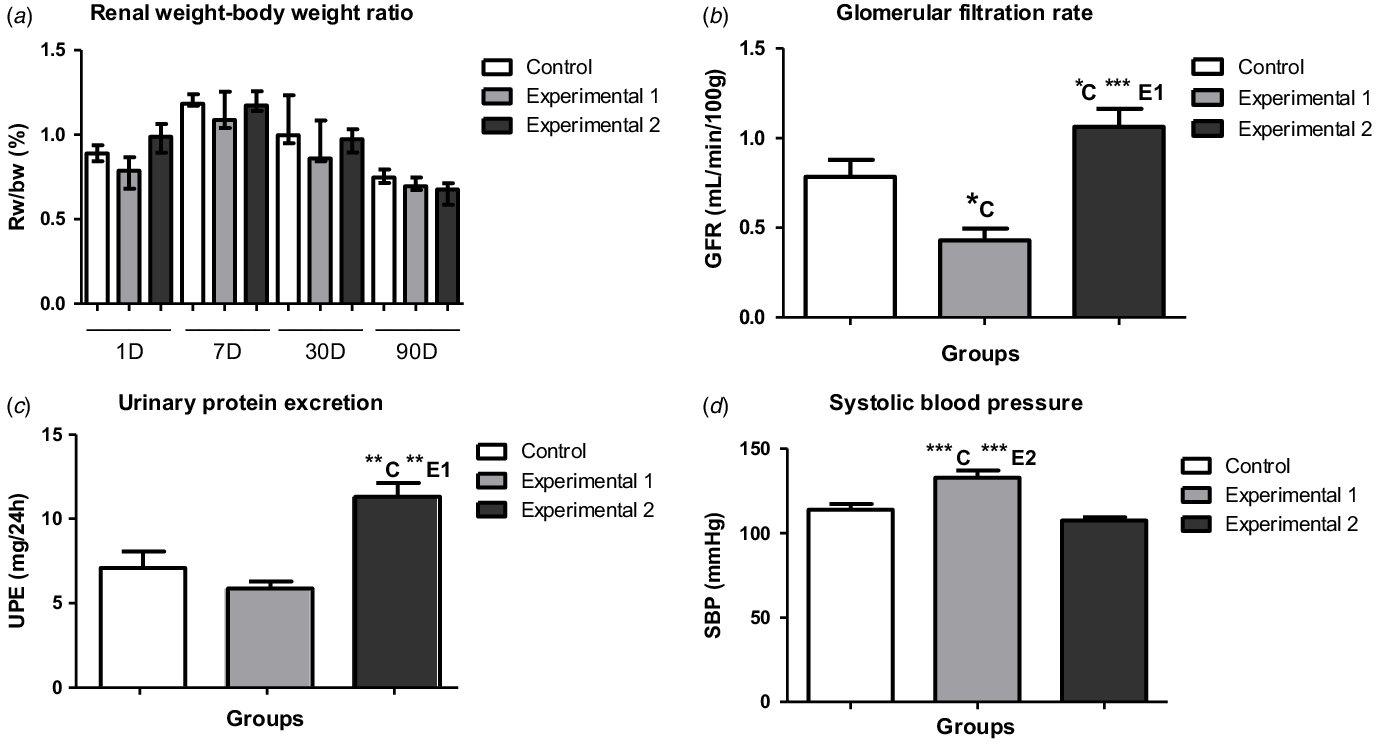
Offspring renal weight–body weight ratio, glomerular filtration rate, urinary protein excretion and systolic blood pressure of Control, Experimental 1 and Experimental 2 groups. Renal weight–body weight ratio (a): values are expressed as or median with percentiles 25 and 75. Glomerular filtration rate (b), Urinary protein excretion (c) and Systolic blood pressure (d): values are expressed as mean ± SEM (ANOVA with Newman–Keuls post-test). Significance level: p < 0.05. ***C: p < 0.001 versus Control; **C: p < 0.01 versus Control; *C: p < 0.05 versus Control; ***E2: p < 0.001 versus Experimental 2; ***E1: p < 0.001 versus Experimental 1; **E1: p < 0.01 versus Experimental 1. Total number of animals: Control (1D = 10, 7D = 8, 30D = 11 and 90D = 11), Experimental 1 (1D = 6, 7D = 7, 30D = 7 and 90D = 8) and Experimental 2 (1D = 6, 7D = 12, 30D = 9 and 90D = 14) groups.

We observed an increase of blood glucose levels in EXP1 in comparison to the CNT group (Fig. 1b). However, we observed no significant difference in TC and TGL among the studied groups (Fig. 1c, d).
There was a decrease of GFR in EXP1 in comparison to the CNT group. In contrast, we observed an increase of GFR in EXP2, when compared to the CNT and EXP1 groups (Fig. 2b). In addition, UPE was also higher in EXP2, in comparison to the other groups (Fig. 2c). EXP1 showed an increase of SBP in comparison to the other groups (Fig. 2d).
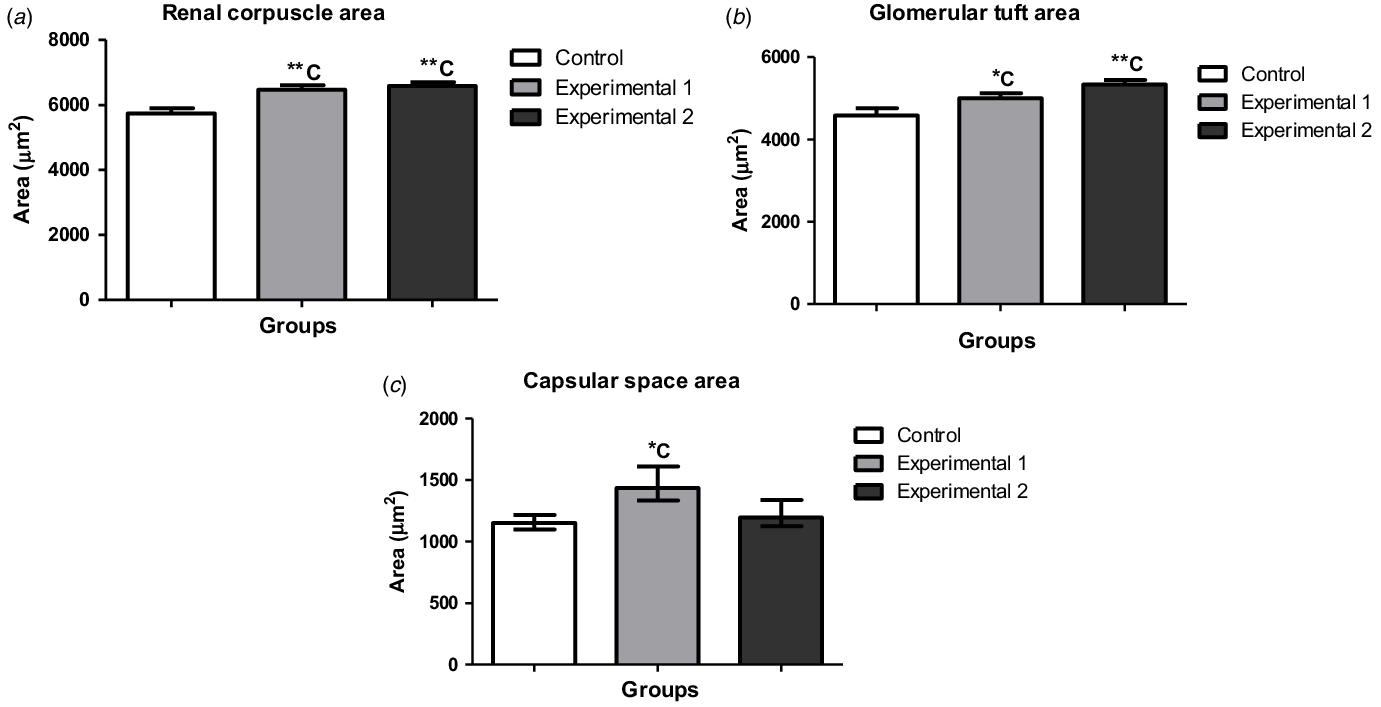
Regarding morphometric studies, we observed an increase of renal corpuscle and glomerular tuft areas in both experimental groups in comparison to the CNT group (Fig. 3a, b). However, there was an increase in capsular space area only in EXP1, in comparison to the CNT group (Fig. 3c).
Morphometrical analyses: renal corpuscle, glomerular tuft and capsular space areas of Control, Experimental 1 and Experimental 2 groups. Renal corpuscle area (a) and glomerular tuft area (b): values are expressed as mean ± SEM (ANOVA with Newman–Keuls post-test). Significance level: p < 0.05. Capsular space area (c): values are expressed as median with percentiles 25 and 75 (Kruskal–Wallis with Dunn post-test). Significance level: p < 0.05. **C: p < 0.01 versus Control; *C: p < 0.05 versus Control. Total number of animals: Control (90D = 11), Experimental 1 (90D = 8) and Experimental 2 (90D = 14) groups.

Discussion
Recent studies have demonstrated that high maternal caloric intake can lead to important alterations in the intrauterine environment. This factor may cause negative impacts on fetal development as well as an increase in the risk of obesity in the offspring later in life.Reference Hillier, Pedula, Schimidt, Mullen, Charles and Pettit27,Reference Ainge, Thompson, Ozanne and Rooney28 The aim of this study was to study the impacts of maternal HFDs with different lipid contents (28% and 40%) during pregnancy and lactation on the female offspring. Recently, Ribaroff et al.Reference Ribaroff, Wastnedge, Drake, Sharpe and Chambers29 (2017) conducted a meta-analysis and meta-regression study including several experimental models of maternal HFD and its metabolic effects on female and male offspring. Some differences in sexual dimorphism were found in some metabolic parameters, such as blood glucose and insulin levels. Female offspring have shown hyperglycaemia, in contrast of hyperinsulinemia in the absence of hyperglycaemia in male offspring. Some hypotheses have been raised for these differences, such as the fact that males and females may respond differently to maternal hormones that cross the placental barrier. However, the authors highlight the importance of studies that assess the effects of maternal HFD in both male and female offspring, but also in separated sexes. Additionally, Hariri et al.Reference Hariri and Thibault10 (2010), observed that male laboratory rats have constant weight gain until their last days of life, while female rats maintain constant body weight after reaching adulthood. As a result, female rats are a better choice for obesity models, since their weight gain in adulthood is similar to what is observed in humans. Based on this discussion, our study focused on the renal and metabolic consequences of the female offspring of dams treated with HFD.
The literature shows many divergences in the parameters of body weight and daily chow intake in pregnant female rats treated with HFD. For example, Burgueño et al.Reference Burgueño, Cabrerizo, Gonzales Mansilla, Sookoian and Pirola30 (2013), fed Wistar female rats with HFD (40% of lipids) for 15 d before mating and also during gestational and lactational period. There was no significant difference in body weight gain and daily food intake in dams, but important metabolic changes were observed on the offspring, such as insulin resistance and hepatic disorders. Another study, by Khan et al.Reference Khan, Dekou and Douglas31 (2004), fed Sprague Dawley female rats with HFD (25.7%) during pregnancy and lactation, and they observed an increase in maternal weight gain despite of a decrease in daily dietary intake by the dams. In contrast with the maternal data observed by BurgueñoReference Burgueño, Cabrerizo, Gonzales Mansilla, Sookoian and Pirola30 and Khan,Reference Khan, Dekou and Douglas31 the present study observed a decrease in the amount of chow intake in dams from EXP2 and the daily caloric consumption was higher only in dams from EXP1, when compared to the other groups. Thus, to explain these results it is important to analyse the macronutrient consumption. The macronutrient consumption analysis showed a decrease of carbohydrate and protein intake in dams from EXP2 and an increase in lipid intake of this group, in comparison to the CNT group. Nevertheless, lipid intake of dams from EXP1 was higher than EXP2.
Carbohydrates, lipids and proteins are groups of macronutrients that play an essential role in the body’s average daily energy intake. The dynamics of absorption of these components are very complex and depend on several factors. Any change in proportion of macronutrient intake can cause significant changes in weight gain, even if the energy content ingested remains constant.Reference Hall and Guo32,Reference Hall, Heymsfield, Kemnitz, Klein, Schoeller and Speakman33 Usually, an increase in lipid consumption results in a higher energy intake. However, high-fat and low-carbohydrate diets can reduce the appetite, leading to an increase of circulating ketonic bodies.Reference Rolls, Bell, Castellanos, Chow, Pelkman and Thorwart34−Reference Paoli, Bosco, Camporesi and Mangar37 Additionally, studies in animals and humans suggests that homeostatic signals related to body weight, such as leptin, can be also involved in appetite.10,38-40 Studies indicate that obesity or high caloric intake can cause important changes in leptin levels.Reference Lin, Thomas, Storlien and Huang41,Reference Fam, Morris and Hansen42 Nevertheless, this mechanism by which this works remains unknown. In this study, dams from EXP2 may have reduced their consumption ratio because this diet (40% of lipids) presented a greater energetic content. Additionally, the reduction of diet intake led to a lower ingestion of carbohydrates and proteins in these animals. Furthermore, the hypothesis of a maternal imbalance in leptin production and/or secretion in EXP2 cannot be ruled out. In 2019, Schellong et al.Reference Schellong, Melchior, Ziska, Rancourt, Henrich and Plagemann43 used a model of Wistar rats treated with HFD (30% lipids) for 6 weeks before pregnancy, and also during pregnancy and lactation. There was an increase in maternal serum leptin levels in comparison to control group. However, the maternal hyperleptinemia was accompanied by an increase in body weight gain in these rats, which was not observed in this present study. Possibly, the HFD treatment period used in this study was not sufficient to observe an increase in body weight gain in EXP1. Furthermore, the amount of chow ingested by EXP2 was lower than EXP1.
In rodent models, obesity can be measured using some criteria. The most common parameters used in the literature are: (1) Lee’s index; and (2) an increase in the amount of adipose tissue (adiposity).Reference Hariri and Thibault10 The first parameter can be evaluated by the calculation performed using a formula standardised by LeeReference Lee44 in 1929. The formula consists on the cube root of body weight (g) divided by the naso-anal length (cm) and multiplied by 1000. According to Lee,Reference Lee44 values greater than 310 are an indicator of obesity. The second parameter usually consists of the surgical removal of adipose tissue from some parts of the rodent’s body, such as the retroperitoneal cavity, and its posterior evaluation of weight (g).Reference Hariri and Thibault10,Reference Lee44 However, in this present study, although we recorded the variation in maternal and offspring’s body weight, obesity was not assessed, since the exposure time of dams to HFD was only 42 d, that is, only in pregnancy and lactation.
In order to discard the hypothesis that the number of pups per litter may have influenced in the maternal body weight gain, we investigated this parameter in all experimental groups. Thus, there was no significant difference in this parameter.
Evidence shows that obesity is associated with an increase of energetic intake. When the amount of diet ingested is relatively low and even then, there is an increase in body weight, the energy density of the diet must be considered.Reference Hariri and Thibault10 In this study, the dams from EXP2 had a low energetic consumption and a low dietary intake per day. However, the body weight increased significantly. Our hypothesis is that the animals learned how to compensate for the high energy density consumption by eating a lesser amount of chow. On the other hand, weight gain can also be associated with epigenetic changes in these rats during treatment. Several studies report that animal models exposed to a HFD can become obese easily, but in other cases, some animals may become resistant to weight gain.Reference Hariri and Thibault10,Reference Levin, Dunn-Meynell, Ricci and Cummings45,Reference Levin and Dunn-Meynell46
The literature suggests that epigenetic mechanisms are directly related to an individual’s lifestyle, and epigenetic changes can occur at any stage of life.Reference Levin, Dunn-Meynell, Ricci and Cummings45,Reference Sapienza and Issa47 Furthermore, some animals have a greater capacity to store energy or their fatty acid oxidation metabolism can be reduced.Reference Hariri and Thibault10,Reference Levin and Dunn-Meynell46–Reference Hassanain and Levin49
We observed no significant difference among the studied groups in blood glucose levels. Roza et al.Reference Roza, Possignolo and Palanch25 in 2006, evaluated the renal and metabolic impacts caused by the consumption of an HFD (60% of lipids) on non-pregnant Wistar rats for eight weeks. The study did not find an increase in body weight in the treated group and the consumption ratio was significantly lower in this group, when compared to the control. However, the treated rats were hyperglycaemic in comparison to the control group. Possibly, the longer treatment period applied by Roza et al.Reference Roza, Possignolo and Palanch25 associated with a higher lipid content in the diet may have influenced the blood glucose alteration, which was not observed in our study.
According to the literature, high maternal caloric intake is commonly associated with an increase in the offspring’s body weight at birth and even in the first days of life. Similar data were found in animal models treated with a HFD, also in the gestational period.Reference Jackman, Kramer and MacLean50–Reference Nivoit, Jansen and Remacle53 On the other hand, there are studies reporting a decreased birth weight in offspring from HFD fed dams.Reference Hausman, McCloskey and Martin54,Reference Taylor, Khan and Lakasing55 These variabilities of results may be related to the macronutrient composition of each HFD used in these studies, as well as the caloric content.Reference Howie, Sloboda, Kamal and Vickers56 In addition, changes in hypothalamic appetite control and/or circulating leptin levels can also have an influence on these parameters.Reference Gardner and Rhodes57 In this study, the groups of offspring at different ages (1, 7, 30 and 90-d-old) had body weight gain during all the studied period. However, the 30-d-old pups of dams treated with a HFD (EXP1 and EXP2) presented a lower body weight when compared to the CNT group, despite the fact that maternal caloric intake was higher in dams from EXP1 and the maternal weight gain was higher in EXP2. Nevertheless, intrauterine overnutrition can reprogramme the offspring’s metabolism, as well as its body weight gain.Reference Gardner and Rhodes57 Howie et al.Reference Howie, Sloboda, Kamal and Vickers56 (2009) observed similar results in their study, where dams fed with a HDF (45% of lipids) during pregnancy and lactation gave birth to smaller offspring, when compared to the control group. Other studies also observed a decrease in birth weight in this animal model,Reference Hausman, McCloskey and Martin54,Reference Taylor, Khan and Lakasing55,Reference Rassmusen58 while others observed no effects on the parameter.Reference Shankar, Harrell, Liu, Gilchrist, Ronis and Badger59–Reference Gorski, Dunn-Meynell, Hartman and Levin61 However, these mechanisms remain unclear. In all of these cases, it would be important to assess, in addition to body weight, the adiposity of the rats. Recently, Chaves et al.Reference Chaves, Pinheiro and Silva62 (2020) conducted a study with maternal HFD treatment and found no body weight gain on mothers, however, their adiposity was considerably increased. In addition, other factors should be investigated in order to clarify these results, such as milk leptin and lactational performance of the dams.
Regarding the glycaemic data of the adult offspring, there was an increase in blood glucose levels in EXP1, in comparison to the other groups. Similar data were found in Hokke’sReference Hokke, Puelles, Armitage, Fong, Bertram and Cullen-McEwen63 study, in which females of C57B16 mice were treated with a HFD (21% of lipids) for six weeks before the gestational period and also during pregnancy and lactation. The offspring’s body weight in all groups was very similar during the first days of life while the adult offspring showed a slight increase in their glycaemic levels, while body weight had no significant alteration when compared to the control group. The change in blood glucose showed by HokkeReference Hokke, Puelles, Armitage, Fong, Bertram and Cullen-McEwen63 and also in the present study may be related to fetal exposure to a hostile intrauterine environment caused by high maternal caloric intake. The noted difference in body weight may be explained by the lipid contents of the diets or the species of the animal models used in these studies and their way of responding to an increase in lipid supply.
Obesity is associated with dyslipidaemia and alterations in glucose homeostasis.Reference Boney, Verma, Tucker and Vohr64 Additionally, several studies indicate that diets containing high energy density can lead to obesity and its metabolic consequences.Reference Hariri and Thibault10,Reference Oscai65−Reference Ghibaudi, Cook, Farley, van Heek and Hwa67 In this study, we did not observe changes in plasma TC and TGL levels in the 90-d-old pups. In contrast, Bouanane et al.Reference Bouanane, Merzouk and Benkafalt68 observed important impacts on the lipid profile of 12-week-old adult offspring of Wistar rats treated with a HFD (42% of lipids) during pregnancy and lactation. The difference between BouananeReference Bouanane, Merzouk and Benkafalt68 and the present study can be explained by the type of diet used and/or its caloric content. Although the diets obtained similar lipid concentration, the HFD used by BouananeReference Bouanane, Merzouk and Benkafalt68 contained bacon, chocolate, cheese, among other lipid sources, resulting in total energy value of 420 kJ/100g. The HFD used in EXP1 and EXP2 had lower energy density values, 241,8 kJ/100 g and 343,5 kJ/100 g, respectively. Therefore, the total energy density of the diets may explain the differences observed on the offspring’s lipid profile.
Evidence shows that obesity can cause intraglomerular haemodynamic changes, leading to an increase in renal plasma flow and GFR, which can also cause albuminuria.Reference Reisin, Messerli, Ventura and Frohlich69–Reference Whaley-Cornell and Sowers71 In this study, EXP1 had a lower GFR than the CNT group. In contrast, EXP2 demonstrated higher values of this parameter in relation to the other groups, revealing a glomerular hyperfiltration case. This group also presented an elevated UPE, when compared to the CNT and EXP1 groups. Jackson et al.Reference Jackson, Alexander and Roach72 evaluated metabolic and renal parameters in Sprague Dawley rat offspring treated with a HFD (45% of lipids) and fructose rich diet (0.1 g/ml) for six months prior to pregnancy and also during gestational and lactation periods. The adult pups treated with a standard chow diet after weaning developed albuminuria and glomerulosclerosis. However, these animals did not demonstrate significant changes in GFR. These results suggest that albuminuria and glomerulosclerosis cases found in these pups may be caused by renal haemodynamic alterations. Furthermore, with advancing age, changes in GFR could be found, as well as in the experimental groups of the present study. The glomerular hyperfiltration observed in EXP2 can be directly related to the increase in UPE and it could also be a result of the increase in glomerular tuft area that was also observed in this group. However, the decrease in GFR in EXP1 may be associated with an increase in SBP observed in this study. It is worth mentioning that the dams from EXP2 ate lower protein and carbohydrate content in relation to the other groups. Given that maternal obesity may programme hypertension in the offspring, further investigation is necessary to ensure that the SBP alteration observed in this study was a predictor of the lower GFR noticed in EXP1. Evidence shows that chronic exposure to high blood pressure may cause structural changes to the kidney, which may lead to nephron loss and a reduction of renal plasma flow.Reference Glastras, The, Wong and Saad5,Reference Wood-Bradley, Barrand, Giot and Armitage73 Additionally, it is important to consider that fetal exposure to maternal overnutrition per se can impair fetal kidney development, altering its structure and physiology. Black et al.Reference Black, Briscoe, Constantinou, Kett and Bertram74 investigated renal consequences of hypertension in spontaneously hypertensive rats and observed no change in nephron number, despite the altered blood pressure of the animals. Therefore, these findings suggest that hypertension may not influence nephron number, which is an important predictor of changes in GFR and renal function.
According to the literature, animal models of low-protein diets have been using a percentage of 3.5%–10% of protein, while standard protein diets contain approximately 12%–20% of protein.Reference Langle-Evans75,Reference Langley-Evans, Welham and Jackson76 Despite the lower protein intake observed in dams from EXP2, the rats were not protein deficient, however, we cannot exclude the fact that a reduction in maternal protein intake might have adverse effects on offspring development. Accumulating evidence shows that low-protein maternal diets may have negative impacts on pups later in life, such as a decrease in nephron number, growth restriction, hypertension, increased fasting insulin and blood lipid levels.Reference Langley-Evans, Welham and Jackson76–Reference Jahan-Mihan, Rodriguez, Christie, Sadeghi and Zerbe78 Several studies have reported similar data in Wistar rats treated with low-protein diets containing about 6%–8% of protein in contrast with 17%–20% of this macronutrient in the normal-protein diets.Reference Fernandez-Twinn, Wayman, Ekizoglou, Martin, Hales and Ozanne79,Reference Martin-Gronert, Fernandez-Twinn, Bushell, Siddle and Ozanne80 Nwagwu et al.Reference Nwagwu, Cook and Langley-Evans81 evaluated renal and metabolic effects in the offspring of Wistar rats treated with low-protein diet during pregnancy. The low-protein diet used in this study consisted of 9 g of casein/100 g of chow, and the standard diet consisted of 18 g of casein/100 g of chow. The four-week-old pups presented higher blood pressure, decreased GFR and increased UPE. In the present study, UPE was observed in adult pups from EXP2 group associated with an increased GFR. The results can be explained by the association of lower protein and carbohydrate content ingested by the dams of this group. Additionally, it shows that changes in macronutrients may result in severe kidney injury in the offspring.
Regarding the morphometric analysis, the following parameters were evaluated: renal corpuscle, glomerular tuft and capsular space areas. We found that both renal corpuscle and glomerular tuft areas were increased in the experimental groups. The capsular space area was only increased in EXP1, when compared to the others. Tobar et al.Reference Tobar, Ori and Benchetrit82 evaluated morphological aspects of renal biopsies of non-diabetic obese patients with proteinuria and glomerular hyperfiltration. The study found an increase in capsular space volume in these individuals, when compared to a control group. These data, along with other studies, support a relationship between glomerulomegaly and glomerular hyperfiltration.Reference Rea, Heimbach and Grande83–Reference Khan, Dekou and Douglas85
Recent studies showed that maternal HFD treatment can cause cardiovascular problems in offspring, such as cardiac hypertrophy and hypertension.Reference Chen, Cao, Zhang, Yu, Liu and Xue86,Reference Loche, Blackmore and Carpenter87 One of the hypotheses that explain hypertension in these cases is the reduction in the number of nephrons in the offspring, which initiates during nephrogenesis, and can lead to a decrease in GFR later in life.Reference Paixão and Alexander21, Reference Menendez-Castro, Nitz and Cordasic88 In the present study, EXP1 animals presented higher pressure values when compared to the other groups, which agrees with the findings in the literatureReference Langle-Evans1,Reference Hall20,Reference Roza, Possignolo and Palanch25,Reference Khan, Dekou and Douglas85,Reference Chen, Cao, Zhang, Yu, Liu and Xue86 and can be related to the reduction of GFR that was also observed in this group. In contrast, EXP2 showed no significant changes in SBP. In addition, its renal repercussions were different from those observed in EXP1. However, this shows us that maternal HFD treatment containing different lipid contents can cause renal and blood pressure changes in the offspring in different magnitudes.
Conclusion
The maternal consumption of the HFD per se, during gestation and lactation, resulted in important renal and metabolic changes in the offspring of Wistar rats, such as increased glycaemia, changes in renal structure and function, and increased UPE and SBP. However, the lipid content (28% or 40%) had different repercussions on the type and/or magnitude of changes in the offspring.
Acknowledgements
We are grateful to the Federal University of Uberlândia (UFU), that allowed the development of this work and to REBIR-UFU (Rodent Biotteries Network from UFU) for supply and maintenance of the experimental animals.
Financial Support
This research did not receive any specific grant from any funding agency in the public, commercial or not-for-profit sector.
Conflicts of Interest
None.
Ethical standards
The authors assert that all procedures contributing to this work comply with the ethical standards of relevant national guides on the care and use of laboratory animals and has been approved by the institutional committee of Federal University of Uberlândia (057/14).