Introduction
Patients have been shown to hold common sense representations of illness, which include cognitions about its identity, timeline, consequences, and cause, as well as ideas about cure and control (Leventhal et al., Reference Leventhal, Nerenz, Steele, Baum and Singer1984). These illness perceptions guide coping responses and health behaviors. Typically, perceptions are assessed through questionnaires. However, research has shown that it is feasible and informative to ask patients to draw their illness (Kaptein and Broadbent, Reference Kaptein, Broadbent, Ayers, McManus, Newman, Wallston, Weinman and West2007). Drawings can reflect patients’ understanding of their illness and perceptions of its effects. The content, accuracy, and size of drawings have been associated with health outcomes (Broadbent et al., Reference Broadbent, Petrie, Ellis, Ying and Gamble2004; Broadbent, et al., Reference Broadbent, Ellis, Gamble and Petrie2006a; Hoogerwerf et al., Reference Hoogerwerf, Ninaber, Willems and Kaptein2012). Patients with many different kinds of illness have been shown to have visual representations of their illness and are able to draw their condition, including those with heart conditions, cancer, or brain-related disorders (van Leeuwen et al., Reference van Leeuwen, Herruer, Putter, van der Mey and Kaptein2015).
To date, studies have focused on analyzing patients’ completed drawings of their illness. The analysis of the process of drawing could provide further information and have predictive value. An innovative approach is the use of computerized analysis to examine kinematic measures of writing or drawing, including pen pressure and speed. Heinik et al. (Reference Heinik, Werner, Dekel, Gurevitz and Rosenblum2010) correctly classified over 80% of participants with or without mild Major Depressive-Disorder using pen pressure and azimuth in a clock-drawing task. Additionally, weaker pen pressure and longer handwriting time discriminated Alzheimer's disease patients from healthy controls (Werner et al., Reference Werner, Rosenblum, Bar-On, Heinik and Korczyn2006). More recent work has shown handwriting fluency analysis can distinguish people with tardive dyskinesia from controls (Caligiuri et al., Reference Caligiuri, Teulings, Dean and Lohr2015).
One group for whom kinematic measures of drawings may be particularly relevant are stroke patients. Abnormalities in the structure of stroke patients’ drawings of simple objects have been associated with worse function and outcomes (Andrews et al., Reference Andrews, Brocklehurst and Richards1980). Impaired clock drawings have been shown to predict long term hospital care (Friedman, Reference Friedman1991) and less motor improvement (Adunsky et al., Reference Adunsky, Fleissing, Levenkrohn, Arad and Noy2002) in stroke patients. This pilot study aimed to investigate the value of a computerized approach to assess kinematic features of illness drawings in stroke patients. We hypothesized that pen pressure, speed of patients’ drawing, and duration of task would be associated with their illness perceptions, physical, and psychological well-being.
Methods
Participants
This was a cross-sectional pilot study. Invitation letters were sent to 35 patients who had taken part in a previous study on illness perceptions and stroke 8 to 11 months previously. The eligibility criteria were aged 18 years or above, and being diagnosed with ischaemic or haemorrhagic stroke at Auckland City Hospital, New Zealand by consultant neurologists. Exclusion criteria were being enrolled in more than one other stroke study, impaired cognition, or communication precluding informed consent, blindness, or declining consent. Fifteen of the 35 patients consented (43%). The University of Auckland Human Ethics Committee granted approval for the study and all participants gave written informed consent.
Procedure
Participants either came to the University or were visited at home for about 30 minutes. They were asked to undergo a neurological examination, complete a questionnaire, and to make a drawing.
Measures
Trained researchers conducted a clinical examination to assess stroke severity using the National Institutes of Health Stroke Scale, which has 11 items rated from 0 (no deficit) to 4 (maximal deficit) and has high test–retest reliability and inter–rater agreement, and has acceptable examination and scale validity (Brott et al., Reference Brott1989). Physical disability was rated on the widely used Modified Rankin Scale which has 7 points from 0 “no symptoms” to 6 “death”, and has strong test–retest reliability and good construct and convergent validity (Rankin, Reference Rankin1957; Banks and Marotta, Reference Banks and Marotta2007). Stroke-related quality of life was assessed by interview using the Stroke Impact Scale, version 3.0, which has 59 items grouped into 8 domains on 5-point response scales, and has robust psychmetric characteristics especially the physical domains (Duncan et al., Reference Duncan, Bode, Lai and Perera2003). Patients completed the Patient Health Questionnaire-9, a self-report measure of depression that includes nine depression symptoms rated from 0 “not at all” to 3 “nearly every day”, and has excellent internal and test–retest reliability, criterion, and construct validity (Kroenke et al., Reference Kroenke, Spitzer and Williams2001). Patients’ perceptions of their stroke were assessed using the Brief Illness Perception Questionnaire, which is a self-rated 9-item measure of illness perceptions with response scales from 0 to 10 and good test–retest reliability, concurrent, and predictive validity (Broadbent et al., Reference Broadbent, Petrie, Main and Weinman2006b; Broadbent et al., Reference Broadbent, Wilkes, Koschwanez, Norton, Weinman and Petrie2015). Patients were also asked one self-report item about how worried they were about having another stroke from 0 (not at all) to 10 (extremely) as a measure of illness anxiety, which was modified from a previous study with myocardial infarction patients (Broadbent et al., Reference Broadbent, Ellis, Gamble and Petrie2006a).
The drawing instructions were to draw a picture of what they thought their brain looked like now, 8 to 11 months after their stroke, and to briefly describe what they had drawn in writing, using the hand they felt most comfortable with. Drawings were made on A4 paper placed on top of a WACOM Intuos 2 (model GD 0912-12x18) x–y digitizing tablet, using a wireless electronic inking pen (model GP-110). Analysis of drawing was performed using MovAlyzeR® software (Teulings and Caligiuri, Reference Teulings and Caligiuri1997). This software automatically analyses and quantifies human movement using a PC-based digitizer. Variables analyzed for each individual task (referring to one condition per participant, either drawing or writing) were average pen pressure (tablet units), duration of task, and pen speed (cm/s).
Statistical analysis
Statistical analysis was performed using IBM SPSS Statistics version 19.0 (SPSS Inc., Chicago, IL). Spearman rank correlation coefficients were used to analyze associations, and differences between groups (dominant or non-dominant hand; affected or non-affected hand) were tested using independent-samples t-tests. All tests were two-sided with a 5% significance level.
Results
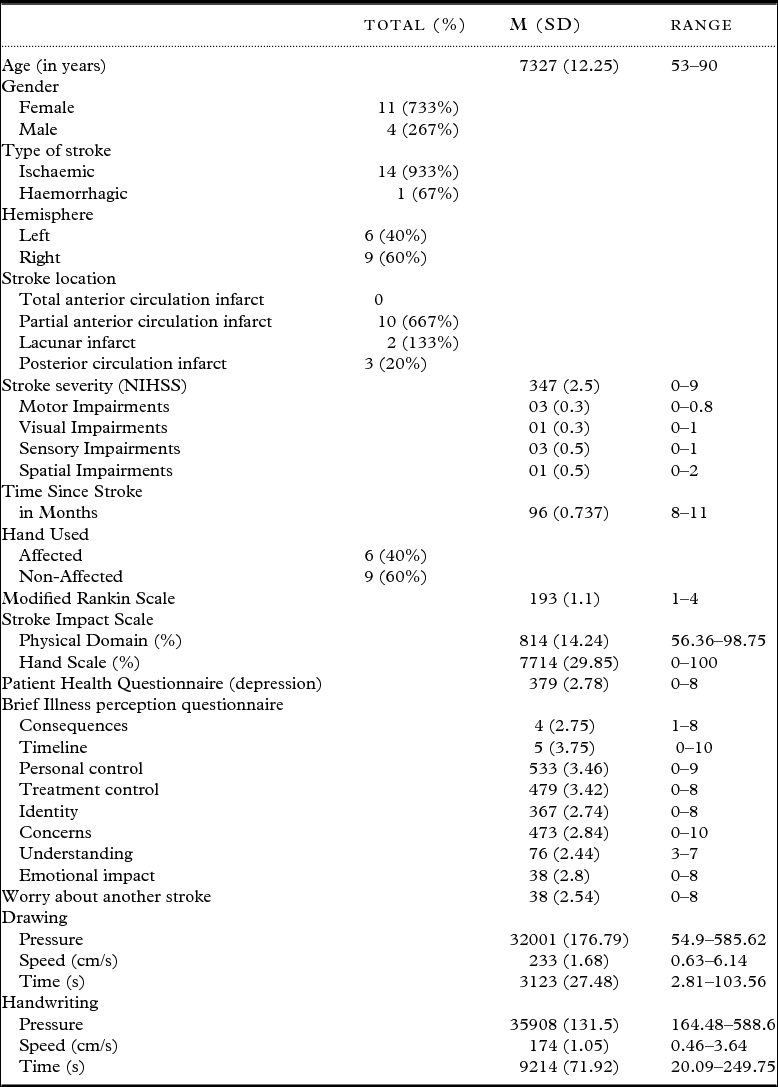
The clinical and demographic features of the sample are presented in Table 1, along with the kinematic features of the drawings and writing. The majority of the sample had an ischaemic stroke, which is representative of the stroke population. Overall the participants had better quality of life scores on both the physical domain and hand sub-scales of the Stroke Impact Scale than normative scores from patients in a stroke registry (Duncan et al., Reference Duncan, Min Lai, Tyler, Perera, Reker and Studenski2002), and rates of depressive symptoms were low. On average, participants felt they understood their stroke well and reported few ongoing symptoms and low emotional impact. They felt they had a moderate amount of control over their recovery and that treatment was moderately helpful.
Demographic characteristics, clinical, and kinematic measures

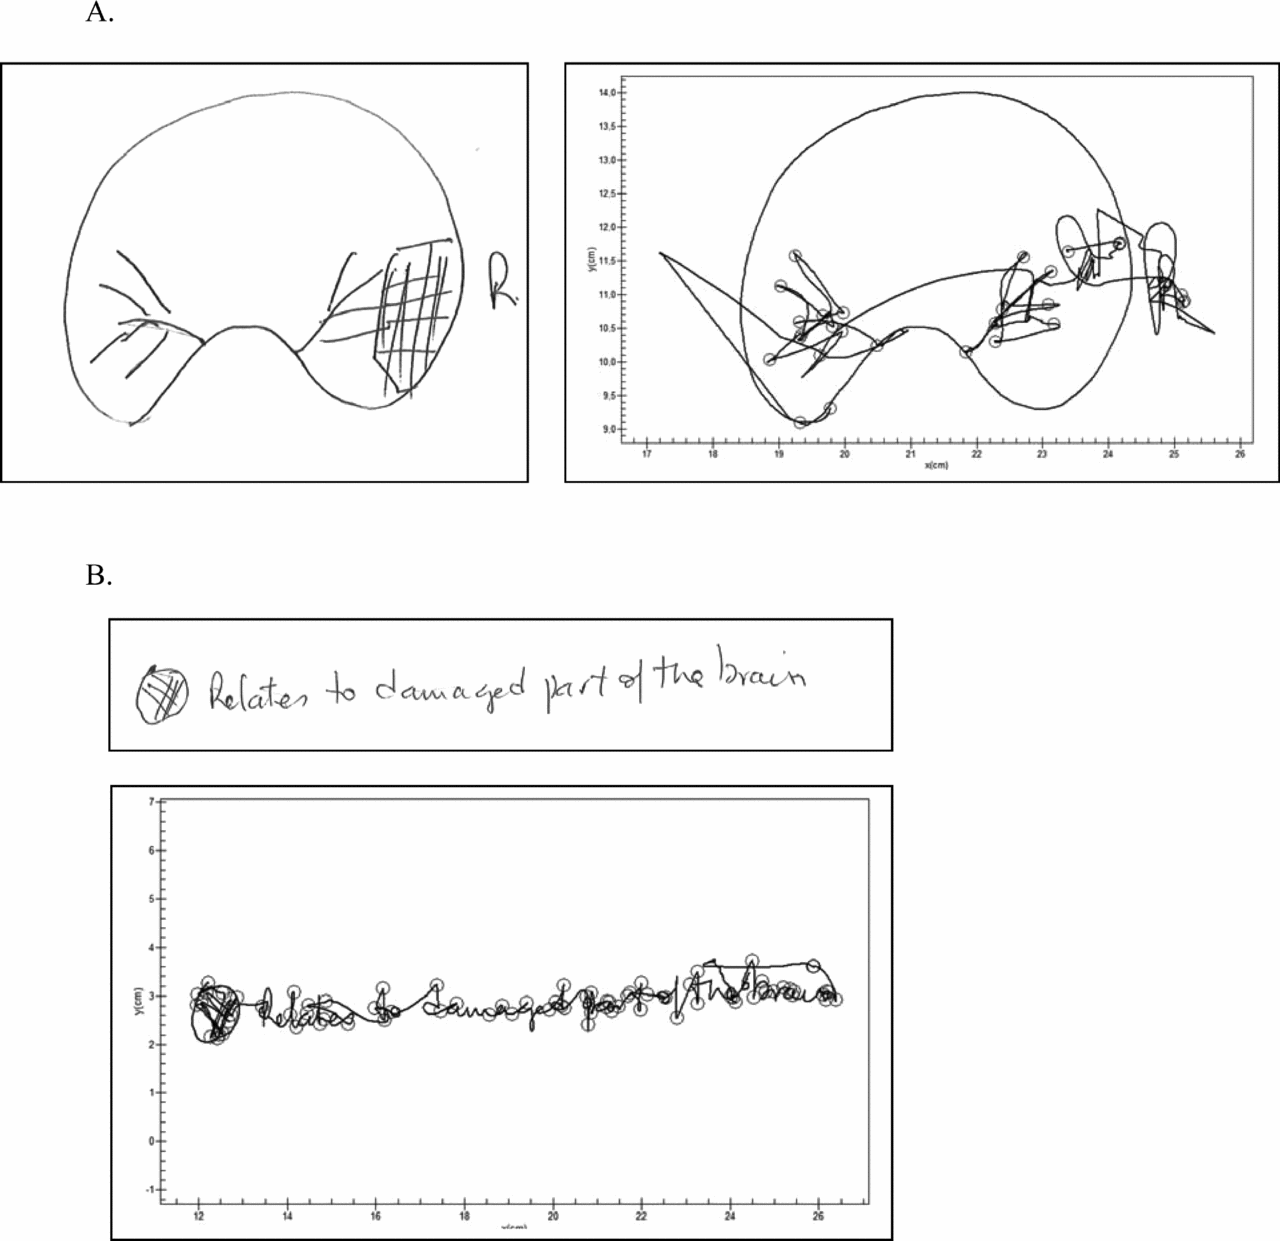
Figure 1 shows an example of a patient's drawing and their associated comment, as well as how it was analyzed with MovAlyzeR®. This drawing suggests that the patient thinks there is still some damage present on the right side of the brain.
(A) An example of one participant's drawing of their brain (original drawing and the drawing after analysis) and (B) their handwritten comment (original comment and the comment after analysis). The circles are created during the MovAlyzer analysis and indicate segmentation points, which divide the drawing or handwriting pattern into individual pen strokes.

Illness perceptions and kinematic measures
Greater pen pressure in handwriting was significantly correlated with greater perceived control over the stroke (rS = 0.609, 95% BCa CI [0.276, 0.809], p = 0.021). Taking longer to write was associated with perceptions of fewer consequences of the stroke (rS = −0.661, 95% BCa CI [−0.892, −0.030], p = 0.01). Faster pen speed during drawing was associated with perceptions that the effects of the stroke would last for a longer time (rS = 0.585, 95% BCa CI [0.147, 0.907], p = 0.028) and with greater worry about having another stroke (rS = 0.568, 95% BCa CI [0.018, 0.935], p = 0.034). There were no significant associations between kinematic measures and stroke severity, disability, physical function, or depression.
Influence of sensorimotor deficits
To control for alternative explanations for the associations between kinematic measures and illness perceptions, the use of the dominant or non-dominant and affected or non-affected hand was analyzed. Only one participant used their non-dominant hand due to the dominant hand being still severely affected by the stroke. Re-analysis excluding this participant's data showed no differences in the findings.
There were no differences in kinematic measures between participants using their affected hand and those using their non-affected hand, except that drawing speed was slower in those using their affected hand (M = 1.288, SD = 0.414; M = 2.901, SD = 1.859; t (12) = −2.495, p = 0.033). After controlling for whether people used their affected or non-affected hand, the associations between drawing speed and perceived duration of the effects of stroke, as well as drawing speed and worry about a recurrent stroke, did not reach significance.
Discussion
This preliminary study found that the time patients took to draw, their speed of drawing, and pen pressure exerted were associated with patients’ perceptions of their stroke. The finding that stronger pen pressure was associated with higher perceived control over the illness is congruent with previous research showing stronger pen pressure was associated with better outcomes (Werner et al., Reference Werner, Rosenblum, Bar-On, Heinik and Korczyn2006; Heinik et al., Reference Heinik, Werner, Dekel, Gurevitz and Rosenblum2010). People with higher perceived control may feel more powerful and therefore exert more powerful, stronger, and more definite pen strokes, compatible with embodied emotion theory (Niedenthal, Reference Niedenthal2007). The finding that patients who drew more quickly had more chronic timeline perceptions and more worry about another stroke may reflect avoidance of thinking about the stroke too much. Previously, faster drawing speed has been interpreted as indifference or defensiveness (Vass, Reference Vass2012). However, it must be noted that the associations between drawing speed and duration of the effects and worry about a recurrent stroke became non-significant after controlling for hand affected.
There are some limitations to this study; most notably the small sample size limits the power to find significant effects. It was difficult to interpret the effects of using the affected or non-affected hand due to the small numbers in each group. Drawing was slower when performed with the affected hand, which is plausible as deficits in hand function can remain even years after the stroke event occurred. However, pen pressure did not differ between patients using their affected hand and those using their non-affected hand. Further studies could help to clarify the influence of sensorimotor deficits on associations between kinematic measures and illness perceptions. Including only stroke patients who use their non-affected dominant hand could remove any confounding effects of stroke on motor ability. Future work could also investigate kinematic features of drawings in other illnesses that do not involve sensorimotor deficits to see how kinematic measures relate to illness perceptions and other health outcomes.
In conclusion, this pilot study suggests that kinematic measures of stroke patients’ brain drawings and written comments are associated with illness perceptions. These preliminary results indicate that asking patients to draw their illness on a digitizing tablet that can measure pen pressure, duration, and speed, may add further value to the illness drawing task. Further research on kinematic features of illness drawings is needed with a larger sample and in other illness groups. If questionnaires or drawings reveal inappropriate illness perceptions, health professionals may address these using targeted explanations along with visual information and action plans. Previous work has shown that such psycho-educational interventions can help to improve recovery following heart attack (for example, Jones et al., Reference Jones, Ellis, Nash, Stanfield and Broadbent2015) and medication adherence after stroke (O'Carroll et al., Reference O'Carroll, Chambers, Dennis, Sudlow and Johnston2013).
Conflicts of interest
None.
Description of authors’ roles
K Grünich collected data, analyzed the data, and wrote the article; V Garcia designed the study and collected data; C Stinear and S Ackerley designed the study and supervised data collection; Jitske Tiemensma designed the study; E Broadbent designed the study and supervised data collection and helped write the article. All authors read the paper, provided comments, and approved the paper.