Introduction
Optical integrated circuits using silicon photonics technology have been expected to be a solution to the bandwidth bottleneck problem both in data transmission among large scale integration (LSI) circuits and in long-haul communication.[ Reference Vlasov 1 – Reference Arakawa, Nakamura, Urino and Fujita 3 ] A silicon photonics transceiver for the above communication consists of a continuous-wave light source array and optical modulator array in the transmitter circuit and a photodetector array in the receiver circuit.[ Reference Boeuf, Cremer, Vulliet, Pinguet, Mekis, Masini, Verslegers, Sun, Ayazi, Hon, Sahni, Chi, Orlando, Ristoiu, Farcy, Leverd, Broussous, Pelissier-Tanon, Richard, Pinzelli, Beneyton, Gourhant, Gourvest, Le-Friec, Monnier, Brun, Guillermet, Benoit, Haxaire, Manouvrier, Jan, Petiton, Carpentier, Quemerais, Durand, Gloria, Fourel, Battegay, Sanchez, Batail, Baron, Delpech, Salager, De Dobbelaere and Sautreuil 4 , Reference Urino, Hatori, Mizutani, Usuki, Fujikata, Yamada, Horikawa, Nakamura and Arakawa 5 ] Silicon waveguides of rib type[ Reference Boeuf, Cremer, Vulliet, Pinguet, Mekis, Masini, Verslegers, Sun, Ayazi, Hon, Sahni, Chi, Orlando, Ristoiu, Farcy, Leverd, Broussous, Pelissier-Tanon, Richard, Pinzelli, Beneyton, Gourhant, Gourvest, Le-Friec, Monnier, Brun, Guillermet, Benoit, Haxaire, Manouvrier, Jan, Petiton, Carpentier, Quemerais, Durand, Gloria, Fourel, Battegay, Sanchez, Batail, Baron, Delpech, Salager, De Dobbelaere and Sautreuil 4 ] or wire type[ Reference Urino, Hatori, Mizutani, Usuki, Fujikata, Yamada, Horikawa, Nakamura and Arakawa 5 ] structure are used to optically connect these devices. The wire waveguide has the advantage of lower emission loss at a corner with a short bending radius because the propagating light in wire waveguides is more strongly confined in the waveguide core. Using the wire waveguides has made it possible to make optical transceivers with a footprint of only several tens of square millimeters.[ Reference Urino, Hatori, Mizutani, Usuki, Fujikata, Yamada, Horikawa, Nakamura and Arakawa 5 ] The problem with the wire waveguides is their relatively higher propagation loss. The propagation loss of wire waveguides has been reported to be a few decibels per centimeter,[ Reference Vlasov and McNab 6 – Reference Shimura, Horikawa, Okayama, Jeong, Tokushima, Sasaki and Mogami 20 ] whereas that of rib waveguides has been reported to be <0.5 dB/cm.[ Reference Lardenois, Pascal, Vivien, Cassan, Laval, Orobtchouk, Helzmann, Bouzzalda and Mollard 21 ] The higher power consumption due to this larger propagation loss makes it difficult to design large-scale circuits using the wire waveguides. Many intensive studies have been devoted to reducing the propagation loss of wire waveguides, and recently research groups at IMEC[ Reference Selvaraja, Murdoch, Milein, Delvaux, Ong, Pathak, Vermeulen, Sterckx, Winroth, Verheyen, Lepage, Bogaerts, Baerts, Van Campenhout and Absil 15 , Reference Selvaraja, De Heyn, Winroth, Ong, Lepage, Cailler, Rigny, Bourdelle, Bogaerts, Van Thourhout, Van Campenhout and Absil 19 ] and PETRA[ Reference Shimura, Horikawa, Okayama, Jeong, Tokushima, Sasaki and Mogami 20 ] have independently reported wire waveguides with propagation losses <1.0 dB/cm. In the “Recent development of low-loss silicon wire waveguides” section, we will briefly review the previous studies and describe the key issues in lowering the propagation loss of a wire waveguide.
As for the loss mechanism in wire waveguides, in 1994 Payne and Lacey derived an analytical equation, on the basis of two-dimensional (2D) analysis, that exhibits strong dependence on line edge roughness (LER)[ Reference Payne and Lacey 22 ]; and in 2005, Barwicz and Haus reported the results of a more accurate three-dimensional (3D) simulation.[ Reference Barwicz and Haus 23 ] It will be interesting to see whether the propagation loss in recently developed low-loss waveguides can be explained by these theories, the examination of which will help us better understand the propagation loss mechanism.
One purpose of this paper is to show a solution to the problem of lowering propagation loss through assessment of the relationship between waveguide loss and fabrication technology in the previous studies. A second purpose is to describe the propagation characteristics of the low-loss waveguides and compare them with the results of simulations based on different scattering loss theories.
Recent development of low-loss silicon wire waveguides
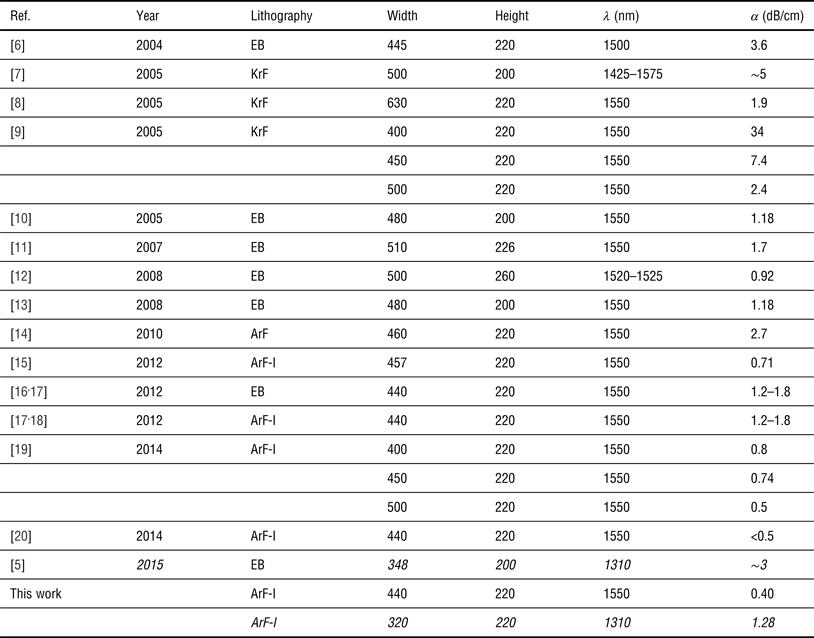
The typical cross-sectional structure of a wire waveguide and a bird's-eye view of the waveguide core pattern are shown in Fig. 1. Silicon core patterns for wire waveguides with sub-micrometer width are fabricated by resist pattern formation by lithography on a silicon layer on a thick buried oxide (BOX) and the following anisotropic dry etching of the silicon layer. This fabrication flow for silicon photonics waveguides using silicon on insulator (SOI) wafers with thick BOX was established in the early stage, up to the year 2005.[ Reference Vlasov and McNab 6 – Reference Tsuchizawa, Yamada, Fukuda, Watanabe, Takahashi, Takahashi, Shoji, Tamechika, Itabashi and Morita 10 ] In this period, several papers confirmed experimentally that the scattering of propagating light by LER is the main cause of the propagation loss,[ Reference Vlasov and McNab 6 , Reference Sparacin, Spector and Kimerling 8 ] and the sidewall striation like that seen in Fig. 1(b) was been found to be the main origin of LER. Table I shows the main results of propagation loss reported from 2004 to the present. The waveguide loss <2 dB/cm for the propagation in the lowest-order transverse electric (TE) mode was first reported in 2006 by the IBM group, which used thermal oxidation for sidewall smoothing after waveguide pattern formation.[ Reference Xia, Sekaric and Vlasov 11 ] The first loss <1 dB/cm was reported in 2008 by the University Glasgow group, which used hydrogen silsesquioxane as a negative-tone electron-beam (EB) resist.[ Reference Gnan, Thoms, Macintyre, De La Rue and Sorel 12 ] The impact of resist chemistry on the propagation loss has been also reported in a negative-tone chemically amplified EB resist, OEBR-CAN034.[ Reference Hirayama, Takahashi, Noguchi, Yamagishi and Horikawa 16 ] In 2012, an IMEC group reported a loss <1 dB/cm obtained using ArF immersion lithography.[ Reference Selvaraja, Murdoch, Milein, Delvaux, Ong, Pathak, Vermeulen, Sterckx, Winroth, Verheyen, Lepage, Bogaerts, Baerts, Van Campenhout and Absil 15 ] It is noteworthy that in the research works by the IMEC group,[ Reference Bogaerts, Baets, Dumon, Wiaux, Beckx, Taillaert, Luyssaert, Van Campenhout, Bienstman and Van Thourhout 9 , Reference Bogaerts, Selvaraja, Dumon, Brouckaert, De Vos, Van Thourhout and Baerts 14 , Reference Selvaraja, Murdoch, Milein, Delvaux, Ong, Pathak, Vermeulen, Sterckx, Winroth, Verheyen, Lepage, Bogaerts, Baerts, Van Campenhout and Absil 15 , Reference Selvaraja, De Heyn, Winroth, Ong, Lepage, Cailler, Rigny, Bourdelle, Bogaerts, Van Thourhout, Van Campenhout and Absil 19 ] the propagation loss was reduced using higher-resolution lithography. Nowadays a propagation loss <2 dB/cm is commonly obtained in major silicon photonics platforms including foundries.[ Reference Novack, Streshisky, Ding, Liu, Lim, Lo, Baehr-Jones and Hockberg 24 ] Loss values <1 dB/cm, however, have been reported only by the above three groups. The results listed in Table I make it clear that the lithographic process greatly impacts the propagation loss.
(a) Cross-sectional structure of a wire waveguide and (b) bird's-eye view of the waveguide before formation of the overclad layer.

Comparison of propagation losses for the lowest-order TE mode reported for silicon wire waveguides.
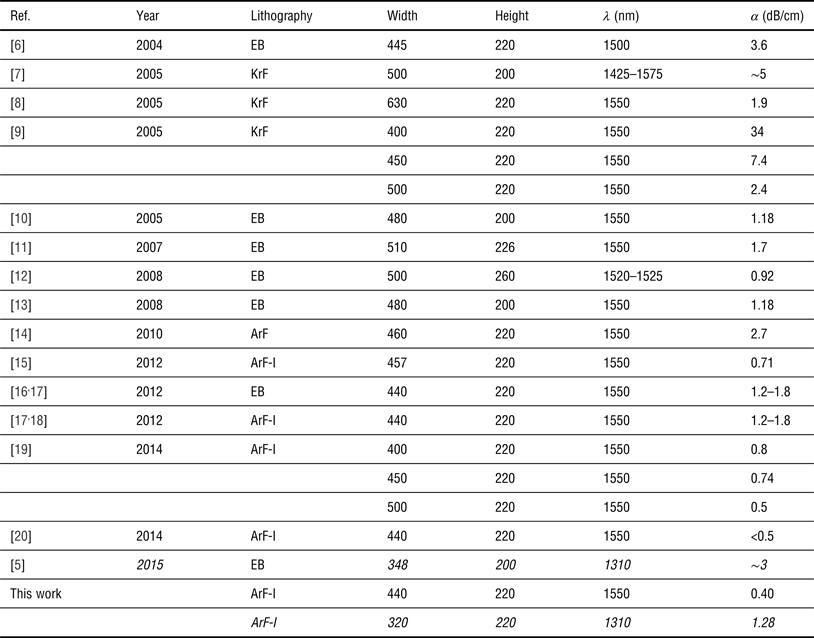
EB, electron beam lithography; KrF, KrF excimer lithography (λ = 248 nm); ArF, ArF excimer lithography (λ = 193 nm); ArF-I, ArF immersion lithography (λ = 193 nm).
The propagation loss data for the O-band is indicated by an italic font.
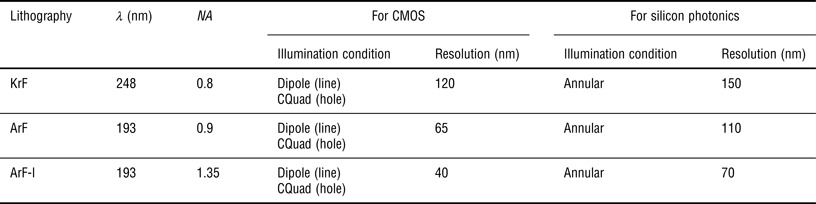
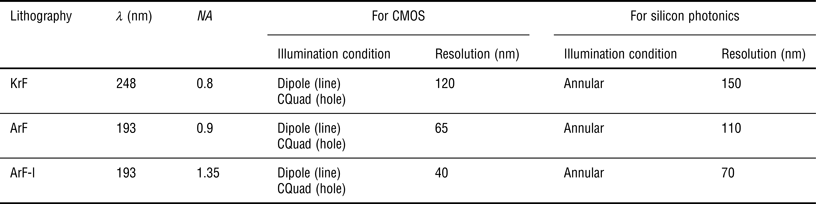
Table II shows the comparison of the photolithography tools in the resolution of photolithography for silicon photonics as well as the resolution for CMOS devices.[ Reference Horikawa and Mogami 25 ] In the estimation of the resolution for silicon photonics, we supposed the annular condition as the off-axis illumination condition because higher-resolution conditions such as dipole and quadrupole illumination are not suitable for irregular waveguide patterns. In this illumination condition, the lithographic resolutions for KrF, ArF, and ArF immersion lithography were estimated to be 150, 110, and 70 nm, respectively. It was confirmed that the difference in resolution by lithography tools due to the wavelength of exposure light and numerical aperture (NA) also causes differences in LER. Smoothing techniques such as oxide formation on waveguides surface after pattern formation are also effective to a certain extent, although these techniques cause a little change of waveguide size.
Performance comparison for photolithography tools of KrF excimer lithography (KrF), ArF excimer lithography (ArF), and ArF immersion lithography (ArF-I) in CMOS and silicon photonics fabrication.
Propagation loss in wire waveguides fabricated using ArF immersion lithography
Two types of wire waveguides (waveguides A and B ) with different widths and heights were fabricated using 300-mm-diameter SOI wafers having a 2-μm-thick BOX layer. The SOI thickness uniformity within a single wafer and the surface roughness determined by atomic force microscope measurement for 2 µm × 2 µm area were 0.27 nm (1σ) and 0.16 nm (1σ), respectively. The width and height of waveguide A were 440 and 220 nm, respectively, and the properties for the lowest-order TE mode propagation for the C-band (1.53–1.565 µm) were evaluated using the waveguide A . The width and height of waveguide B , on the other hand, were respectively 320 and 220 nm, and the waveguide B was tested for the lowest-order TE mode propagation for the O-band (1.26–1.36 µm). ArF immersion lithography was used as the lithography tool. We also used a half-tone mask with semi-transparent MoSi as the lithography mask because a half-tone mask gives a 0.3 nm smaller standard deviation of LER, σ LER, than a binary mask does, due to the resolution improvement by optical interference with phase-shifted light.[ Reference Horikawa, Seki, Toyama, Koshino, Yokoyama, Ohtsuka, Sugiyama, Ishitsuka, Yamagishi and Sano 26 ] From the standpoint of low LER pattern formation, we selected a high-resolution positive-tone chemically amplified photoresist. For an etching mask we used, a multi-layered mask structure including a photoresist layer and hard mask layers. The lithography process for waveguide pattern formation was optimized for minimizing LER and the shift of waveguide width. After resist pattern formation by photolithography process, the waveguide core pattern was formed by anisotropic dry etching, and then a 2-μm-thick SiO2 film was deposited as a cladding layer.
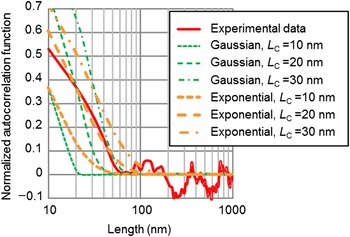
Vertical sidewall of the waveguide core and quite small deviation from design in waveguide width and height were confirmed in the cross-section image for the fabricated waveguide by transmission electron microscopy (TEM) [Fig. 2(a)]. In our previous paper, regarding the fabrication errors in 440-nm-wide/220-nm-thick waveguides, it has been estimated that standard deviations in waveguide cross-sectional size for a single 300-mm wafer were confirmed to be 0.83 nm in width and 0.24 nm in height.[ Reference Horikawa, Shimura, Jeong, Tokushima, Kinoshita and Mogami 27 ] By the edge pattern analysis of a plan-view image for the waveguide core by scanning electron microscopy (SEM) [Fig. 2(b)], the value of σ LER was evaluated to be 1.0 nm (1σ). Figure 3 shows the autocorrelation function analysis calculated using the waveguide edge pattern. The simulation curves with exponential autocorrelation functions [R(u) = σ LER 2 EXP(−|u|/L C)] and Gaussian autocorrelation functions [R(u) = σ LER 2 EXP(−|u|2/L C 2)] are also plotted in Fig. 3, where L C is a correlation length for LER. In the distance range <100 nm, the observed autocorrelation function almost agrees with the exponential autocorrelation function with L C of 20 nm. We note that, in the comparison with the previous reports,[ Reference Sparacin, Spector and Kimerling 8 , Reference Barwicz and Smith 28 ] the estimated values of σ LER of 1.0 nm and L C of 20 nm are relatively low.
(a) TEM cross-section of the waveguide, and (b) SEM plain view of the waveguide core.

Autocorrelation function calculated using the waveguide edge pattern in Figure 2(b). Exponential-type and Gaussian-type theoretical curves are plotted in the graph.

Typical test elements and measurement setup for propagation loss measurement are shown in Fig. 4. The amplified spontaneous emission light propagating through a single-mode fiber was optically coupled to waveguides by butt–joint coupling to a simple spot-size converter with a tapering-shaped waveguide. The coupling loss between the fiber and the spot-size converter is about 5 dB for the C-band and 4 dB for the O-band. To evaluate the transmittance for the waveguide with a given length, three devices with the same waveguide length in the same die on a single wafer were measured, and then we use the average value of them. The propagation loss per unit length was evaluated from slope in the dependence of transmission intensity on waveguide lengths. The evaluation of propagation loss was done for a several chips on two wafers fabricated by the same fabrication flow. Because the values of the propagation loss for these chips agreed with each other within the experimental error, we used the results for the center chip on one wafer in the following description.
Typical test elements and measurement setup for propagation loss measurement.

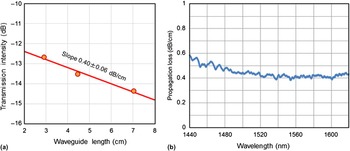
Figure 5(a) shows the dependence of transmission intensity on the length of the waveguide A (with a width of 440 nm and a height of 220 nm) for a wavelength of 1.55 µm. The propagation loss was evaluated to be 0.40 ± 0.06 dB/cm from the slope in linear fitting. The propagation loss spectra in the C-band for the waveguide are shown in Fig. 5(b). It was confirmed that the propagation loss was <0.5 dB/cm in the entire C-band (1.53–1.565 µm), although the loss gradually increases with the decrease of the wavelength in the range <1.52 µm.
(a) The dependence of transmission intensity on the length of the waveguide A (440 nm wide and 220 nm high) for a wavelength of 1.55 µm, and (b) propagation loss spectra in the C-band for the waveguide A .

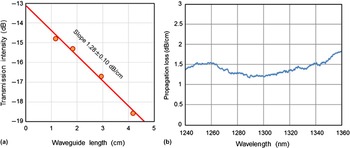
Figure 6(a) shows the dependence of transmission intensity on the length of the waveguide B (with a width of 320 nm and a height of 220 nm) for a wavelength of 1.31 µm. The propagation loss was evaluated to be 1.28 ± 0.10 dB/cm. In the propagation loss spectra for the waveguide B [Fig. 6(b)], the propagation loss showed the minimum about 1.28 µm and was <1.8 dB/cm throughout the entire O-band (1.26–1.36 µm).
(a) The dependence of transmission intensity on the length of the waveguide B (320 nm wide and 220 nm high) for a wavelength of 1.31 µm, and (b) propagation loss spectra in the O-band for the waveguide B .

To the best of our knowledge, these obtained losses of 0.40 dB/cm for 1.55 µm and 1.28 dB/cm for 1.31 µm are the lowest propagation loss values for the lowest-order TE mode propagation in wire waveguides.
Propagation loss mechanism
The physical origin for the propagation loss of the wire waveguides can be classified into the following four categories: (1) absorption in the silicon core such as bulk absorption, (2) scattering at the interface between the silicon core and the clad, (3) absorption by impurities in the interface and the clad, and (4) optical leakage to the silicon substrate through BOX. The bulk absorption of non-doped silicon for 1.55 nm infrared light is quite small. Although it was reported that impurity absorption due to metal residue at the interface[ Reference Barwicz, Holzwarth, Rakich, Popovic, Ippen and Smith 29 ] and H2O in clad[ Reference Kinoshita, Horikawa, Shimura, Takahashi and Mogami 30 ] degrade the propagation properties, these factors can be eliminated by the careful cleaning of the waveguide surface and appropriate post-process design. Regarding optical leakage, the leakage of propagating light for the lowest-order TE mode propagation to the substrate was estimated to be a negligible value <1 × 10⁻⁴ dB/cm for a BOX thickness more than 1.5 µm.[ Reference Sparacin 31 ] Thus, it is considered that scattering at the interface between the silicon core and clad is the main cause of the propagation loss.
The analytical relationship between scattering loss α Scatter and σ LER was derived by Payne and Lacey in the following forms using a 2D volume current method as a perturbation technique[ Reference Payne and Lacey 22 ]:
 $${\alpha _{{\rm Scatter}}} = \displaystyle{{\; {\sigma _{{\rm LER}}}^2} \over {\sqrt 2 \; {k_0}\; {n_{{\rm Si}}}{{(w/2)}^4}}}g({n_{{\rm eff}}}, {n_{{\rm Si}}}, {n_{{\rm clad}}}, w)\,f({L_{\rm c}}),$$
here k 0, n Si, and w are a free-space wave number, the refractive index of silicon, and the waveguide width, respectively. Regarding the function g, although many normalized parameters were used in deviation in ref. Reference Payne and Lacey22, we here express the function only using basic waveguide parameters in the following form:
 $$g({n_{{\rm eff}}},{n_{{\rm Si}}},{n_{{\rm clad}}},w)\; \sim\; \displaystyle{{{{(w/2)}^4}k_0^4 (n_{{\rm Si}}^2 - n_{{\rm eff}}^2 )(n_{{\rm Si}}^2 - n_{{\rm clad}}^2 )} \over {1 + (w/2){k_0}\sqrt {n_{{\rm eff}}^2 - n_{{\rm clad}}^2}}}, $$
here n eff and n clad are the effective refractive index of the waveguide and the refractive index of the clad, respectively. The value of g slowly varies with the parameters of the waveguides. Although f(L C) in Eq. (1) has a complicated form, and, for strong guiding waveguides, such as silicon wire waveguides, it can be approximated in the following form[ Reference Payne and Lacey 22 ]:
 $$f({L_{\rm c}})\; \sim\; \displaystyle{{{L_{\rm C}}{k_{\rm 0}}\sqrt {2(n_{{\rm eff}}^2 - n_{{\rm clad}}^2 )}} \over {1 + L_{\rm C}^2 k_{\rm 0}^{\rm 2} (n_{{\rm eff}}^2 - n_{{\rm clad}}^2 )}},$$
here we expressed the function using only basic parameters and L C. The f(L C) gradually increases with the increase of L C for small L C and has a maximum value at around L C ~ 120 nm, for the waveguides with a width of 440 nm and height of 220 nm that were tested for the lowest-order TE mode propagation in the C-band.
The above analytical formula by Payne and Lacey was originally developed for silica-based waveguides in planar lightwave circuits (PLCs). In the quantitative comparison with experimental data for high-index-contrast silicon waveguides, it has been reported that their theory tends to overestimate the scattering loss.[ Reference Kinoshita, Horikawa, Shimura, Takahashi and Mogami 30 ] Barwicz and Haus recently developed a 3D simulation technique for rectangular-shape waveguides using a 3D volume current method.[ Reference Barwicz and Haus 23 ] Although no simple analytical formulation exists in their simulation, they presented useful graphs showing the relationship between LER and scattering loss for three core materials: SiON, SiN, and Si.
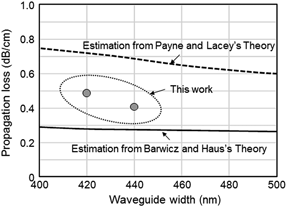
In this paper, we compare our experimental results with the corresponding values estimated using the above two theories. Figure 7 shows the dependence of the propagation loss for the C-band in sample A and also shows the simulation results obtained with Payne and Lacey's theory and Barwicz and Haus's theory. In the simulation, the roughness parameters evaluated in this study, σLER of 0.97 nm and L C of 20 nm, were used. It is confirmed that Payne and Lacey's theory also overestimates loss in our case, whereas Barwicz and Haus's theory exhibits loss values lower by 0.1–0.2 dB/cm than the experimental loss for our waveguides. This implies that scattering loss which obeys Barwicz and Haus's scattering theory is the main cause even for quite low loss waveguides, and some of the measured loss may have another physical origin. Further experiments and analysis should be done in order to clarify the propagation loss mechanism in low-loss wire waveguides.
The dependence of the propagation loss in C-band for the waveguide A on the waveguide width. The simulation results by Payne and Lacy theory and Barwick's theory were also plotted.

Conclusions
Low-propagation-loss silicon wire waveguides are key components for making large-scale optical integrated circuits with a small footprint. This paper has discussed fabrication requirements for low-loss waveguides through the assessment of the relationship between waveguide loss and fabrication technology in previous studies. The importance of high-resolution lithography and an adjusted lithography process window was pointed out. The propagation characteristics of the low-loss waveguides fabricated using ArF immersion lithography were described. As for the propagation performance of the waveguides, rectangular silicon waveguides 440 nm wide and 220 nm high showed a low propagation loss of 0.40 dB/cm in the lowest-order TE mode propagation for a wavelength of 1.55 µm. A low propagation loss of 1.28 dB/cm was also confirmed for 320-nm-wide, 220-nm-height waveguides for a wavelength 1.31 µm. The analysis with Barwicz and Haus's theory indicated that sidewall scattering is the main cause of propagation loss even in such low-loss waveguides. These high-performance wire waveguides contribute to realizing the low-operation-power optical circuits using silicon photonics technology for data communication.
Acknowledgments
This research was partly supported by the New Energy and Industrial Technology Development Organization (NEDO). The authors thank Mr. M. Seki, National Institute of Advanced Industrial Science and Technology (AIST), for his valuable information and discussion about ArF immersion lithography technology.