Implications
Colostrum plays an essential role in piglet survival and growth by providing immunoglobulins. Neonatal piglets lack globulins, relying on colostrum as the main source of antibody. Colostrum immunoglobulin G (IgG) composition can vary considerably among sows. Limited IgG content in sow colostrum can jeopardize piglet survival. Currently, there is no practical way of measuring colostrum IgG concentration at herd level. We found the Brix refractometer to be reliable, cheap and a fast means to estimate IgG concentration in a sow’s colostrum. This method can be easily and widely introduced to improve management practices in sow farms.
Introduction
Pre-weaning piglet mortality continues to represent a general problem in sow herds worldwide and ranges from 11% to 24% according to country (Oliviero, Reference Oliviero2013). The major causes of piglets mortality in early postnatal life are lower BW, inadequate colostrum intake, hypothermia and hypoglycemia (Dividich et al., Reference Dividich, Rooke and Herpin2005). Piglets are born without an active adaptive immune system and, due to intrauterine placental barriers, with no maternal antibodies, which makes them dependent on innate immune responses and uptake of passive maternal immunity (Rooke and Bland, Reference Rooke and Bland2002; Salmon et al., Reference Salmon, Berri, Gerdts and Meurens2009). The concentration of IgG in the plasma of piglets shortly after birth is positively correlated with survival and, in addition, dead piglets have lower serum IgG concentration than their surviving fellow piglets, indicating low colostrum intake (Vallet et al., Reference Vallet, Miles and Rempel2013). Both colostrum yield and IgG contents vary greatly among sows (Foisnet et al., Reference Foisnet, Farmer, David and Quesnel2010). Factors affecting the total colostrum yield are attributed to environment-related factors, as well as to sow and piglet characteristics (Devillers et al., Reference Devillers, Le Dividich and Prunier2007; Quesnel Reference Quesnel2011). As reported by Quesnel et al. (Reference Quesnel, Farmar and Theil2015) and summarized by Hurley (Reference Hurley2015), the average IgG content in colostrum (0 to 3 h from the start of farrowing) is around 64 mg/ml. Concentration of IgG in maternal colostrum significantly affects the acquisition of passive immunity and therefore knowledge on IgG content of colostrum appears to be essential to determine the correct actions in order to reduce piglet pre-weaning mortality. Currently, there is no practical way of measuring colostrum IgG concentration at herd level. Brix refractometer has been proposed as a reliable, cheap and fast means to estimate IgG concentration of maternal colostrum in cows (Chigerwe et al., Reference Chigerwe, Tyler, Middleton, Spain, Dill and Steevens2008; Quigley et al., Reference Quigley, Lago, Chapman, Erickson and Polo2013), sheep (Harker, Reference Harker1978) and horses (Cash, Reference Cash1999). The objective of this study was to evaluate a digital Brix refractometer to measure IgG for sow colostrum on-farm compared with an ELISA laboratory assessment and to determine the extent of agreement between the two methods. We aimed also to establish criteria for evaluation of colostrum IgG content and to describe the chemical composition of sow colostrum in the observed farms.
Material and methods
Description of study population
The experimental protocol was approved by the Animal Experiment Board in Finland – permission ESAVI/3331/04.10.03/2011. The experiment was performed in 11 Finnish commercial pig farms and included 153 sows of mixed parities (from 1 to 10, 3.64±0.14) and cross-bred Yorkshire×Landrace. Sows were artificially inseminated within 4 to 6 days after weaning. During gestation, sows were housed in groups of 15 to 20 sows. The group housing rooms were equipped with individual feeding stalls. Sows were shifted to a farrowing house ~1 week before the expected date of farrowing. Sows were kept in individual farrowing crates (200 cm×80 cm). Parturition was observed with as little as possible interference in the farrowing process. The birth of the first piglet was considered to represent the beginning of parturition (T 0). Sows were vaccinated against Erysipelas and Parvovirus during lactation and against Escherichia coli 3 weeks before farrowing.
Colostrum sample collection
Colostrum samples (n=153) were collected within 0 to 3 h after birth of the first piglets to validate the Brix values. In addition, to monitor sow postpartum IgG profile, colostrum samples were collected from 11 sows (parity range 1 to 9, 4.18±0.81, all on the same farm) at T 0 and 2, 4, 6, 8, 10, 16 and 24 h (T 24). For IgG analysis (n=153) a single 5 to 6 ml colostrum sample was collected from the first three pairs of teats located in the anterior udder. From 34 sows of two herds, 35 ml of colostrum was obtained from the first three pairs of teats within 0 to 3 h from the birth of the first piglets for composition analysis. The sample was taken from all the teats if colostrum ejection was insufficient for the sows included in the profile analysis T 0 to T 24 (n=11). Brix measurement was performed on-farm and the remaining sample fraction was immediately frozen at −20°C until further analysis.
Brix measurement of colostrum sample
The digital Brix refractometer is used to measure % sucrose in liquids, and when used in non-sucrose-containing liquids approximates the amount of total solids (TS %) (Quigley et al., Reference Quigley, Lago, Chapman, Erickson and Polo2013). A 0.3 ml of freshly drawn colostrum sample was used for the on-farm measurement of Brix percentages shortly after collection. A commercial digital refractometer (digital hand-held pocket refractometer; Atago, Tokyo, Japan) was used with a range of 0 to 53% Brix.
Colostrum Immunoglobulin G concentration analyses
The concentrations of IgG in the colostrum were analyzed (dilution 1 : 1 000 000) in duplicate using a commercial kit (Pig IgG ELISA kit, Bethyl Laboratories, Montgomery, TX, USA). Frozen colostrum samples were thawed at 4°C overnight and then warmed at 37°C for 20 min in a water-bath to ensure homogeneity of fat and other particles. The intra- and inter-assay coefficients of variation were 4.9% and 6.4%, respectively.
Colostrum chemical composition analyses
Nutritional composition of colostrum samples was tentatively analyzed according to a similar method verified by Decaluwe et al. (Reference Decaluwé, Maes, Declerck, Cools, Wuyts, De Smet and Janssens2013) with a different Fourier transform IR spectroscopy device. The TS, fat, protein and lactose content were analyzed using MilkoScanTM FT+ (Foss, Hillerød, Denmark). Samples were diluted 1 : 2 with distilled water because of the high volume needed for processing, as the method for FTIR analysis described by Decaluwé et al. (Reference Decaluwé, Maes, Declerck, Cools, Wuyts, De Smet and Janssens2013).
Criteria for colostrum evaluation using Brix refractometer
Based on Quesnel et al. (Reference Quesnel, Farmar and Theil2015) and in the summary review of 12 studies by Hurley (Reference Hurley2015), the IgG content, peaks shortly after farrowing, and the concentration is reported to be ~64 mg/ml at this time, whereas it decreases to around 10 mg/ml at the end of colostrogenesis. As we are testing the colostrum with the Brix refractometer at the beginning of colostrogenesis (0 to 3 h) we are expecting to find levels of IgG which are near to the peak values found in literature for this period of time. On the contrary, values of IgG near to the lowest levels (10 mg/ml) are not expected to be found during early colostrogenesis (0 to 3 h). We therefore placed our observations into four categories based on graphical evaluation of the data and using correlation analysis of the concentrations of IgG and the Brix reading. We defined a cut-off point of 50 mg/ml as an adequate level of IgG at early colostrogenesis (0 to 3 h) according to the findings of 12 different studies which found an average level of 64 mg/ml with a range from 52 to 102 mg/ml, as summarized in the review paper by Hurley (Reference Hurley2015).
Statistical analysis
Statistical analysis was performed using SPSS 22.0 software (IBM Company Headquarters, Chicago, IL, USA). Normally distributed variables are reported as LSmean±SEM and non-normally distributed variables as median±interquartile range. Normality and homogeneity of variance of the residuals were examined graphically and verified using the Kolmogrov–Smirnov test, Q–Q plot and Levene’s test. The correlation analysis was performed using Pearson correlation analysis. The coefficient of correlation was calculated to determine the level of relationship between Brix refractometer values (TS %) and IgG 0 to 3 h mg/ml measurements (ELISA). Linear regression was used to determine which variables were associated with colostrum IgG content and composition. The dependent variable was colostrum IgG content (IgG 0 to 3 h mg/ml) and composition (% fat, % protein, % lactose, % TS) and independent variables were herd and parity for each model. The non-normally distributed variable IgG 0 to 3 h mg/ml was log transformed for statistical analysis. When an effect was statistically significant, differences between means were assessed with independent samples T tests. The parity was categorized in five classes: 1, 2, 3, 4 and 5 to 10. The overtime change of the colostrum IgG composition in the profile analysis T 0 to T 24 was subjected to ANOVA) using a repeated measurement GLM.
Results
Colostrum Immunoglobulin G concentrations
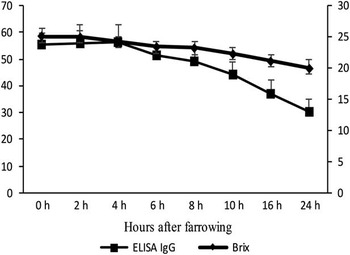
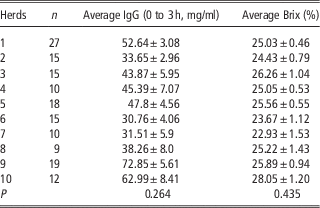
Colostrum concentrations of IgG at 0 to 3 h after farrowing were 52.03±30.70 mg/ml. Concentrations of IgG in colostrum at 0, 2, 4, 6, 8, 10, 16 and 24 h after birth of the first piglet are shown in Figure 1. The concentration of IgG decreased on average by 50% during the 1st day of lactation. Statistical analysis of the time effect showed that reduction was significant (P<0.001) at different time points (Figure 1). The individual sow profile (n=11) analysis showed that a major drop (43%) in colostrum IgG concentration occurred within 10 h of farrowing and concentration decreased on average by 80±15.9% in 70% (n=8) of sows within 24 h of farrowing. In three sows, the concentration decreased by 11±5.8% or less during 24 h postpartum. Colostrum concentrations of IgG at 0 to 3 h were not influenced by sow parity and did not differ among the herds (P>0.05) (Table 1).
Descriptive graph with the mean concentration of immunoglobulin G (IgG) and Brix refractometer % in colostrum at 0, 2, 4, 6, 8, 10, 16 and 24 h after the birth of first piglet.

Herd averages for immunoglobulin G (IgG) and Brix refractometer % in colostrum within 0 to 3 h after birth of first piglet

Mean±SEM is given.
There is no difference among the herd (P>0.05).
Colostrum composition
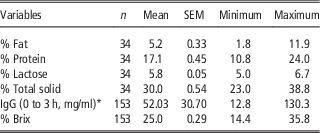
Nutritional composition (%) of colostrum at 0 to 3 h postpartum is shown in Table 2. Differences in colostrum composition were recorded between herds and among parity groups. Average lactose % concentration was 5.6±0.07 and 6.0±08 for the two herds, respectively (P=0.001). Lactose % concentrations were higher in first parity (P=0.04) sows than the others. Protein, fat, and TS concentration in the colostrum at 0 to 3 h were not influenced either by parity or by herd.
Mean nutritional composition based on fresh samples (%) tentatively analyzed using MilkoScanTM FT+ (Foss, Denmark) and mean concentration of immunoglobulin G (IgG) and Brix refractometer reading (%) in colostrum within 0 to 3 h after the birth of first piglet

* Not normally distributed variable.
Validation of the Brix refractometer
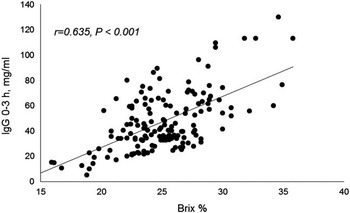
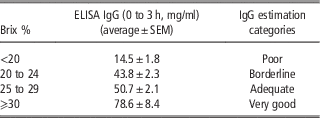
A total of 153 samples taken at 0 to 3 h from farrowing were assessed for Brix scores, and their values were normally distributed. The Brix percentages ranged from 14.4% to 35.8% (25.0±0.29). The mean values of the Brix refractometer scores in the profile analysis T 0 to T 24 at different time points, with respective IgG content by ELISA, are shown in Figure 1. There was a significant (P<0.001) reduction in Brix values during the 24 h time period, according to the ELISA IgG content of the samples. The Brix refractometer measurements of colostrum samples on-farm within 0 to 3 h of farrowing, and the corresponding IgG measurements from the ELISA, are examined graphically (Figure 2). For the Brix ELISA correlation analysis (r=0.63, P<0.001, n=153), as specified in the statistics paragraph, we used log transformed IgG values. A proposed classification of the Brix values into four categories for assessment of IgG content using a Brix refractometer is presented in Table 3. In addition, the correlation between % protein and % TS, and Brix scores were r=0.66, and r=0.57, respectively (P<0.001).
Relationship between Brix refractometer values (%) and immunoglobulin G (IgG) measurement using ELISA for 0 to 3 h colostrum sample (n=153). r is the coefficient of correlation.

Colostrum immunoglobulin G (IgG) content based on two methods of evaluation, and categories of estimation

Discussion
As indicated by the results, we established good correlation between the digital Brix refractometer values and log transformed ELISA IgG measurements of colostrum samples at 0 to 3 h from farrowing. Brix refractometer seems to be an acceptable method to assess colostrum IgG content at herd level during the initial hours of parturition, when IgG are expected to peak. In this study, the mean of ELISA-measured colostrum IgG concentration at 0 to 3 h (52.03 mg/ml, n=153) was lower than the previously published means of 92 mg/ml (n=37) (Decaluwé et al., Reference Decaluwé, Maes, Wuyts, Cools, Piepers and Janssens2014b) and 62.3 mg/ml (n=16) (Quesnel, Reference Quesnel2011). This could be due to fewer sows being included in those studies compared with this. However, there are also several possible explanations for the difference between IgG concentrations reported in this study and in previous studies. The amount and composition of colostrum produced by the sow can be influenced by sow and litter characteristics, endocrine status, nutrition, environmental factors or a combination of these factors (Farmer and Quesnel, Reference Farmer and Quesnel2009). We did not find an effect of parity on IgG concentration. Quesnel (Reference Quesnel2011) also observed that IgG concentrations in colostrum at parturition are not affected by parity, but reported that IgG concentrations in sows exceeding the fifth parity were greater than for first parity sows at 24 h postpartum. Our findings support those of Klobasa and Butler (Reference Klobasa and Butler1987) in that the concentration of IgG in colostrum varies widely among sows in the same unit. In contrast, they described that IgG concentration was influenced by parity, being decreased in first to third-parity sows and increased in fourth- to ninth- or tenth-parity sows. The decline in IgG concentrations after farrowing varied greatly among sows. In this study, 70% of the sows showed a drop in colostrum IgG >80±15.9% within 24 h of parturition. Our finding was consistent with the observations of Devillers et al. (Reference Devillers, Farmer, Le Dividich and Prunier2011) and Quesnel (Reference Quesnel2011), who showed that concentrations of IgG decreased on average by 70.9±18.1%. Quesnel (Reference Quesnel2011) described also that in 15% of sows colostrogenesis may be prolonged beyond 24 h postpartum, and IgG concentration decreased <50% on 1st day of farrowing. This probably explained why we recorded three sows showing no consistent drop in IgG over 24 h after farrowing. However, the practical major point in assessing colostrum IgG content at farm level might be to identify those sows producing colostrum with a low level of IgG because it is a major risk for a successful development of piglet passive immunity. There is a strong association between colostrum IgG and piglet IgG, showing that increased IgG level in colostrum improves the levels of IgG in piglets and potentially increases survival of the piglets (Kielland et al., Reference Kielland, Rootwelt, Reksen and Framstad2015). We propose a classification for the Brix results (Table 3) that follows proposals by Cash (Reference Cash1999) for equine colostrum evaluation with a Brix refractometer. According to this study and those conducted by Devillers et al. (Reference Devillers, Farmer, Le Dividich and Prunier2011) and Quesnel (Reference Quesnel2011), within 10 to 12 h after farrowing the level of IgG dropped by half (35 to 40 mg/ml) and after 24 h there was >70% drop in colostrum IgG content (10 to 16 mg/ml), which no longer represents an adequate level. The concentration of IgG in colostrum significantly affects the acquisition of passive immunity (Kielland et al., Reference Kielland, Rootwelt, Reksen and Framstad2015). Consequently, an estimation measurement might be of help for proper on-farm colostrum management. This is of great importance, especially when large litters are present, and cross-fostering and split suckling are common management practices employed to maximize colostrum intake. In large litters the average amount of colostrum available is less for each piglet. Therefore, if the estimated colostrum IgG content appears not to be good, a farmer knowing it in advance can pay more attention to those management practices (Oliviero, Reference Oliviero2013). Furthermore, as we have shown, the concentration of IgG in colostrum is highly variable and there is to date no easy method to predict the level on-farm. Present results validated the Brix measurement for estimating IgG in porcine maternal colostrum as a satisfactory method for on-farm use. Brix measures the amount of TS in colostrum. Our choice of a cut-off point of 50 mg/ml of IgG in colostrum, as adequate at early colostrogenesis (0 to 3 h), is based on the lowest range of IgG found, at this specific stage, by 12 studies summarized by Hurley (Reference Hurley2015). Considering that we are proposing the Brix refractometer as a management supporting tool to estimate colostrum IgG content at early colostrogenesis, we assume that taking the lower range of the IgG level (50 mg/ml), found in many previous studies, should be a fairly safe cut-off point to be able to catch adequate levels of IgG at this stage (0 to 3 h). Therefore, if using a Brix refractometer in the 1st hours of colostrogenesis (0 to 3 h) return values <20%, which we found correlated to average colostrum IgG of 14.5 mg/ml, this indicate an unexpected low level of IgG for this period of time (‘Poor’ category). Our intermediate category ‘Borderline’ is more indicating average values of colostrum IgG, which are slightly under expected averages. Categories ‘Adequate’ and ‘Very good’ express values which are on the expected averages or over. Our category ‘Borderline’ should be interpreted more carefully, and should not be considered to estimate a not adequate IgG content at early colostrogenesis, especially if the found Brix values are on the highest range of this category (23% to 24%), on the contrary, levels falling at the lowest range of this category (20% to 21%) might be considered more critical. Our suggestion, for Borderline results with Brix, would be to take another sample after maximum 1 to 2 h, to see if the development of the estimated IgG content is stable, increasing or decreasing from the initial value. Future investigation on how the different Brix categories would affect piglets IgG intake are of the main interest. The chemical composition of colostrum revealed higher concentrations of fat, protein, lactose and TS % compared with other studies (Devillers et al., Reference Devillers, Le Dividich and Prunier2007; Foisnet et al., Reference Foisnet, Farmer, David and Quesnel2010), but our results are comparable with those of Decaluwe et al. (Reference Decaluwé, Maes, Declerck, Cools, Wuyts, De Smet and Janssens2013). Colostrum nutritional compositions are influenced by the sow’s body condition and peripartal feeding strategy (Decaluwé et al., Reference Decaluwé, Maes, Cools, Wuyts, De Smet, Marescau, De Deyn and Janssens2014a). This could explain why the composition differs between herds (% lactose). Moreover, Farmer et al. (Reference Farmer, Charagu and Palin2007) showed that chemical colostrum composition differs among genotypes, but we had the same genetic line in different herds.
During the first 6 h, IgG alone accounts for most of the total protein (Klobasa and Butler, Reference Klobasa and Butler1987). There was a close correlation between colostrum IgG and Brix values are comparable with those reported by Bielmann et al. (Reference Bielmann, Gillan, Perkins, Skidmore, Godden and Leslie2010) and Quigley et al. (Reference Quigley, Lago, Chapman, Erickson and Polo2013) for cows. However, these levels of agreement are not as high as those of a study to evaluate the use of a Brix refractometer to gauge equine colostrum (Cash, Reference Cash1999). This may be attributable in part to the different chemical composition and the volume of colostrum produced by horses and cows. Perhaps, as described in cows with respect to horses, the volume and the proportion of protein in the colostrum could affect the accuracy of the refractometer (Bielmann et al., Reference Bielmann, Gillan, Perkins, Skidmore, Godden and Leslie2010). However, we found that the Brix refractometer has an acceptable level of sensitivity and might be used as a practical tool at farm level. Brix measurement of fresh sow colostrum (0 to 3 h) is an inexpensive, rapid and satisfactorily accurate method for estimating IgG concentration, indicating differentiation between good and poor IgG content of colostrum interpreting the results with the categories we proposed (Table 3). It comes from knowing the nature of the IgG physiological curve during the first 24 h postpartum, when the IgG level peaks in the first 3 h (average of several studies indicate around 64 mg/ml) and decreases rapidly until values of 10 mg/ml are reached 24 h postpartum (Hurley, Reference Hurley2015; Quesnel et al., Reference Quesnel, Farmar and Theil2015). Our Brix values of <20% were correlated with very low IgG levels (14.5 mg/ml), which are not expected during early colostrogenesis. Therefore, using Brix measurement at farm level might help to identify sows with an impaired IgG concentration at early colostrogenesis. In conclusion, Brix refractometers could be used at farm level to check colostrum during the earliest hours after farrowing (0 to 3 h) to indicate classification of IgG content, allowing improved management of lactating sows and neonate piglets.
Acknowledgements
This research was financially supported by the Finnish Ministry of Agriculture and Forestry (COLPIMO project, 1803/312/2014) and Finnish Veterinary Foundation. The authors like to express their gratitude to Merja Pöytäkangas for providing technical assistance in laboratory analysis.