1. INTRODUCTION
With the fast development of networking, data storage, and data collection capacity, “Big Data” is now rapidly expanding in all science and engineering domains. The techniques of data mining may give useful information for optimising industrial structures and improving production efficiency.
Receiving Automatic Identification System (AIS) messages from satellites is becoming increasingly common (Pallotta et al., Reference Pallotta, Vespe and Bryan2013) and the establishment of AIS terminals at shore-based network centres makes it possible to collect large-scale AIS data. Mature information technology and hardware can provide unprecedented computing capability for processing data and consequently, many maritime researchers are investigating AIS data mining.
There are two main research areas concerning AIS data: analysis of ship trajectories based on spatiotemporal attributes and statistical analysis based on other attributes. Analysis of ship trajectories is used for diverse purposes such as mapping shipping density for maritime situational awareness (Wu et al., Reference Wu, Xu, Wang, Wang and Xu2016; MMO, 2013; Shelmerdine, Reference Shelmerdine2015; Vettor and Soares, Reference Vettor and Soares2015; Fiorini et al., Reference Fiorini, Capata and Bloisi2016), characterising marine traffic patterns (De Souza et al., Reference De Souza, Boerder, Matwin and Worm2016; Tsou, Reference Tsou2010; Iperen, Reference Iperen2015; Aarsæther and Moan, Reference Aarsæther and Moan2009; Chen et al., Reference Chen, Lu and Peng2015; Altan and Otay, Reference Altan and Otay2017; Breithaupt et al., Reference Breithaupt, Copping, Tagestad and Whiting2017; Wang et al., Reference Wang, Zhu, Zhou and Zhang2017), anomaly detection (Pallotta et al., Reference Pallotta, Vespe and Bryan2013; Zhang et al., Reference Zhang, Goerlandt, Kujala and Wang2016; Zhen et al., Reference Zhen, Jin, Hu, Shao and Nikitakos2017; Ristic et al., Reference Ristic, Scala, Morelande and Gordon2008) and risk analysis (Zhou et al., Reference Zhou, Chen, Ge and Huang2013; Mou et al., Reference Mou, Van Der Tak and Ligteringen2010; Silveira et al., Reference Silveira, Teixeira and Soares2013; Mazaheri et al., Reference Mazaheri, Montewka, Kotilainen, Sormunen and Kujala2015). An issue that these researchers have to deal with is cleaning raw AIS data, which is not easy, because of many erroneous AIS messages.
Bailey (Reference Bailey2005) conducted research into reliability and completeness of AIS information in the Vessel Traffic Service (VTS) area of The Dover Strait. Results showed that more than 50% of ship destination information was incorrect, and 5% of messages contained a false Maritime Mobile Service Identity (MMSI) and course. Statistical research of AIS quality was made by Harati-Mokhtari et al. (Reference Harati-Mokhtari, Wall, Brooks and Wang2007). This study listed problems found based on a few months of data from Liverpool VTS and the AISLive company. For instance, more than one station broadcasting the same MMSI number creates discrepancies. Details show that information such as MMSI number, vessel type, position, are not reliable. An analysis by Banyś et al. (Reference Banyś, Noack and Gewies2012) focused on Heading (HDG) and Rate Of Turn (ROT) parameters. It was found that the AIS system is prone to receiving incomplete data broadcast by vessels' transmitters.
The quality of AIS data is a subject of interest for many researchers (Felski et al., Reference Felski, Jaskolski and Banyś2015; Wawruch, Reference Wawruch2017; Jaskólski, Reference Jaskólski2017; Peters and Hammond, Reference Peters and Hammond2011), but published research on pre-processing raw data to improve quality is limited. Shelmerdine (Reference Shelmerdine2015) took the development of a vessel database as the key to managing AIS data and for quality control. All fields were checked for obvious outliers. If it was not possible to correct an outlier, it was removed. The common method to filter inaccurate single position points is the gating of position, velocity and course (Sang et al., Reference Sang, Wall, Mao, Yan and Wang2015; MMO, 2013). To solve the problem of sharing MMSI numbers, a method of elimination was applied by MMO (2013) and Pallotta et al. (Reference Pallotta, Vespe and Bryan2013). Mazzarella et al. (Reference Mazzarella, Vespe, Damalas and Osio2014) proposed a nearest neighbour approach to assign AIS messages to the right tracks, but there was no detailed experimental method, performance or results. Wu et al. (Reference Wu, Xu, Wang, Wang and Xu2016) created a simple algorithm to calculate the likelihood of an association between an AIS message and each candidate vessel. It is used for processing massive data at a global scale but it cannot be applied in a small region where AIS messages are sampled at a high rate because the algorithm is unable to handle an association in the case where there are at least three consecutive abnormal track points. A similar method with velocity gating was proposed by Greidanus et al. (Reference Greidanus, Alvarez, Eriksen and Gammieri2016). Given that none of these techniques is universally applicable, it is necessary to propose a method with general applicability. The accuracy of time is the key to kinematic gating (Greidanus et al., Reference Greidanus, Alvarez, Eriksen and Gammieri2016; Wu et al., Reference Wu, Xu, Wang, Wang and Xu2016), but there are few studies on this. Most researchers remove data with the wrong MMSI and only focus on obvious mistakes. They seldom take account of the problem of temporal and spatial attributes in the dataset, such as time delay, boundary problems and other influencing factors.
The quality of the dataset is not only a key to the comprehensiveness of analysis but also the essential factor in avoiding misleading results. The lack of a systematic pre-processing method limits studies using AIS data mining. To improve the quality, this paper uses an overall error detection based on a month of AIS data from Zhoushan Islands and proposes methods for resolving various errors that were found.
The remainder of the paper is structured as follows. In Section 2, we summarise the errors in various quality dimensions of AIS data. In Section 3, the pre-processing methods are introduced. Section 4 shows the results of pre-processing AIS trajectories, and we conclude the paper in Section 5.
2. AIS DATA MATERIALS AND ERRORS
All ships of 300 gross tonnes and above displacement engaged on international voyages, cargo ships of 500 gross tonnes and above displacement not engaged in international voyages and all passenger ships regardless of size are required to fit an AIS transceiver (IMO, 2003).
There are 27 different types of AIS messages which can be broadcast. The content of AIS messages varies widely according to the type (Iphar et al., Reference Iphar, Napoli and Ray2015). This paper mainly focuses on position reports (message 1, message 18) and static information reports (message 5, message 19). Of the fields in these reports, seven fields (MMSI, longitude, latitude, Speed over Ground (SOG), hour, minute, and second) are considered essential for representing AIS trajectory and two fields (type, length) supply additional information for the corresponding trajectory.
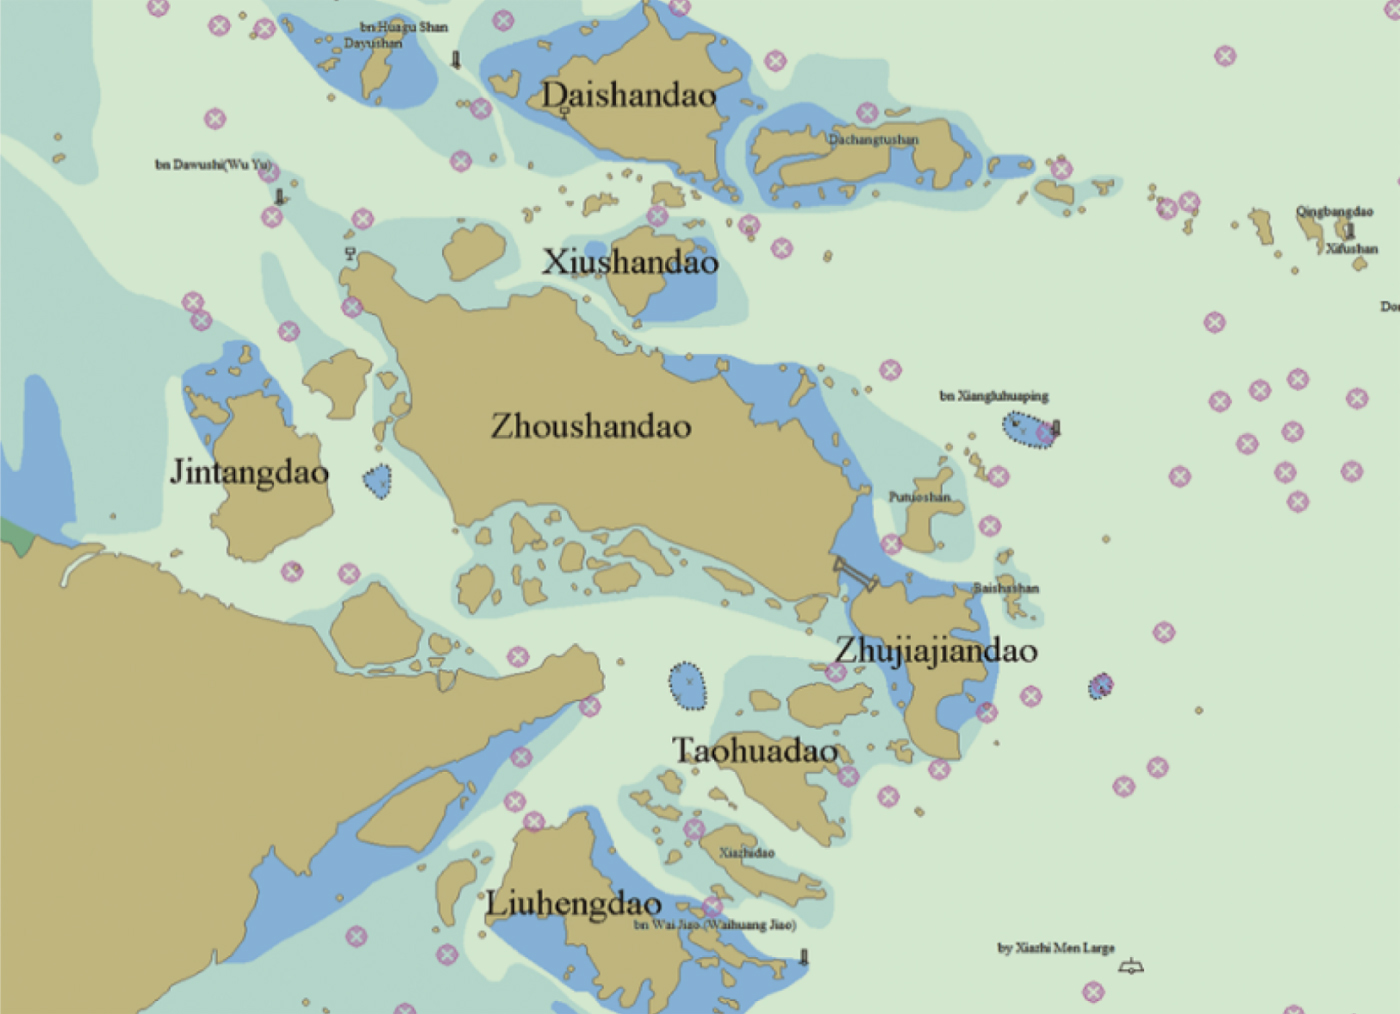
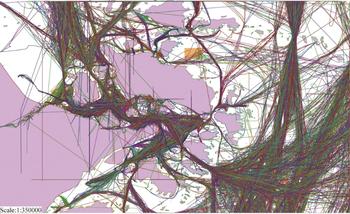
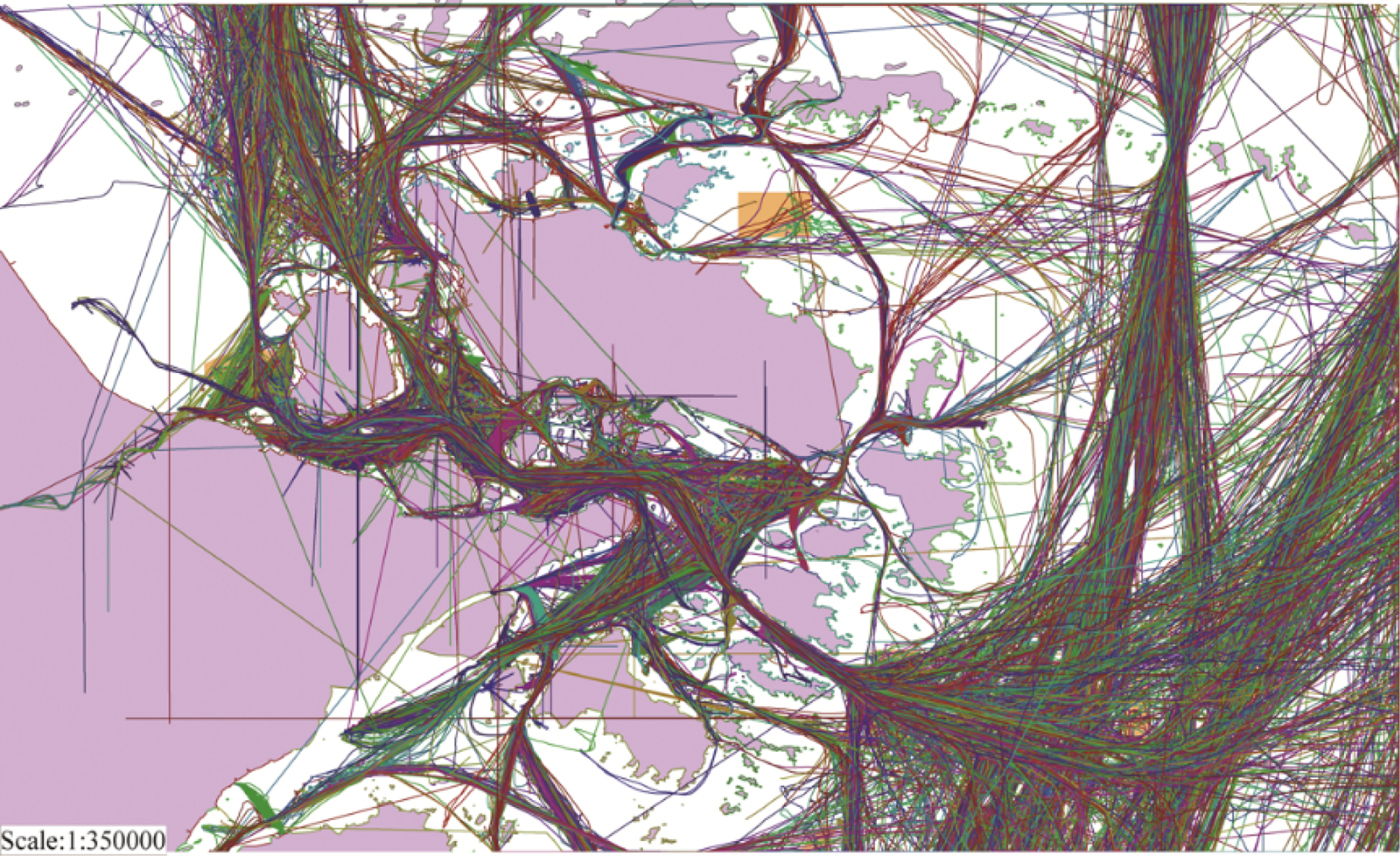
Our data was collected from the AIS data centre of the Chinese Maritime Authority in Ningbo. The research area is shown in Figure 1. The data is from January to February 2015. The quantity of raw data in the research area is given in Table 1. Figure 2 shows the raw AIS track data of the first week apart from the abnormal tracks (see Figure 4) which would obscure the other tracks in the figure.
Research area.

Distribution map of raw AIS track data from 1–7 January 2015.
The quantity of raw data in the research area.

There are many errors in the raw AIS track dataset. We conducted a study of AIS data quality, and the findings are summarised below, organised by AIS quality dimension.
2.1. Physical integrity
Physical integrity is a measure of the degree of validity of an individual track and AIS message, which includes reliability of the AIS message and completeness of the track.
2.1.1. Reliability of AIS message
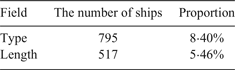
Reliability means the general coherence of the AIS message with respect to ITU recommendations (ITU, 2010). Our experiment focuses on fields including MMSI, SOG, Longitude, Latitude, Second, Minute, Hour, Length of ship and Type of ship. For example, 4·25% of total AIS type 1 messages that we collected from AIS base stations had latitude or longitude values larger than the maximum allowable values of 90° and 180°. We also found errors in other fields, and the proportion of messages that contain these errors and ships with unreliable additional information in the research area are presented in Tables 2 and 3.
Statistical result of unreliable messages.

Statistical result of ships with unreliable additional information.

2.1.2. Completeness of track
The completeness of track is defined by two standards. If the number of track points in a track is too small, or there is no corresponding static and voyage related information report (Table 3), the track will be considered as a track that lacks completeness, because it cannot represent track features of interest.
2.2. Spatial logical integrity
Spatial logical integrity means the extent of the correctness of time-space relationship between the messages in a sequential set of trajectory points, which includes accuracy, consistency, and relevance.
2.2.1. Accuracy of track
Considering an attribute a of an entity e, its standard value is v. The accuracy of a v' value would be the degree of closeness of v' with respect to v. In the case of an AIS trajectory, we take the number of logical track points in a trajectory as the measurement of the degree of accuracy. If all the track points are logical, the accuracy is maximal. However, in general, logical points form the majority of the whole track. Consequently, we determine the accuracy of the track based on whether illogical points are present.
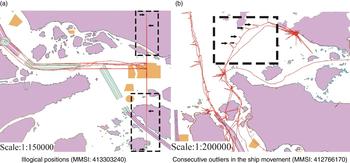
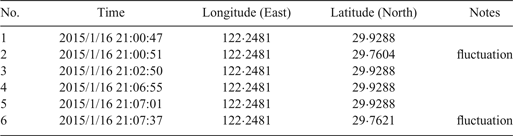
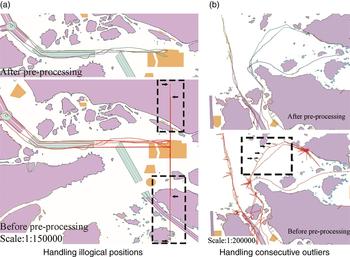
We found that there are random errors of position in a proportion of AIS tracks; their values of latitude or longitude changed illogically, as shown in Table 4. There are illogical positions in the chart of the track, as illustrated in Figure 3(a). In addition, there are also consecutive outliers in the ship movement (Figure 3(b)) that can be recognised by kinematic gating. The results show that 12·36% of ships generate such errors.
Random errors of position in AIS tracks.

Random errors in a track segment (MMSI: 413303240)

2.2.2. Consistency of track
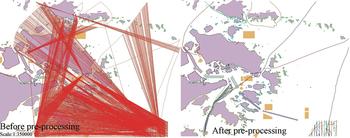
In an AIS trajectory, the source of the different track points must agree. The MMSI number is a unique number given to every vessel for identification. It is the sole means of discrimination between AIS ship stations, which is usually used to extract ships' trajectories. However, because of improper use, deliberate or accidental, it is observed that the same MMSI number can be used by different ships. If those data are collected in the same observation period, the ship may jump between multiple positions on the chart. Trajectories of ships with the same MMSI are illustrated in Figure 4.
Trajectories of multiple ships which share the same MMSI. (MMSI: 413000000)

In our research, there are two types of position reports (class A and class B) from different types of shipborne AIS devices, which are obviously from different ships. However, we found 127 MMSI numbers in both types of reports, such as 413000000, 88888888, and 413999990.
2.2.3. Relevance of track
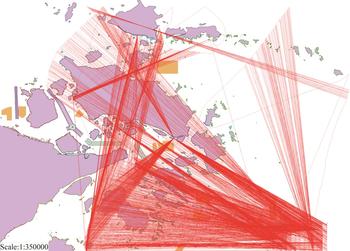
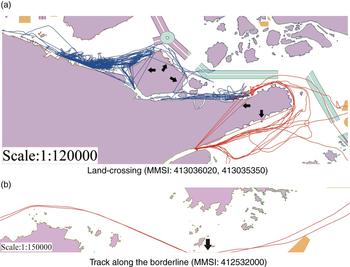
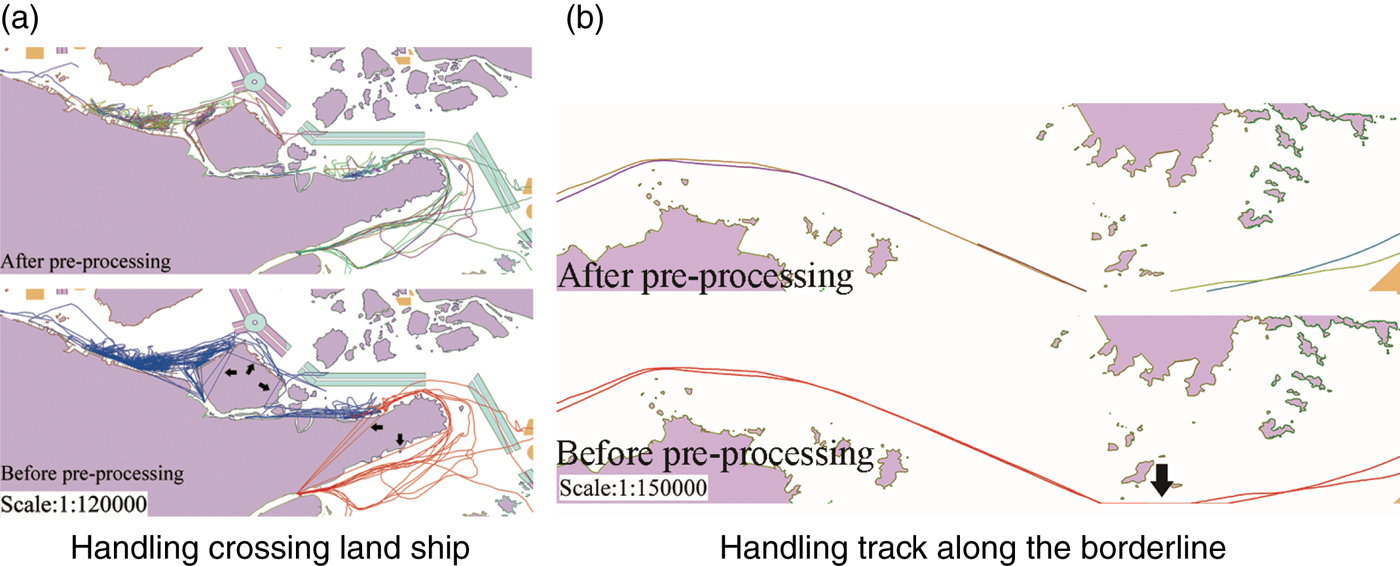
Relevance can measure the relational degree between two data objects. In the case of AIS trajectory, the problem of the time relationship between track points in a track is inevitable. Not all of the track data are completely preserved in the research area. For example, ships may cross the borderline repeatedly in the period, and this results in a loss of data. The tracks that lack relevance are illustrated in Figure 5, which includes the illogical tracks crossing the land and along the borderline.
Illogical track segments which are generated by two irrelevant track points.

2.3. Accuracy of time
AIS messages collected from AIS receiving stations are usually marked with an external time stamp, which is called recorded time. In the process of generating an AIS message, a communication time stamp is coded into the sentence, which is called generated time. It is observed that the time data of AIS messages have errors. Greidanus et al. (Reference Greidanus, Alvarez, Eriksen and Gammieri2016) compared AIS messages of the same ship received by different stations, and they found that these external time stamps can be inconsistent due to clock offsets and instabilities. Their results show that the quality of time information is related to the receiving station; the time of generation cannot be recorded precisely. This result is verified in our research.
A portion of position reports contain information of generated time including second, hour and minute (ITU, 2010). In our research, 15·66% of class A position reports contain such information. However, the proportion for class B is only 1·15%. We determine the time accuracy of a whole track based on a sequential set of all the deviations between the recorded time (in seconds) and the generated time (in seconds). The deviation is calculated as follows.
 $$\matrix{ {deviation} \hfill & { = (hour_{recorded} * 3600 + min_{recorded} * 60 + second_{recorded})} \hfill \cr {} \hfill & {\quad - (hour_{generated} * 3600 + min_{generated} * 60 + second_{generated})} \hfill \cr } $$
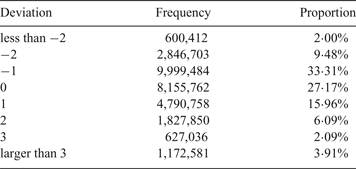
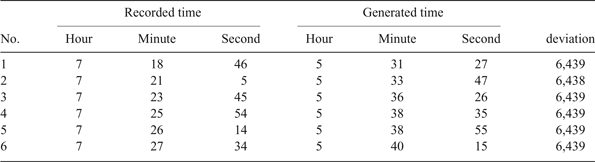
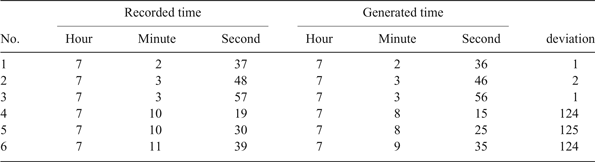
The statistical results of all the deviations is presented in Table 5. 94·09% of deviations are in the range of [−2, 3], which means that most records of time are almost the same as generated time. However, there are also large deviations which cannot be ignored in our research. Results show that the large deviations in some ranges are relatively more frequent, which means there are systematic errors in the time dataset. As illustrated in Table 6, the recorded time and generated time of those track points in the case of one exemplar MMSI demonstrate a more or less consistent deviation of 6,439s. These systematic errors may be caused by signal delay.
Statistical results of all the deviations.

Large deviations of consecutive track points (MMSI: 413468760).

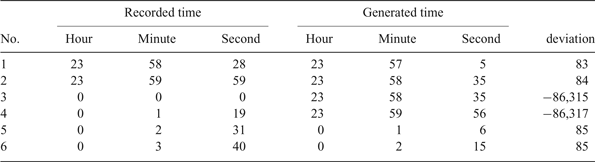
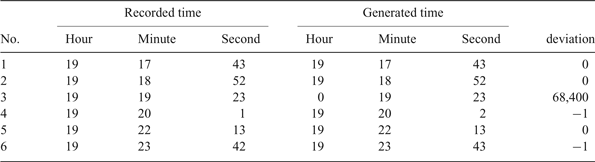
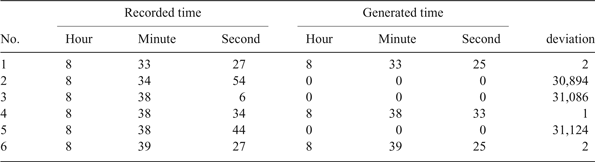
The deviation itself has errors in calculation. Firstly, because the time information only contains the values of hour, minute and second, an abnormal change may appear around 00:00 hours when the calculation is made based on time values that belong to different days, as illustrated in Table 7. Secondly, some fields in generated time may suddenly become zero (Table 8), and this phenomenon may appear consecutively (Table 9). Thirdly, tracks of different deviations may be linked together (Table 10). These random errors may be caused by information missing in the process of generating AIS messages.
Abnormal change around 00:00 (MMSI: 412036180).

Generated times that turned into a zero value (MMSI: 413442770).

Fields becoming zero consecutively (MMSI: 229733000).

Different deviations in the same period (MMSI: 413410960).

3. PRE-PROCESSING METHOD
Data quality is a measure of the extent to which a database accurately represents the essential properties of the intended application (Brodie, Reference Brodie1980). To improve the quality of AIS trajectories for better data mining studies, this paper proposes the following methods, organised by AIS quality dimension.
3.1. Physical integrity
The method in our research for improving physical integrity is to discard AIS messages that are not compatible with the ITU standard and tracks that lack completeness.
As described in Section 2.1.2, we judge the completeness of a track based on the number of track points and whether there is corresponding additional information. It is easy to collect large amounts of AIS data over a short time, because the AIS data sampling rate is very high (2 s −10 s). However, there are reasons which may cause a shortage of track points, such as signal loss and a brief stay in the research area. We believe that short tracks whose number of track points is less than 100 cannot characterise the movement of a ship. The threshold of completeness in pre-processing space data is empirically set as 100. That is to say, the track will be discarded if the number of track points is less than 100.
Additional information is included in the static and voyage-related information report (message 5) and extended class B equipment position report (message 19). The update rate of those reports is once every 6 min, so not every position report has a timestamp close to the additional information. After retrieving a record by the MMSI and timestamp of the initial and last track point, if we cannot find all the valid information that we need, the track will be discarded.
3.2. Spatial logical integrity
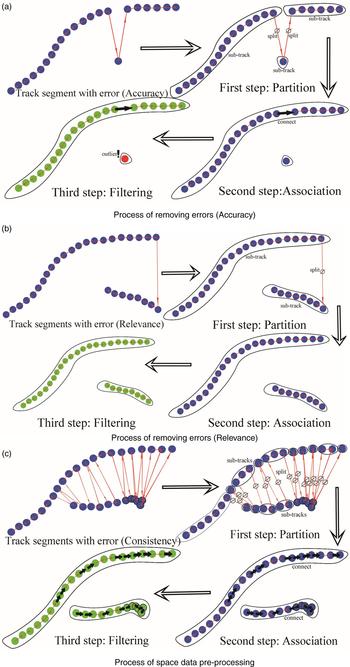
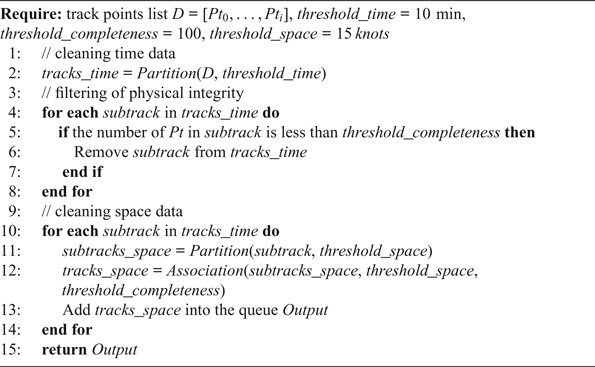
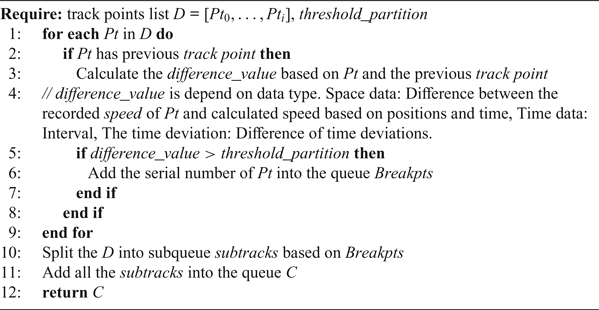
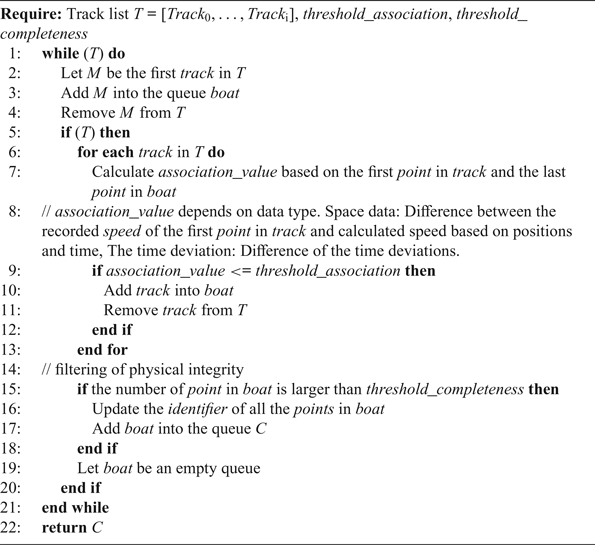
To solve the problems in Section 2.2 such as abnormal individual points, tracks that lack relevance and sharing of MMSIs, a method which can quickly process large amounts of historical AIS data is proposed, see Algorithm 1. The method processes the time data first, and then the space data, which consists of three parts, as shown in Figure 6. The first part is the partition, and a breakpoint is found to split the track into sub-tracks (see Algorithm 2 and the partition part in Figure 6). The breakpoint is determined based on the thresholds of space (speed gate: 15 knots) and time (10 min), which are set empirically. A sub-track can be an individual point or a track segment. The second part is the association of sub-tracks. All the sub-tracks will be judged by the threshold of space based on the last track point and the first track point of all the following sub-tracks (see Algorithm 3 and the association part in Figure 6. The big arrow between two sub-tracks means they can be associated). If the judgment condition is met, the sub-tracks can be associated with each other. The judgment of the new sub-track will continue until the individual association is done. The third part is filtering tracks that lack completeness, as described in Section 3.1 (see filtering part in Figure 6(a), the track that lacks completeness is marked with a note ‘outlier’).
Process of space data pre-processing.

Space Data Pre-processing.

Partition.

Association.

3.3. Accuracy of time
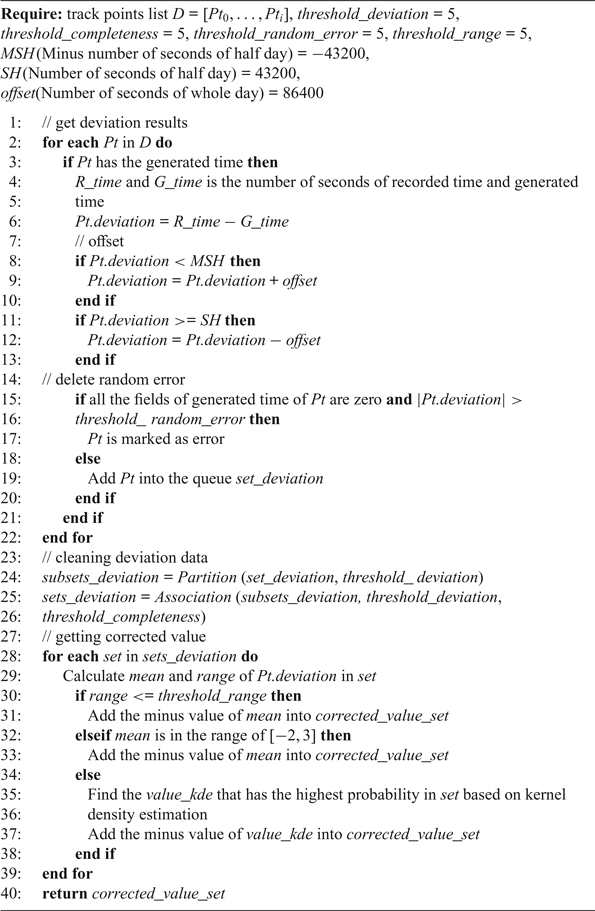
To solve the problem in Section 2.3, a method of correcting time data is proposed based on the deviation values between the recorded time and generated time of AIS messages, see Algorithm 4. D is a set of track points, and there are three steps including obtaining deviation results, cleaning deviation data and getting a value for correction.
Time correction.

Firstly, the time is converted to seconds for calculating deviation using Equation (1), and the calculation of the offset is made to remove the error caused by crossing 00:00 hours. The data whose fields of generated time are all zero and where the absolute value of deviation is larger than five will be discarded. Then a pre-processing method consisting of partition (Algorithm 2) and association (Algorithm 3) is used to remove the errors in deviation data. (The threshold of completeness in pre-processing time data is set empirically as five). Finally, the corrected value will be determined by the two statistical values of the deviation dataset which are mean and range. The range can measure the stability of the deviations between recorded time and generated time. The smaller the value of the range, the more stable the track's deviations are, which means the average of the deviations can more accurately measure the time accuracy of an entire track.
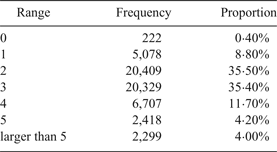
Most deviations are in the range of [−2, 3], so the threshold of deviation in Algorithm 4 is set as 5 seconds. The statistical results of the range of deviation based on the track data after Algorithm 1 is shown in Table 11. 96% of ranges are less than or equal to five, so we also consider 5 seconds as the threshold of range in the deviation dataset. If the range is less than or equal to five, the negative value of the mean of deviations will be considered as the corrected value.
Statistical results of range.

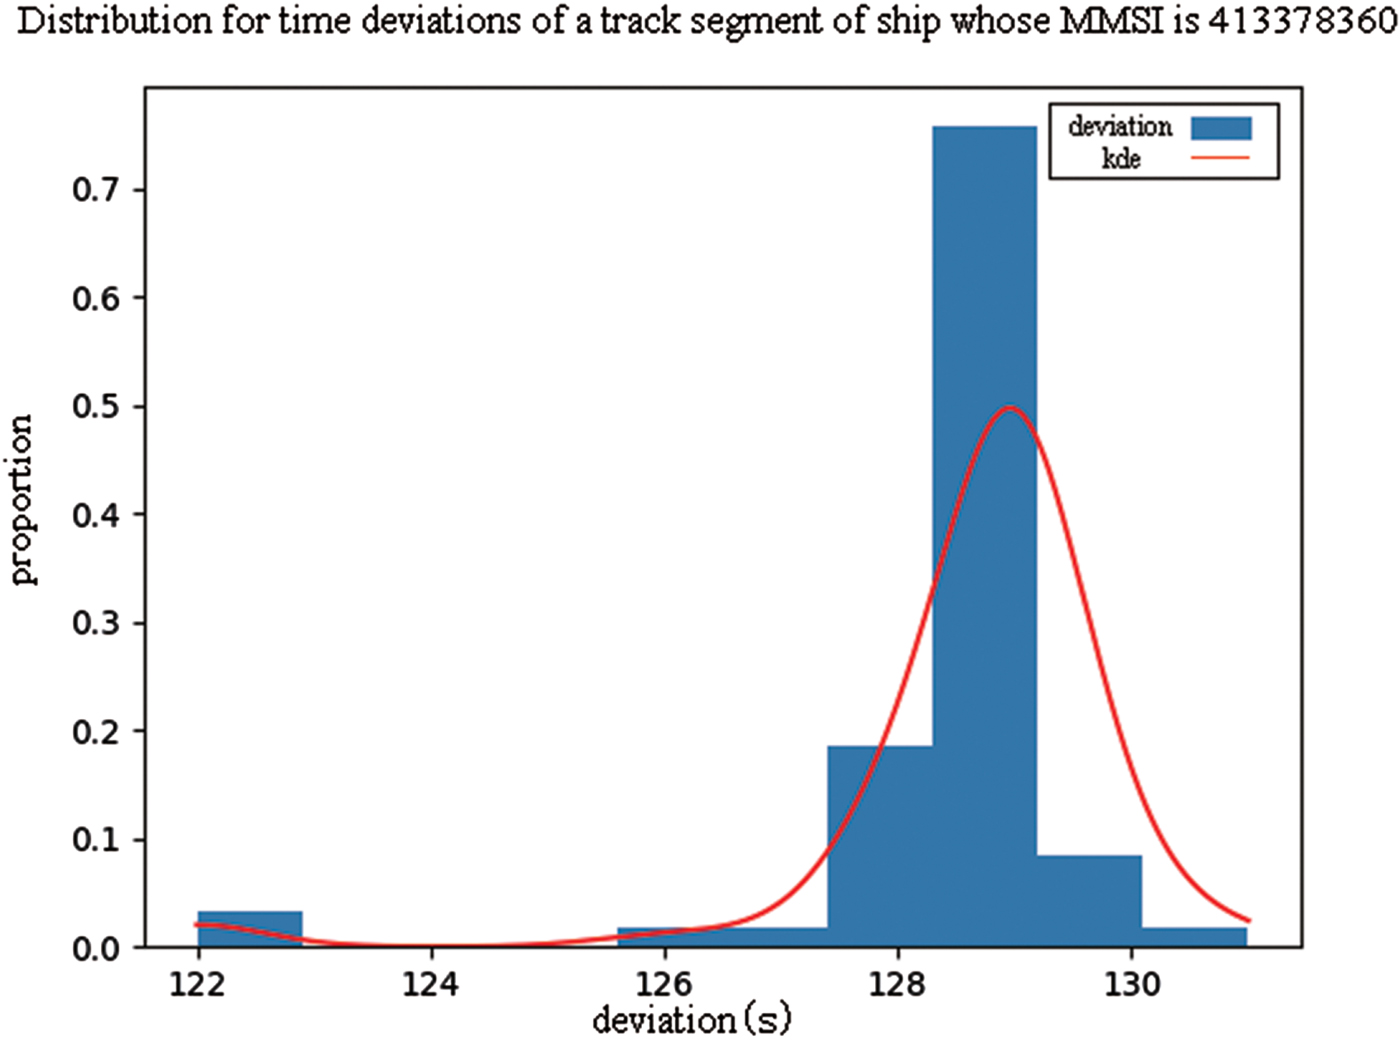
However, there are local changes in the density distribution of deviations in some tracks, so the value of the mean may become relatively invalid in those tracks whose range is larger than five, as illustrated in Figure 7 (units on the x-axis are seconds). In such cases, the corrected value will be discussed according to the mean value of deviations. Most deviations are in the range [−2, 3] so if the mean remains in this range, the local change will be ignored. However, if the mean is out of the range of [−2, 3], the minus value that has the highest probability in the set of deviations will be considered as the corrected value based on kernel density estimation, as illustrated in Figure 7 (KDE curve). The set of deviations is considered as  $X = \lcub x_{1}\comma \; x_{2} {\ldots} x_{n}\rcub $. The probability can be calculated as follows:
A distribution of deviations whose range is larger than five.

 $$f(x) = \displaystyle{{1}\over{n\eta \sqrt{2\pi}}} \sum_{i=1}^n \exp \left(-\displaystyle{{(x - x_i)^{2}}\over{2\eta^2}}\right)$$
 $$\eta = \left(\displaystyle{{4}\over{3n}}\right)^{\displaystyle{{1}\over{5}}} \sigma$$
where σ is the sample variance and the kernel function is a Gaussian kernel function.
It is worth mentioning that, in our period of observation, there were 269,493 messages whose number of seconds of generated time is larger than or equal to 60, that were not compatible with the ITU standard and discarded at the beginning of pre-processing. However, the proportion of these errors in the messages that contain generated time is very small (1·9%), and most tracks still have sufficient valid messages to calculate the deviation. Consequently, those errors will not influence the method.
4. RESULTS
In our research, there were 110,623,842 position report messages from 21,585 distinct MMSIs. After pre-processing, 106,245 track segments were output. 1·27% of the track points are discarded in space data pre-processing, and only 0·42% of the track points were discarded in the time correction. The detailed results are shown from two aspects: space and time.
4.1. Results of space
Based on the method proposed in Section 3.2, the distribution maps of AIS trajectories are shown in Figures 8–10.
Pre-processing effect in terms of track accuracy

Pre-processing effect in terms of track consistency.

Pre-processing effect in terms of track relevance.

Compared with the tracks in Figure 3, it is obvious that the abnormal track points have been discarded. The quality of track accuracy is improved (Figure 8).
Compared with the tracks in Figure 4, chaotic tracks of ships with the same MMSI have been recognised and split into several regular tracks with different colours (Figure 9). The quality of track consistency is improved.
Compared with the tracks in Figure 5, it is obvious that the problems of crossing land and unreal tracks along the borderline have been eliminated (Figure 10). The quality of track relevance is improved. The density maps of processed tracks are shown at resolutions of 0·2 km2.
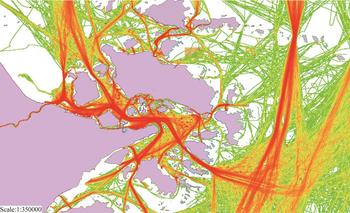
Figure 11 illustrates the density of AIS trajectories collected from 1–7 January 2015. All the popular traffic routes are recognised and marked in red. Also, the distribution of traffic volume is distinctly shown. The areas where ships often stop, such as anchorages, are highlighted in the form of a red spot.
Density map of AIS track data after pre-processing (1–7 January 2015).

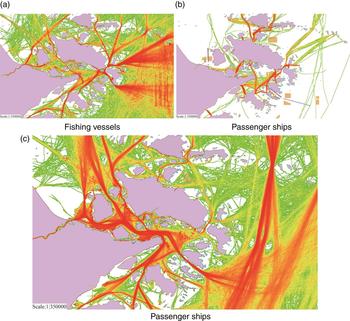
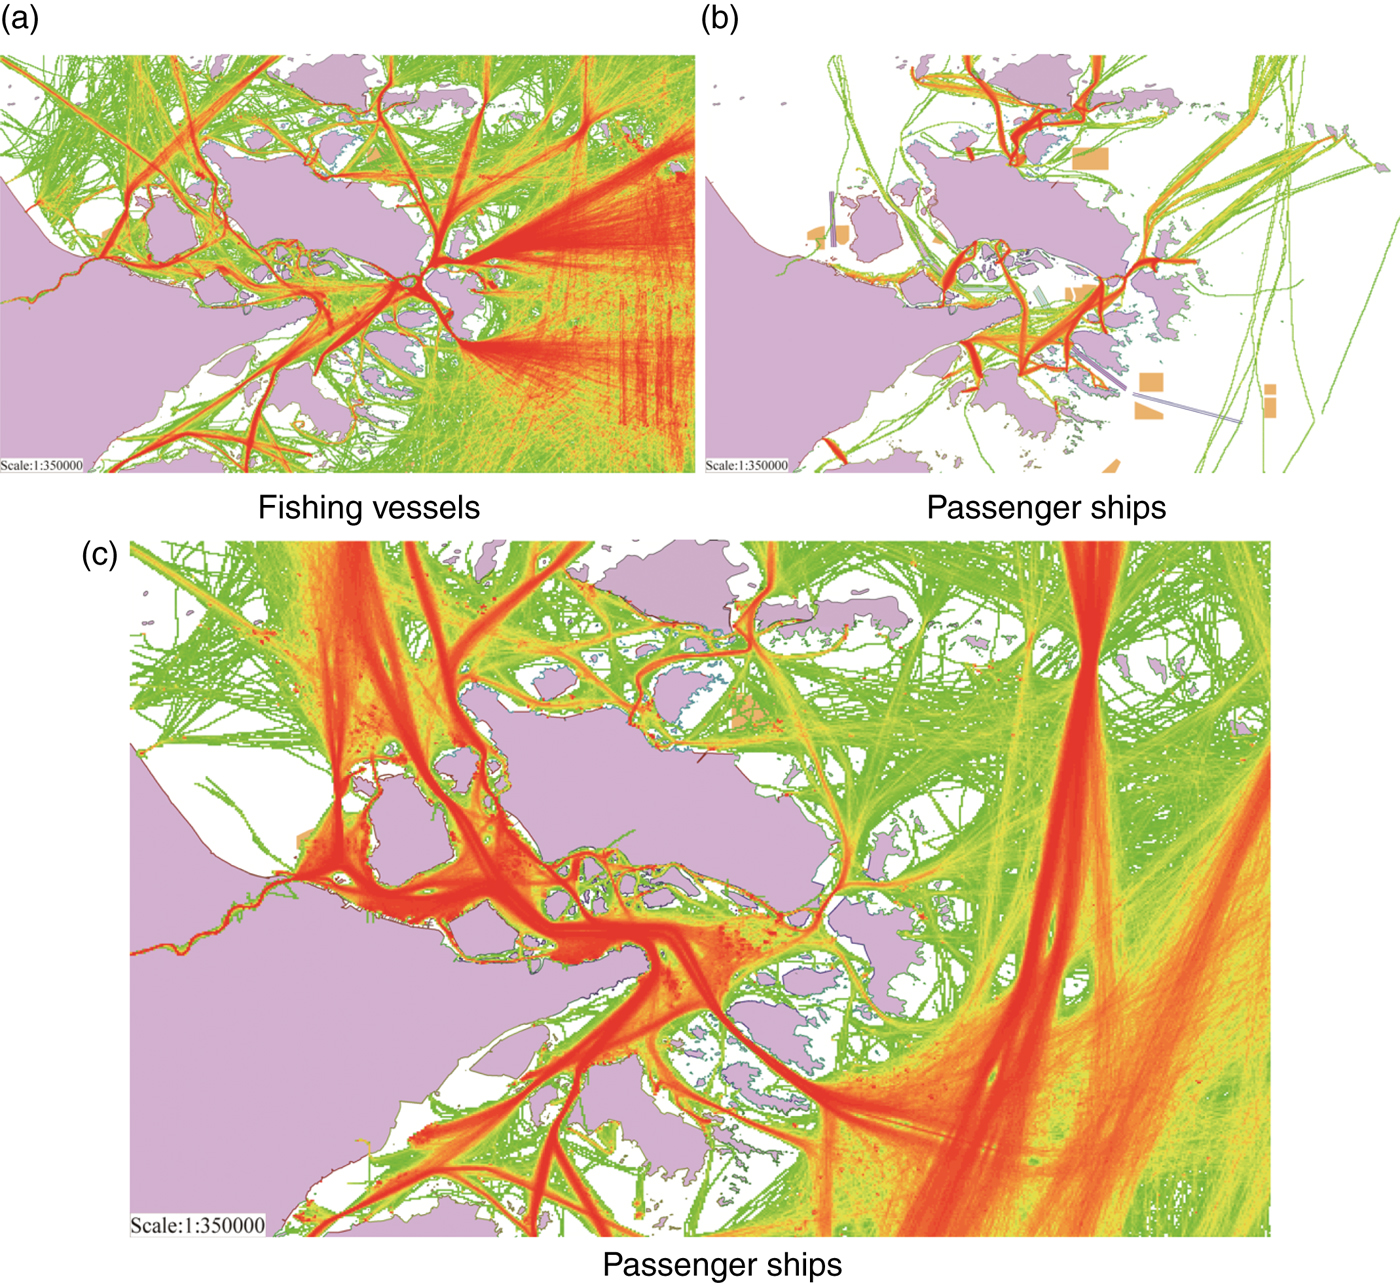
Based on AIS trajectories collected from January to February 2015, different types of density maps are shown. There are relatively few popular routes for fishing vessels. However, it is observed that there are radial track patterns between port areas and the open sea (Figure 12(a)) because the operating area of each fishing vessel and each time may be different. In contrast, the lines of passenger ships are fixed (Figure 12(b)), so most tracks are distributed in their prescribed routes. Figure 12(c) is the density map for cargo ships. Those tracks are distributed widely, and it is easy to determine popular routes considering economy and security.
Density map of different types of ships based on AIS track data after pre-processing (January 2015).
4.2. Results of time
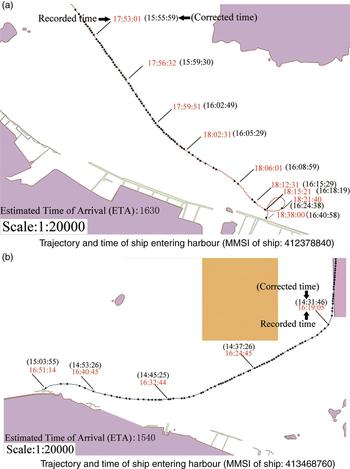
Our statistical results from pre-processing time data shows that there are 146 track segments whose mean time deviations are greater than 1 hour. Correction effects on two tracks of ships entering harbour on 25 January 2015 are illustrated in Figure 13.
Pre-processing effect in terms of time accuracy.

The Estimated Time of Arrival (ETA) of those two ships are 16:30 and 15:40 (25 January), respectively (see Figure 13). However, recorded time of track points near the destination are already 18:38 and 16:51 because of the delay in receiving AIS messages. Based on the method in Section 3.3, we determined the corrected value (−7, 022 seconds and −6, 439 seconds). The corrected time is the sum of corrected value and recorded time, which is shown in brackets (Figure 13). Obviously, corrected time of arrival is closer to ETA, so the corrected time is more precise.
5. CONCLUSION
As discussed in this paper, AIS data mining plays a key role in characterising the patterns of traffic on water, planning of aids to navigation, risk assessment in maritime supervision and management of sea areas. However, there are unavoidable errors in the dataset because of improper use, signal transmission problems and the AIS system itself. High-quality AIS track information is essential for acquiring valuable knowledge. For example, in the application of maritime accident investigation and obtaining digital evidence, the time of AIS track points is directly related to the encounter of vessels.
In this paper, the errors in AIS track data sets are analysed systematically and summarised by quality dimensions including physical integrity, spatial logical integrity, and accuracy of time. An algorithm with general applicability is proposed for improving the quality of spatial data, and a method based on time deviation is proposed for improving the accuracy of time which has rarely been reported in previous works. Distribution maps of ship tracks and density maps of different types of ships are shown based on one month of AIS data in the Zhoushan Islands area and the methods are validated by comparison.
The method cannot improve the quality of static and voyage related messages because it relies heavily on AIS users. It is observed that there are records of receiving time that are earlier than generated time, which is not researched in this paper. Future study will focus on more detailed application for further verification, and other pre-processing methods such as trajectory simplification.
FINANCIAL SUPPORT
This work was partly supported by “National Natural Science Foundation of China” (grant number: 51579025) and “Natural Science Foundation of Liaoning Province” (grant number: 201602084).