Implications
The production of milk and meat contributes to global warming through the emissions of nitrous oxide (N2O). Mitigation measures in herbivore production systems are necessary to limit increasing emissions while meeting the growing demand for food. This review outlines the current opportunities for mitigation in all important areas of farm management. At present, there is a broad range of mitigation options available, for every type of farm. This review highlights that recent reductions in N2O emissions are mostly a side effect of other policies, targeted at increased nitrogen efficiency and feed conversion efficiency.
Introduction
Livestock husbandry releases significant amounts of nitrous oxide (N2O) to the atmosphere (Oenema et al., Reference Oenema, Wrage, Velthof, Van Groenigen, Dolfing and Kuikman2005; Steinfeld et al., Reference Steinfeld, Gerber, Wassenaar, Castel, Rosales and de Haan2006). N2O is a natural trace gas in the earth's atmosphere, but the concentration has been rising steadily, from around 270 ppb before the start of the industrial era to the present-day 320 ppb (Intergovernmental Panel on Climate Change (IPCC), 2007). N2O is of environmental concern in two ways. First, it absorbs infrared radiation, and thus contributes to global warming. It is the third most important greenhouse gas (GHG), following carbon dioxide (CO2) and methane (CH4). The global warming potential of N2O is approximately 300 times higher than CO2. Second, it contributes to the loss of ozone in the stratosphere.
In agricultural systems, N2O is primarily a product of microbial processes in soils and manures. Steinfeld et al. (Reference Steinfeld, Gerber, Wassenaar, Castel, Rosales and de Haan2006) estimated that livestock production accounts for 65% of the global N2O emission. Over the next decades, the demand for animal products is expected to increase exponentially, driven by the growing human population in combination with increasing incomes (Godfray et al., Reference Godfray, Crute, Haddad, Muir, Nisbett, Lawrence, Pretty, Robinson, Toulmin and Whiteley2010). If agricultural practices do not change, the required increase in animal production will further increase N2O emissions. Therefore, mitigation measures are indispensable to decouple human population size and livestock-related N2O emissions (Van Beek et al., Reference Van Beek, Meerburg, Schils, Verhagen and Kuikman2010a).
Meat and milk products from herbivores are a major component in the human diet, now and in the future (Stehfest et al., Reference Stehfest, Bouwman, Van Vuuren, Den Elzen, Eickhout and Kabat2009). Herbivores account for a large share of manure-related N2O emissions, as their nitrogen (N) excretion is around 85% of the total N excreted by all agricultural animals (Bouwman et al., Reference Bouwman, Lee, Asman, Dentener, Van Der Hoek and Olivier1997). Furthermore, they account for a large share of soil-related N2O emissions, as grazing land covers approximately 70% of the global agricultural area. However, cropland is also used for forage and feed production for herbivores.
The need for mitigation is widely acknowledged, and over the past few decades an extensive list of mitigation options has been developed. Several reviews have been published, dealing with the issues from different angles, starting with Mosier (Reference Mosier, Kroeze, Nevison, Oenema, Seitzinger and van Cleemput1998), followed by Oenema et al. (Reference Oenema, Velthof and Kuikman2001) and Monteny et al. (Reference Monteny, Bannink and Chadwick2006), and more recently Eckard et al. (Reference Eckard, Grainger and De Klein2010), Gill et al. (Reference Gill, Smith and Wilkinson2010) and De Klein et al. (Reference De Klein, Eckard and Van der Weerden2010). Ultimately, mitigation measures have to be implemented by farmers themselves. This review therefore has the objective to identify and describe opportunities for on-farm N2O mitigation strategies. The options are presented along the main components of a herbivore production system, in which feed and forage are transformed into milk, meat and wool.
Microbial pathways for N2O production
N2O is produced during several microbial processes in the N cycle of terrestrial and aquatic systems. In livestock farming, N2O production takes place in soils and manures. A solid understanding of the underlying processes is essential for allocation of N2O emissions to sources, but even more for the development of mitigation strategies.
Soil
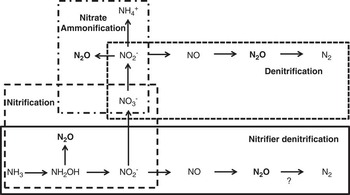
N enters the soil in organic and inorganic forms, through fertilizer, manure, biological fixation, crop residues and atmospheric deposition. The inorganic forms, such as ammonium (NH4) and nitrate (NO3), are directly available for several N2O-producing processes (Figure 1). However, organic N inputs are equally important, as they can be mineralized into NH4.
Microbial sources of nitrous oxide in soil (Baggs, Reference Baggs2008).

Nitrification and denitrification have long been considered as the main N2O-producing pathways. During the first step of nitrification, autotrophic bacteria oxidize ammonia (NH3; in equilibrium with NH4) into nitrite (NO2), with hydroxylamine (NH2OH) as an intermediate. N2O is formed through chemical decomposition of NH2OH or NO2. The rate of nitrification is affected by NH3 availability, which is closely linked to pH. The production of N2O during nitrification increases with lower oxygen (O2) availability (Bollmann and Conrad, Reference Bollmann and Conrad1998). Next to autotrophic nitrifiers, heterotrophic nitrifiers are also known. This group comprises fungi and bacteria that use organic carbon (C) as an energy source (Bateman and Baggs, Reference Bateman and Baggs2005).
Denitrification is predominantly carried out by heterotrophic bacteria. N2O is released as an intermediate product during the reduction of NO3 to N2. The denitrification rate increases with increasing supplies of C and N. Furthermore, soil water content is a determining factor for denitrification rate and the N2O/N2 ratio. Under dry conditions, and thus high O2 concentrations, denitrification activity is suppressed. If C and NO3 supplies are non-limiting, denitrification is maximal at a water-filled pore space (WFPS) in soil around 70%. However, under higher O2 concentrations, the N2O/N2 ratio increases.
Next to nitrification and denitrification, much attention has recently been given to nitrifier denitrification (Wrage et al., Reference Wrage, Velthof, van Beusichem and Oenema2001; Kool et al., Reference Kool, Wrage, Zechmeister-Boltenstern, Pfeffer, Brus, Oenema and Van Groenigen2010). In one entire process, NH3-oxidizing bacteria are responsible for nitrification to NO2, followed by denitrification. This contrasts with coupled nitrification–denitrification, in which different groups of bacteria carry out nitrification and denitrification. Kool et al. (Reference Kool, Dolfing, Wrage and Van Groenigen2011) showed that nitrifier denitrification can be a significant pathway under conditions unfavourable for heterotrophic denitrification, that is, a relatively low WFPS.
Other pathways for N2O production have also been identified, but their contribution is largely unknown. In co-denitrification, an N atom of NO2 is combined with an N atom from another source (Su et al., Reference Su, Takaya and Shoun2004). During NO3 ammonification, NO3 is reduced to NH4. N2O production occurs from the intermediate NO2. Chemodenitrification is the non-biological reduction of NO2 to N2O, through organic compounds (amines, phenolics) or inorganic ions (iron, copper).
Manure
Typically, 70% to 90% of the N ingested by herbivores is excreted, either during grazing or via application of manure collected outside grazing periods. The various pathways of N2O formation described above also apply to the manure environment, but the potential for N2O emissions will depend on manure management practice.
Manure collected during confinement may be handled in solid (farmyard manure, deep litter) or liquid form (slurry with typically 1% to 10%, DM). These materials represent a continuous scale with respect to the degree of oxic v. anoxic conditions, and hence with respect to N2O emission potential. In solid manures, the distribution of O2 will depend on whether the material is composting (Petersen et al., Reference Petersen, Lind and Sommer1998; Hao et al., Reference Hao, Chang, Larney and Travis2001). For liquid manures, the DM content determines whether a floating surface crust can be formed that may extend the surface area where populations of nitrifiers and denitrifiers are active under suboxic conditions (Nielsen et al., Reference Nielsen, Nielsen, Schramm and Revsbech2010). Ambient climatic conditions, rainfall, desiccation and temperature, modify the distribution of O2 at the sites of N turnover in solid and liquid manure (Sommer et al., Reference Sommer, Petersen and Soegaard2000; Hansen et al., Reference Hansen, Nielsen, Schramm, Nielsen, Revsbech and Hansen2009).
Emissions from herbivore production systems
For the past few decades, the amount of N2O in the atmosphere has been increasing at a rate of around 0.7 ppb per year. The assessment of the underlying drivers has been a constant challenge, since publication of the first Intergovernmental Panel on Climate Change (IPCC) assessment report in 1990. The IPCC follows a bottom-up method, based on soil surface gas flux measurements from numerous global sites. The emissions are considered to be proportional to soil N inputs from a range of sources, which is defined as the emission factor (EF). The default EF for direct N2O emissions from fertilizer, manure and crop residues is 1% of the added N. N excreted from grazing animals has a default EF of 2%. The EF for indirect emissions from NH3 volatilization and subsequent re-deposition is 1%, and for N leaching and runoff 0.75%. In contrast, Crutzen et al. (Reference Crutzen, Mosier, Smith and Winiwarter2008) followed a top-down approach. They estimated that 3% to 5% of all new reactive N supply to terrestrial systems is converted to N2O. The reactive N is all newly fixed N, introduced into the biosphere, from production of synthetic fertilizers, biological fixation, lightning and industrial and transportation sources. Recently, Davidson (Reference Davidson2009) estimated that 2.0% of fertilizer N and 2.5% of manure N was converted to atmospheric N2O, between 1860 and 2005.
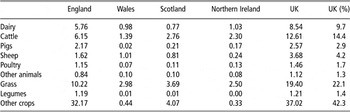
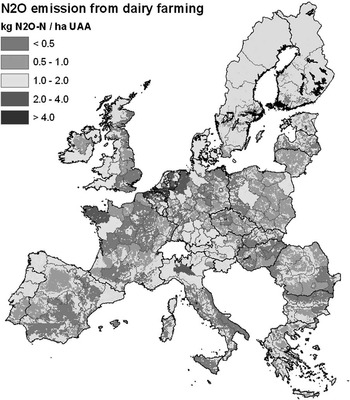
Individual countries report their GHG emissions according to the IPCC methodology, using either the default tier 1 EF or more refined tier 2 and tier 3 EFs that correspond to country-specific soil types or farm management. Agriculture is one of the six main reporting sectors, but the national inventories generally do not distinguish between the different agricultural sectors for calculation of N2O emissions. However, there are supplementary studies in which N2O emissions are assessed and assigned to the different crop and livestock sectors. Wang et al. (Reference Wang, Cardenas, Misselbrook and Gilhespy2011) developed a detailed inventory framework for the United Kingdom (Table 1). Emissions from manure management and animal wastes from the ruminant sector (dairy, cattle and sheep) were 29% of the total annual N2O emissions. Emissions from managed grasslands were 22% of the total emissions. It may be assumed that these grassland emissions can be attributed to the ruminant livestock sector as well. Furthermore, the emissions from cropland (42%) partly come from feed and forage crops that go directly into the ruminant livestock sector. However, this was not elaborated further. Lesschen et al. (Reference Lesschen, van den Berg, Westhoek, Witzke and Oenema2011) used the MITERRA model (Velthof et al., Reference Velthof, Oudendag, Witzke, Asman, Klimont and Oenema2009) to assess GHG emissions from the livestock sectors in the EU-27 countries. In this analysis, N2O emissions arising from feed and forage production were assigned to the respective livestock sectors. The N2O emission of the total livestock sector in the EU-27 amounted to 120 Mt CO2-equivalents, of which 75% was emitted from herbivore production systems. Within the herbivores, the dairy and beef sector were responsible for 90% of the N2O emissions. Figure 2 shows that the dairy sector emissions are relatively high in regions in the Netherlands, Germany, Belgium, France and Italy.
Contribution of animal and crop categories to N2O emission (Gg) in the United Kingdom, for the year 2000 (Wang et al., Reference Wang, Cardenas, Misselbrook and Gilhespy2011)

N2O = nitrous oxide.
Spatial distribution of annual nitrous oxide (N2O) emissions (kg N2O-N per ha utilizable agricultural area) from the dairy sector over Europe (Lesschen et al., Reference Lesschen, van den Berg, Westhoek, Witzke and Oenema2011).

Farm-level emissions
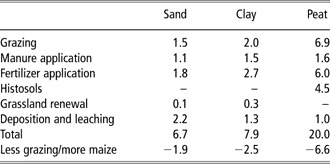
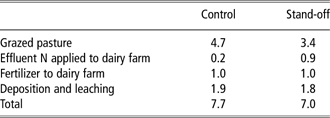
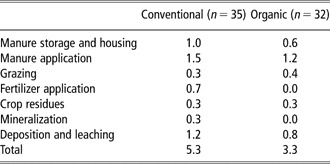
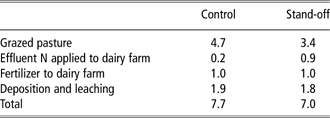
Farm-level accounting is a prerequisite to develop mitigation strategies for individual farming systems (Schils et al., Reference Schils, Verhagen, Aarts and Šebek2005). Brown et al. (Reference Brown, Jarvis and Headon2001) used the IPCC approach to provide farm-scale estimates of N2O emissions, of around 16 kg N2O-N/ha per year, from two dairy farms in England. In a similar approach, Schils et al. (Reference Schils, Verhagen, Aarts, Kuikman and Šebek2006a) calculated an annual emission of 7 to 20 kg N2O-N/ha for average dairy farms in the Netherlands (Table 2), depending on soil type. N2O emissions from a dairy farm in New Zealand were estimated by Luo et al. (Reference Luo, Ledgard and Lindsey2008a). Total annual emissions of 7.7 and 7.0 kg N2O-N/ha of grazed pasture were estimated in a control and a stand-off treatment, respectively (Table 3). The control pasture was managed under a typical rotational grazing regime, that is, cows grazed on a paddock for a day and were then moved to fresh paddocks to allow pasture to regrow. The stand-off system consisted of removing cows from pasture after grazing for 6 h/day and keeping them on a purpose-built, drained resting surface. In Denmark, Kristensen et al. (Reference Kristensen, Mogensen, Knudsen and Hermansen2011) calculated lower N2O emissions for organic model dairy farms (3.3 kg N2O-N/ha per year), compared with conventional dairy farms (5.3 kg N2O-N/ha per year). The organic farms had lower emissions from fertilizer and manure application, but slightly higher emissions from grazing (Table 4).
N2O emission (kg N2O-N/ha per year) of average Dutch dairy systems on the three main soil types (Schils et al., Reference Schils, Oudendag, Van der Hoek, De Boer, Evers and De Haan2006b), and the effect of reduced grazing and increased maize supplementation (Schils et al., Reference Schils, Olesen, del Prado and Soussana2007)

N2O = nitrous oxide; N = nitrogen.
Total annual N2O emissions for whole dairy farm systems in New Zealand (kg N2O-N/ha per year for grazed pasture) without or with a winter cow stand-off system (Luo et al., Reference Luo, Ledgard, De Klein, Lindsey and Kear2008b)
N2O = nitrous oxide; N = nitrogen.
N2O emission (kg N2O-N/ha per year) of conventional and organic dairy systems in Denmark (Kristensen et al., Reference Kristensen, Mogensen, Knudsen and Hermansen2011)

N2O = nitrous oxide; N = nitrogen.
De Klein et al. (Reference De Klein, Eckard and Van der Weerden2010) compared the relative contribution of different sources from different dairy, beef and sheep systems in New Zealand, the Netherlands, Ireland and Germany. The relative contribution varied from 0% to 54% for fertilizer, from 0% to 71% for urine and dung deposits during grazing, from 0% to 76% for manure application and from 13% to 42% for indirect emissions. The authors cautioned that part of the variation is due to the different country-specific EFs. Nevertheless, it demonstrates that the variation in emission sources requires for country-, farm- and animal-type-specific mitigation options.
Opportunities for mitigation
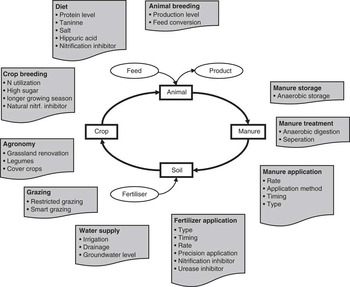
This paper focuses on farm-level mitigation options for herbivore production systems. The production and emission of N2O is closely linked to the efficiency of N transfer between the major components of a livestock system. Therefore, we present the mitigation options along the main N flows in a livestock system (Figure 3) systemically in the following sections.
Overview of farm-level mitigation strategies.

Diet
Mitigation technologies involving diet-based intervention are primarily aimed at reducing the amount of N excreted in urine. They include lowering the CP content of the diet itself, but also other strategies such as supplementation of condensed tannins (CT) or salts.
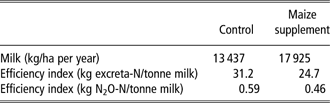
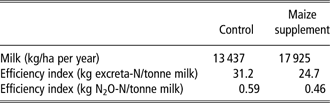
Using low-protein feed supplements, such as maize silage, as an alternative to grass can lower the amount of N excreted in urine and increase the overall efficiency of nutrient conversion into milk (Van Vuuren et al., Reference Van Vuuren, van der Koelen, Valk and de Visser1993). Luo et al. (Reference Luo, Ledgard, De Klein, Lindsey and Kear2008b) evaluated maize silage supplementation for increased milk production on dairy-grazed pasture with a stocking rate of 3.8 cows/ha against a stocking rate of 3.0 cows/ha without supplement. The annual N2O emissions from the whole farm systems, including direct and indirect emissions from the grazed pastures, maize-growing land, N fertilizer use and associated land application of farm effluent, were 8.3 and 8.0 kg N2O-N/ha with and without supplement, respectively. Although the difference in emissions per ha was only 0.3 kg N2O-N, their results show that, owing to the higher milk production per ha, N2O emission per kg of milk production from the maize supplement was 22% lower than that from the control system (Table 5). This could be attributed to the greater efficiency of N use from low-protein maize silage than from pasture, and suggests that feeding cows with low-protein maize silage could be a successful management practice to reduce N2O emissions from dairy farms. Model simulation of substituting fertilized pasture with fertilized maize silage indicates a 27% reduction in N2O emissions from a New Zealand dairy farm (De Klein and Ledgard, Reference De Klein and Ledgard2005). In intensive dairy systems with high supplementation of low-protein concentrates, the effect of additional maize is limited (Vellinga and Hoving, Reference Vellinga and Hoving2010). When high proportions of maize are fed, the amount of concentrates can be reduced, because of the higher digestibility of maize. In some cases, it may even be necessary to increase the N content of the concentrates to meet the animals’ protein requirements.
Average milk production and whole dairy system efficiencies for a grass-based system without and with maize silage supplementation (Luo et al., Reference Luo, Ledgard, De Klein, Lindsey and Kear2008b)
N = nitrogen; N2O = nitrous oxide.
In intensive, highly fertilized, grassland systems, farmers tend to let the cows graze in relatively young lush grass, with high protein contents. Grazing at a later stage is an option to reduce the N intake and excretion. However, grazing in older grass might reduce the digestibility, and thus increase CH4 emissions (Bannink et al., Reference Bannink, Smits, Kebreab, Mills, Ellis, Klop, France and Dijkstra2010).
CT bind with proteins in the rumen, which results in a greater partitioning of excreta N in dung rather than in urine (Misselbrook et al., Reference Misselbrook, Powell, Broderick and Grabber2005), and N2O emissions from dung-N are typically lower than from urine-N (e.g. van der Weerden et al., Reference Van der Weerden, Luo, De Klein, Hoogendoorn, Littlejohn and Rys2011). In animal experiments, addition of a CT extract to the diet of sheep (Carulla et al., Reference Carulla, Kreuzer, Machmüller and Hess2005) and dairy cattle (Grainger et al., Reference Grainger, Clarke, Auldist, Beauchemin, McGinn, Waghorn and Eckard2009) reduced urinary N excretion. In the experiments of Carulla et al. (Reference Carulla, Kreuzer, Machmüller and Hess2005), sheep were supplemented with 41 g Acacia mearnsii extract, containing 0.615 g/g CT per kg dietary DM. Tannin supplementation decreased ruminal NH3 concentration and urinary N excretion without affecting body N and energy retention.
Salt supplementation stimulates water intake and reduces urine-N concentration (Ledgard et al., Reference Ledgard, Menneer, Welten, Kear, Dexter, Lindsey, Betteridge, Crush and Pacheco2007). In an incubation experiment, Van Groenigen et al. (Reference Van Groenigen, Velthof, van der Bolt, Vos and Kuikman2005) found lower N2O emissions from urine with reduced N concentration.
Kool et al. (Reference Kool, Hoffland, Hummelink and van Groenigen2006) suggested that manipulating the diet of animals to increase the hippuric acid content of the urine could be a potential N2O abatement strategy. In a laboratory study, they showed that increasing the hippuric acid concentration in urine reduced N2O emission by up to 50%. Hippuric acid was found to inhibit denitrification in soil (van Groenigen et al., Reference Van Groenigen, Velthof, van der Bolt, Vos and Kuikman2005). A variation in hippuric acid in cattle urine between 0.2% and 10.7% was reported by Kreula et al. (Reference Kreula, Rauramaa and Ettala1978), because of rations with different protein contents and additives (benzoic acid and aromatic amino acids).
Ledgard et al. (Reference Ledgard, Menneer, Welten, Kear, Dexter, Lindsey, Betteridge, Crush and Pacheco2007) showed that animals could be directly supplemented with a nitrification inhibitor, with the inhibitor excreted in an unaltered form in the urine. The inhibitor was thus applied to soil directly in the urine patch and therefore likely to maximize the reduction potential of the inhibitor. Further research is being conducted in New Zealand to quantify the N2O abatement potential of this delivery mechanism.
Animal breeding and productivity
Animal breeding may reduce N2O emissions through the improved conversion of feed N into animal N. For dairy cattle, Jones et al. (Reference Jones, Warkup, Williams and Audsley2008) calculated that the past selection for production characteristics reduced N2O emission per unit milk by 30%, between 1988 and 2007. High animal productivity, and thus reduced animal maintenance requirements, has been one of the major strategies to improve the N-use efficiency in Dutch dairy herds (Groot et al., Reference Groot, Rossing and Lantinga2006). In addition to breeding, improved health and fertility will also contribute to the production efficiency and thus to lower N2O emission per unit product. This also applies to extensive pastoral systems, where improved health will reduce the number of sick and non-productive animals (Reid et al., Reference Reid, Thornton, McCrabb, Kruska, Atieno and Jones2004), and allow animals to fulfil their productive capacity. Similarly, in sheep systems in New Zealand, during the past 15 years there has been a gain in productivity with similar lamb production achieved from over 40% fewer breeding animals. This has resulted in reduced N2O and CH4 per unit lamb production of approximately 20% associated with increased lambing%, lamb growth rates and lamb finishing weights (Ledgard et al., Reference Ledgard, Lieffering, McDevitt, Boyes and Kemp2010).
Manure storage
Given the importance of O2 availability for the composition of nitrification and denitrification products, N2O mitigation strategies should aim at preventing N turnover under suboxic conditions.
An airtight cover on solid manure during storage has been shown to effectively prevent N2O emission (Chadwick, Reference Chadwick2005). For liquid manures, there is little potential for N2O formation, as long as crust formation is prevented.
Manure treatment
Anaerobic digestion may reduce N2O emissions during storage, as this reduces the level of available C for denitrification, and organic matter for crust formation. However, studies on N2O emission during storage of digested slurry have shown the opposite. Both Amon et al. (Reference Amon, Kryvoruchko, Amon and Zechmeister-Boltenstern2006) and Clemens et al. (Reference Clemens, Trimborn, Weiland and Amon2006) observed increased N2O emission from digested slurry, compared with untreated slurry. In contrast, reduced N2O emissions from the liquid fraction of separated slurry have been confirmed in measurements by Amon et al. (Reference Amon, Kryvoruchko, Amon and Zechmeister-Boltenstern2006). In a recent study, Mosquera et al. (Reference Mosquera Losada, Schils, Groenestein, Hoeksma, Velthof and Hummelink2010) compared N2O emissions from untreated cattle slurry with the liquid and solid fractions after separation. N2O emissions were negligible in the untreated and liquid fractions, but in the solid fraction 0.09% of N was lost as N2O during 2 months of storage.
It should be acknowledged, however, that NH3 volatilization is an important indirect source of N2O. Manure management for N2O mitigation may have positive or negative consequences for NH3 emissions (Petersen and Sommer, Reference Petersen and Sommer2011). NH3 reduction technologies such as covering will also enhance N2O mitigation, but on the other hand acidification technologies might increase N2O emission (Oenema and Velthof, Reference Oenema and Velthof1993). The same goes for CH4 emissions. Strategies that enhance anoxic conditions have the potential to increase CH4 emissions.
Fertilizer and manure application
Fertilizer and manure inputs are major emission sources in feed production for herbivores. Efficient use of fertilizer and manure is therefore an important tool to mitigate N2O losses.
The IPCC EFs imply a linear relationship between N input and N2O emissions. The principal advantage of this approach is that the activity data, at least for fertilizer use, are relatively easy to collect and use in national inventory systems. A drawback is that the fixed EFs only stimulate mitigation through reduced inputs and are not an incentive for farmers to improve the N-use efficiency. However, there is evidence that emissions increase exponentially with fertilizer or manure application rate. Experiments (Ryden, Reference Ryden1983), but also modelling studies (Eckard et al., Reference Eckard, Johnson and Chapman2006), have shown increased EFs with increasing application rates, but others have found contrasting results, that is, linear relationships (Velthof et al., Reference Velthof, Oenema, Postma and van Beusichem1996; Schils et al., Reference Schils, van Groenigen, Velthof and Kuikman2008).
Fertilizers containing NO3 are more susceptible to N2O losses than urea or NH4-based fertilizers. In a review, De Klein et al. (Reference De Klein, Sherlock, Cameron and van der Weerden2001) found that EFs for urea fertilizers ranged from 0.1% to 1.9%, and for calcium nitrate from 0.1% to 12%. Stehfest and Bouwman (Reference Stehfest and Bouwman2006) reviewed 1008 experiments on agricultural soils. They observed that the fertilizer types ammonium nitrate phosphate and calcium ammonium nitrate (CAN) showed significantly higher EFs, compared with most other fertilizer types.
The composition of animal manure affects N2O emissions as well. Higher emissions are associated with slurries with high contents of inorganic N and easily degradable N and C, such as liquid pig manures (Velthof et al., Reference Velthof, Kuikman and Oenema2003).
The use of slurry injection techniques generally increases N2O emissions (Flessa and Beese, Reference Flessa and Beese2000; Wulf et al., Reference Wulf, Maeting and Clemens2002). Velthof and Mosquera (Reference Velthof and Mosquera2011) compared application techniques on grassland and maize land. The average EF for grassland was 1.7% of the N applied for CAN, 0.4% for shallow injected cattle slurry and 0.1% for surface-applied cattle slurry. For maize land, the average EF for CAN was 0.1% of the N applied, for injected cattle slurry 0.9% and for surface-applied cattle slurry 0.4%.
Experiments with combined application of fertilizer and surface-applied cattle slurry to grassland (Clayton et al., Reference Clayton, McTaggart, Parker, Swan and Smith1997; Stevens and Laughlin, Reference Stevens and Laughlin2001 and Reference Stevens and Laughlin2002; Dittert et al., Reference Dittert, Lampe, Gasche, Butterbach-Bahl, Wachendorf, Papen, Sattelmacher and Taube2005) showed higher N2O emissions when fertilizer and cattle slurry were applied simultaneously than when they were applied separately or with a larger interval in between. The higher N2O losses were attributed to enhanced denitrification through the simultaneous availability of fertilizer-derived NO3 and cattle slurry-derived easy degradable C. A similar experiment with combined application of fertilizer and injected cattle slurry did not show increased emissions (Schils et al., Reference Schils, van Groenigen, Velthof and Kuikman2008).
Interest in the use of nitrification inhibitors has recently increased. In New Zealand, the nitrification inhibitor dicyandiamide (DCD) is being used on grazed pastures as a management alternative to reduce NO3-leaching and denitrification, and to provide greater N availability to the pasture plant. The value of inhibitors in mitigating N2O emissions also depends on their rate of degradation and persistence in soils, although their effectiveness has been demonstrated across a wide range of soils. Several studies (e.g. Di and Cameron, Reference Di and Cameron2006; Di et al., Reference Di, Cameron and Sherlock2007; Hoogendoorn et al., Reference Hoogendoorn, De Klein, Rutherford, Letica and Devantier2008) have shown that DCD can reduce N2O emissions from urine and urea applications between mid-autumn and early-spring in pastoral soils. The average reduction in N2O emissions in these studies varied between 30% and 80%. In all these studies, DCD was applied simultaneously or immediately after urea or urine application. However, DCD application could increase NH3 emissions and potential NH4-leaching losses. Some studies have found that the combined use of nitrification inhibitors and urease inhibitors can be effective in reducing NH3 and N2O emissions, and NO3 leaching from pastoral soils (e.g. Singh et al., Reference Singh, Bolan, Saggar and Zaman2008; Zaman et al., Reference Zaman, Nguyen, Blennerhassett and Quin2008).
Water supply
N2O production increases with increasing WFPS up to levels around 70% to 80% (Del Prado et al., Reference Del Prado, Merino, Estavillo, Pinto and Gonzalez-Murua2006). Therefore, soil water management through irrigation, drainage or manipulation of ground water level is a potential, but a delicate mitigation option, complicated by unpredictable rainfall. Phillips et al. (Reference Phillips, Leuning, Baigent, Kelly and Denmead2007) found that N2O emissions remained low if soils were irrigated to more than 95% WFPS. However, a few days later, when WFPS returned below 95%, the N2O production increased significantly. The low N2O emission at anaerobic soil conditions is most likely the result of complete denitrification to N2. Similar results were obtained by Van Beek et al. (Reference Van Beek, Pleijter, Jacobs, Velthof, van Groenigen and Kuikman2010b) on a peat soil with varying ground water levels, between 15 and 45 cm below the surface. The N2O emission increased from around 1 kg N2O-N per ha at 15 cm ground water level to around 8 kg N2O-N per ha at 45 cm ground water level.
Grazing
Reducing grazing time is an effective option to reduce N2O losses. For dairy systems in the Netherlands (Table 2), Schils et al. (Reference Schils, Olesen, del Prado and Soussana2007) calculated a reduced emission of 2 to 7 kg N2O-N per ha, depending on soil type. Reduced grazing time is usually accompanied with an increased proportion of maize silage in the diet. On sandy soils, where the proportion of maize is already relatively high and the grazing time relatively low, the achieved emission reductions are lower compared with the farms on clay and peat soil.
As New Zealand, Australia, southern South America and some western regions of Europe have relatively wet but mild winters, livestock grazing of pastures generally occurs all year round. Studies have suggested that denitrification and N2O emission rates from New Zealand's grazed pastures are likely to be highest during the wet winter period compared with those in other seasons (Luo et al., Reference Luo, Tillman and Ball2000; De Klein et al., Reference De Klein, Smith and Monaghan2006). The winter management of grazing can involve restricted grazing systems and stand-off pads to manage the animals, avoid soil damage and reduce the return of animal excreta to wet soil (Luo et al., Reference Luo, Ledgard and Lindsey2008a). It can therefore result in significant reductions in N2O emissions (Table 3). These management techniques must be used with care to avoid trade-offs such as reducing N2O emissions from paddocks, but increasing NH3 loss from animal houses.
Studies from Saggar et al. (Reference Saggar, Giltrap, Li and Tate2007a and Reference Saggar, Hedley, Giltrap and Lambie2007b) showed very significant differences in N2O emissions between sheep-grazed and dairy-grazed pastures, and emissions also differed with soil types. An EF obtained for sheep-grazed pastures is considerably lower than the EF obtained for dairy pastures on the same soil at an adjacent farm. The significantly higher dairy EF was explained by contrasting excretal amounts, rates and patterns of deposition between the two grazed systems. In sheep-grazed pastures, the more evenly distributed excretal N is deposited in smaller amounts and lower rates than in dairy-grazed pastures, enabling more of the input N to be utilized and less to be lost as N2O.
Very high N2O emission rates have been observed in grazed pastures when wet soils become compacted by animal treading (De Klein et al., Reference De Klein, Smith and Monaghan2006). Treading causes anaerobic conditions and animal excreta provides abundant N and C. Thus, high N2O emission rates can occur on wet soils soon after N fertilization or grazing.
Agronomy
Renovation of grasslands can increase soil N mineralization, and thus N2O production (Vellinga et al., Reference Vellinga, van den Pol-van Dasselaar and Kuikman2004). Velthof et al. (Reference Velthof, Hoving, Dolfing, Smit, Kuikman and Oenema2010) measured higher N2O emissions from renovation in autumn than in spring. They also observed that renovation without ploughing resulted in higher emissions than renovation with ploughing. The better soil aeration after ploughing was suggested as the reason for lower emissions, although this could increase N leaching and indirect N2O emissions. Removal of grazing animals in the months before grassland renovation was suggested by Davies et al. (Reference Davies, Smith and Vinten2001) to reduce the potential for N2O losses.
Dairy production systems in some parts of Europe are based on ley–arable rotations. In the ley phase of such rotations, N accumulation occurs in soils not disturbed by tillage operations. Consequently, a considerable N surplus occurs in grasslands, particularly under grazing regimes, where a large part of the N in ingested grass is recycled to soil via urine and faeces (Ledgard et al., Reference Ledgard, Schils, Eriksen and Luo2009). Grassland cultivation almost always results in a substantial residual effect and the mineralization of N often exceeds the requirement of the succeeding crop. Thus, there is a high risk of N losses following sward cultivation. Management practices to control N losses, including N2O emissions, comprise delayed ploughing until late winter or spring, the use of efficient catch crops after ploughing and a reduction in fertilizer N application to cereals after ploughing (Eriksen, Reference Eriksen2001; Eriksen et al., Reference Eriksen, Askegaard and Søegaard2008).
Reported N2O emission rates from soils under clover/grass pasture grazed by dairy cows in New Zealand and Australia range from 6 to 11 kg N2O-N/ha per year (Dalal et al., Reference Dalal, Wang, Robertson and Parton2003; Luo et al., Reference Luo, Ledgard, De Klein, Lindsey and Kear2008b). At comparable levels of production, it is likely that the N2O emissions resulting from N-cycling of animal excreta will be similar for both clover/grass and grass pasture (Ledgard et al., Reference Ledgard, Schils, Eriksen and Luo2009). However, because grass pasture requires inputs of N fertilizer, this type of pasture will have additional fertilizer-specific losses. In an Australian study (Eckard et al., Reference Eckard, Chen, White and Chapman2003), N losses from total denitrification were significantly less from unfertilized clover/ryegrass pasture, at 6 kg N/ha per year, than from the same pasture receiving 200 kg N/ha per year, as either ammonium nitrate or urea, at 15 and 13 kg N/ha per year, respectively.
Rochette and Janzen (Reference Rochette and Janzen2005) reported average N2O emissions from annual crop legumes of 1.0 kg N/ha, 1.8 kg N/ha for pure forage crops and 0.4 kg N/ha for legume/grass mixes and noted that these values were much lower than those predicted using 1996 IPCC methodology. As a consequence, these authors recommended that biological N2 fixation as a process be removed from the IPCC N2O inventory methodology and N2O emissions induced by the growth of legumes be estimated only as a function of crop residue decomposition. In the 2006 update of the IPCC guidelines (IPCC, 2006), no indirect N2O emissions have been attributed to biological N2 fixation. Nevertheless, the effects of fixed N are accounted for in grazed clover/grass pastures via N2O emissions from excreta, derived from consumed clover, and from increased grass growth, which is consumed and excreted, from mineralized clover N residues.
Crop breeding
Subbarao et al. (Reference Subbarao, Ito, Sahrawat, Berry, Nakahara, Ishikawa, Watanabe, Suenaga, Rondon and Rao2006) found that a tropical grass species, Brachiaria humidicola, produces chemicals that inhibit nitrification in soil. Fillery (Reference Fillery2007) commented that further examination is necessary to assess whether wild relatives of major food crops are able to produce biological nitrification inhibitors, with the ultimate aim being the introduction of this capacity into domesticated lines. Other breeding efforts, such as deeper rooting species or longer growing seasons, aiming to increase the N-use efficiency of grass and forage crops, may generally also help to mitigate N2O emissions. Alternatively, the use of other species with these beneficial properties could be considered to achieve similar results.
Bringing science into practice
The previous section shows that to date there is an impressive list of N2O mitigation strategies that can be applied on livestock farms. Many options have been tested in small-scale trials or even in experimental farm systems. However, implementation on commercial farms is lagging. Farmers are constantly challenged to adapt to changing environmental and societal needs, as well as changing market conditions. Climate change is one of many issues, and currently communication is more directed at awareness than at implementation. Most of the farmers are not aware of the GHG emissions on their farms and their attitude towards suggested mitigation measures is largely unknown. In a study with 70 dairy farms in the Netherlands (Vellinga et al., Reference Vellinga, de Haan, Schils, Evers and van den Pol-van Dasselaar2011), calculations of baseline GHG emissions were carried out, and farmers could indicate their preferences for mitigation options. Farmers tended to choose mitigation options that are relatively simple and either cost effective or with only relatively small additional costs.
Smith and Olesen (Reference Smith and Olesen2010) considered three categories of incentives and regulation to promote the adoption of GHG mitigation options. They distinguished support for unprofitable options, taxation on certain N inputs, and prescription for a selection of extremely polluting farm practices. Gill et al. (Reference Gill, Smith and Wilkinson2010) summed up three hurdles for the policy community in setting targets for the livestock sector. First, there is only poor evidence for the beneficial consequences of policy interventions and emissions from livestock. Second, changing food behaviour of consumers is difficult. Third, any significant changes in one part of the food supply chain in a global market can have marked consequences on global food prices and food security.
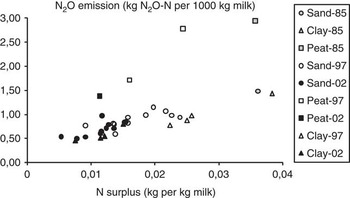
Within the European agricultural sector, several policies have been defined, which result in GHG emissions reduction. However, most of these policies are not specifically aimed at climate mitigation action, but relate to action for other environmental issues. Nevertheless, they often have positive side effects for N2O mitigation, for example, the Nitrates Directive. Reductions of N2O emissions in the agriculture sector so far were mostly due to reductions in the number of livestock. Schils et al. (Reference Schils, Verhagen, Aarts, Kuikman and Šebek2006a) analysed the changes in N management on Dutch dairy farms, between 1985 and 2002. Although not aimed at N2O emission reduction, the improved N management reduced the N2O emission per kg milk by 57%. A reduction of the N surplus per kg milk of 1 g N reduced the N2O-N emissions per 1000 kg milk by approximately 50 g (Figure 4). The reduction of the N surpluses was mainly brought about by reduced fertilizer use and reduced grazing time.
Effect of farm nitrogen (N) surplus on whole farm nitrous oxide emission for Dutch dairy farms between 1985 and 2002 (Schils et al., Reference Schils, Verhagen, Aarts, Kuikman and Šebek2006a), for different soil types (sand, clay and peat). Farms in 1985 were modelled average Dutch farms. Farms in 1997 and 2002 were commercial farms at the start and after 5 years of improved N management.

Conclusions
Recent advancements have helped to better understand the N2O-producing microbial processes in soils and manures, and thus the consequences for N2O emissions of livestock systems. Improved knowledge of the sources has served the development of a wide range of effective mitigation options in the animal, manure, soil and crop components of livestock systems. Most attractive are those options that increase the N-use efficiency of animals and crops; in other words, reducing N inputs while maintaining yields. Currently, management of fertilizer and animal diet seem to be the most widely applicable strategies. However, a ‘one size fits all’ policy is unwise, as farm structures and farmers’ attitudes are very diverse. All N2O mitigation options affect the N and C cycles of livestock systems. Therefore, care should be taken that strategies for N2O mitigation are not offset by unwanted increases in NH3, CH4 or CO2 emissions. In particular, enteric fermentation in ruminants is a significant source of CH4. Although there is a wide range of mitigation options available, implementation in practice is still lagging. Improving the awareness of farmers is the first necessary step towards actual implementation on commercial livestock farms. Providing simple tools to determine the benefits of mitigation strategies is therefore also important. Reductions in N2O emissions that have been achieved until now are mostly a positive side effect of other N-targeted policies.