





1. Introduction
Screening—choosing a costly action that reveals information about an unknown quality—is important and prevalent in many economic environments. When hiring or promoting employees, selling insurance, or buying a good of unknown quality, individuals and organizations take costly steps to learn more about the other party, like offering them multiple contracts at different prices. In many other situations, however, people do not screen and act with limited information.
The screening decision involves a trade-off: effective screening may be costly, but it reveals valuable information.Footnote 1 Assessing whether the informational gains outweigh the costs requires evaluating multiple contingencies, which recent literature shows people have difficulty doing (Niederle & Vespa, Reference Niederle and Vespa2023). Consider an employer deciding whether to assign a difficult or an easy trial task to a new hire. Difficult tasks, if failed, may come at a greater cost for the employer, but they allow the employer to gauge the new hire’s abilities. Similarly, this trade-off in screening is essential for policy choices. A stringent policy may force everyone to behave the same way, which impedes drawing inferences about them from their behavior. Failures of contingent thinking can, then, make it hard to strike the optimum balance between the forces behind this trade-off, leading to dominated policies.
In this paper, we hypothesize and test that failures of contingent reasoning lead people to screen too little: the screening costs are immediate and evident, while the benefits of information are only realized in subsequent and contingent decisions, which makes them harder to recognize. We test this hypothesis using an online experiment which mimics a hiring problem: participants see two computer candidates—one Good, one Bad—and must hire one. Before hiring, participants choose a trial task. The Screening task reveals which computer is Good at a small cost; the Pooling task does not. We parametrize the experiment so that screening is dominant for all but extremely risk-loving agents, verified by direct lottery elicitation.Footnote 2
We run the experiment online and find evidence that people screen insufficiently. In the first round, 68% of participants in the Baseline treatment mistakenly choose the Pooling task, compared to only 18% in the Benchmark treatment, which provides substantial decision aids and serves as a noise benchmark. Feedback and experience reduce mistakes, but only partially. Two mechanism treatments show that insufficient screening is driven by failures to anticipate inference and to plan the full strategy: each treatment accounts for about half of the non-noise first-round mistakes, and addressing either mechanism is sufficient for participants to learn to screen nearly optimally.Footnote 3
We provide three main contributions. First, we add to the evidence on failures of contingent thinking (Esponda & Vespa, Reference Esponda and Vespa2014, Reference Esponda and Vespa2024; Martínez-Marquina et al., Reference Martínez-Marquina, Niederle and Vespa2019; Niederle & Vespa, Reference Niederle and Vespa2023) by showing that they extend from exogenous hypothetical events to contingencies arising from an individual’s own choices. This extension is not trivial, since one might expect self-generated contingencies to be especially difficult to ignore. Our paper thus contributes to the literature showing that individuals make mistakes when they must reason across multiple hypothetical scenarios.
While existing theory does not imply that such failures should be limited to exogenous hypothetical events, direct evidence on contingencies generated by one’s own choices remains scarce. One exception is Chakraborty and Kendall (Reference Chakraborty and Kendall2026), who show that agents fail to perform backward induction when they must respond to their own future decisions. In our setting, however, participants do not mispredict their future actions; instead, they fail to anticipate how their current actions affect the information available to their future selves. Second, we show that having realized events rather than hypothetical events does not eliminate the problem: the Good and Bad computers in our experiment are realized, resembling the deterministic treatments that help resolve failures of contingent thinking in Martínez-Marquina et al. (Reference Martínez-Marquina, Niederle and Vespa2019), yet participants make substantial mistakes.Footnote 4 Third, we identify two specific mechanisms—Failure to Anticipate Inference and Failure to Plan—that drive underscreening in the context of a hiring decision. This complements, for example, Araujo et al. (Reference Araujo, Wang and Wilson2021), who show that subjects fail to account for how market dynamics endogenously reveal quality (a form of exogenous screening). Our results complement theirs by showing that a similar failure to appreciate the informational value of screening can extend to other settings, like hiring scenarios, where information generation is tied to the agent’s own choice. This connection sets the stage for studies that can test for these mechanisms in applied environments, contributing to a limited literature on cognitive biases in screening (e.g., Bhargava et al., Reference Bhargava, Loewenstein and Sydnor2017 study health insurance choices, and Rees-Jones et al., Reference Rees-Jones, Shorrer and Tergiman2024 study college admissions problems).
Our paper also connects to the experimental literature on learning and bandit problems, which studies the exploration-exploitation trade-off (Bergemann & Välimäki, Reference Bergemann and Välimäki2018; Slivkins, Reference Slivkins2019). Empirically, there is no consensus on whether people under-explore or over-explore. Some papers find evidence of under-exploration (Anderson, Reference Anderson2012; Banovetz, Reference Banovetz2020; Hudja & Woods, Reference Hudja and Woods2024), while others do not (Hoelzemann & Klein, Reference Hoelzemann and Klein2021; Kwon, Reference Kwon2020). We contribute by providing further evidence of under-exploration in a setting where information acquisition is framed as a hiring decision, and by identifying mechanisms that contribute to it.
We also relate to the behavioral literature on failures of strategic reasoning (Calford & Cason, Reference Calford and Cason2024; Dal Bó et al., Reference Dal Bó, Dal Bó and Eyster2018; Esponda & Pouzo, Reference Esponda and Pouzo2017; Eyster, Reference Eyster2019; Eyster & Rabin, Reference Eyster and Rabin2005; Milgrom & Roberts, Reference Milgrom and Roberts1986). We contribute by showing that people fail to consider inference and plan their strategy even in a non-strategic setup. In particular, experimental research has shown that people fail to use backward induction in strategic games (Binmore et al., Reference Binmore, McCarthy, Ponti, Samuelson and Shaked2002; Dufwenberg & Van Essen, Reference Dufwenberg and Van Essen2018; Johnson et al., Reference Johnson, Camerer, Sen and Rymon2002; Levitt et al., Reference Levitt, List and Sadoff2011). One of the mechanisms we identify in our experiment—Failure to Plan—is a non-strategic analog of failure of backward induction, demonstrating that the difficulty of backward induction extends beyond strategic settings.
The rest of the paper is structured as follows. Section 2 describes the main experimental design and how we test for the mechanisms driving behavior. Section 3 summarizes the main results and the evidence for the mechanisms. Section 4 shows the robustness of the results. Section 5 discusses some implications of the results and concludes.
2. Experimental design
We design an experiment to test whether people screen enough. Our online experiment mimics a hiring decision with an initial trial task stage, in which participants choose between two options, only one of which reveals valuable information at an implicit cost. We use a between-subject design with four treatments: Baseline, Benchmark, Automatic Inference, and Plan. The first two treatments identify the prevalence of screening mistakes (section 2.4); the latter two test for the mechanisms driving them (section 2.5). In the following subsections, we first describe the common experimental setup and then detail each treatment.
2.1. Setting
The experiment needs to have two crucial features to test our hypothesis. First, information must be instrumental—that is, it must have decision-relevant value, enabling participants to make better choices. Second, there must be a screening decision: the participants need to choose a policy where one option provides valuable information—at some cost—while the other does not. This creates the key trade-off in our hypothesis. Do participants mistakenly choose not to screen?
Our experimental design incorporates the two features that we describe above. We frame the experiment as a hiring problem because it is a naturalistic setting where inference is essential. The participant faces two computers and needs to decide which one to hire. One of the computers is of Good quality, and the other is of Bad quality. Hiring the Good quality computer is dominant, but the participant does not know each computer’s quality. However, the participant can learn the quality by observing the computer’s performance in a trial task. The participant makes a policy choice: they choose whether the trial task is Pooling or Screening. If the task is Screening, the participant can infer the computers’ quality at an implicit cost. The inference happens by observing the payoff that the computer produces when solving the task. If the task is Pooling, they cannot infer anything.
We use computer players rather than human participants as the experiment’s candidates because this rules out confounders and improves identification. First, if candidates were human participants, working on a task would provide experience with that task. This scope for experience could incentivize participants to choose one trial task over the other, which would confound our results. Second, social preferences could affect the participants’ choice of trial task and hiring decision, and the direction of this confounder is ambiguous. Third, we need to ensure consistent performance of candidates across tasks, which is what defines the Good and the Bad candidates. Human candidates’ performance is likely to be inconsistent, which would cause the trial task to reveal little information. We avoid all these concerns by replacing human candidates with computers. There are no training, social preferences, or inconsistency concerns with computer candidates.
We now detail the experiment setup that is common to all treatments.
2.2. Experiment setup
Each round of the hiring problem consists of two parts: part 1 is the trial task, which is the main decision of interest, and part 2 is the hiring decision. Figure 1 illustrates the structure of each round. The first part, the trial task, allows the participant to infer which candidate is better. The second part, the hiring decision, makes this information valuable. Specifically, two computers, Good and Bad, generate a payoff for the participant by solving tasks. There are two types of tasks: Pooling and Screening. In the Pooling task, both computers generate the same high payoff,  $P_H$. In the Screening task, the Good computer generates a high payoff,
 $P_H$, while the Bad computer generates a low payoff,
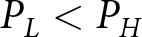 $P_L \lt P_H$. Thus, the participants can infer the quality of each computer if they observe the payoffs they generate in the Screening task.Footnote 5 Choosing the Screening task provides information, but it comes at a cost. Thus, the participant faces a trade-off between receiving a lower payoff from the trial task (
 $P_H+P_L \lt 2\times P_H$) and learning the computers’ quality. This trade-off is the crucial element of our design.
Diagram of experiment for screening-dominant rounds

After choosing the Pooling or the Screening task in part 1, the participant enters the part 2 hiring decision, in which knowing the computers’ quality is valuable because the computers are always hired to solve the Screening task. The stakes in the part 2 Screening task are much higher than in the trial task, which justifies forgoing a part of the payoff in the trial task to learn which computer is Good.Footnote 6 More precisely, when screening is dominant, in part 2 the good computer produces  $P_G$, and the bad computer produces
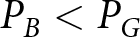 $P_B \lt P_G$ with
 $P_G \gt 2\times P_H - (P_H+P_L)$ (i.e., the payoff gain from identifying and hiring the Good computer in part 2 is large enough to outweigh the payoff sacrificed by choosing the Screening task rather than the Pooling task in part 1). Hence, if the participant chooses the Screening task in part 1 and hires the Good computer in part 2, they get
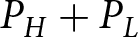 $P_H+P_L$ in part 1, and
 $P_G$ in part 2, for a total payoff of
 $P_H+P_L+P_G$ with certainty. If the participant instead chooses the Pooling task in part 1, they receive
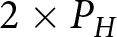 $2 \times P_H$ in part 1 and face an equally likely lottery over
 $P_G$ and
 $P_B$ in part 2, for total payoffs of
 $2P_H+P_G$ or
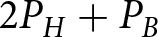 $2P_H+P_B$, each with probability
 $1/2$. We choose parameters such that the certain payoff from Screening exceeds the expected payoff from Pooling—that is,
 $P_H+P_L+P_G \gt 2P_H + (P_G+P_B)/2$, which reduces to
 $P_G - P_B \gt 2(P_H-P_L)$—which ensures that Screening is dominant for any risk-neutral or risk-averse participant, and even for moderately risk-loving ones.Footnote 7
Participants face ten rounds with varying payoff parameters. Table 1 summarizes the parameter values in the ten parameterizations. The parameterization in the first and last rounds are the same for all participants, but parameterizations appear in random order in rounds 2–9. Parameterizations 1–6, which include the first and last rounds, follow the description above, where it is dominant to choose the Screening task.Footnote 8 Parameterizations 7–10 make it dominant to choose the Pooling task. While our primary interest is the Screening-dominant rounds, we include Pooling-dominant rounds to prevent participants from mechanically choosing the Screening task without regard for the payoffs. If the risk elicitation (detailed in section 2.3) is not randomly picked to determine the participant’s bonus, one randomly picked parameterization counts toward the participant’s payoffs (see section 2.6 for more details about participants’ payoffs). We label the Pooling and the Screening tasks with color names (e.g., Brown and Blue tasks), and vary them every round.Footnote 9
Summary of payoff parameters for the ten parameterizations. All values are in USD terms. The parameterization in the first and last rounds are the same for all participants, and randomly drawn from parameterizations 1–6. In rounds 2–9, parameterizations are randomly drawn from all remaining ones

Table 1 Long description
The table lists payoffs in US dollars for ten parameterizations, one per row. The Part 1 columns give the payoff from the Pooling task, which is the same for both computers, followed by the Good computer’s payoff and the Bad computer’s payoff in the Screening task. The Part 2 columns give the Good computer’s payoff and the Bad computer’s payoff, and a final column gives the optimal Part 1 choice. Screening is optimal in rows 1 to 6. Row 1 has a Pooling payoff of 0.05, Screening payoffs of 0.05 for Good and 0.00 for Bad, and Part 2 payoffs of 4.30 for Good and 0.05 for Bad. Row 2 has 0.05; 0.05 and 0.00; and 4.45 and 0.10. Row 3 has 0.20; 0.20 and 0.15; and 4.30 and 0.10. Row 4 has 0.05; 0.05 and 0.00; and 4.45 and 0.10. Row 5 has 0.05; 0.05 and 0.00; and 4.35 and 0.10. Row 6 has 0.05; 0.05 and 0.00; and 4.50 and 0.10. Pooling is optimal in rows 7 to 10. Row 7 has 2.20; 2.20 and 0.15; and 0.20 and 0.20. Row 8 has 2.10; 2.10 and 0.00; and 0.05 and 0.05. Row 9 has 2.00; 2.00 and 0.00; and 0.05 and 0.05. Row 10 has 2.15; 2.15 and 0.00; and 0.05 and 0.05. In every row, the Good computer earns the same in the Screening task as both computers earn in the Pooling task.
At the beginning of the experiment, we thoroughly explain its structure to the participants so they have all the information to make dominant choices. We carefully explain what decisions the participants will face, what payoffs they can receive, and what information they will have. Importantly, the participants know that they will observe the performance of each computer before the part 2 hiring stage. We employ rigorous comprehension checks to verify that the participants understand the setup. Figure 2 shows the main description of the two parts in the Baseline treatment. All experimental instructions are in Online Appendix section A.B.
Baseline treatment main instructions

Fig. 2 Long description
A screenshot of the experiment’s instruction page, headed “Decision Green/Yellow: Computers solve Green or Yellow Tasks.” The introduction says there are ten decisions with similar instructions, and that the underlined numbers on the page change between decisions. There are two computers and two tasks, a Green task and a Yellow task, and one computer is of Good quality while the other is of Bad quality. A box headed “Part 1” says that the participant decides which task the computers solve and that each computer’s earnings depend on its quality. The Good-quality computer produces \$0.05 in the Green task and \$0.05 in the Yellow task, and the Bad-quality computer produces \$0.05 in the Green task and \$0.00 in the Yellow task. The Part 1 bonus is the money the computers produce. A line between the boxes says that before Part 2 the participant will see how much money the computers produce, and that this is the only extra information they will see. A box headed “Part 2” says that the same computers solve the Yellow task, with the Good-quality computer producing \$4.30 and the Bad-quality computer producing \$0.05. For the Part 2 bonus, the participant chooses which computer determines the bonus and receives what that computer produces. A “Next” button appears at the bottom right. In this example, the Green task is the Pooling task and the Yellow task is the Screening task.
2.3. What is a mistake?
Parameterizations 1–6: Participants’ risk preferences determine whether Pooling is a mistake or not. The two part 1 trial tasks induce two different lotteries, and we show that participants’ risk preferences are such that choosing the Pooling task in the Screening-dominant rounds is indeed a mistake.Footnote 10
To illustrate the payoff consequences of a Screening-dominant round, consider the first round parameterization (row 1 of Table 1), which is the same for everyone: If the participant chooses the Screening task in part 1 and hires the Good computer in part 2, she gets \$4.35 with certainty (\$0.05 + \$0.00 in part 1 and \$4.3 in part 2). If the participant instead chooses the Pooling task in part 1, then in part 2 she faces a lottery with equally likely payoffs of \$4.40 (\$0.05 + \$0.05 in part 1 and \$4.3 in part 2) and \$0.15 (\$0.05 + \$0.05 in part 1 and \$0.05 in part 2).Footnote 11 Hence, the Screening task is dominant unless the participant is sufficiently risk-loving.Footnote 12
We diagnose the strength of our assumption that the Screening task is dominant by directly eliciting participants’ risk preferences. Assuming that a direct choice over lotteries better captures participants’ risk preferences, this exercise supports our claim that choosing the Pooling task is indeed a mistake.Footnote 13 We elicit participants’ preferences over the lotteries induced in each parameterization by, after the main experiment, having them face six binary menus of lotteries. Each menu has two lotteries induced by one of the six Screening-dominant parameterizations: one lottery is a fixed payoff resulting from choosing the Screening task in part 1 and hiring the Good computer in part 2, and the other is a lottery resulting from choosing the Pooling task in part 1 and hiring a computer randomly in part 2. Figure A.1 in the Online Appendix summarizes the results. Across all six parameterizations, less than 4% of participants choose the lottery induced by the Pooling task.
Parameterizations 7–10: The Pooling task produces a certain payoff that is strictly larger than the certain payoff produced by the Screening task, unambiguously constituting a mistake.
2.4. Baseline and benchmark treatments
We use two treatments to show that participants make screening mistakes: the Benchmark treatment, which estimates the amount of noise in the participants’ answers, and the Baseline treatment, which identifies insufficient screening beyond that which comes from our noise benchmark.Footnote 14 Table 2 summarizes all treatments.
Summary of treatments. All treatments share the same experiment structure (Section 2.2). Between-participants design; each participant is randomly assigned to exactly one treatment

Table 2 Long description
The table has three columns: Treatment, Key difference from Baseline, and Purpose. The Baseline treatment has no key difference, and its purpose is to measure the total mistake rate. The Benchmark treatment differs by eliciting choices backward and displaying payoff information, and it serves as the noise benchmark. The Automatic Inference treatment differs by revealing computer quality if Screening is chosen, and it tests Failure to Anticipate Inference. The Plan treatment differs by having participants choose their full strategy at once, and it tests Failure to Plan.
Baseline treatment: We design this treatment to mimic the natural order of choices in a naturalistic hiring scenario: The participants first choose the trial task, then move on to the hiring stage, where they observe the payoff each computer generates and choose which one to hire. As in any experiment, we expect some participants to make the mistake of choosing the Pooling task for irrelevant reasons, such as lack of attention and trembling hand errors, which we interpret as experimental noise that artificially increases the rate of mistakes. Thus, the mistake rate we observe in the Baseline treatment combines the screening mistakes caused by stable cognitive errors—which we are interested in—with mistakes stemming from noise. We separate the two to measure the true prevalence of screening mistakes using the Benchmark treatment.
Benchmark treatment: We design this treatment to measure the share of mistakes that come from experimental noise. This control treatment is meant to help participants as much as possible while keeping the structure of the experiment the same. We use the share of participants who still make dominated choices in such a scenario as a measure of noise. In this treatment, participants submit their whole strategy, which requires solving the problem backward. They start with the part 2 hiring decision and choose which computer to hire in each contingency, when the part 1 trial task is the Screening task (i.e., when they know the computers’ quality) and when the part 1 trial task is the Pooling task (i.e., when they do not know the computers’ quality).Footnote 15 Next, they complete the part 1 trial task. At this point, we remind them about their contingent decisions for the hiring stage. The participants also see the payoff consequences of their choices next to the two task options, which provides no new information but helps them conveniently assess the two options. Because the Benchmark is such a strong intervention, we attribute any mistakes in this treatment to inherent noisiness and use it to establish the benchmark amount of noise in the experiment.Footnote 16
2.5. Mechanisms: automatic inference and plan treatments
By our experimental design, the mistake of choosing the Pooling task cannot be attributed to standard explanations of time inconsistency over payoffs, risk aversion or mistakes in strategic reasoning. To solve the problem correctly, participants must recognize and use the informational content in the computers’ performance on the part 1 Screening task. We separately test for both—whether they fail to anticipatedly recognize the inference they will be able to make (henceforth, “Failure to Anticipate Inference”), and whether they fail to use it in planning their strategy (henceforth, “Failure to Plan”). To test Failure to Anticipate Inference, we design the Automatic Inference treatment, in which we tell the participants that we will make the inference for them. To test Failure to Plan, we design the Plan treatment, in which we make participants choose their full strategy from the beginning. These interventions substantially reduce the mistakes in Screening-dominant rounds, which supports Failure to Anticipate Inference and Failure to Plan as relevant mechanisms driving underscreening.
The Failure to Anticipate Inference suggests that participants do not know that they will be able to make inferences in the future: they do not realize that the Screening task provides information that reveals each computer’s quality. Despite this, they may be thinking about part 2 and planning their strategy for the future. The Automatic Inference treatment, a light-touch intervention to the Baseline treatment, tests for this mechanism.
Automatic Inference treatment: This treatment is different from the Baseline treatment in one crucial way: instead of participants making the inference themselves, we make the inference automatically for them. If the participant chooses the Screening task, we explicitly tell them the quality of each computer before their hiring decision. If the participant chooses the Pooling task, we do not reveal the computer quality. Participants know this when choosing between the Screening and Pooling tasks in part 1. Specifically, next to the Screening task option in the experiment interface, we explain that we will reveal the computers’ quality; next to the Pooling task option, we explain that we will not. If the hypothesized Failure to Anticipate Inference mechanism is correct, this additional message at the first stage should significantly reduce the mistake rate.
By our second hypothesized mechanism, Failure to Plan, participants do not plan their entire strategy when choosing the trial task; instead, they myopically focus on the immediate choice in front of them. We design the Plan treatment to test for Failure to Plan.
Plan treatment: This treatment changes how we elicit participants’ strategy relative to the Baseline treatment. We ask participants to choose a complete plan for their strategy from the beginning. Specifically, they choose between three options: (i) choosing the Screening task and hiring the computer that produces the larger amount, (ii) choosing the Screening task and hiring the computer that produces the smaller amount, and (iii) choosing the Pooling task and hiring one of the computers chosen randomly. By simultaneously choosing for parts 1 and 2, this elicitation forces participants to consider the whole problem. If the Failure to Plan mechanism is causing mistakes, this planning tool should reduce the rate of mistakes relative to the Baseline treatment.
2.6. Procedures: online experiments on prolific
We recruited all participants on Prolific, an online platform frequently used for research studies, on October 10, 2023, and April 25, 2024. We restrict the sample to participants in the USA who are fluent in English and have completed at least 100 previous submissions on Prolific, with a minimum approval rate of 97%. The experiment was implemented using the oTree platform (Chen et al., Reference Chen, Schonger and Wickens2016). The study was registered on the AEA RCT registry with ID AEARCTR-0012230 under the title “The Inference Cost of Interventions.”
We recruited 982 participants who were randomly assigned to the four treatments: 251 subjects were assigned to the Baseline treatment, 236 to Benchmark, 244 to Automatic Inference, and 251 to Plan.Footnote 17 In all treatments, for each participant, one of the decisions (including the lottery choice decision in the risk elicitation) is randomly selected and the outcome of that decision is used to determine the participant’s bonus. Participants receive a \$3 completion payment and an average bonus payment of \$3.79, and the median completion time is 21 minutes, which is equivalent to \$19.39 per hour.
We follow the standard procedures to ensure that the results are not driven by misunderstanding of the experiment instructions. Participants receive detailed instructions and must correctly answer a set of understanding questions about them before proceeding, as well as passing attention checks. Figure A.2 in the Online Appendix shows the distribution of mistakes on the understanding questions.Footnote 18 Restricting the sample to participants who make zero mistakes does not affect the results.Footnote 19 Importantly, we present participants with parts 1 and 2 on the same page, so that it is unlikely that the failure to consider part 2 in their part 1 decision is an artifact of the experiment (see Online Appendix section A.B for screenshots of the experimental instructions).
3. Results: prevalence of mistakes
The Baseline and Benchmark treatments show that people fail to account for the inference consequences of their policy choices. Most participants—68%—mistakenly choose the Pooling task, and the mistakes do not disappear entirely with experience. The Automatic Inference and Plan treatments substantially reduce the mistake rate, suggesting that the Failure to Anticipate Inference and Failure to Plan mechanisms are important drivers of insufficient screening. Participants do not recognize they can extract valuable information in the future, and do not plan the entire strategy.Footnote 20
3.1. Baseline and benchmark treatments
Choosing the Pooling task is a mistake in six of the ten parameterizations. Since our hypotheses concern the Screening-dominant rounds, where failures of contingent thinking can lead to underscreening, we focus on these six parameterizations in the rest of the analysis.Footnote 21 We expect participants to learn over time from feedback and experience. Therefore, we present the main results separately by round.
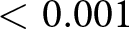
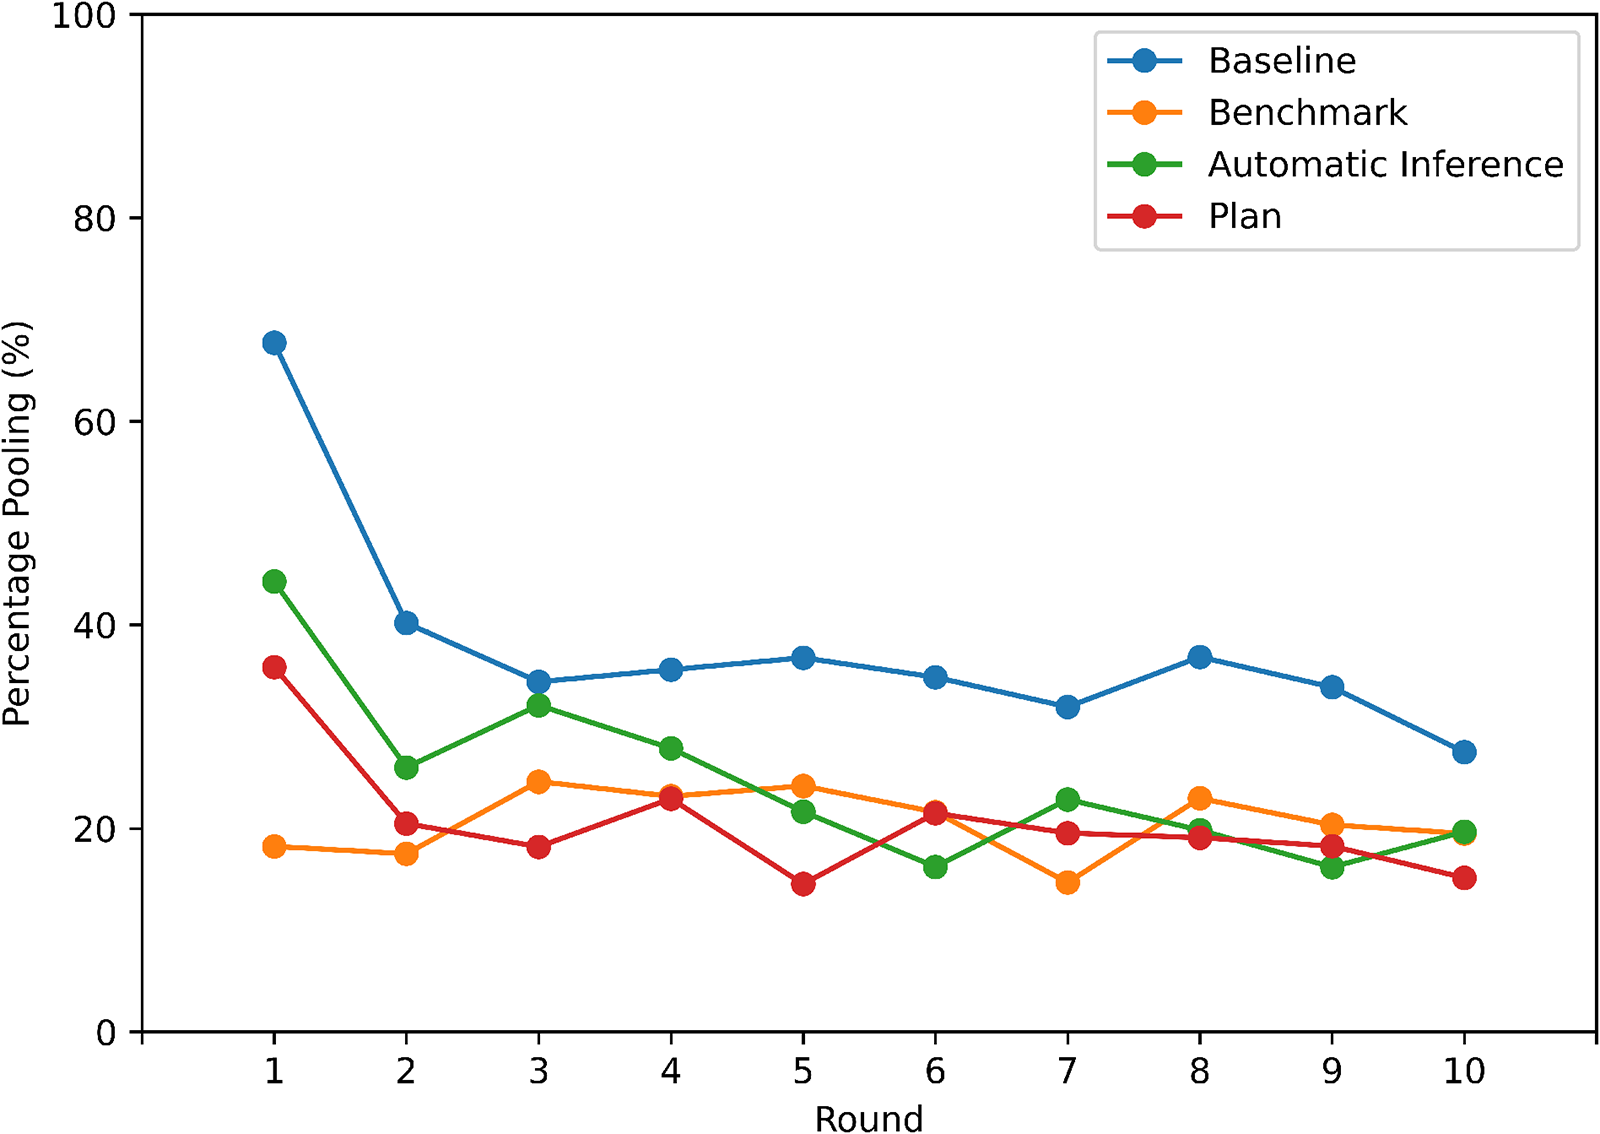
Figure 3 shows the main results. In the first round, most participants screen insufficiently: 68% of participants choose the Pooling task in the Baseline treatment. In the Benchmark treatment, only 18% choose the Pooling task. The difference is statistically significant (t-test yields a p-value 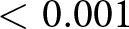 $ \lt 0.001$). Overall, in the six Screening-dominant rounds, participants make an average of 2.37 and 1.22 mistakes in the Baseline and the Benchmark treatments, respectively (p-value
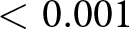 $ \lt 0.001$).
Rate of mistakes across rounds with Screening-dominant parameterizations for all treatments

Learning: There is substantial learning from experience, but mistakes disappear only partially. In rounds 2–10, the rate of mistakes reduces to an average of 34% in Baseline. It is still significantly higher than the rate of mistakes in the Benchmark treatment, which is, on average, 21% (t-test yields a p-value 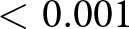 $ \lt 0.001$).Footnote 22 Most of the learning happens after round 1, with no learning in the Benchmark treatment and little learning across rounds 2–10 in the Baseline treatment. The difference in the mistake rate between the Baseline and the Benchmark treatments is statistically significant in nine out of ten rounds. Online Appendix Table A.2 further shows that mistakes are robust to learning by showing that the presence of interspersed Pooling-dominant rounds does not disrupt the learning process; Facing Screening-dominant rounds in a row does not substantially change the learning pattern, with the rate of mistakes in Baseline remaining steady at around 40%. Moreover, Online Appendix Table A.3 confirms most learning happens between the first and second rounds, with minimal learning as participants face their third, fourth, fifth, or sixth Screening-dominant round.Footnote 23
3.2. Mechanism: automatic inference and plan treatments
The mistake rate in the Automatic Inference treatment is significantly lower than in the Baseline treatment. Figure 3 compares the mistake rates in all treatments. In the first round, only 44% of the participants make the mistake of choosing the Pooling task. This mistake rate is about halfway between the Baseline (68%) and the Benchmark (18%) treatments. In subsequent rounds, we observe complete learning to the same level as in the Benchmark treatment. The difference in the mistake rate from the Baseline is statistically significant in round 1 and in rounds 2–10 combined (t-tests yield p-values  $ \lt 0.001$). Considering each round separately, the mistake rate is significantly different from the Baseline treatment in seven out of ten rounds. Thus, the Automatic Inference treatment suggests that the hypothesized Failure to Anticipate Inference mechanism is important: Participants seem not to understand how to infer information in the future.
Similarly, the mistake rate in the Plan treatment is significantly lower than in the Baseline treatment (t-tests yield p-values 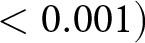 $ \lt 0.001)$. In the first round, 36% of the participants choose the Pooling task.Footnote 24 In subsequent rounds, participants learn completely—the mistake rate in rounds 2–10 is similar to the Benchmark treatment.Footnote 25
The difference in the mistake rate from the Baseline is significant in all rounds. Thus, the Plan treatment suggests that the hypothesized Failure to Plan mechanism is important too: Participants do not seem to plan their entire strategy.Footnote 26 This result is in line with evidence by Chakraborty and Kendall (Reference Chakraborty and Kendall2026) supporting the idea that participants fail to think through their own actions in the future, also in the context of an individual decision problem.
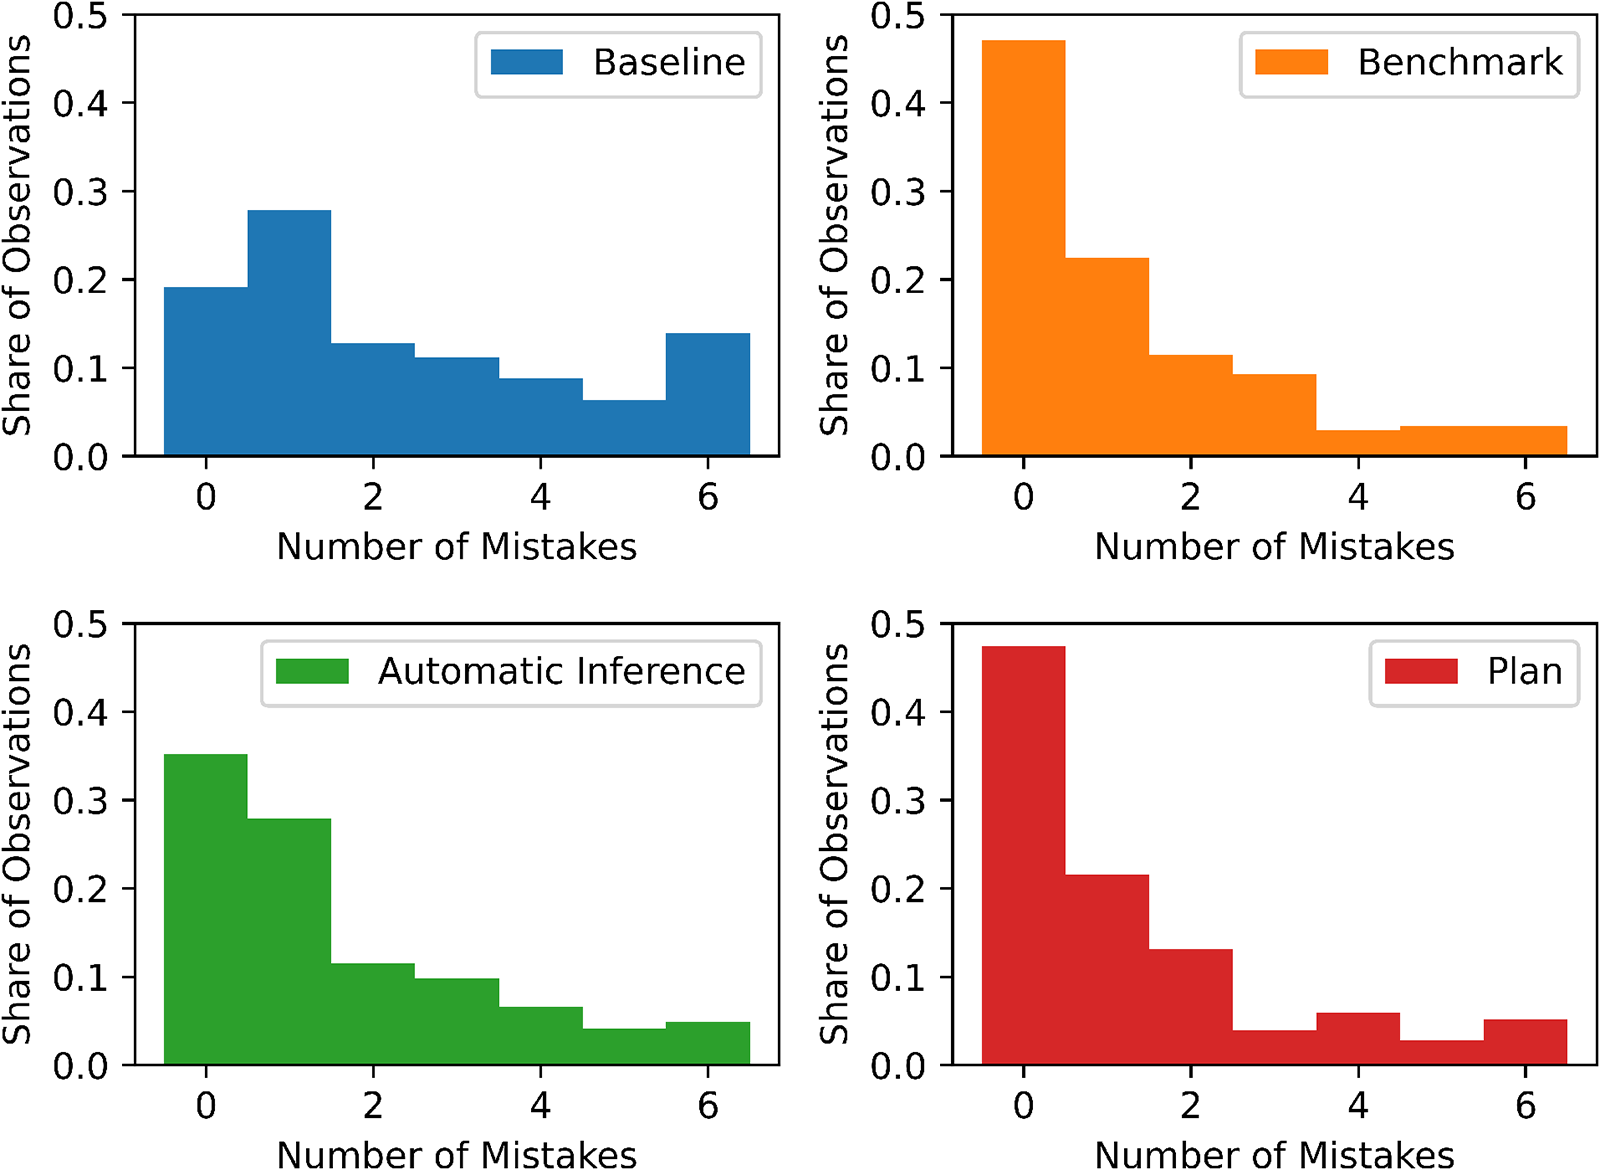
All six Screening-dominant parameterizations considered, participants make an average of 1.57 and 1.29 mistakes in the Automatic Inference and Plan treatments, respectively, compared to 2.37 and 1.22 in the Baseline and the Benchmark treatments.Footnote 27 The difference in the average number of mistakes between treatments hides heterogeneity in the distribution of mistakes. For each participant, we calculate the number of mistakes they make in the Screening-dominant rounds (i.e., choosing the Pooling task). Aggregating over all participants within a given treatment, we plot the histograms of the total number of mistakes in Figure 4. In contrast to the other three treatments, a disproportionately large group of participants in the Baseline treatment always make the mistake of choosing the Pooling task, and a disproportionately small group of participants never make this mistake.
The distribution of total screening mistakes, by treatment

Fig. 4 Long description
Four histograms arranged in a two-by-two grid, one per treatment. Each shows the share of participants, on a vertical axis from 0 to 0.5, by the number of mistakes they make across the six Screening-dominant rounds, on a horizontal axis from 0 to 6. In the Baseline panel (top left), the approximate shares for 0 through 6 mistakes are 0.19, 0.28, 0.13, 0.11, 0.09, 0.06, and 0.14. In the Benchmark panel (top right), they are 0.47, 0.22, 0.11, 0.09, 0.03, 0.03, and 0.03. In the Automatic Inference panel (bottom left), they are 0.35, 0.28, 0.11, 0.10, 0.06, 0.04, and 0.05. In the Plan panel (bottom right), they are 0.47, 0.21, 0.13, 0.04, 0.06, 0.03, and 0.05. Baseline is the only treatment whose most common outcome is not zero mistakes, and it has the largest share of participants who make the mistake in all six rounds.
Participants in the Baseline treatment who always choose the Pooling task drive the persistence of insufficient screening. These participants never learn that screening is dominant and consistently avoid screening throughout the experiment. If we remove these participants from the sample, round 1 results remain similar, but the mistake rate in rounds 2–10 becomes close to statistically indistinguishable in all treatments except Plan (see column 7 in Table 3). This result shows that some participants struggle to learn the dominant screening choice without aid, making the mistake rate in the Baseline treatment more persistent.Footnote 28
Summary of estimates

Table 3 Long description
The table reports regressions of mistakes in Screening-dominant rounds on treatment indicators, with Baseline as the omitted group. Its seven columns correspond to the samples and specifications described in the table note. Panel A covers round 1 and Panel B covers rounds 2 to 10. Each cell gives a coefficient with its standard error in parentheses. Three stars indicate significance at the 1% level, two stars at the 5% level, and one star at the 10% level. In Panel A, the Benchmark coefficients in columns 1 to 7 are −0.50, −0.51, −0.53, −0.49, −0.49, −0.49, and −0.47, with standard errors of 0.04, 0.04, 0.05, 0.04, 0.04, 0.05, and 0.04. The Automatic Inference coefficients are −0.23, −0.25, −0.27, −0.23, −0.23, −0.27, and −0.21, with standard errors of 0.04, 0.04, 0.06, 0.05, 0.04, 0.05, and 0.05. The Plan coefficients are −0.32, −0.34, −0.39, −0.31, −0.32, −0.30, and −0.30, with standard errors of 0.04, 0.04, 0.05, 0.05, 0.04, 0.05, and 0.04. All Panel A coefficients are significant at the 1% level. The Baseline mistake rates in Panel A are 0.68, 0.68, 0.66, 0.67, 0.68, 0.63, and 0.62, and the numbers of observations are 982, 934, 546, 909, 982, 742, and 914. In Panel B, the Benchmark coefficients are −0.13, −0.14, −0.15, −0.14, and −0.13 in columns 1 to 5, all significant at the 1% level. Column 6 is −0.02, which is not significant, and column 7 is −0.05, significant at the 5% level. The Automatic Inference coefficients are −0.11, −0.12, −0.11, −0.12, and −0.11 in columns 1 to 5, all significant at the 1% level. Column 6 is −0.04, which is not significant, and column 7 is −0.05, significant at the 10% level. For both of these rows, the standard errors are 0.03 in every column except column 3, where they are 0.04. The Plan coefficients are −0.15, −0.17, −0.17, −0.16, −0.15, −0.07, and −0.09, all significant at the 1% level, with standard errors of 0.03 except 0.04 in column 3 and 0.02 in column 7. The Baseline mistake rates in Panel B are 0.34, 0.34, 0.29, 0.35, 0.34, 0.20, and 0.23, and the numbers of observations are 4910, 4670, 2730, 4545, 4910, 3710, and 4570.
Note: OLS regression results with binary dummies for each treatment (Baseline omitted) and mistakes in screening-dominant rounds as dependent variable. Specification by column: (1) Main sample, (2) Participants who never prefer the lottery induced by the Pooling task, (3) Participants who make zero mistakes on the understanding questions, (4) Participants who know that they will observe how much computers produce, (5) Main sample with controls for age, gender, race, and education level, (6) Participants who make zero mistakes in part 2 hiring choice, (7) Participants who choose the Screening task when it is dominant at least once. Robust standard errors in parentheses for round 1 and clustered by participant for rounds 2–10.  $p-value \lt 0.1$: *,
 $p-value \lt 0.05$: **,
 $p-value \lt 0.01$: ***.
This section’s results suggest that participants fail to anticipate inference and plan their strategies. These two mechanisms seem to be similarly important drivers of insufficient screening.
4. Robustness of results
Table 3 summarizes the multiple tests we conduct to verify the robustness of our results.
Pooling is a mistake. We directly elicit preferences over the induced lotteries, and almost all participants choose the lottery corresponding to the Screening task. Nevertheless, a few participants sometimes choose the lottery corresponding to the Pooling task, which could explain our results. To rule out this possibility, we construct a subsample without them and re-estimate the magnitude of mistakes. Column (2) of Table 3 shows that excluding participants who prefer at least one lottery induced by the Pooling task does not affect our results.
Participants’ understanding. Throughout the experiment, participants had to correctly answer a set of understanding questions. If they made an error on an understanding question, they had to correct it before proceeding. This design helps ensure that participants understand the critical features of the experiment even if they missed them while reading instructions.
Online Appendix Figure A.2 plots the distribution of errors in understanding questions. Most participants make few errors, with 89% of them making at most one error, and 56% making zero errors. The small number of understanding errors highlights that confusion or misunderstanding was not an issue for most participants. Since error rates are similar across treatments, misunderstanding is unlikely to drive the treatment effects.Footnote 29 The results are robust to misunderstanding by focusing on the 546 participants who make zero errors on the understanding questions, as Column (3) of Table 3 shows.
Do participants in the Baseline treatment understand that they will observe how much each computer produces before they make the hiring choice? If they fail to understand this, the Screening task is not necessarily dominant. However, asking an understanding question about this at the beginning of the experiment would highlight the connection between the two parts of the problem, potentially shutting down the mechanisms that we are interested in studying. To avoid interfering with the mechanisms, we first elicit participants’ round 1 trial task choice and only then ask the understanding question about whether they will observe how much each computer produces.Footnote 30 Restricting to the 71% of participants who answer this understanding question correctly—they know that they will observe how much each computer produces before the hiring choice—does not affect the results, as we show in column (4) of Table 3.
Mistaken use of information. Screening is dominant only if the participants correctly use the revealed information. To claim that choosing the Pooling task is a mistake, we need to show that participants who do so would be able to use the information if they got it. An ideal test for this would be observing participants’ counterfactual part 2 hiring choices after the part 1 Screening task. We approximate this counterfactual scenario by looking at participants’ actual part 2 hiring choices after choosing the Screening task in part 1. All Screening-dominant parameterizations are similar, with the only differences being parameters and task names. Therefore, we treat rounds where a participant chooses the Screening task as a counterfactual for the rounds where they choose the Pooling task. Across all treatments, more than 90% of participants hire the Good computer after choosing the Screening task (Online Appendix Figure A.4). This suggests that it is unlikely that participants who do not screen would not be able to use the revealed information.
Although mistakes at the hiring stage differ across treatments, this does not drive the differences in the screening decision. Participants in the Baseline treatment make slightly more hiring mistakes than in the other treatments. These differences are too small to explain the large differences in the trial task choices. Nevertheless, we verify that the results are robust to this concern by restricting the sample to those participants who use the information correctly: those who chose the Screening task at least once and always hired the Good computer thereafter. Round 1 results stay the same in this subsample as in the whole sample, although the levels of mistake rates mechanically decrease for all treatments. In subsequent rounds, most treatment effects disappear—participants in the Baseline treatment make the same number of mistakes as in the Benchmark and Automatic Inference treatments, although still more than in the Plan treatment (Table 3, column (6)). Both the decrease in the levels of mistakes and the faster learning dynamics are expected because this subsample excludes everyone who always chooses the Pooling task, who drive the persistence of insufficient screening in the full Baseline sample.Footnote 31
Stakes: The payoff consequences of these mistakes are substantial. By not screening, participants leave on the table at least \$2, which represents 53% of their average bonus payment. While whether these mistakes disappear as stakes increase remains an empirical question (Klein Teeselink et al., Reference Klein Teeselink, van Dolder, van den Assem and Dana2026), and we do not expect experienced policy-makers or employers to necessarily behave as our Prolific participants, the sample and stakes we study are important in themselves in shedding light on lay people’s behavior in the face of this trade-off, which can determine their support for policies.
First round learning: Many naturally occurring decision problems are effectively one-shot or first-time events. Individuals often lack repeated exposure to such situations, limiting learning opportunities.Footnote 32 First-round behavior may partly reflect unfamiliarity with the task, including the need to recall which task is which.Footnote 33 However, these same conditions characterize many naturally occurring screening decisions. Even if participants later learn, their first-round behavior provides insights into how individuals approach unfamiliar trade-offs in the absence of prior experience.
Nevertheless, it is crucial to understand the persistence of the mistake, and the substantial and immediate drop in the rate of mistakes after the first round calls for caution in interpreting their persistence in our setting. As we argue in our discussion of participants’ understanding, the rate of mistakes does not seem to be driven by confusion or lack of engagement. However, the fact that behavior changes so substantially after round 1, sheds light on the persistence and robustness of the cognitive bias.
We might be estimating an upper bound in learning: As we discuss above, after round 1 we introduce a comprehension question meant to test whether participants in the Baseline treatment understand that they will observe how much each computer produces before they make the hiring choice. This question highlights the connection between the two parts of the problem, potentially shutting down the mechanisms that we are interested in studying, which is why we only ask it after round 1. As a result, the understanding question does not affect round 1, but it may speed up learning, leading to an underestimation of the persistence of the mistake.
Moreover, while mistakes exhibit significant persistence, there is heterogeneity in the learning pattern. In contrast to the substantial share of participants who make a mistake only in the first round, Figure 4 shows that a disproportionately large group of participants always make the mistake in Baseline relative to the other treatments. This heterogeneity suggests that the robustness of the cognitive failure is not globally robust but might rather vary across individuals.
Memory and recall. If participants in Baseline forget which task reveals computer quality, the other treatments may reduce mistakes simply by providing reminders rather than by addressing cognitive failures. Several pieces of evidence argue against this interpretation. First, participants undergo detailed instructions and must pass comprehension checks before making their decisions. In particular, in every round, participants must answer “In part 2 of this decision, which task do the computers solve?” before making their part 1 choices (see Online Appendix Figure A.13). Column (3) of Table 3 shows that the results are robust to focusing on the participants who make zero errors on the understanding questions. Second, in every decision page, participants have access to a “Review Instructions” button which they can click to remind themselves of any information that they might have forgotten or missed (see Online Appendix Figure A.14). Given that the stakes are significant for them, as we mentioned above, we don’t expect participants to continue with the study without knowing crucial aspects of the instructions. Third, the pattern across treatments is inconsistent with a pure memory explanation: if treatment differences were driven by recall, the Automatic Inference and Plan treatments—which explicitly state the informational content of each task at the point of choice—should eliminate nearly all non-noise mistakes. Instead, it accounts for only about half of the round 1 gap. This pattern is more consistent with genuine cognitive failures than with memory. Hence, we believe the preponderance of evidence supports cognitive failures as the primary driver.
Individual characteristics. We rule out that differences in participants’ self-reported age, gender, race, and education across samples drive the treatment effects. The treatments are balanced on these demographics, but participants in the Plan treatment are slightly younger than the Baseline participants (Online Appendix Table A.1). Column (5) of Table 3 shows the results are robust to controlling for these characteristics.Footnote 34 Moreover, we find no evidence that the heterogeneity in the persistence of the mistake that we note in our discussion of learning after round 1 is related to self-reported age, gender, race, or education.
5. Conclusion
We experimentally test, and find evidence consistent with, the hypothesis that failures of contingent thinking lead people to not screen enough when screening is dominant, even without time inconsistency, risk aversion, and strategic considerations. Insufficient screening significantly diminishes, yet persists, with experience and feedback. We further postulate and test two mechanisms that drive insufficient screening. First, participants fail to recognize that screening allows them to make inferences in the future. Second, they fail to plan their entire strategy. We run two additional treatments that test for each of the mechanisms, each of which accounts for about half of the non-noise mistake rate.
Our results identify a specific cognitive bias by which people can systematically underappreciate the informational value of screening. This bias is relevant wherever there is a trade-off between the costs of screening and the benefits of the information it reveals. Consider an illustrative example: if prisons strictly enforce good behavior, every inmate will follow the rules. This policy may reduce violence, but it also prevents learning about inmates’ character and willingness to follow the law, which is information that could be essential for early parole decisions. More broadly, policies that create strong incentives induce uniform behavior, limiting what can be learned from observed behavior. Whether screening dominates pooling in any particular setting is an empirical question that requires careful context-specific analysis beyond the scope of this paper. However, our results suggest that the informational value of screening may be systematically underappreciated, which is a consideration that policymakers and individuals should be aware of when designing or evaluating screening opportunities.
Our findings have important implications that open several avenues for future research.
First, in our experiment, participants make inferences about computers. While this allows us to keep control, an exciting extension would be considering inferences about other people or the self in more realistic scenarios. For example, future work can incorporate studies of how failures to appreciate the informational content of educational signals lead to statistical discrimination in hiring (Campos-Mercade & Mengel, Reference Campos-Mercade and Mengel2024). Together with our results, these findings paint a picture of systematic failures in how people handle information in screening and hiring contexts: people fail not only at using available information correctly (as Campos-Mercade and Mengel, Reference Campos-Mercade and Mengel2024 show), but also at acquiring it in the first place. Moreover, inferences about the self play a role in the literature on the unintended consequences of policies (Bitler & Karoly, Reference Bitler and Karoly2015; Nandi & Laxminarayan, Reference Nandi and Laxminarayan2016), which shows that external incentives may crowd out intrinsic or ‘warm glow’ motivation (Ariely et al., Reference Ariely, Bracha and Meier2009; Bénabou & Tirole, Reference Bénabou and Tirole2006; Frey & Jegen, Reference Frey and Jegen2000; Lepper et al., Reference Lepper, Greene and Nisbett1973). Our findings imply that people may not realize that strong incentives limit one’s ability to feel good about themselves based on inferences they can make about themselves, leading to the crowding-out effect.
Our results also have implications for the literature that shows the persistence of stereotypes and wrong beliefs (Babcock et al., Reference Babcock, Recalde, Vesterlund and Weingart2017; Skrypnek & Snyder, Reference Skrypnek and Snyder1982; Snyder, M. Reference Snyder1981). One mechanism for this persistence can be the existence of strong incentives for uniform behavior by which the stereotyped group cannot disprove the stereotype, leading to its persistence. Future work testing for the Failure to Anticipate Inference and to Plan in these settings would help understand the psychological underpinnings of these results.
Moreover, incorporating strategic concerns can help study the implications of our findings for information acquisition in collective decision-making. In this context, theoretical literature shows that under-investment in information can also arise from strategic incentives: in committees and electorates, rational agents free-ride on others’ information acquisition (Martinelli, Reference Martinelli2006; Persico, Reference Persico2004), and in dynamic voting settings, control-sharing externalities reduce experimentation below the social optimum (Strulovici, Reference Strulovici2010). Laboratory evidence from this setting is mixed: Bhattacharya et al. (Reference Bhattacharya, Duffy and Kim2017) find that voters over-acquire information when signals are noisy, but under-acquire when signals are precise. Our results show that under-acquisition of information persists even when strategic motives are entirely absent: a single decision-maker, facing no free-riding incentive, still fails to screen. This suggests that insufficient information acquisition has both strategic and cognitive roots, and that failures of contingent thinking is a cognitive channel that may compound the evidence documented in collective settings.
As with any economic experiment, the introduction of a highly controlled environment comes at the cost of naturalism. While we believe our design captures the essence of the screening decision in an externally relevant way, future field work testing the role of contingent thinking in screening can further contribute to our understanding of this phenomenon. For example, while in naturally occurring scenarios screening is often intentional (e.g., hiring), the informational cost of underscreening can often be overlooked in situations in which preventing bad behavior takes a more salient role (e.g., prison policy). As another example, the external relevance of our results could be further tested by empirically quantifying the informational cost of underscreening in naturally occurring settings where the party making the inference differs from the one making the screening choice (e.g., as in the example above with prisons and inmates), including contexts where the policy choice is paternalistic. Future work could explore how this and other naturally occurring factors—that our experiment controls for—interact with our results.
Finally, the basic cognitive bias we explore can, in principle, relate to any setting in which there is a risky choice that provides information. More work in this area is needed to figure out whether the cognitive phenomenon we study in this paper extends to other settings, like canonical search problems, stopping problems, and beyond. As an example of the breadth of settings that are related, Bernheim and Whinston (Reference Bernheim and Whinston1998) show that incomplete contracts may be optimal if they allow learning more about the counterparty than complete contracts. Future work could explore whether the Failure to Anticipate Inference and to Plan can lead people to ignore this channel and write too restrictive contracts.
Supplementary material
The supplementary material for this article can be found at https://doi.org/10.1017/eec.2026.10067.
Replication material
The replication materials for this study are available at https://doi.org/10.5281/zenodo.22746696.
Acknowledgement
We thank B. Douglas Bernheim, Lukas Bolte, John Conlon, Stanton Hudja, Muriel Niederle, Kirby Nielsen, Alvin Roth, Jason Somerville, and seminar participants at BABEEW, BEESCuitS, ESA, IZA, and Stanford University for their helpful comments.
Ethical standards
This study is covered under Stanford’s IRB Protocol 44866 and was registered on the AEA RCT registry under ID AEARCTR-0012230 titled “The inference cost of interventions.”








 Open access

