Despite overwhelming evidence and educational campaigns, compliance with hand hygiene remains suboptimal, and effective improvement strategies are needed.Reference Kingston, O’Connell and Dunne 1 Accurate methods of measuring hand hygiene adherence are the essential first step in improving performance.
Acute-care hospitals across North America and Europe are adopting group electronic hand hygiene monitoring systems as a method of continuous monitoring of hand hygiene compliance. These systems rely on accurate estimates of hand hygiene opportunities (HHOs) per patient day to determine compliance.Reference Sax, Allegranzi, Uckay, Larson, Boyce and Pittet 2 , 3 The number of HHOs per hour has been reported in 1 Australian and 2 US hospitals, with validations using video surveillance,Reference Steed, Kelly and Blackhurst 4 – Reference Azim, Juergens, Hines and McLaws 6 and in a single Canadian academic hospital, with data obtained mainly during week days.Reference Goodliffe, Ragan and Larocque 7 , Reference Han, Conway and Moore 8 The external validity of these findings is unknown because of the lack of data assessing interhospital differences, including across academic and community hospitals in Canada.
We sought to estimate the number of HHOs per patient day on medical and surgical inpatient units across 2 academic hospitals and 1 community hospital in Ontario, Canada.
Methods
Study setting and patient population
This multicenter observational study was conducted at 3 acute-care hospitals in southern Ontario, Canada: (1) Sunnybrook Health Sciences Centre (Bayview Campus Site), an academic tertiary-care center with 627 beds, (2) Sinai Health System (Mount Sinai Site), a 442-bed academic tertiary-care center, and (3) Lakeridge Health Oshawa, a 426-bed community teaching hospital. Observations were conducted on 11 medical units, 7 surgical units, and 3 mixed units across the 3 hospitals. No critical care units were included in the study. The study was approved by the research ethics boards of all 3 participating institutions.
Observer training
Observers were trained to identify HHOs in accordance with the Public Health Ontario “Four Moments for Hand Hygiene” methodology, consisting of moment 1 before initial patient–patient environment contact, moment 2 before an aseptic procedure, moment 3 after body fluid exposure risk, and moment 4 after patient–patient environment contact. 3 This methodology differs from the WHO “Five Moments for Hand Hygiene”Reference Sax, Allegranzi, Uckay, Larson, Boyce and Pittet 2 in that the WHO moments 4 and 5 are combined into a single moment, and the WHO moment 1 is expanded to include contact with the patient environment. These differences result in an estimated 10%–20% increase in the recommended HHO rate in hospitals using the “Four Moments” methodology.Reference Han, Conway and Moore 8 All observers completed a self-directed learning module on HH auditingReference Just 9 followed by in-person training in a central location by the same infection control practitioner.
Data collection
Direct observation of HHOs was performed during 60-minute observation periods between June 2016 and September 2017. A random number generator was used to select the unit and bed(s) for each observation period. A standardized data collection form was used that included date, time, room type (1, 2, 3, or 4 beds), infection control precautions, entry and exit times from the patient environment, and the type of healthcare worker (HCW) involved in the interaction. If a patient’s curtains were drawn during an interaction, the observer asked the HCW to provide details of the interaction to determine the number and type of HHOs that occurred. Observers only documented HHOs; they did not audit hand hygiene compliance.
Statistical analysis
Continuous measures were summarized using means and standard error, and categorical measures were summarized using counts and percentages. Day (6:00 a.m. to 6:00 p.m.) and night (6:00 p.m. to 6:00 a.m.) observations were weighted equally to calculate HHOs per patient day.
The number of HHOs per hour was further analyzed in a Poisson regression model that included the following explanatory variables: hospital site, day versus night, unit type (medical, surgical, or mixed), single-bed versus multiple-bed room, whether additional precautions were required for patient care, and week day versus weekend. The model adjusted for overdispersion and presented results as incidence rate ratios with their associated 95% confidence intervals. Analyses were carried out using SAS version 9.4 software (SAS Institute, Cary, NC).
Results
In total, 568 patient hours of observation were collected: 226 patient hours (40%) at hospital A, 156 patient hours (27%) at hospital B, and 186 patient hours (33%) at hospital C. Moreover, 324 patient hours of observation (57%) occurred on medical units, 172 (30%) on surgical units, and 72 (13%) on mixed units (Supplemental Material A). In total, 2,501 HHOs were observed: 1,038 (42%) for moment 1, 176 (7%) for moment 2, 259 (10%) for moment 3, and 1,028 (41%) for moment 4. Nurses were the HCWs for 1,665 HHOs (67%), while physicians were the HCWs for 136 HHOs (5%). The distributions of HHOs by moment type and HCW are available in Supplemental Material B. During the night, nurses were the HCWs for 206 of 225 HHOs (92%), compared to 1,459 of 2,276 HHOs (64%) during the day (P<.001).
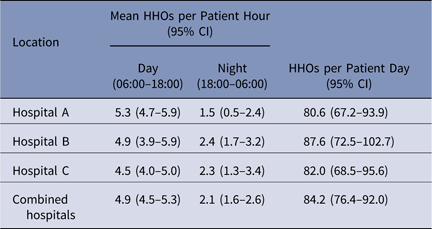
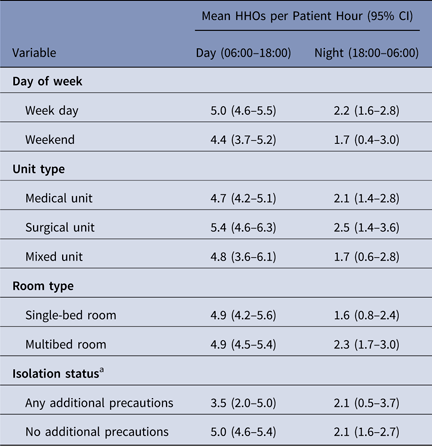
Table 1 displays the estimated HHOs per patient hour and per patient day at each hospital. The mean HHOs per patient hour was significantly higher during the day than during the night across all sites (P<.0001). The HHOs per patient day were slightly higher during week days than weekends (Table 2).
Estimated Hourly and Daily Hand Hygiene Opportunities (HHOs)

Note. CI, confidence interval.
Overall Mean Hand Hygiene Opportunities (HHOs) per Patient Hour

Note. CI, confidence interval.
a Isolation status not available for 128 patient hours of observation at hospital C.
In the Poisson multivariable model, only time of day was significantly associated with hourly HHOs (P<.0001) while day of the week, hospital, unit type, room type, and whether additional precautions were being used had no significant association.
Discussion
Group electronic hand hygiene monitoring systems work by sensing every activation of hand hygiene dispensers and generating a compliance rate based on an accurate estimate of HHOs per patient day. Our study suggests that the average number of HHOs per patient day is stable across Canadian medical and surgical inpatient units, making it suitable for calibrating these systems. Our estimate is also generally similar to those of previous single-center studies in CanadaReference Goodliffe, Ragan and Larocque 7 , Reference Han, Conway and Moore 8 as well as those in the United States and Australia,Reference Steed, Kelly and Blackhurst 4 – Reference Azim, Juergens, Hines and McLaws 6 after taking into account the expected 10%–20% increase associated with the Four Moments methodology (Supplemental Material C).Reference Han, Conway and Moore 8
One important difference from prior studies is that we did not identify a significant difference between HHOs per patient day between academic and community hospitals. The HOW-2 study identified a much lower rate of HHOs in a community hospital which may reflect a difference between the Canadian and US healthcare systems.Reference Steed, Kelly and Blackhurst 4 Alternatively, it may reflect the smaller size of the community hospital included in the HOW-2 study compared to our hospital, which is a large community center with an affiliation to a university. Assessment of HHOs by moment of HH did identify that moments 2 and 3 comprise a smaller proportion of HHOs in a community hospital than in academic hospitals, which may be evidence of lower acuity of patient care in our community hospital.Reference Han, Conway and Moore 8
The number of HHOs on inpatient units appears to be stable throughout the week. Similar to 4 previous studies in Canada, the United States, and Australia, we did not observe a significant decrease in HHOs on weekends.Reference Steed, Kelly and Blackhurst 4 – Reference Azim, Juergens, Hines and McLaws 6 , Reference Han, Conway and Moore 8 This finding suggests that decreases in performance measured by electronic hand hygiene monitoring systems during weekends and holidays is a result of changes in behavior rather than actual changes in HHOs.Reference Azim, Juergens, Hines and McLaws 6 Nurses may contribute significantly to this stability in HHOs over time given that they contribute the majority of HHOs, especially during the night. While physicians contribute only 5% of HHOs, they generally interact with a larger number of patients and therefore may play a disproportionately important role in the spread of infectious pathogens.Reference Nijssen, Bonten, Franklin, Verhoef, Hoepelman and Weinstein 10
Our study has several limitations. First, observations were limited to medical/surgical units and excluded critical care, emergency departments, obstetrical services, or outpatient clinic areas. Although we studied both academic and community hospitals, our findings may not reflect practices across all Canadian acute-care hospitals. Internal validation should always be performed to confirm accuracy prior to implementing group electronic hand hygiene monitoring systems.
Supplementary material
To view supplementary material for this article, please visit https://doi.org/10.1017/ice.2018.221
Acknowledgments
The authors acknowledge the following individuals who contributed to data collection for this study: Kelsey McCasey, Darlene Saft, and Omar Salman.
Financial support
No financial support was provided relevant to this article.
Conflicts of interest
All authors report no conflicts of interest relevant to this article.