INTRODUCTION
Cultivar selection is one of the most important factors in crop production to obtain high yield. The adoption of modern cultivars has dramatically increased crop yields all over the world (Evenson & Gollin Reference Evenson and Gollin2003; Zhou et al. Reference Zhou, He, Sui, Xia, Zhang and Zhang2007). However, without any improvement modern cultivars might not maintain this yield increase due to predicted adverse climate change (CC) impacts in many regions (Alexandrov & Hoogenboom Reference Alexandrov and Hoogenboom2000; Eitzinger et al. Reference Eitzinger, Orlandini, Stefanski and Naylor2010). Efforts to identify suitable cultivars to increase yield under CC would be a key factor for sustainable agriculture development.
Under the background of global warming and increasing CO2 concentrations, concerns about the impact of CC on agricultural production are increasing. Rising concentrations of CO2 can increase crop photosynthesis rates, leading to enhancement of total biomass and yield of wheat (Cure & Acock Reference Cure and Acock1986; Wolf et al. Reference Wolf, van Oijen and Kempenaar2002). However, increased temperature shortens the phenological phases, reducing the time for light and carbon assimilation, which is an important cause of yield reduction under CC (Peng et al. Reference Peng, Huang, Sheehy, Laza, Visperas, Zhong, Centeno, Khush and Cassman2004; Anwar et al. Reference Anwar, O'Leary, Mcneil, Hossain and Nelson2007; Tao et al. Reference Tao, Yokozawa, Liu and Zhang2008). The ultimate purpose of CC studies is to identify effective solutions or adaptation strategies to overcome adverse CC impacts and to promote sustainable development of a region. The adaptation of changing to cultivars with longer/shorter growing periods or with heat-/drought-tolerant genetic characteristics has been proposed for some regions (Torriani et al. Reference Torriani, Calanca, Schmid, Beniston and Fuhrer2007; Luo et al. Reference Luo, Bellotti, Williams and Wang2009; Tao & Zhang Reference Tao and Zhang2010). Relatively few studies have focused on the performance of cultivar types with different vernalization demands under warming conditions (Alexandrov et al. Reference Alexandrov, Eitzinger, Cajic and Oberforster2002; Tubiello et al. Reference Tubiello, Rosenzweig, Goldberg, Jagtap and Jones2002). Vernalization is the exposure of plants to low temperatures and increases a plant's readiness to flower, with longer vernalization generally leading to reduced time to flowering (Ritchie Reference Ritchie, Hanks and Ritchie1991). Many winter plants require vernalization to stimulate flowering (Michaels Reference Michaels2009), but often require an additional environmental cue, long day length, to ensure that flowering occurs in spring (Dennis & Peacock Reference Dennis and Peacock2009). The appropriate vernalization response is important in fitting of the winter cereal's lifecycle to the environment in which it is grown, so it can make the best use of the seasonal opportunities for growth and avoid adverse climatic conditions (Tottman Reference Tottman1977). Additionally, most previous studies have used ‘synthetic’ cultivars, obtained by changing crop parameters in the model (Luo et al. Reference Luo, Bellotti, Williams and Wang2009). This approach has led to further uncertainties in analysing the impact of CC on crop yield, because the parameters used for synthetic cultivars were not evaluated by field experimental data. Therefore, it is uncertain whether the parameters of synthetic cultivars could reasonably express the interaction between environment and crop growth in actual field experiments.
Winter wheat is the most important food crop in the North China Plain (NCP), which produces more than 0·7 of the nation's wheat (Sun et al. Reference Sun, Liu, Zhang, Shen and Zhang2006). It requires vernalization and must experience a period of low winter temperature to initiate or accelerate the flowering process. Since wheat is grown at widely varying latitudes, it experiences different temperatures during winter. Depending on the duration of the low temperature required for winter wheat vernalization, wheat cultivar types in China are divided into ‘weak-winter type’, ‘semi-winter type’, ‘winter type’ and ‘strong-winter type’ (Wang et al. Reference Wang, Mei, Miao and Jin1996). Currently, the vernalization requirement of a wheat cultivar generally strengthens from the south to the north in the NCP. The cultivars of weak-winter type and semi-winter type are adopted in the southern NCP, while cultivars of winter type and strong-winter type are currently widespread in the northern NCP. A detailed understanding of how climatic conditions impact the yield for different wheat cultivar types is very important for the sustainable development of this region.
The present study used three different ecological sites, representative of the different wheat cultivars (weak-winter types, semi-winter types and winter types), following a south–north transect across six latitudes within the NCP in order to: (1) simulate the performance of different wheat cultivars at the same site under the present climate (baseline) and to demonstrate that the results are consistent with traditional cultivar management practices; (2) evaluate the impacts of future climate conditions on wheat growth (vernalization, vegetative and reproductive phases) and yield and yield stability for typical local cultivars; and (3) explore the possibility of alternatives among cultivars with different vernalization requirements as a strategy of adaptation to CC impacts. To achieve these objectives, calibration and validation of the APSIM-Wheat model were performed on-site to identify cultivar parameters based on experimental data at three ecological sites.
MATERIALS AND METHODS
Study sites
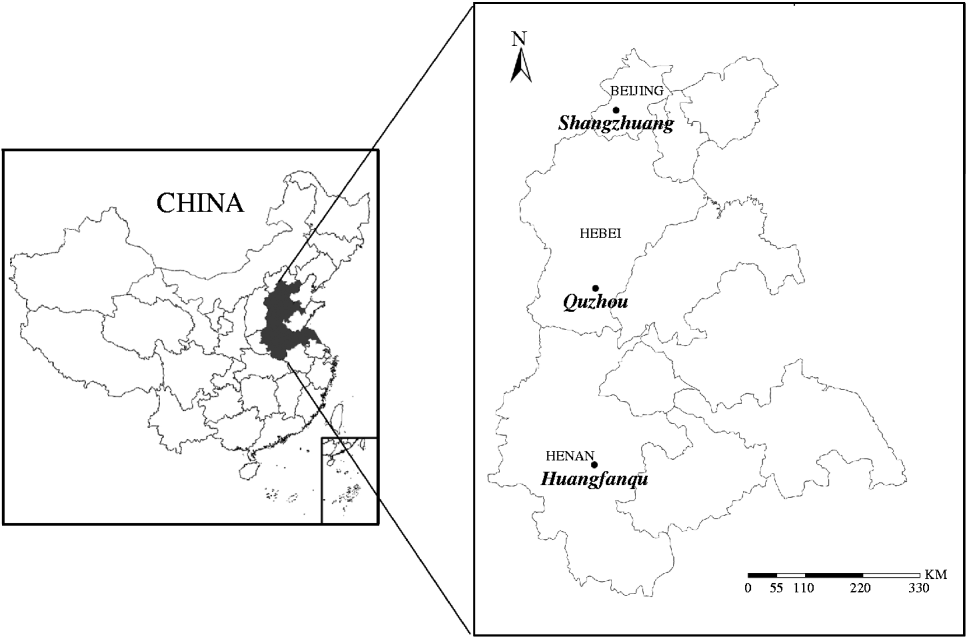
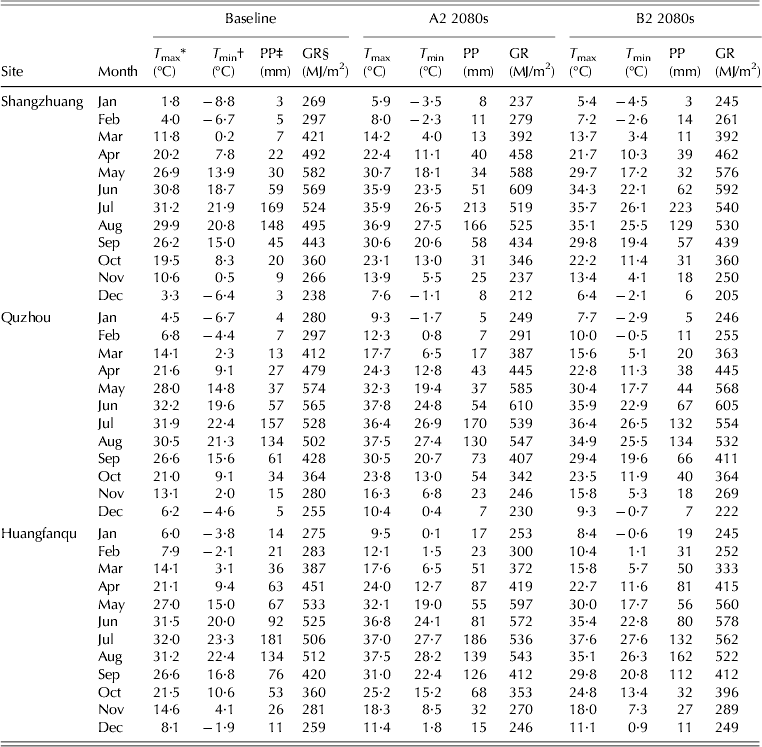
Three study sites were selected to examine wheat yield performance with different cultivar types and temperature features following a south–north transect covering six latitudes within the NCP (Fig. 1). The main climatic features of the three sites are presented in Table 1. The vernalization period of winter wheat generally lengthens, and the temperature decreases, from south to north. The first location, Huangfanqu farm (33°48′N, 114°30′E, 48 m asl, HFQ) in Henan Province, with a mean minimum temperature of −3·8 °C in January, generally grows cultivars of weak-winter types (typical cultivar: Yanzhan4110) and semi-winter types (typical cultivar: Han6172). The second location, the Quzhou experiment station of China Agricultural University (36°54′N, 115°0′E, 40 m asl, QZ) in Hebei Province, with a mean minimum temperature of −6·7 °C in January, generally grows cultivar of semi-winter type (typical cultivar: Han6172). The third location, the Shangzhuang experiment station of China Agricultural University (40°6′N, 116°12′E, 44 m asl, SZ) in Beijing, with a mean minimum temperature of −8·8 °C in January, generally grows cultivar of winter type (Cultivar: Nongda211). The soils of each region are characterized as follows: sandy loam soil for HFQ in the south NCP, a typical silty loam soil in QZ in the central NCP and loam in SZ in the north NCP.
The NCP and the three experimental sites: Shangzhuang in Beijing, Quzhou in Hebei Province and Huangfanqu in Henan Province.

Climate projections for the 2080s (2071–2100) and baseline (1961–90) period climate at three study sites
* Maximum temperature.
† Minimum temperature.
‡ Precipitation.
§ Global radiation.
Experimental data
Field experiments were conducted at SZ, QZ and HFQ in the period 2008–10. At each site, it was a three factorial split–split–plot design that consisted of sowing date as the main factor (early, medium and late), and cultivar (Nongda211, Han6172 for SZ; Nongda211, Han6172, Yanzhan4110 for QZ; Han6172, Yanzhan4110 for HFQ), and density (150, 300 and 450 plants/m2) as split factors. The early sowing date was 8, 10 and 10 October in the 2008/09 season and 3, 7 and 10 October in the 2009/10 season at SZ, QZ and HFQ, respectively. Medium- and late-sowing dates were 10 and 20 days after the early sowing date, respectively. The blocks were replicated four times at QZ and three times at SZ and HFQ.
Basin irrigation was used at each site. Irrigation water was applied (60 mm each time) before winter (GS20, Zadoks et al. Reference Zadoks, Chang and Zonzak1974) and at the jointing (GS30) stage in the 2008/09 season, and at the jointing and flowering (GS60) stages in the 2009/10 season. Nitrogen fertilizers were applied twice at planting and jointing stages in both seasons (120 kg N/ha each time).
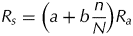
In order to calibrate the performance of the APSIM-Wheat model, the main phenological stages were recorded for each plot. Leaf area index (LAI) and above-ground biomass (for green and dead leaves, stems and heads) were measured five to seven times during the growing season. Grain yield, grain numbers per plant and grain weight were measured at harvest. In addition, grain dry weight was obtained at 5, 10, 15, 20, 25 and 30 days after the beginning of grain-filling to calculate development of grain size at QZ. LAI was calculated by multiplying the manually measured length and maximal width by a shape factor of 0·83, as is typical for wheat (Zhang et al. Reference Zhang, Zhao, Dong, Li, Chen and Sun2007). Biomass was determined after oven-drying at 65 °C for 48 h. Daily weather data, including maximum and minimum temperature, sunshine hours and precipitation, were obtained from the weather station c. 1 km from the experimental plots at SZ and QZ, and c. 20 km from the experimental plots at HFQ. The Angstrom equation was used to calculate the daily global radiation with sunshine hours as follows:
 $$R_s = \left( {a + b\displaystyle{n \over N}} \right)R_a $$
where R s is the global radiation (MJ/m2/d); n and N are the actual and maximum duration of sunshine (h); R a is the extraterrestrial radiation (MJ/m2/d); a is the regression constant, expressing the fraction of extraterrestrial radiation reaching the earth on overcast days (n = 0); a+b is fraction of extraterrestrial radiation reaching the earth on clear days (n = N); a and b can be used according to Y. Huang (personal communication); N and R a can be calculated from latitude and time of year (Allen et al. Reference Allen, Pereira, Raes and Smith1998).
APSIM-Wheat model
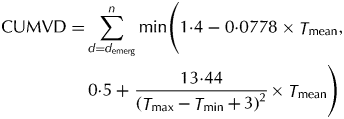
The APSIM-Wheat model version 6.1 (Wang et al. Reference Wang, Robertson, Hammer, Carberry, Holzworth, Meinke, Chapman, Hargreaves, Huth and Mclean2002; Keating et al. Reference Keating, Carberry, Hammer, Probert, Robertson, Holzworth, Huth, Hargeaves, Meinke, Hochman, Mclean, Verburg, Snow, Dimes, Silburn, Wang, Brown, Bristow, Asseng, Chapman, Mccown, Freebairn and Smith2003) was used to simulate crop yield as a function of current as well as future climate conditions. Phenological development is determined by accumulation of thermal time, which is modified by vernalization and photoperiod factors (PFs) from emergence to terminal spikelet. Daily thermal time (DTT) is calculated from 3-hourly air temperatures interpolated from the daily maximum and minimum crown temperatures above 0 °C. Photoperiod influences development through a power equation determining PF based on the difference between 20 h and current day length with photoperiod sensitivity as a cultivar-specific input parameter (photop_sens). Vernalization factor (VF) is calculated from the accumulated vernalization-days (CUMVD) and the vernalization sensitivity input parameter (vern_sens):
 $$\eqalign{{\rm VF} = & 1 - ({\rm vern}\_{\rm sens} \times 0{\cdot}0054545 + 0{\cdot}0003) \cr & \times (50 - {\rm CUMVD})}$$
where CUMVD is calculated as
 $$\eqalign{{\rm CUMVD} = & \sum\limits_{d = d_{{\rm emerg}}} ^n {\min \left\Bigg( {1{\cdot}4 - 0{\cdot}0778 \times \mathop T\nolimits_{{\rm mean}}, \quad } \right.} \cr & \left. { \, 0{\cdot}5 + \, \displaystyle{{13{\cdot}44} \over {{\rm} (\mathop T\nolimits_{\max} - \mathop T\nolimits_{\min} + \,3)^2}} \times \mathop T\nolimits_{{\rm mean}}} \right\Bigg)} $$
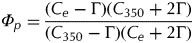
where T mean is the daily mean air (crown) temperature, T max is the daily maximum temperature and T min is the daily minimum temperature. The threshold value of CUMVD is 50. Maximum vernalization occurs at temperatures of 0–8 °C. Vernalization is insignificant at temperatures below 0 °C or above 15 °C. Up to one vernalization-day (VD) can be accumulated each calendar day, and adds incrementally to the total accumulated VDs. If the vernalization process has not been completed, de-vernalization can occur when the daily maximum temperature exceeds 30 °C. Biomass accumulation is calculated by using light interception, radiation use efficiency (RUE), with reduced RUE under both water and nitrogen stress. Leaf area growth is simulated using initial leaf area, leaf appearance rate and the relationship between plant leaf area and temperature. Grain yield is a function of grain number, grain filling and carbohydrate remobilization. Response of wheat growth to elevated CO2 concentration was calculated based on Reyenga et al. (Reference Reyenga, Howden, Meinke and Mckeon1999): (1) RUE is scaled by the ratio (Φ p) of light-limited photosynthetic response at the enhanced CO2 concentration compared with that at a CO2 concentration of 350 ppm.
 $${\it\Phi} _p = \displaystyle{{(C_e - \Gamma )(C_{350} + 2\Gamma}) \over {(C_{350} - \Gamma )(C_e + 2\Gamma})} $$
where C 350 is the 350 ppm CO2 concentration, C e is the elevated CO2 concentration (ppm) and Γ is the temperature-dependent CO2 compensation point. (2) Transpiration efficiency increases linearly from 1 to 1·42 when CO2 concentration increases from 350 to 750 ppm. (3) Critical leaf nitrogen concentration decreases by 0·04 when CO2 concentration increases from 350 to 750 ppm.
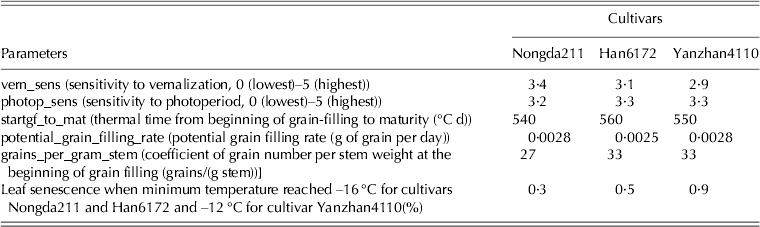
The experimental data of the 2008/09 season at three sites were used to calibrate the APSIM-Wheat model. The model was initialized with measured initial soil water and soil nitrogen (N) conditions, specified sowing date and density, and irrigation and N fertilizer applications the same as in the experiment, and run to simulate the floral initiation, flowering and maturity dates. Cultivar parameters for phenology (Table 2) were derived first using a trial-and-error method to match the simulated dates of flowering and maturity to the measured dates. Thereafter, a potential grain filling rate was calculated using the measured grain weight every 5 days and the coefficient of grain number per stem weight from measured stem dry matter and grains per stem at the beginning of the grain filling stage. In addition, the response of leaf death to minimum temperature was modified for the wheat cultivars of winter type (Cui & Zheng Reference Cui, Zheng and Jin1996), semi-winter type and weak-winter type (Feng et al. Reference Feng, Dong, Hu, Li, Li and Ru2010). The calculated parameters were used firstly to run the model, and then refine the parameter values to obtain a better match between simulated biomass, LAI and yield and measured values. The parameter values that result in minimum bias between observed and simulated values at all sites were selected for the same cultivar. For testing model performance against independent data, the parameterized model was run against the experimental data of 2009/10 season.
Wheat parameters of three cultivars calibrated by field experiments in the NCP
CC scenarios
The results of Providing Regional Climates for Impacts Studies (PRECIS; Jones et al. Reference Jones, Noguer, Hassell, Hudson, Wilson, Jenkins and Mitchell2004), run under the A2 and B2 SRES emission scenarios, were used in the present study: PRECIS takes the output of HadAM3H at its lateral boundaries, thereby inheriting the large-scale characteristics of HadAM3H, but has finer spatial (typically 50 km) and time resolution (i.e. daily weather data), better spatial detail (i.e. topography), and better simulation of extreme weather events (Xiong et al. Reference Xiong, Lin, Ju and Xu2007). The A2 scenario represents medium–high emissions and belongs to a scenario characterized by very rapid economic and population growth, while B2 represents medium–low emissions and emphasizes sustainable development. Furthermore, the periods of 1961–90 and 2071–2100 (2080s) were selected to represent the baseline and future climate, respectively. Table 1 summarizes the average predictions for the 2080s and the baseline at the three study sites. The atmospheric CO2 concentration ranges from 350 ppm for the baseline period to 721 and 561 ppm for the A2 and B2 emission scenarios of the 2080s, respectively.
Simulation design
To test cultivar management under the present climate and to identify the possibility of adaptation under future climate scenarios (2080s), three wheat cultivars (Nongda211, Han6172 and Yanzhan4110) with different vernalization requirements were used in the present study. Three simulations were designed as follows.
Simulation experiment 1 (Expt 1) simulated the yield performance for different cultivars planted at the same site under the baseline condition. Two cultivars, Nongda211 and Han6172 were used at SZ, Han6172 and Yanzhan4110 were used at HFQ, and all three cultivars were used at QZ.
Simulation experiment 2 (Expt 2) investigated the effect of CC (A2 and B2 scenarios) effects on growth duration and yield for the traditional wheat cultivars at the three sites. Nongda211 was used at SZ, Han6172 at QZ, and Han6172 and Yanzhan4110 at HFQ.
Following the results of Expt 2, simulation experiment 3 (Expt 3) quantified alternatives among the current three cultivars as a strategy of adaptation to CC impacts. The cultivars used were the same as those in Expt 1.
A dominant winter wheat–summer maize double-cropping rotation has been developed in the last three to four decades, which provides a stable sowing date for wheat during October in the NCP. Based on this information, a fixed sowing time was used in the present study. A total of 350 wheat seeds/m2 were sown on 1 October at SZ, 6 October at QZ and 11 October at HFQ, with full irrigation and nitrogen fertilizer application. Soil water and soil N conditions were the same as the initialized procedure in the model.
Quantification of model performance and date analysis
For testing model accuracy, statistical indicators were used, such as Student's t test (P (t*)), absolute root mean squared error (RMSEa) and the d index of agreement (Willmott et al. Reference Willmott, Ackleson, Davis, Feddema, Klink, Legates, O'Donnell and Rowe1985). If P(t*) > 0·05, d was close to 1 and RMSEa was similar to the s.d. of the measured variables, the model's performance would be considered as good.
Coefficients of variation (CV) of yield, defined as the ratio of s.d. over the mean, were computed over the entire time-series available at each site. The CV represented the ability of the crop production system to adapt to environmental change. If CV was close to 0, crop production was considered stable. Conversely, high CV indicated high inter-annual variability of yield. A box plot was used to intuitively demonstrate the discrete level of yield data. The differences between means under baseline and CC scenarios were tested using a one-way ANOVA (P < 0·05).
RESULTS
The performance of the APSIM model
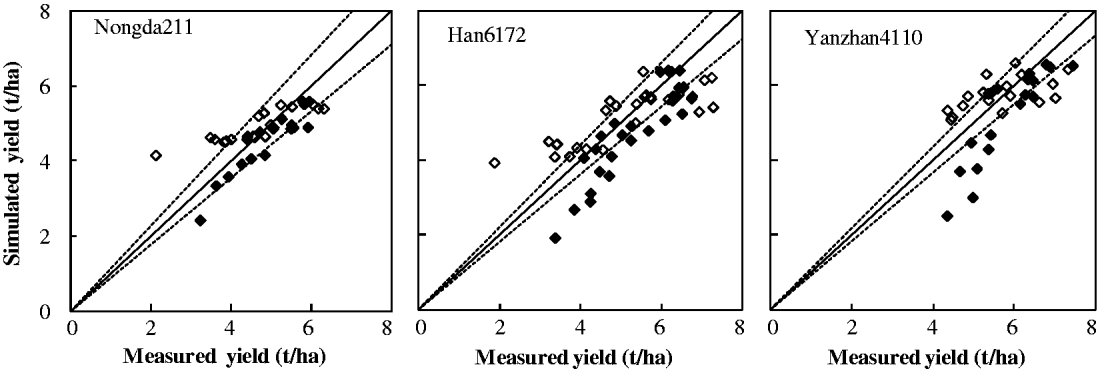
A comparison of simulated and observed yields for Nongda211, Han6172 and Yanzhan4110 based on different climate conditions and agronomical managements is shown in Fig. 2. In general, most of the simulated values fell within or close to the 1 : 1±s.d. lines. The P(t*) ranged from 0·07 to 0·41 over all treatments for the three cultivars, indicating the simulated and measured mean values were statistically the same. The simulation of yield was not underestimated in calibration but it was slightly underestimated (0·4–0·6 t/ha) in validation. Despite this deviation, the RMSEa ranged from 0·5 to 0·9 t/ha for the three cultivars, implying that the model simulated reasonably well in the reproducibility of results. The d index of agreement ranged from 0·73 for Yanzhan4110 to 0·83 for Han6172 in calibration and from 0·80 for Yanzhan4110 to 0·89 for Nongda211 in validation, indicating its good performance.
Measured and simulated wheat yields in the independent calibration (open symbols) and validation (filled symbols) results for three cultivars. The solid lines are the 1 : 1 relationship; the dotted lines are plus and minus standard deviation of measurements around the 1 : 1 relationship.
Climate projections during the wheat growth season
The average CC projections for the 2080s at the three sites are given in Table 1. Compared with the baseline climate conditions, there was a downward shift in global radiation (not significant), but a significant (P < 0·05) upward shift in precipitation and temperature during the wheat growing season (October–May).
During the period 1961–90, the mean maximum temperature generally ranged from 12·3 to 15·0 °C (with the lowest value at the northern site) and the mean minimum temperature ranged from 1·1 to 4·3 °C (with the highest value at the southern site) in the NCP. During the period 2071–2100, the mean maximum temperature increased by c. 3·7 °C under Scenario A2 and by 2·6 °C under B2 at all three sites relative to 1961–90. The increases of mean minimum temperature in the future scenarios were greater than those of the mean maximum temperature for the three sites. The increases of mean minimum temperature generally increased from south to north. The increase of mean minimum temperature was 3·9 °C under A2 and 2·8 °C under B2 at HFQ, 4·6 and 3·2 °C at QZ, and 4·5 and 3·5 °C at SZ, respectively. Global radiation decreased by c. 1% under A2 and 3% under B2 at HFQ and 6 and 7% at both QZ and SZ, respectively. Precipitation increased by 20% at HFQ, 72% at SZ under A2, 5% at HFQ and 56% at SZ under B2, respectively.
Yield of different cultivars under the baseline condition
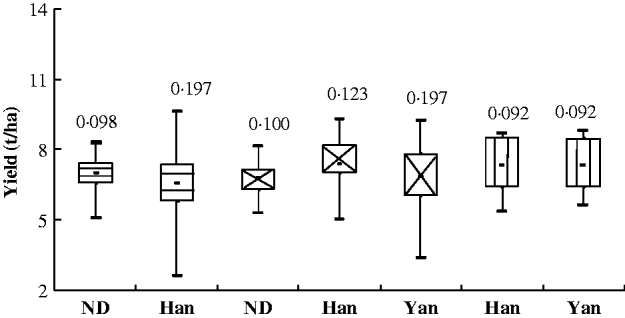
Figure 3 presents the simulated yield under the baseline conditions from Expt 1. At SZ, the mean simulated yield was 7·0 t/ha with a CV of 10% for Nongda211 (local cultivar). A decrease of 6% in the mean yield and a considerable increase of 101% in the CV were simulated for Han6172 relative to Nongda211. The low-yield range (0–25% of total yield interval) was obvious for Han6172, ranging from 2·6 to 5·8 t/ha. However, the low-yield only ranged from 5·1 to 6·6 t/ha for Nongda211. At QZ, a better result was obtained for Han6172, with a mean yield of 7·4 t/ha and CV of 12·3%. The yields for Yanzhan4110 and Nongda211 decreased significantly, both by 8% relative to Han6172, respectively. The CV for Yanzhan4110 increased markedly by 60% and the low-yield range, from 3·4 to 6·1 t/ha, was large relative to that of Han6172.
Simulated yields for baseline climate periods of 1961–90 at Shangzhuang (horizontal lines in boxes) and Quzhou (cross lines in boxes) and of 1980–90 at Huangfanqu (vertical lines in boxes). The box plots show the 0, 25, 75 and 100 percentile yields. The dots represent the mean yield. Numbers above box plots are CV. ND: Nongda211; Han: Han6172; Yan: Yanzhan4110.
Due to the recent rise in temperature, the cultivar types have changed from strong winter type in 1950s to winter type in 1960s, to semi-winter type in 1970s and 1980s and, now, to weak-winter type in the south of NCP (Li et al. Reference Li, Wang, Zhao and Cao2001, Reference Li, Wang, Zhong, Wang, Su, Zhao, Yan, Kiribuchi-Otobe and Yoshida2005). Therefore, the simulated yield from 1980 to 1990 better represented the wheat production under baseline at HFQ. The average yield was 7·4 t/ha with a CV of 9·2% for both Han6172 and Yanzhan4110.
CC impacts on growth of local cultivars
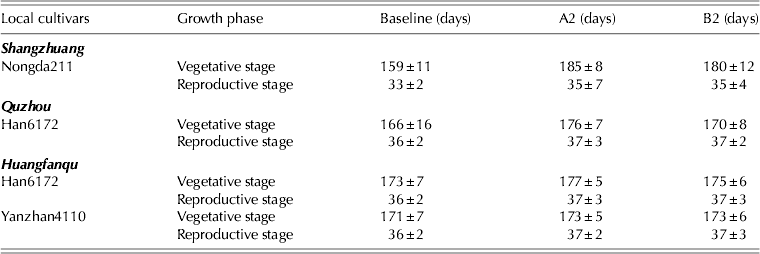
Table 3 shows the length of vegetative (pre-flowering) and reproductive (post-flowering) periods of local cultivars under baseline and CC conditions. The duration of the growth cycle from sowing to maturity increased under CC at all three sites; this was mainly attributed to a prolonged vegetative phase. The increase in duration of the vegetative phase ranged from 2 days at HFQ to 26 days at SZ under A2 and from 2 days at HFQ to 21 days at SZ under B2. The increase of the vegetative phase was larger in the north than in the south and also under the A2 scenario than under B2. The length of the post-flowering phase remained stable.
Average length of vegetative and reproductive periods of local wheat cultivars (± s.d.) in baseline and future scenarios at Shangzhuang, Quzhou and Huangfanqu
The reduction of vernalization days due to an obvious increase in temperature during the winter months caused an increase in the duration of the vegetative phase of the simulated local cultivars. The accumulated vernalization days for the simulated sowing dates ranged from 75·0 under the baseline to 71·8 under A2 and 72·3 under B2 at SZ. Similarly, the accumulated days at QZ decreased from 72·6 to 70·4 under A2 and to 71·2 under B2, respectively. At HFQ, the accumulated vernalization days ranged from 72·0 to 70·4 under A2 and to 70·9 under B2, respectively. The vernalization days were increased from sites in the south to the north under both baseline and CC conditions. But differences between the number of vernalization days of different sites under CC were small relative to differences under the present climate.
CC impacts on yield of local cultivars
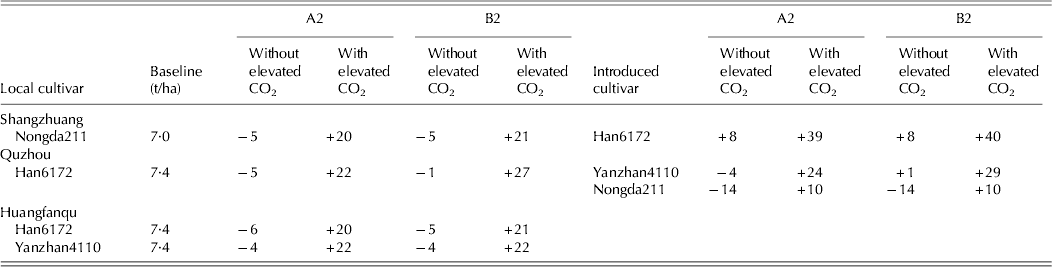
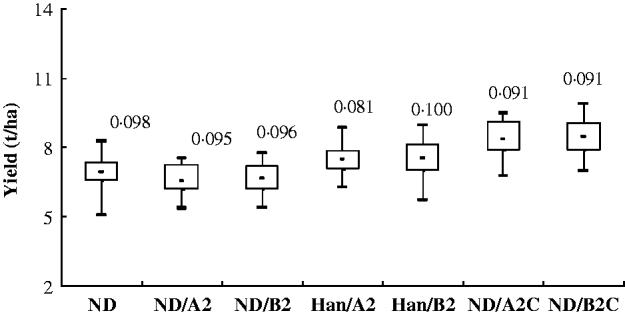
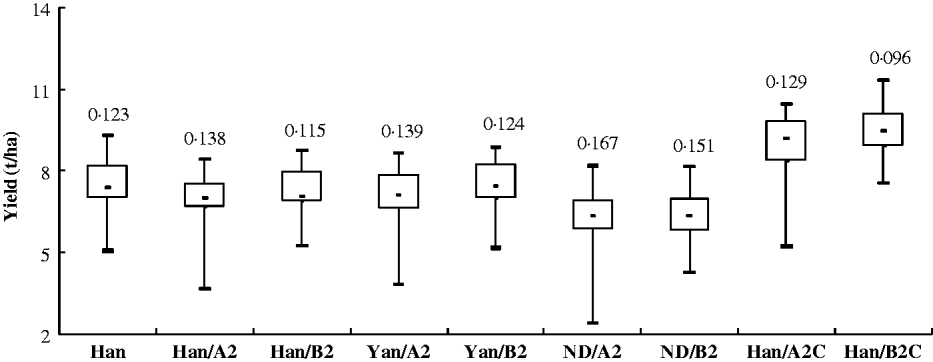
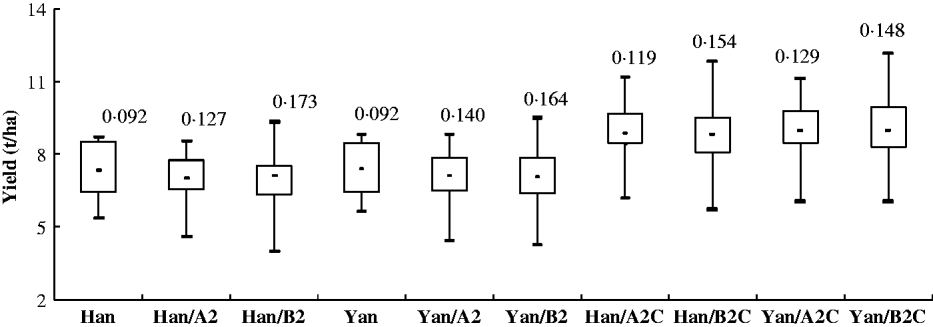
Results of simulated yield from Expt 2 which refer to the baseline and climate scenarios either without or with the effects of elevated CO2 concentrations are presented in Figs 4–6 and Table 4.
Relative yield changes (% of baseline) for different wheat cultivars with and without elevated CO2 in the future scenarios A2 and B2 at Shangzhuang, Quzhou and Huangfanqu
When elevated CO2 concentrations were ignored, CC resulted in a significant reduction in the mean yield at the three sites, and substantial increase in CV at QZ and HFQ. At SZ, the mean yield for Nongda211 diminished by 5% under both A2 and B2, although the CV dropped marginally. At QZ, the mean yield for Han6172 was reduced by 5% and the CV increased by 14% under A2 relative to the baseline. The yield and CV were both slightly reduced by 1 and 6% under B2, respectively. At HFQ, the loss of yield was c. 5% (P < 0·05) for Han6172 and 4% for Yanzhan4110. The CV for both cultivars increased by c. 45 and 83% under A2 and B2 with respect to the baseline.
When elevated CO2 concentrations were considered, evidently favourable CC effects on wheat yield were projected from Expt 2, increasing the mean yield by c. 22% across all three sites. The increase in the minimum yield ranged from 3% at QZ to 33% at SZ under A2 and from 7% at HFQ to 47% at QZ under B2, relative to the baseline. The yield stability improved slightly at SZ, but was clearly reduced at HFQ.
On the whole, the differences in yield between A2 and B2 were small (<4%) either without or including CO2 fertilization, and a slightly higher yield was obtained under B2 than under A2.
The adaptation of changing wheat cultivars
The results of Expt 2 indicated that the negative impacts of CC were striking, when elevated CO2 concentrations were ignored. For increasing yield, the yield performance of changing wheat cultivar types under future climate scenarios were analysed (Table 4). At SZ, the mean wheat yield increased by c. 8% under both A2 and B2 when Han6172 was used, which was significantly (P < 0·05) higher than the current production (7·0 t/ha). Yield stability improved by 17% under A2 and decreased by 4% under B2 (Fig. 4), and the corresponding minimum yield improved by 24 and 12%, respectively, in comparison with the current level. At QZ, the yield was not changed significantly when Yanzhan4110 was used, although it was reduced by 4% under A2 and increased by 1% under B2 with respect to the baseline yield level of 7·4 t/ha. The CV for Yanzhan4110 represented a slight increase relative to that under the baseline (Fig. 5). Compared with the obvious reduction in the yield for Han6172 (typical local cultivar), the yield for Yanzhan110 was high in the future climate scenarios. In contrast, the reductions in the mean yield and yield stability were significant for Nongda211 under future CC projections. The loss in yield for Nongda211 was c. 14% and that in yield stability was >23% with respect to the baseline. At HFQ, a higher yield was obtained for cultivar Yanzhan4110 than for Han6172 under CC scenarios, although both of them had a decreased yield relative to the baseline.
Simulated yields for the typical local variety Nongda211 (ND) and introduced variety Han6172 (Han) under baseline and future scenarios without and with (C) elevated CO2 at Shangzhuang. The box plots show the 0, 25, 75 and 100 percentile yields. The dots represent the mean yield. Numbers above box plots are CV.
Simulated yields for the typical local variety Han6172 (Han) and introduced varieties Yanzhan4110 (Yan) and Nongda211(ND) under baseline and future scenarios without and with (C) elevated CO2 at Quzhou. The box plots show the 0, 25, 75 and 100 percentile yields. The dots represent the mean yield. Numbers above box plots are CV.
Although positive impacts of CC with elevated CO2 on yield were shown from Expt 2, it was found that the introduction of an optimal cultivar could further increase yield relative to current locally grown cultivars at SZ and QZ (Table 4). Compared with local cultivars under CC, yields were increased by c. 16 and 2% when Han6172 was introduced at SZ and Yanzhan4110 was introduced at QZ, respectively. However, when Nongda211 was introduced at QZ, the mean yield was far below the local cultivar under CC.
DISCUSSION
In the present study, based on a series of simulation outputs, the results revealed that the change in wheat yield was quite different geographically, depending on climate and cultivar properties. Without considering the contribution of cultivar change and the fertilizer effect of elevated CO2, climate warming led to negative impacts on wheat yield in the NCP.
Phenological development is the most important attribute of crop adaptation and long-term changes in phenology provide strong evidence of the biological impact of warmer climates on both agricultural and natural ecosystems (Anderson et al. Reference Anderson, Smith and Mcwilliam1978; Thaler et al. Reference Thaler, Eitzinger, Trnka and Dubrovsky2012). Winter wheat shows a strong response to and even an obligate requirement for vernalization (a cold period that promotes floral induction). If vernalization is incomplete, the growth stage of emergence to terminal spikelet is prolonged in the spring and terminal spikelet formation is delayed (Jones et al. Reference Jones, Ritchie, Kiniry, Godwin, Otter and Kumble1983). In the present study, the main mechanisms controlling the simulated wheat response to higher temperatures were direct and indirect effects on wheat growth, such as vernalization, growing period and photosynthesis. Winter wheat stopped growing when the temperature fell below 0 °C during the winter months and grew again in response to rising temperatures in spring. Therefore, CC increased the length of the vegetative growth phase (days of mean temperature above 0 °C) of local cultivars through reduced vernalization. Inadequate vernalization for typical local wheat cultivars resulted in low flower bud initiation and ultimately in reduced yields (Parry et al. Reference Parry, Rosenzweig and Livermore2005). Simulated grain production under CC conditions was characterized by larger year-to-year variations than under the present climate.
As growth and developmental phases of wheat are controlled by temperature effects on vernalization (Rosenzweig & Tubiello Reference Rosenzweig and Tubiello1996; Sacks et al. Reference Sacks, Deryng, Foley and Ramankutty2010), possible adaptation to the future warmer climatic conditions explored in the present study was a shift in the wheat cultivars with different vernalization requirements. The simulation showed that cultivars with relatively lower vernalization requirements would be better adapted to the future warmer climates. At SZ, the introduced cultivar Han6172 with a lower vernalization requirement than local cultivar Nongda211 successfully counterbalanced the projected negative impacts of CC. At QZ, the introduced cultivar Yanzhan4110 with a lower vernalization requirement than local cultivar Han6172 could maintain yield at a relatively high level under CC. At HFQ, the local cultivar Yanzhan4110 with a lower vernalization requirement could better adapt to warmer climates relative to the local cultivar Han6172. Tubiello et al. (Reference Tubiello, Rosenzweig, Goldberg, Jagtap and Jones2002) also confirmed a southern-grown winter wheat cultivar, requiring lower vernalization, helped to counterbalance projected yield decreases at North Platte, NE, USA. Additionally, temperature increase reduced the risk of frost damage, which might also provide an opportunity for introducing wheat cultivars with lower vernalization requirement from a warmer place (Qian & Lin Reference Qian and Lin2004; Song et al. Reference Song, Chen and Dong2006). However, introducing cultivars with a lower vernalization requirement might not necessarily improve yield stability: at SZ and QZ, the simulated increase in mean yield was associated with a larger CV. Certainly, introducing cultivar types with lower vernalization requirements from warmer to cooler climates are not viable under the present climate; this would increase markedly the inter-annual variability of yield and risk of low yield. Generally, cultivars currently grown in a warmer climate were more vulnerable to the effect of frost damage in late winter and early spring than those grown in a cooler climate. As vernalization days were limited at QZ, introducing wheat cultivar Nongda211 with higher vernalization requirements from a cooler climate made it difficult to obtain full vernalization under both baseline and CC conditions, leading to reduced yields.
Simulations with elevated CO2 indicated that the negative effect of temperature rise on wheat yield for local typical cultivars could be clearly offset by CO2 fertilization. These results are consistent with other studies investigating potential effects of CC in the NCP (Guo et al. Reference Guo, Lin, Mo and Yang2010; Liu et al. Reference Liu, Mo, Lin, Xu, Ji, Wen and Richey2010). This positive response became even stronger when cultivar replacements were accounted for.
The APSIM-Wheat model was examined based on the data from experiments with the interaction of representative wheat cultivars and locations in the NCP. The model could reasonably reflect wheat cultivars with discrepant vernalization requirements and the effect of the environment. However, it was not easy to capture differences among cultivar types and the relationship of crop and environment factors completely. Firstly, the ‘effectiveness’ of temperatures for vernalization was different in the literature (Chujo Reference Chujo1966; Weir et al. Reference Weir, Bragg, Porter and Rayner1984; Craigon et al. Reference Craigon, Atherton and Sweet1995) and for cultivar types (Feng et al. Reference Feng, Gao, Jin and Ma1997). Therefore, the response of vernalization to temperature is still a matter of debate (Brooking & Jamieson Reference Brooking and Jamieson2002). Secondly, the fixed thermal time for each of the phases before anthesis was used in the model. This approach made the accuracy of the prediction of time of anthesis dependent on the accurate calculation of previous stages, because it needed to be calculated by the cumulative stage-upon-stage (error-upon-error) approach (Stapper & Lilley Reference Stapper, Lilley, Rowe and Mendham2001). In addition, the correlation of death rate of green leaves with daily minimum temperature during winter and spring periods for different cultivars was not sufficiently accurate, which might contribute to the simulation error of leaf area and leaf dry matter.
In conclusion, an observed significant warming trend has become pronounced since the 1980s in China (Tao et al. Reference Tao, Yokozawa, Xu, Hayashi and Zhang2006) and is projected to accelerate in the future. The negative impact of such change on crop production has been well predicted (Xiong et al. Reference Xiong, Conway, Lin, Xu, Ju, Jiang, Holman and Li2009). Exploring adaptation strategies in agronomic management is the ultimate purpose for future food security. In future warmer climates, especially in the winter, wheat cultivars that require lower vernalization should be considered as an adaptation in the NCP, and would be a functional and efficient strategy for similar regions around the world. It is also essential to consider the availability of resources such as irrigation and fertilizers. In fact, non-limiting water and fertilizer supply were undesirable in crop production in terms of water shortage and environmental considerations.
Simulated yields for the typical local varieties Han6172 (Han) and Yanzhan4110 (Yan) under baseline and future scenarios without and with (C) elevated CO2 at Huangfanqu. The box plots show the 0, 25, 75 and 100 percentile yields. The dots represent the mean yield. Numbers above box plots are CV.
This work was supported by the Special Research Fund for Meteorology of China (Grant No. GYHY200906022), National Science Foundation of China (41101046), National Basic Research Program of China (Grant No. 2009CB118608) and National Science and Technology Support Program of China (Grant No. 2007BAC03A02).