1 Introduction
In steady-state evolution, the propagation of a detonation in a condensed-phase (or high) explosive is controlled by energy release that occurs in a structure known as the detonation driving zone (DDZ). In a frame travelling with the steady detonation shock, the DDZ is defined as the region between the shock and the following sonic locus. The sonic locus isolates the part of the detonation front within the DDZ from the flow dynamics occurring elsewhere in the field. A recent description of the role played by the DDZ in detonation propagation was given by Short et al. (Reference Short, Quirk, Meyer and Chiquete2016). The structure of the DDZ is influenced by several factors, including the properties of materials surrounding the explosive and the explosive geometry. In this paper, we explore the dynamics of steady detonation propagation in a two-dimensional (2D) circular arc. As noted in Short et al. (Reference Short, Quirk, Meyer and Chiquete2016), the arc is an important case for understanding the effects of geometry on the compressible-reactive flow mechanisms of detonation propagation, as it includes elements of shock diffraction and flow divergence (Bdzil, Fickett & Stewart Reference Bdzil, Fickett and Stewart1989), along with a range of boundary interactions depending on the inner and outer arc radii and the degree of confinement on the arc surfaces. The full combination of these elements is not present in simpler geometries such as the 2D axisymmetric cylindrical rate stick or 2D planar slab (Jackson & Short Reference Jackson and Short2015). Examples where detonation diffraction is important include detonation corner turning due to explosive geometry changes (Kapila et al. Reference Kapila, Schwendeman, Bdzil and Henshaw2007) and detonation propagation over inert obstacles (Lieberthal, Bdzil & Stewart Reference Lieberthal, Bdzil and Stewart2014).
The circular arc configuration has been studied previously both in condensed- and gas-phase explosive systems. The speed of a detonation and its front shape in an unconfined circular arc of the insensitive high explosive PBX 9502 (95 wt% TATB (2,4,6-triamino-1,3,5-trinitrobenzene)/5 wt% Kel-F 800 (poly(chlorotrifluoroethylene-co-vinylidene fluoride))) have been experimentally measured and reported in Bdzil et al. (Reference Bdzil, Aslam, Henninger and Quirk2003). Similarly, the angular speeds of detonation in circular arcs of a polymer-bonded TATB explosive, confined on both the inner and outer arcs either by PMMA (acrylic) or by steel, have been described by Lubyatinsky et al. (Reference Lubyatinsky, Batalov, Garmashev, Israelyan, Kostitsyn, Loboiko, Pashentsev, Sibilev, Smirnov, Filin, Furnish, Gupta and Forbes2003). The speed of detonation propagation in a TATB-based explosive arc confined by steel was reported by Zhao et al. (Reference Zhao, Li, Zhao, Sun, Han, He and Gao1998). Reactive burn simulations of the confined circular arc test geometries used by Lubyatinsky et al. (Reference Lubyatinsky, Batalov, Garmashev, Israelyan, Kostitsyn, Loboiko, Pashentsev, Sibilev, Smirnov, Filin, Furnish, Gupta and Forbes2003) were conducted by Tarver & Chidester (Reference Tarver, Chidester, Elert, Furnish, Chau, Holmes and Nguyen2007). Bdzil et al. (Reference Bdzil, Fickett and Stewart1989) presented an example of a Detonation Shock Dynamics (DSD) model simulation of detonation propagation in a circular arc geometry. Aslam & Stewart (Reference Aslam and Stewart1999) compared the timing from a DSD model containing surface acceleration terms to a curvature-dependent DSD model in a 2D circular arc geometry with perfect confinement on both inner and outer arc radii. In gaseous explosives, interest in detonation propagation in circular geometries has grown significantly due to the relevance of the geometry to the performance of rotating detonation engines (Kailasanath Reference Kailasanath2017). For instance, the propagation of gaseous detonation in a perfectly confined circular arc geometry with a narrow rectangular cross-section has been examined experimentally by Nakayama et al. (Reference Nakayama, Moriya, Kasahara, Matsuo, Sasamoto and Funaki2012, Reference Nakayama, Kasahara, Matsuo and Funaki2013) for a variety of inner arc radii.
The current paper is a follow up to an earlier paper by Short et al. (Reference Short, Quirk, Meyer and Chiquete2016) in which the properties of steady detonation propagation in a circular arc geometry were explored asymptotically through a DSD model. The DSD model assumes the motion of the detonation can be represented by a surface relation that relates the normal surface speed to its local curvature (Bdzil & Stewart Reference Bdzil and Stewart2007). It is able to account for the presence of confinement by constraining the shape of the surface at the high-explosive (HE)/confiner boundary (Bdzil & Stewart Reference Bdzil, Stewart and Zhang2011). The analysis in Short et al. (Reference Short, Quirk, Meyer and Chiquete2016) assumed a linear normal speed (
 $D_{n}$
) – curvature
 $(\unicode[STIX]{x1D705})$
law,
 $D_{n}=D_{CJ}(1-B\unicode[STIX]{x1D705})$
, for the surface motion, where
 $B$
is a length-scale representative of a reaction zone thickness and
 $D_{CJ}$
is the Chapman–Jouguet detonation speed. By assuming the ratio
 $\unicode[STIX]{x1D716}=B/R_{i}\ll 1$
, i.e. for a large inner arc radius
 $(R_{i})$
and/or small reaction zone size, analytical expressions were derived for the angular speed of the surface and its shape as it sweeps around the arc as a function of the magnitude of confinement and arc thickness. For sufficiently narrow arcs, defined by
 $R_{e}/R_{i}-1=O(\unicode[STIX]{x1D716})$
, where
 $R_{e}$
is the outer arc radius, the leading-order angular speed of the steady propagating detonation surface was found to depend on the inner arc radius, the arc thickness, and the magnitude of confinement on the inner and outer arc surfaces.
For sufficiently thick arcs, defined by
 $R_{e}/R_{i}-1=O(1)$
, the leading-order construction of the DSD surface is found to correspond to a Huygens surface wave propagation with angular speed
 $D_{CJ}/R_{i}$
, assuming perfect confinement on the inner arc surface. Curvature dependency of the surface motion is found to become important in a boundary layer near the inner arc surface. The boundary layer structure depends on the magnitude of the confinement on the inner arc. For strong confinement, i.e. when the angle between the normal to the DSD surface and the inner arc surface is
 $O(\unicode[STIX]{x1D716}^{1/3})$
, there is a boundary layer of extent
 $O(\unicode[STIX]{x1D716}^{2/3})$
situated at the inner arc surface. This results in an
 $O(\unicode[STIX]{x1D716}^{2/3})$
correction to the leading order angular speed of the wave
 $(D_{CJ}/R_{i})$
which accounts simultaneously both for the curvature influence of surface motion and the strong confinement on the inner arc boundary. For weak confinement, i.e. when the angle between the normal to the DSD surface and the inner arc surface is
 $O(1)$
, a triple deck structure appears on the inner arc surface. In order to meet the weak confinement conditions on the inner arc, a layer of radial size
 $O(\unicode[STIX]{x1D716})$
has to be inserted between the previously described layer of radial size
 $O(\unicode[STIX]{x1D716}^{2/3})$
and the inner arc boundary. Two correction terms to the angular speed appear, the first of size
 $O(\unicode[STIX]{x1D716}^{2/3})$
which accounts solely for the curvature dependency of the surface motion, and the second of size
 $O(\unicode[STIX]{x1D716})$
in which the weak confinement on the inner arc boundary influences the angular speed. In either the strong or weak confinement cases, the magnitude of the outer arc radius and confinement do not affect the surface angular speed to the order calculated. Thus, in a sufficiently thick arc, with
 $B/R_{i}\ll 1$
, the dynamics of detonation propagation are controlled by a narrow boundary layer at the inner arc surface in which the curvature dependency of the surface motion is important.
The DSD model examined by Short et al. (Reference Short, Quirk, Meyer and Chiquete2016) is a surface evolution model that collapses the detonation reaction zone and shock complex to a surface. The aim of the current paper is to explore the effect of a finite-length detonation reaction zone on the properties of steady detonation propagation in a 2D circular arc. This is achieved using computations based on a reactive burn model. We limit our attention in the current article to a fixed inner arc radius and a low impedance confiner surrounding the inner arc surface. We then study the variations in the DDZ structure and angular speed of the detonation wave as a function of arc thickness and confinement surrounding the outer arc surface. A pattern of complex flow structures is found to occur, the details of which are examined in subsequent sections.
2 Model
2.1 Arc geometry and flow models
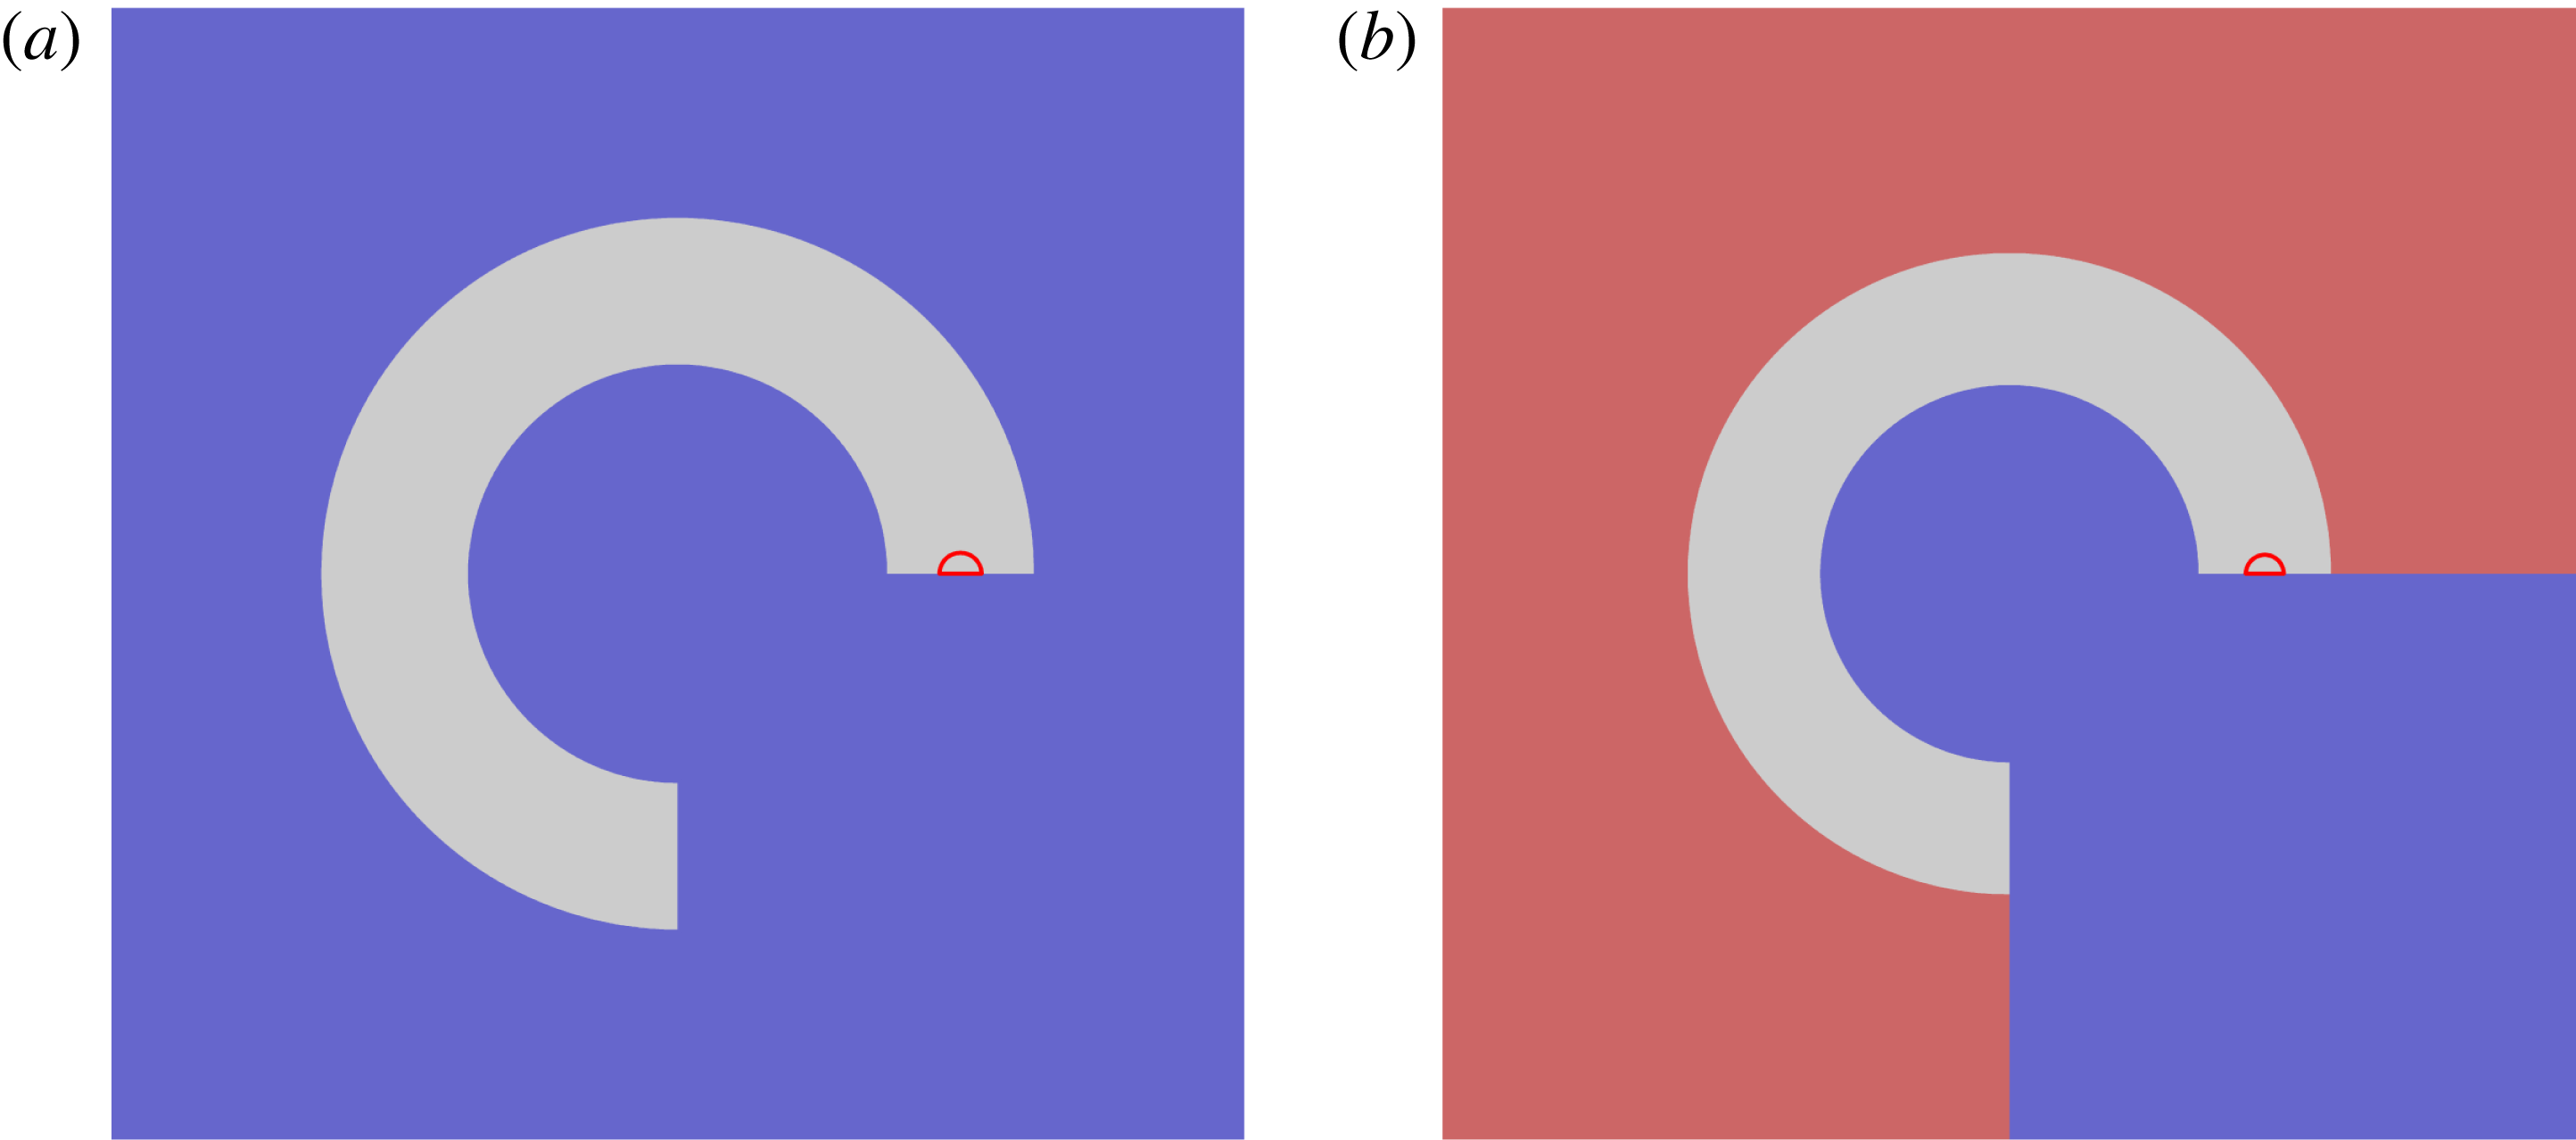
The circular HE arc configurations under study are shown in figure 1. In both cases, the HE region (shown in grey) extends from
 $0\leqslant \unicode[STIX]{x1D703}\leqslant 3\unicode[STIX]{x03C0}/2$
in polar coordinates
 $(r,\unicode[STIX]{x1D703})$
. The inner radius of the HE arc is
 $R_{i}$
(based on the reference length scale defined in § 2.3), while its outer radius is
 $R_{e}$
. In (a), the HE arc is surrounded everywhere by a low impedance confiner (LIC), shown as the blue area, whose material properties are defined in § 2.4. In (b), the outer surface of the HE arc is surrounded by a high impedance confiner (HIC), shown as the red region, whose material properties are again defined in § 2.4, while the inner surface of the HE arc is surrounded by the LIC material. The total computational region is a square box with sides of length
 $2R_{D}$
, having corners located at
 $(-R_{D},-R_{D})$
,
 $(-R_{D},R_{D})$
,
 $(R_{D},R_{D})$
and
 $(R_{D},-R_{D})$
in Cartesian coordinates. The origin
 $(0,0)$
of the computational domain is the centre of the box.
The circular HE arc configurations under study. In (a), the HE arc, shown as the grey region, is surrounded everywhere by a low impedance confiner (LIC), shown as the blue area. In (b), the outer surface of the HE arc is surrounded by a high impedance confiner (HIC), shown as the red area, while the inner arc is surrounded by the LIC. The detonator region consists of a semi-circle of radius
 $R_{d}$
, centred on
 $(R_{i}+(R_{e}-R_{i})/2,0)$
in polar coordinates, the outer region of which is shown by the red semi-circle.

For the high pressures induced by detonation loading, which are significantly above the yield strength of solid confining materials, both the solid HE and confiner materials will flow (Menikoff & Plohr Reference Menikoff and Plohr1989). Consequently, we can model the flow in the explosive and confiner with the compressible Euler equations, which in dimensional form are
 $$\begin{eqnarray}\frac{\text{D}\tilde{\unicode[STIX]{x1D70C}}}{\text{D}\tilde{t}}+\tilde{\unicode[STIX]{x1D70C}}\tilde{\unicode[STIX]{x1D735}}\boldsymbol{\cdot }\tilde{\boldsymbol{u}}=0,\quad \frac{\text{D}\tilde{\boldsymbol{u}}}{\text{D}\tilde{t}}=-\frac{1}{\tilde{\unicode[STIX]{x1D70C}}}\tilde{\unicode[STIX]{x1D735}}p,\quad \frac{\text{D}\tilde{e}}{\text{D}\tilde{t}}=\frac{\tilde{p}}{\tilde{\unicode[STIX]{x1D70C}}^{2}}\frac{\text{D}\tilde{\unicode[STIX]{x1D70C}}}{\text{D}\tilde{t}},\end{eqnarray}$$
for density
 $\tilde{\unicode[STIX]{x1D70C}}$
, pressure
 $\tilde{p}$
, particle velocity
 $\tilde{\boldsymbol{u}}$
and specific internal energy
 $\tilde{e}$
. The material derivative
 $\text{D}/\text{D}\tilde{t}=\unicode[STIX]{x2202}/\unicode[STIX]{x2202}\tilde{t}+\tilde{\boldsymbol{u}}\boldsymbol{\cdot }\tilde{\unicode[STIX]{x1D735}}$
. At a shock discontinuity, equation (2.1) is supplemented by the Rankine–Hugoniot relations,
 $$\begin{eqnarray}[\tilde{\unicode[STIX]{x1D70C}}(\tilde{\boldsymbol{u}}-\tilde{\boldsymbol{D}})\boldsymbol{\cdot }\tilde{\boldsymbol{n}}]=0,\quad [\tilde{\unicode[STIX]{x1D70C}}\tilde{\boldsymbol{u}}(\tilde{\boldsymbol{u}}-\tilde{\boldsymbol{D}})\boldsymbol{\cdot }\tilde{\boldsymbol{n}}]=-[\tilde{p}\tilde{\boldsymbol{n}}],\quad \tilde{m}[\tilde{e}+{\textstyle \frac{1}{2}}\tilde{\boldsymbol{u}}\boldsymbol{\cdot }\tilde{\boldsymbol{u}}]=-[\tilde{p}(\tilde{\boldsymbol{u}}\boldsymbol{\cdot }\tilde{\boldsymbol{n}})],\end{eqnarray}$$
where
 $\tilde{m}=\tilde{\unicode[STIX]{x1D70C}}(\tilde{\boldsymbol{u}}-\tilde{\boldsymbol{D}})\boldsymbol{\cdot }\tilde{\boldsymbol{n}}$
. The normal shock speed is
 $\tilde{\boldsymbol{D}}\boldsymbol{\cdot }\tilde{\boldsymbol{n}}$
.
2.2 HE detonation model
In the HE arc region, we use a Tait equation-of-state and assume a one-step chemical reaction. The Tait equation-of-state is
 $$\begin{eqnarray}\tilde{e}=\frac{\tilde{p}+\tilde{A}}{(\unicode[STIX]{x1D6FE}-1)\unicode[STIX]{x1D70C}}-\tilde{q}\unicode[STIX]{x1D706},\end{eqnarray}$$
where
 $\unicode[STIX]{x1D6FE}$
is the adiabatic exponent,
 $\tilde{A}$
is the stiffened gas constant and
 $\tilde{q}$
is the specific reaction enthalpy of the fuel species. A review of the properties of the Tait equation-of-state has been given by Menikoff (Reference Menikoff and Horie2007). The frozen sound speed,
 $\tilde{c}_{HE}$
, is given by
 $$\begin{eqnarray}\tilde{c}_{HE}=\sqrt{\frac{(\unicode[STIX]{x1D6FE}\tilde{p}+\tilde{A})}{\tilde{\unicode[STIX]{x1D70C}}}}.\end{eqnarray}$$
Also,
 $\unicode[STIX]{x1D706}$
is the reaction progress variable (
 $0\leqslant \unicode[STIX]{x1D706}\leqslant 1$
), where
 $[\unicode[STIX]{x1D706}]=0$
across a shock. The reaction model is
 $$\begin{eqnarray}\frac{\text{D}\unicode[STIX]{x1D706}}{\text{D}\tilde{t}}=\tilde{r}=\tilde{k}\tilde{p}^{n}(1-\unicode[STIX]{x1D706})^{\unicode[STIX]{x1D708}}.\end{eqnarray}$$
In the strong shock limit employed here, which sets the pressure in the unshocked reactant material to zero,
 $$\begin{eqnarray}\tilde{q}=\frac{\tilde{D}_{CJ}^{2}}{2(\unicode[STIX]{x1D6FE}^{2}-1)}\left(1-\frac{\tilde{A}}{\tilde{\unicode[STIX]{x1D70C}}_{0}\tilde{D}_{CJ}^{2}}\right)^{2},\end{eqnarray}$$
where
 $\tilde{D}_{CJ}$
is the Chapman–Jouguet detonation speed and
 $\tilde{\unicode[STIX]{x1D70C}}_{0}$
is the initial density of the HE. The strong shock limit is a common assumption for high explosive detonation modeling due to the magnitude of the pressure generated in the detonation (Bdzil Reference Bdzil1981).
The pressure-dependent reaction rate form (2.5) is commonly used for condensed-phase detonation modelling, particularly for problems in which the main objective is to elucidate the primary fluid dynamic mechanisms underlying the mechanics of detonation propagation due to a finite-length reaction zone. It can reproduce the basic one-dimensional detonation structure observed experimentally, which consists of a narrow Von Neumann spike characterized by a rapidly decreasing pressure variation behind the shock front, a feature indicative of a high reaction rate at the detonation shock (Gustavsen, Sheffield & Alcon Reference Gustavsen, Sheffield and Alcon1998). The model has been successfully used to capture the primary fluid dynamic mechanisms underlying detonation propagation in problems ranging from confinement effects, stability, reaction zone structure changes due to detonation shock curvature, and geometry changes (Aslam & Bdzil Reference Aslam and Bdzil2002; Sharpe & Braithwaite Reference Sharpe and Braithwaite2005; Short et al. Reference Short, Anguelova, Aslam, Bdzil, Henrick and Sharpe2008; Li, Mi & Higgins Reference Li, Mi and Higgins2015).
2.3 Scaling
In the following, we consider propagation of a detonation in an arc geometry where the scale of the arc dimensions is relative to a detonation reaction zone thickness. It is therefore convenient to consider a suitably scaled problem, where
 $$\begin{eqnarray}\left.\begin{array}{@{}c@{}}\displaystyle \boldsymbol{x}=\frac{\tilde{\boldsymbol{x}}}{\tilde{l}_{1/2}},\quad t=\frac{\tilde{t}}{(\tilde{l}_{1/2}/\tilde{u} _{ref})},\quad \unicode[STIX]{x1D70C}=\frac{\tilde{\unicode[STIX]{x1D70C}}}{\tilde{\unicode[STIX]{x1D70C}}_{ref}},\quad \boldsymbol{u}=\frac{\tilde{\boldsymbol{u}}}{\tilde{u} _{ref}},\quad p=\frac{\tilde{p}}{\tilde{\unicode[STIX]{x1D70C}}_{ref}\tilde{u} _{ref}^{2}},\quad e=\frac{\tilde{e}}{\tilde{u} _{ref}^{2}},\\ \displaystyle q=\frac{\tilde{q}}{\tilde{u} _{ref}^{2}},\quad D_{CJ}=\frac{\tilde{D}_{CJ}}{\tilde{u} _{ref}},\quad A=\frac{\tilde{A}}{\tilde{\unicode[STIX]{x1D70C}}_{ref}\tilde{u} _{ref}^{2}},\quad c=\frac{\tilde{c}}{\tilde{u} _{ref}}.\end{array}\right\}\end{eqnarray}$$
The length scale
 $\tilde{l}_{1/2}$
is the length behind the shock in the steady planar Chapman–Jouguet detonation wave at which half of the reactant has been consumed. With this scaling, we set the HE parameters
 $$\begin{eqnarray}\unicode[STIX]{x1D70C}_{0}=2,\quad A=12.8,\quad D_{CJ}=8,\quad q=3.24.\end{eqnarray}$$
Also, angular speed quantities are scaled with
 $\text{radians}/(\tilde{l}_{1/2}/\tilde{u} _{ref})$
. For a density scale
 $\tilde{\unicode[STIX]{x1D70C}}_{ref}=1~\text{g}~\text{cc}^{-1}$
and velocity scale
 $\tilde{u} _{ref}=1~\text{mm}~\unicode[STIX]{x03BC}\text{s}^{-1}$
, this would be broadly representative of the properties of a conventional or insensitive high explosive, such as PBX 9502 (Short et al.
Reference Short, Anguelova, Aslam, Bdzil, Henrick and Sharpe2008). For a density scale
 $\tilde{\unicode[STIX]{x1D70C}}_{ref}=0.4~\text{g}~\text{cc}^{-1}$
and velocity scale
 $\tilde{u} _{ref}=0.6~\text{mm}~\unicode[STIX]{x03BC}\text{s}^{-1}$
, this would be broadly representative of the properties of a non-ideal high explosive, such as ammonium nitrate fuel oil (ANFO). We also choose the equation-of-state and weakly state-sensitive rate parameters
 $$\begin{eqnarray}\unicode[STIX]{x1D6FE}=3,\quad n=1,\quad \unicode[STIX]{x1D708}=1/2,\end{eqnarray}$$
consistent with the physically observed properties of detonation in HEs (§ 2.2). The scaled rate equation becomes
 $$\begin{eqnarray}\frac{\text{D}\unicode[STIX]{x1D706}}{\text{D}t}=kp(1-\unicode[STIX]{x1D706})^{1/2},\quad k=\tilde{k}\tilde{\unicode[STIX]{x1D70C}}_{0}\tilde{u} _{ref}\tilde{l}_{1/2},\end{eqnarray}$$
where the scaled rate constant
 $k$
is derived from (2.5) with the scaling (2.7). For the parameters defined in (2.8) and (2.9), we find
 $$\begin{eqnarray}k\approx 0.051359.\end{eqnarray}$$
2.4 Confiner model
For the confiner, we use a linear
 $\tilde{U} _{s}-\tilde{u} _{p}$
equation-of-state, which relates the particle velocity
 $\tilde{u} _{p}$
to the shock speed
 $\tilde{U} _{s}$
in the material via
 $$\begin{eqnarray}\tilde{U} _{s}=\tilde{c}+s\tilde{u} _{p},\end{eqnarray}$$
where
 $\tilde{c}$
is the ambient frozen sound speed and
 $s=\text{d}\tilde{U} _{s}/\text{d}\tilde{u} _{p}$
. On the shock Hugoniot,
 $$\begin{eqnarray}\tilde{p}_{sh}=\frac{\tilde{\unicode[STIX]{x1D70C}}_{0}\tilde{c}^{2}(1-\tilde{\unicode[STIX]{x1D70C}_{0}}/\tilde{\unicode[STIX]{x1D70C}})}{[1-s(1-\tilde{\unicode[STIX]{x1D70C}}_{0}/\tilde{\unicode[STIX]{x1D70C}})]^{2}},\quad \tilde{e}_{sh}=\frac{\tilde{c}^{2}(1-\tilde{\unicode[STIX]{x1D70C}}_{0}/\tilde{\unicode[STIX]{x1D70C}})^{2}}{2[1-s(1-\tilde{\unicode[STIX]{x1D70C}}_{0}/\tilde{\unicode[STIX]{x1D70C}})]^{2}}.\end{eqnarray}$$
A Mie–Gruneisen formulation is used to extend the equation-of-state off the shock Hugoniot, where
 $$\begin{eqnarray}\tilde{e}=\tilde{e}_{sh}+\frac{1}{\unicode[STIX]{x1D6E4}_{0}\tilde{\unicode[STIX]{x1D70C}}_{0}}(\tilde{p}-\tilde{p}_{sh}).\end{eqnarray}$$
Here
 $\unicode[STIX]{x1D6E4}_{0}$
is the Gruneisen gamma. The properties of this equation-of-state model have also been reviewed by Menikoff (Reference Menikoff and Horie2007). As noted above, we consider two types of confiner. The first is a LIC material relative to the HE material properties, where, with the scaling (2.7), we take
 $$\begin{eqnarray}\unicode[STIX]{x1D70C}_{0}=0.84,\quad c=1.127,\quad s=1.2,\quad \unicode[STIX]{x1D6E4}_{0}=1.5.\end{eqnarray}$$
For
 $\tilde{\unicode[STIX]{x1D70C}}_{ref}=1~\text{g}~\text{cc}^{-1}$
and
 $\tilde{u} _{ref}=1~\text{mm}~\unicode[STIX]{x03BC}\text{s}^{-1}$
, this would be representative of the properties of a low density silicone elastomer (Marsh Reference Marsh1980). The second is a HIC material, where we take
 $$\begin{eqnarray}\unicode[STIX]{x1D70C}_{0}=7.926,\quad c=4.48,\quad s=1.51,\quad \unicode[STIX]{x1D6E4}_{0}=2.18.\end{eqnarray}$$
For
 $\tilde{\unicode[STIX]{x1D70C}}_{ref}=1~\text{g}~\text{cc}^{-1}$
and
 $\tilde{u} _{ref}=1~\text{mm}~\unicode[STIX]{x03BC}\text{s}^{-1}$
, this would be representative of the properties of stainless steel (Marsh Reference Marsh1980).
2.5 ZND detonation structure and stability
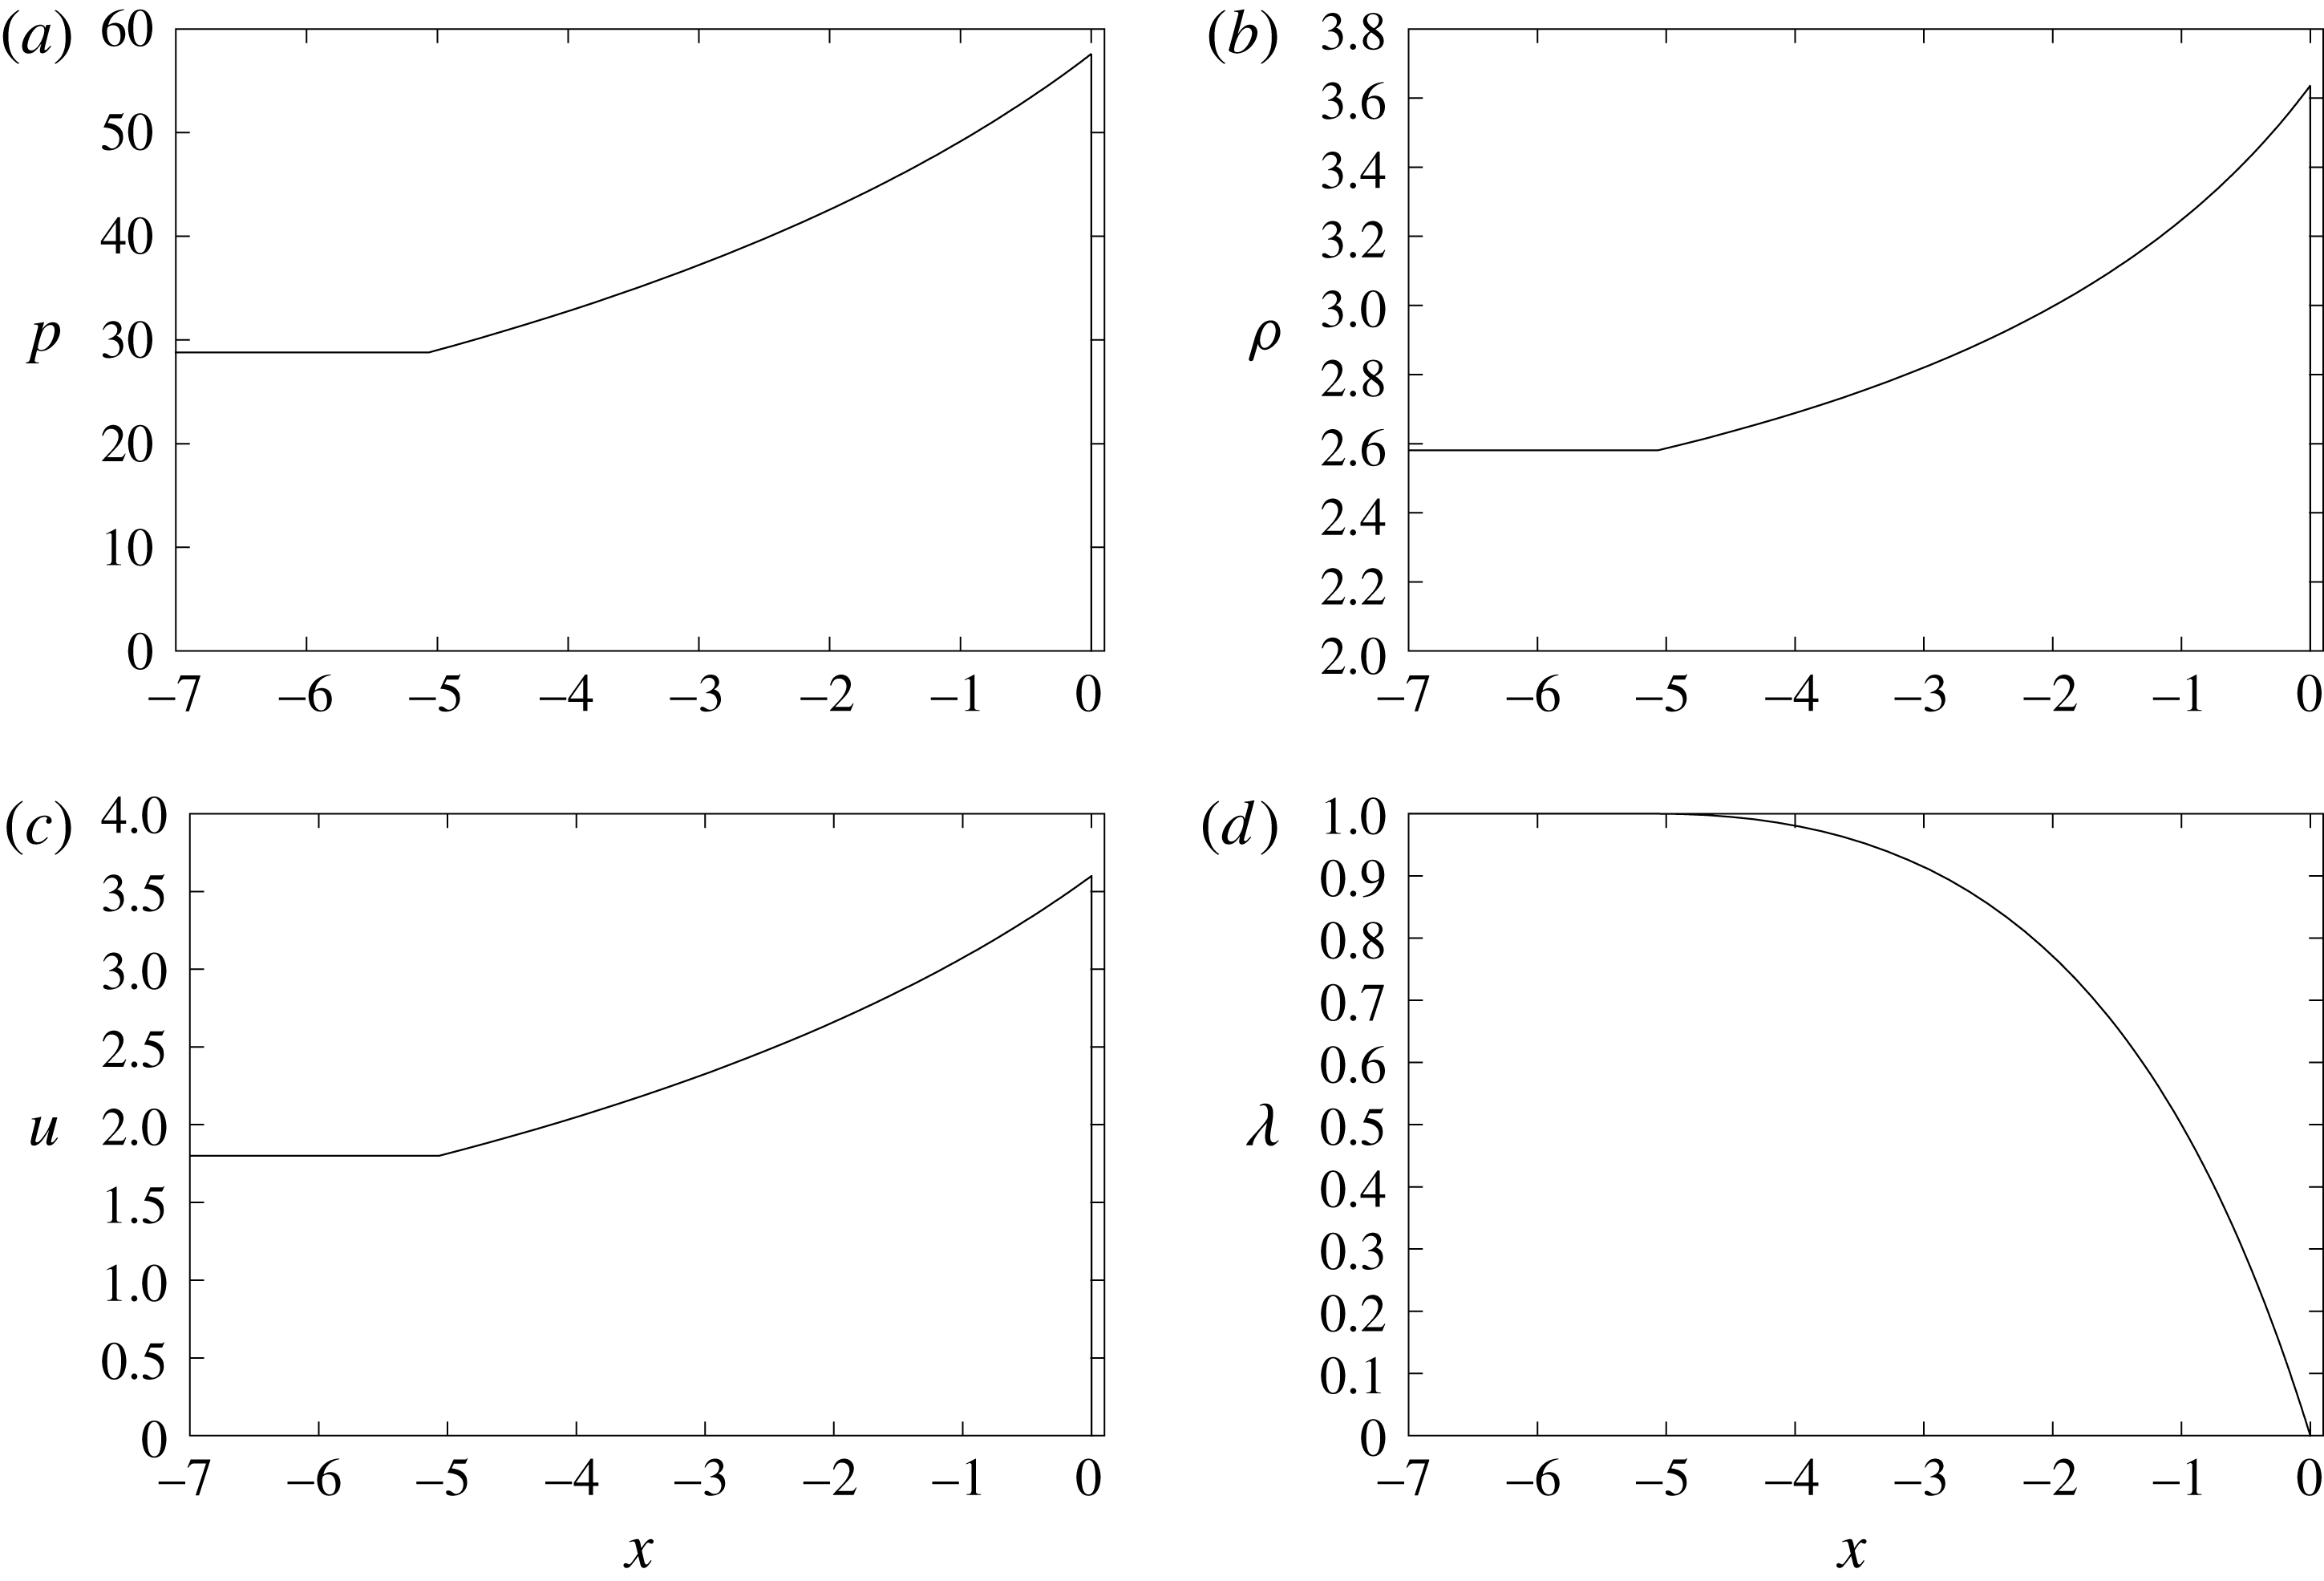
Figure 2 shows the structure of a supported, one-dimensional, steady Zeldovich–von Neumann–Döring (ZND) wave propagating at the Chapman–Jouguet (CJ) speed for the HE model and parameters listed in §§ 2.2 and 2.3. With the scalings defined in § 2.3, the distance behind the detonation shock to where
 $\unicode[STIX]{x1D706}=1/2$
is one. The Chapman–Jouguet state for
 $\unicode[STIX]{x1D706}=1$
is given by
 $$\begin{eqnarray}\left.\begin{array}{@{}c@{}}\displaystyle p_{CJ}=\frac{\unicode[STIX]{x1D70C}_{0}D_{CJ}^{2}}{(\unicode[STIX]{x1D6FE}+1)}\left(1-\frac{A}{\unicode[STIX]{x1D70C}_{0}D_{CJ}^{2}}\right),\quad \unicode[STIX]{x1D70C}_{CJ}=\unicode[STIX]{x1D70C}_{0}\left[\frac{1}{(\unicode[STIX]{x1D6FE}+1)}\left(\unicode[STIX]{x1D6FE}+\frac{A}{\unicode[STIX]{x1D70C}_{0}D_{CJ}^{2}}\right)\right]^{-1},\\ \displaystyle u_{CJ}=\frac{D_{CJ}}{(\unicode[STIX]{x1D6FE}+1)}\left(1-\frac{A}{\unicode[STIX]{x1D70C}_{0}D_{CJ}^{2}}\right).\end{array}\right\}\end{eqnarray}$$
The linear stability of a steady ZND detonation wave with the equation-of-state and rate models given by (2.3) and (2.5) have been studied by Short, Bdzil & Anguelova (Reference Short, Bdzil and Anguelova2006) and Short et al. (Reference Short, Anguelova, Aslam, Bdzil, Henrick and Sharpe2008) for a general stiffened gas constant
 $A$
 $(=\tilde{A}/\tilde{\unicode[STIX]{x1D70C}}_{ref}\tilde{u} _{ref}^{2})$
. For
 $A=0$
and
 $\unicode[STIX]{x1D708}=1/2$
, CJ detonations are unstable to sinusoidal 2D disturbances for a rate sensitivity parameter
 $n>2.168$
. For
 $A=12.8$
and
 $\unicode[STIX]{x1D708}=1/2$
, CJ detonations are unstable to 2D disturbances for
 $n>2.552$
. Thus, for the rate sensitivity choice in (2.9) of
 $n=1$
, we project stable detonation fronts in our circular arc geometry simulations.

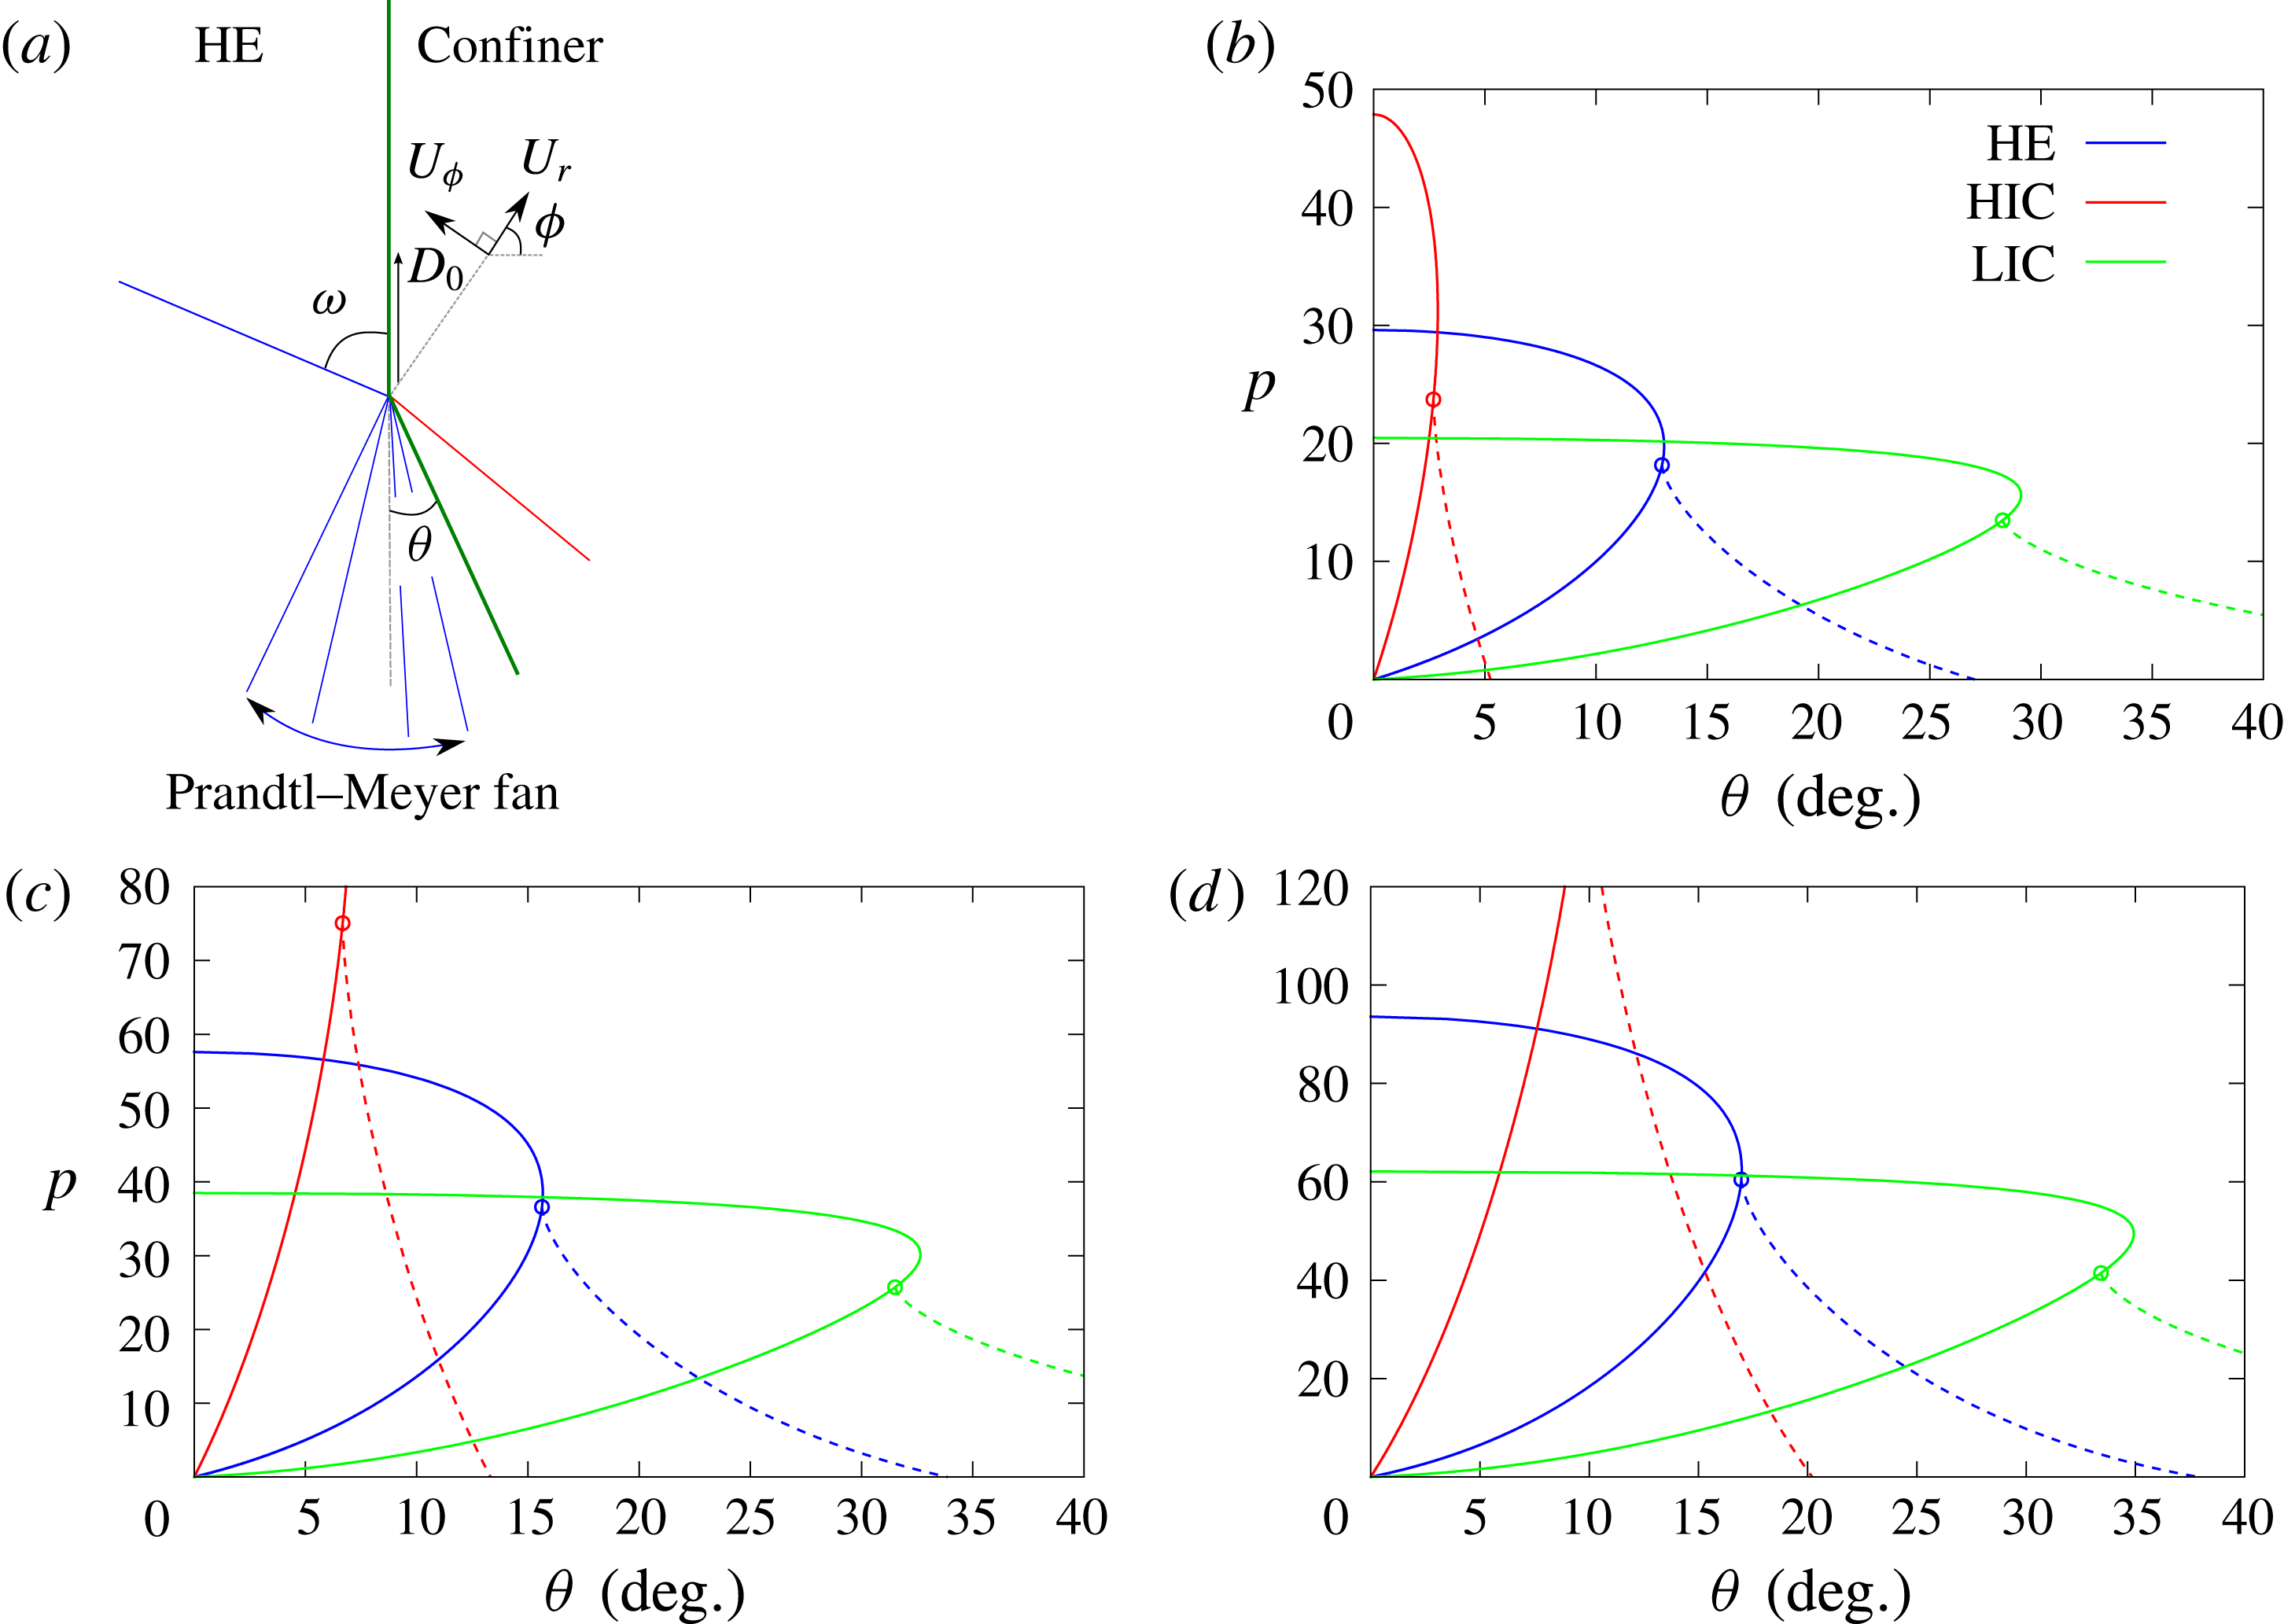
Oblique wave polar analysis for HE and HIC or LIC material interactions showing pressure variation with streamline turning angle. A schematic of two common interaction scenarios is shown in (a). The polar diagram for the interaction point moving with speed
 $D_{0}=6$
is shown in (b),
 $D_{0}=8$
in (c) and
 $D_{0}=10$
in (d). Shock polar solutions are shown as solid lines and PM fans as dashed lines.

3 Shock polar analysis
For the HE and LIC and HIC confinement materials identified in §§ 2.2–2.4, we can explore some of the types of detonation shock/confiner interactions that might be expected on the inner and outer arc material boundaries through an oblique shock polar analysis. Figure 3(a) shows a schematic of two types of common interactions (Aslam & Bdzil Reference Aslam and Bdzil2006). For strong confinement (typical for HE/HIC interactions), the detonation shock transmits an oblique shock into the confiner. The pressure behind the two shocks matches across the deflected material interface at a particular streamline turning angle. For weak confinement (typical for HE/LIC interactions), the detonation shock again transmits a shock into the confiner. The flow is sonic behind the oblique HE shock relative to a frame moving along the material interface with the phase speed
 $D_{0}$
of the shock intersection point (figure 3
a). A Prandtl–Meyer (PM) fan is required in the HE to match the pressures across the deflected material interface. Figure 3(b–d) show the shock polar and PM fan solutions for the HE, HIC and LIC materials for phase speeds
 $D_{0}=6$
,
 $8$
and
 $10$
of the interaction point, which is assumed to propagate steadily along the material interface. For the HIC material, the most common interaction solution with the HE observed in computations is the direct pressure match solution between the HE and HIC shock polars. In all three direct match cases, the flow in the HE is subsonic. For
 $D_{0}=6$
, the flow in the HIC material is subsonic, but for
 $D_{0}=8$
and
 $10$
the flow is supersonic. For the LIC confinement material, the most common interaction solution is the match involving a PM fan in the HE whose wavehead originates in sonic flow behind the oblique detonation shock. This corresponds to a flow solution where the structure of the detonation driving zone is independent of the properties of the confinement material. For such configurations, the flow in the HE is supersonic at the material interface, matching in all three cases to supersonic flow in the confiner. Other interaction solutions that could readily arise in a circular arc HE configuration involve either reflected shocks or reflected PM fans for sufficiently oblique (small
 $\unicode[STIX]{x1D714}$
) detonation shocks, or involve Mach stem solutions in the HE (Bdzil & Stewart Reference Bdzil, Stewart and Zhang2011).
4 Numerical strategy
The flow equations in the HE and confiner regions are integrated with a cell-centred finite volume method on a Cartesian mesh within the AMRITA framework (Quirk Reference Quirk and Deconinck1998a
,Reference Quirk and Deconinck
b
, Reference Quirk2007). Spatially, a second-order minmod reconstruction with a Lax–Friedrichs flux is used, while temporally, a second-order total variation diminishing Runge–Kutta integration is employed. Material interfaces are treated with a Ghost Fluid method (Fedkiw et al.
Reference Fedkiw, Aslam, Merriman and Osher1999) using a linearized Riemann solution closure as described by Quirk (Reference Quirk2007), and evolved using a level set strategy. Quirk (Reference Quirk2007) also contains details of the verification of the multi-material solver framework. The outer edges of the computational area described in figure 1 have an extrapolation outflow condition applied. A block structured adaptive-mesh-refinement capability (Quirk Reference Quirk1991, Reference Quirk and Deconinck1998a
,Reference Quirk and Deconinck
b
) is also employed. For the computations shown in § 5, two levels of refinement are used with a refinement factor of 4 for each level. The resolution of the finest grid is specified by the number of points (Npts) in the half reaction zone length of the ZND wave (§ 2.5), so that with the scaling (2.7) the finest mesh resolution is given by
 $1~\text{Npts}^{-1}$
. Unless specified otherwise, a resolution of
 $\text{Npts}=20$
was used. Resolution studies were conducted, some of which are described in § 5.
4.1 Geometry and initial conditions
The arc geometry is described in § 2.1. In the following simulations, we fix
 $R_{i}=100$
, and study the detonation properties as a function of varying outer radius
 $R_{e}$
and confinement. Typically, we set
 $R_{D}=R_{e}+100$
, so that any waves reflected from the outflow at the computational box boundaries do not affect the detonation evolution. The detonation wave in the circular arc of HE is initiated by a semi-circular region of high pressure of radius
 $R_{d}$
, centred on
 $(R_{i}+(R_{e}-R_{i})/2,0)$
in polar coordinates. The outer extent of this detonator region is shown by the red circles in figure 1. For the simulations below,
 $R_{d}=10$
. In the detonator region, we set the pressure and density to their CJ values, as defined in (2.17), along with zero flow velocity. The high pressure region initiates a detonation in the HE, which then evolves outwards, interacts with the confiner regions, and eventually relaxes to a steady-state propagation as described in § 5.1.
4.2 Diagnostics
4.2.1 Detonation angular speed
The angular speed of the detonation as it sweeps around the circular arc is determined by tracking the polar angle of the leading detonation shock along the radial line
 $r=r_{c}=(R_{i}+(R_{e}-R_{i})/2)$
, i.e. along the central radial line of the HE. We specify the shock location to correspond to the pressure criteria
 $$\begin{eqnarray}p_{d}=1.\end{eqnarray}$$
Starting from the polar angle at the end of the arc,
 $\unicode[STIX]{x1D703}=3\unicode[STIX]{x03C0}/2$
, where
 $p=0$
, we search along
 $r=r_{c}$
on the coarse mesh, until a polar angle is reached where
 $p>1$
. Then, searching on the local fine mesh, we locate the two neighbouring polar angles on the fine mesh for which
 $p<1$
and
 $p>1$
. The polar angle of the shock location for which
 $p=1$
is then obtained by interpolation. The angular speed of the steady propagating detonation,
 $\unicode[STIX]{x1D714}_{0}$
, is then extracted via a linear fit through the shock location polar angle versus time data for a polar angle region where the wave has reached steady-state propagation.
4.2.2 Detonation shock locus
The detonation shock locus when the wave has reached steady state is obtained in a similar manner to that described above, except that sweeps are now made along multiple lines of fixed radial coordinate ranging from
 $r=R_{i}$
to
 $r=R_{e}$
. The shock locus is then constructed as a
 $(r,\unicode[STIX]{x1D703})$
variation.
4.2.3 Sonic line locus
The flow Mach number in the HE relative to the steady propagating detonation wave with angular speed
 $\unicode[STIX]{x1D714}_{0}$
is given by
 $$\begin{eqnarray}M=\frac{|(u,v)|}{c_{HE}}=\frac{\sqrt{(u+r\unicode[STIX]{x1D714}_{0}\sin \unicode[STIX]{x1D703})^{2}+(v-r\unicode[STIX]{x1D714}_{0}\cos \unicode[STIX]{x1D703})^{2}}}{c_{HE}},\end{eqnarray}$$
in a polar coordinate representation. For the purposes of the current study, in addition to the shock locus, we want to construct the flow sonic line variation relative to a frame attached to the steady propagating detonation. This is given by the locus
 $M=1$
. It is constructed in a similar manner to the detonation shock locus, by sweeping along multiple lines of fixed radial coordinate ranging from
 $r=R_{i}$
to
 $r=R_{e}$
, and determining the
 $(r,\unicode[STIX]{x1D703})$
variation for which
 $M=1$
. Note that the sonic locus may not extend the thickness of the arc, as highlighted in § 5.3.
4.2.4 Weighted pressure gradient imaging
Our primary interest in the current work is the structure of the detonation driving zone (§ 1) for varying arc thickness, as well as identifying the regions of subsonic, sonic and supersonic flow in the HE arc, along with the types of flow structures that develop at the HE/confiner boundaries. To this end, we use a pressure gradient function representation to highlight the principal wave structures. This is defined as follows. For each material region (LIC, HIC or HE), we define a pressure gradient magnitude function at each grid location,
 $$\begin{eqnarray}PGF_{i}[~]=|\unicode[STIX]{x1D735}p|,\end{eqnarray}$$
where
 $i$
is the material index, and
 $[~]$
represents the function evaluation at any grid location. We then introduce a weighting function, defined at each grid location,
 $$\begin{eqnarray}wt_{i}[~]=\frac{PGF_{i}[~]-\min (PGF_{i})}{\max (PGF_{i})-\min (PGF_{i})},\end{eqnarray}$$
where
 $\min (PGF_{i})$
and
 $\max (PGF_{i})$
are the global maximum and minimum values of the pressure gradient magnitude function for each material
 $i$
. Thus,
 $0\leqslant wt_{i}\leqslant 1$
. We then use this to define a colour shading function,
 $$\begin{eqnarray}shade_{i}[~]=E\times MatColor_{i}[~]\times \exp (-B\times wt_{i}[~]),\end{eqnarray}$$
where
 $E$
is an exposure parameter and
 $B$
is an amplification parameter. The role of
 $B$
is to magnify the presence of regions of weak pressure gradients if desired. Thus, for moderate values of
 $B$
and for locations where
 $wt_{i}[~]\rightarrow 0$
, where there is only a small pressure gradient, the pressure gradient imaging will return the base colour (
 $MatColor$
) of the material region (blue for the LIC, red for the HIC, and grey for the HE – see figure 1). On the other hand, in regions of high pressure gradient, the base colour of the material region will be overwritten with a grey shading defined by (4.5). The more intense the pressure gradient magnitude, the darker the shading. For the images shown in § 5, we chose
 $E=0.8$
and
 $B=20$
. We call the result of this process the weighted pressure gradient (WPG) image. This imaging process successfully highlights the position of the lead detonation shock, the transmitted shocks in the confiner regions, reflected shocks and Mach stems in the HE, and PM fans and reflected shocks at the HE-confiner boundaries. This diagnostic plays a similar role to that of Schlieren imaging in experiments to determine the location of primary gasdynamic structures in compressible flow.
5 Results
5.1 Relaxation to steady-state evolution
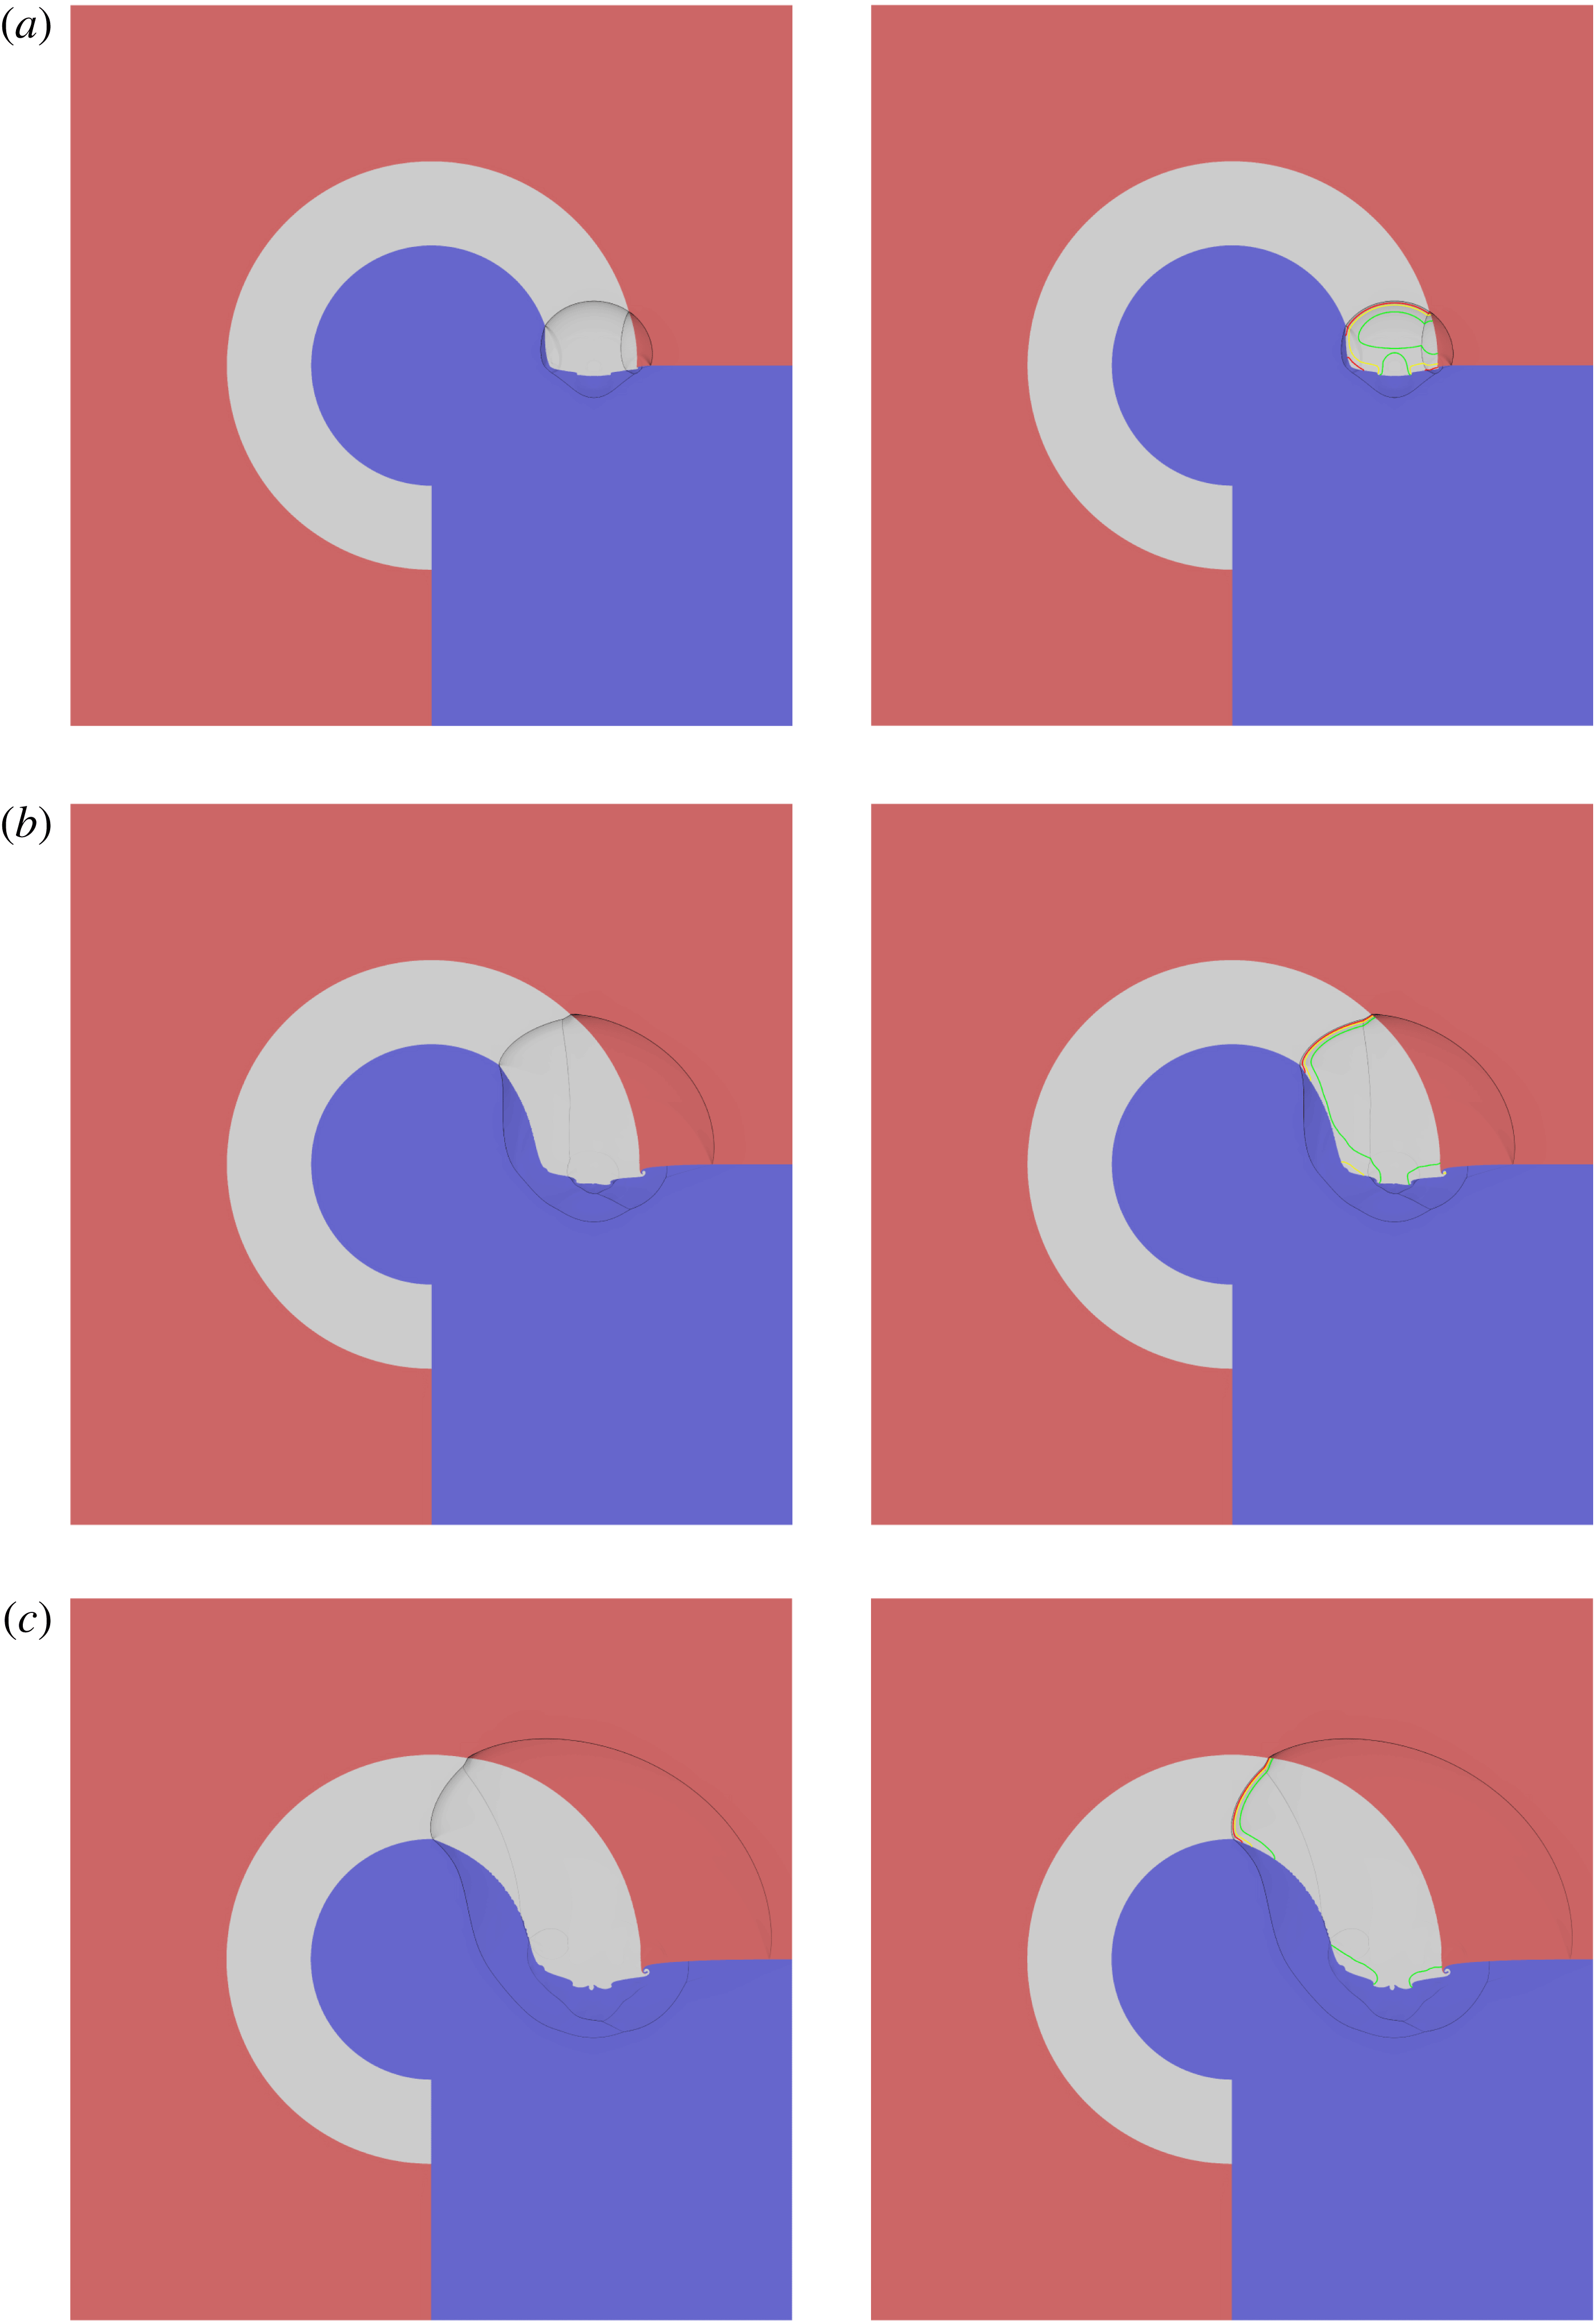
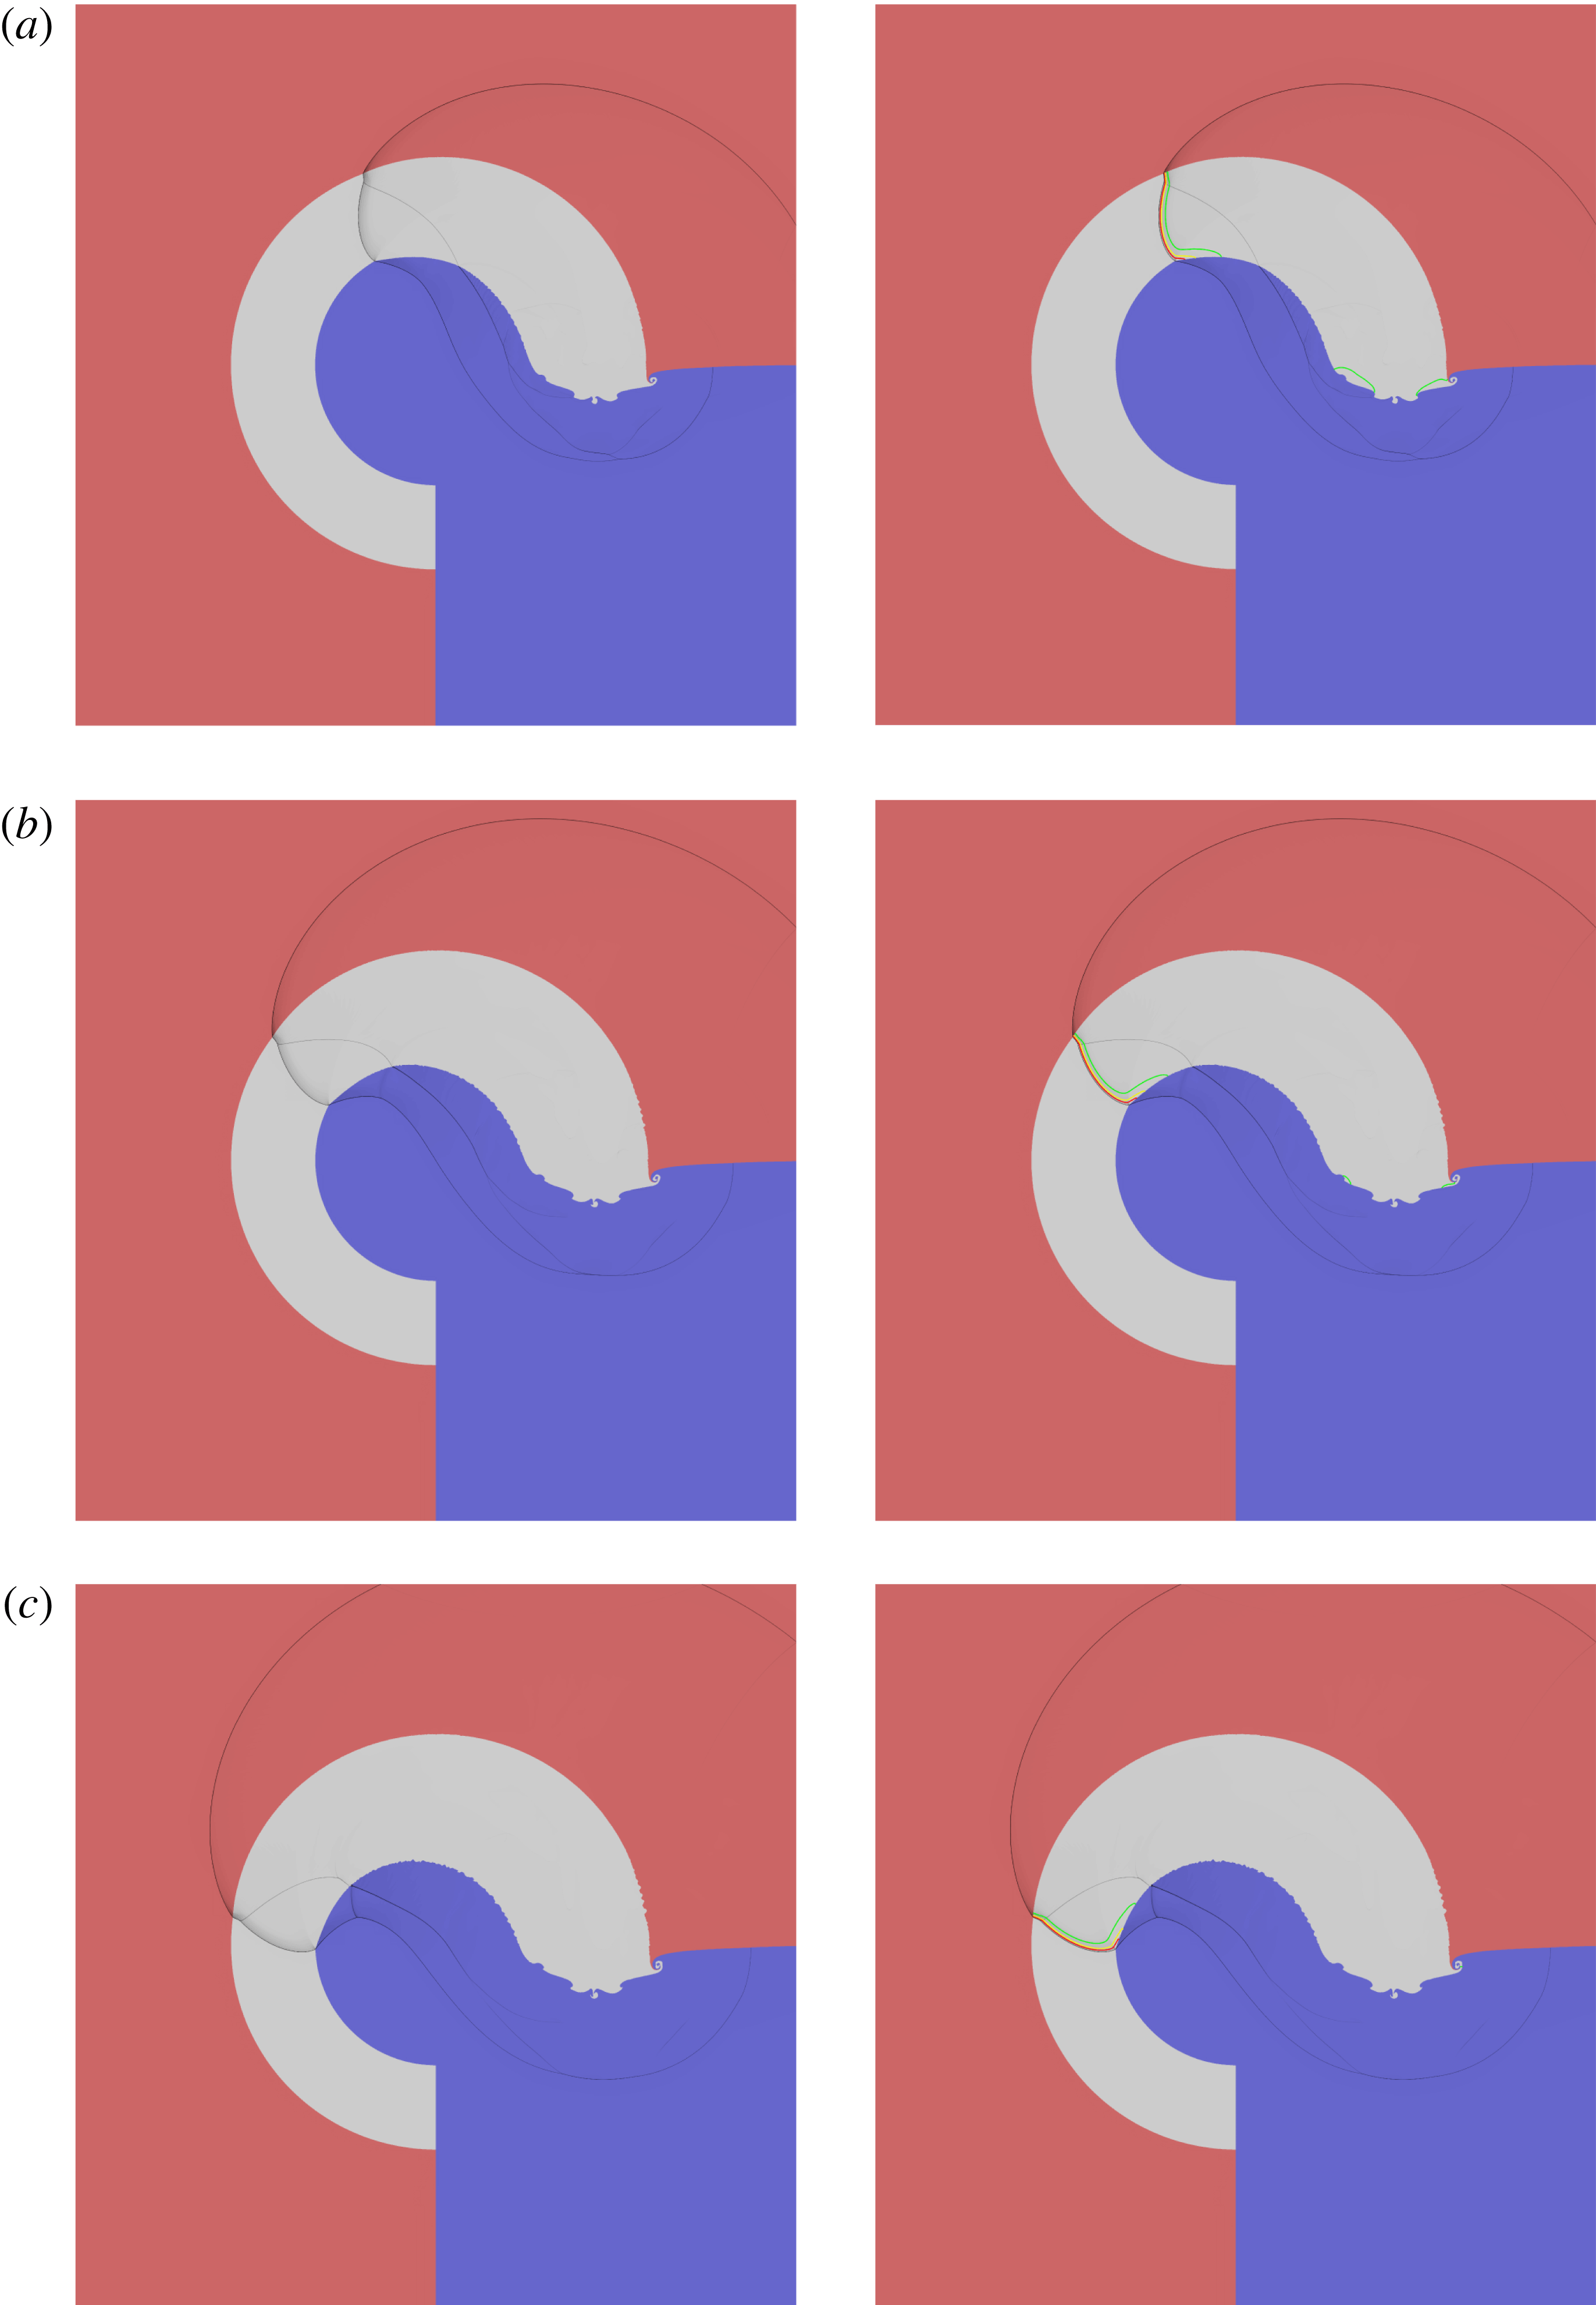
Although the current paper is primarily concerned with the DDZ structure of the steady propagating wave that develops in the arc, it is instructive to give an example of how the steady wave is formed. Figure 4 shows a sequence of WPG images of the evolution of the detonation in an arc with
 $R_{e}=170$
and with the LIC and HIC materials on the inner and outer HE arc boundaries, respectively. Also shown in the right-hand column of figure 4 are various reactant depletion contours overlaid on the corresponding WPG images.
Weighted pressure gradient (WPG) images of the evolution of the detonation as it sweeps around the circular arc from the initial state shown in figure 1(b) for
 $R_{i}=100$
and
 $R_{e}=170$
, with LIC confinement on the inner arc surface and HIC confinement on the outer arc surface. Left panels: WPG images. Right panels: the same WPG image but with reactant depletion contours added. The red, yellow and green contours correspond to
 $50\,\%$
,
 $75\,\%$
and
 $99\,\%$
reactant depletion, respectively.

Continuation of figure 4 at later times.

Starting from the state shown in figure 1, the hot-spot (detonator) region initiates a detonation wave in the HE, which expands out and collides with the curved LIC and HIC interfaces. Due to the initial angle of incidence of the detonation shock with the material interfaces, a reflected PM fan in the HE is generated at the LIC/HE interface, while a reflected shock is generated at the HE/HIC interface. Inert shocks are transmitted into both confiner regions (figure 4 a). In the interior of the HE, the detonation shock continues to expand and diffract, while the initial PM fan at the LIC boundary rapidly expands into the HE region (figure 4 b). These effects modify the curvature of the lead detonation shock. The reflected shock at the HIC interface also moves into the interior, but develops a Mach stem/reflected wave triple point structure towards the HIC interface. The transmitted shocks in the LIC and HIC regions propagate further into these regions as the detonation sweeps around the arc (figure 4 b,c). In figure 5(a), the reflected shock originating from the Mach reflection near the HIC interface transmits a second shock into the LIC region, following the lead LIC shock transmitted by the HE detonation shock. The two LIC shocks eventually interact through a Mach reflection in the lead LIC shock (figure 5 b,c). As the detonation relaxes to a steady propagation, the reactant depletion contours broadly follow the curvature of the detonation shock except in a layer near the LIC where a PM fan is centred near the LIC/HE interface. Along with the effects of the lead detonation shock curvature, the PM fan slows reaction in this region, locally lengthening the reaction zone, and the successive reactant depletion contours fall back from the shock. The Mach reflection in the HE also relaxes into a steady-state propagation sweeping around the arc at a constant radial distance from the HIC interface (figure 5 b,c).
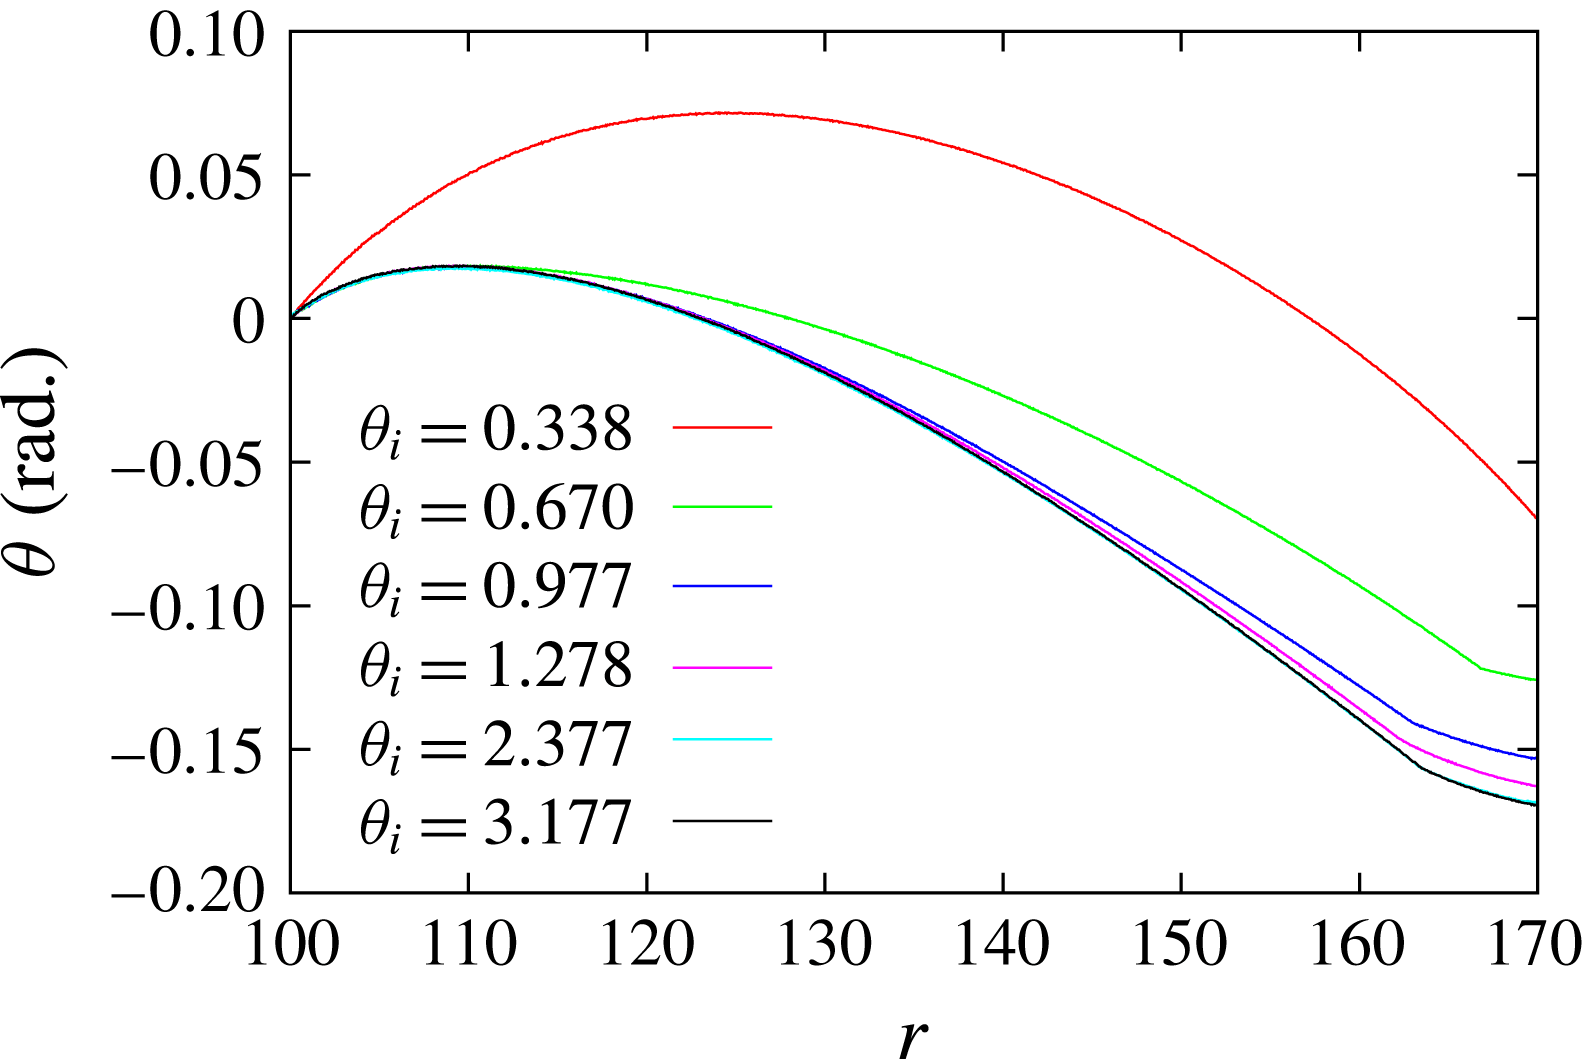
Figure 6 shows the relaxation of the detonation front shape in figures 4 and 5 to steady state in a polar angle versus radial distance representation for various angles
 $\unicode[STIX]{x1D703}_{i}$
, defining where the lead detonation shock is located on the LIC/HE interface at various times. For comparison purposes, the shock shapes are shifted by an angle
 $-\unicode[STIX]{x1D703}_{i}$
, so that each detonation shock shape originates from
 $\unicode[STIX]{x1D703}=0$
on
 $r=R_{i}$
. The values of
 $\unicode[STIX]{x1D703}_{i}$
are indicated. The detonation shock near the LIC surface relaxes to its steady-state shape very quickly, e.g. at
 $\unicode[STIX]{x1D703}_{i}=0.670~\text{radians}$
, the detonation shock region between
 $100<r<110$
has already reached its steady shape. The shock shape at larger radial distance takes progressively longer to reach steady state, with the Mach stem structure taking the longest to relax. When
 $\unicode[STIX]{x1D703}_{i}=2.377~\text{radians}$
, the detonation wave front has fully relaxed to its steady evolution profile.
For a given confinement, the length of time the detonation takes to reach steady state depends on the inner arc radius
 $R_{i}$
and the thickness of the arc. A rule of thumb for 2D planar slab and axisymmetric rate-stick geometries is that a detonation needs to propagate axially for 3–4 slab thicknesses or diameters to approach steady-state evolution. Thus, for an arc of thickness
 $R_{e}-R_{i}$
, the detonation will need to propagate through an angle 3–4 times
 $(R_{e}-R_{i})/R_{i}~\text{radians}$
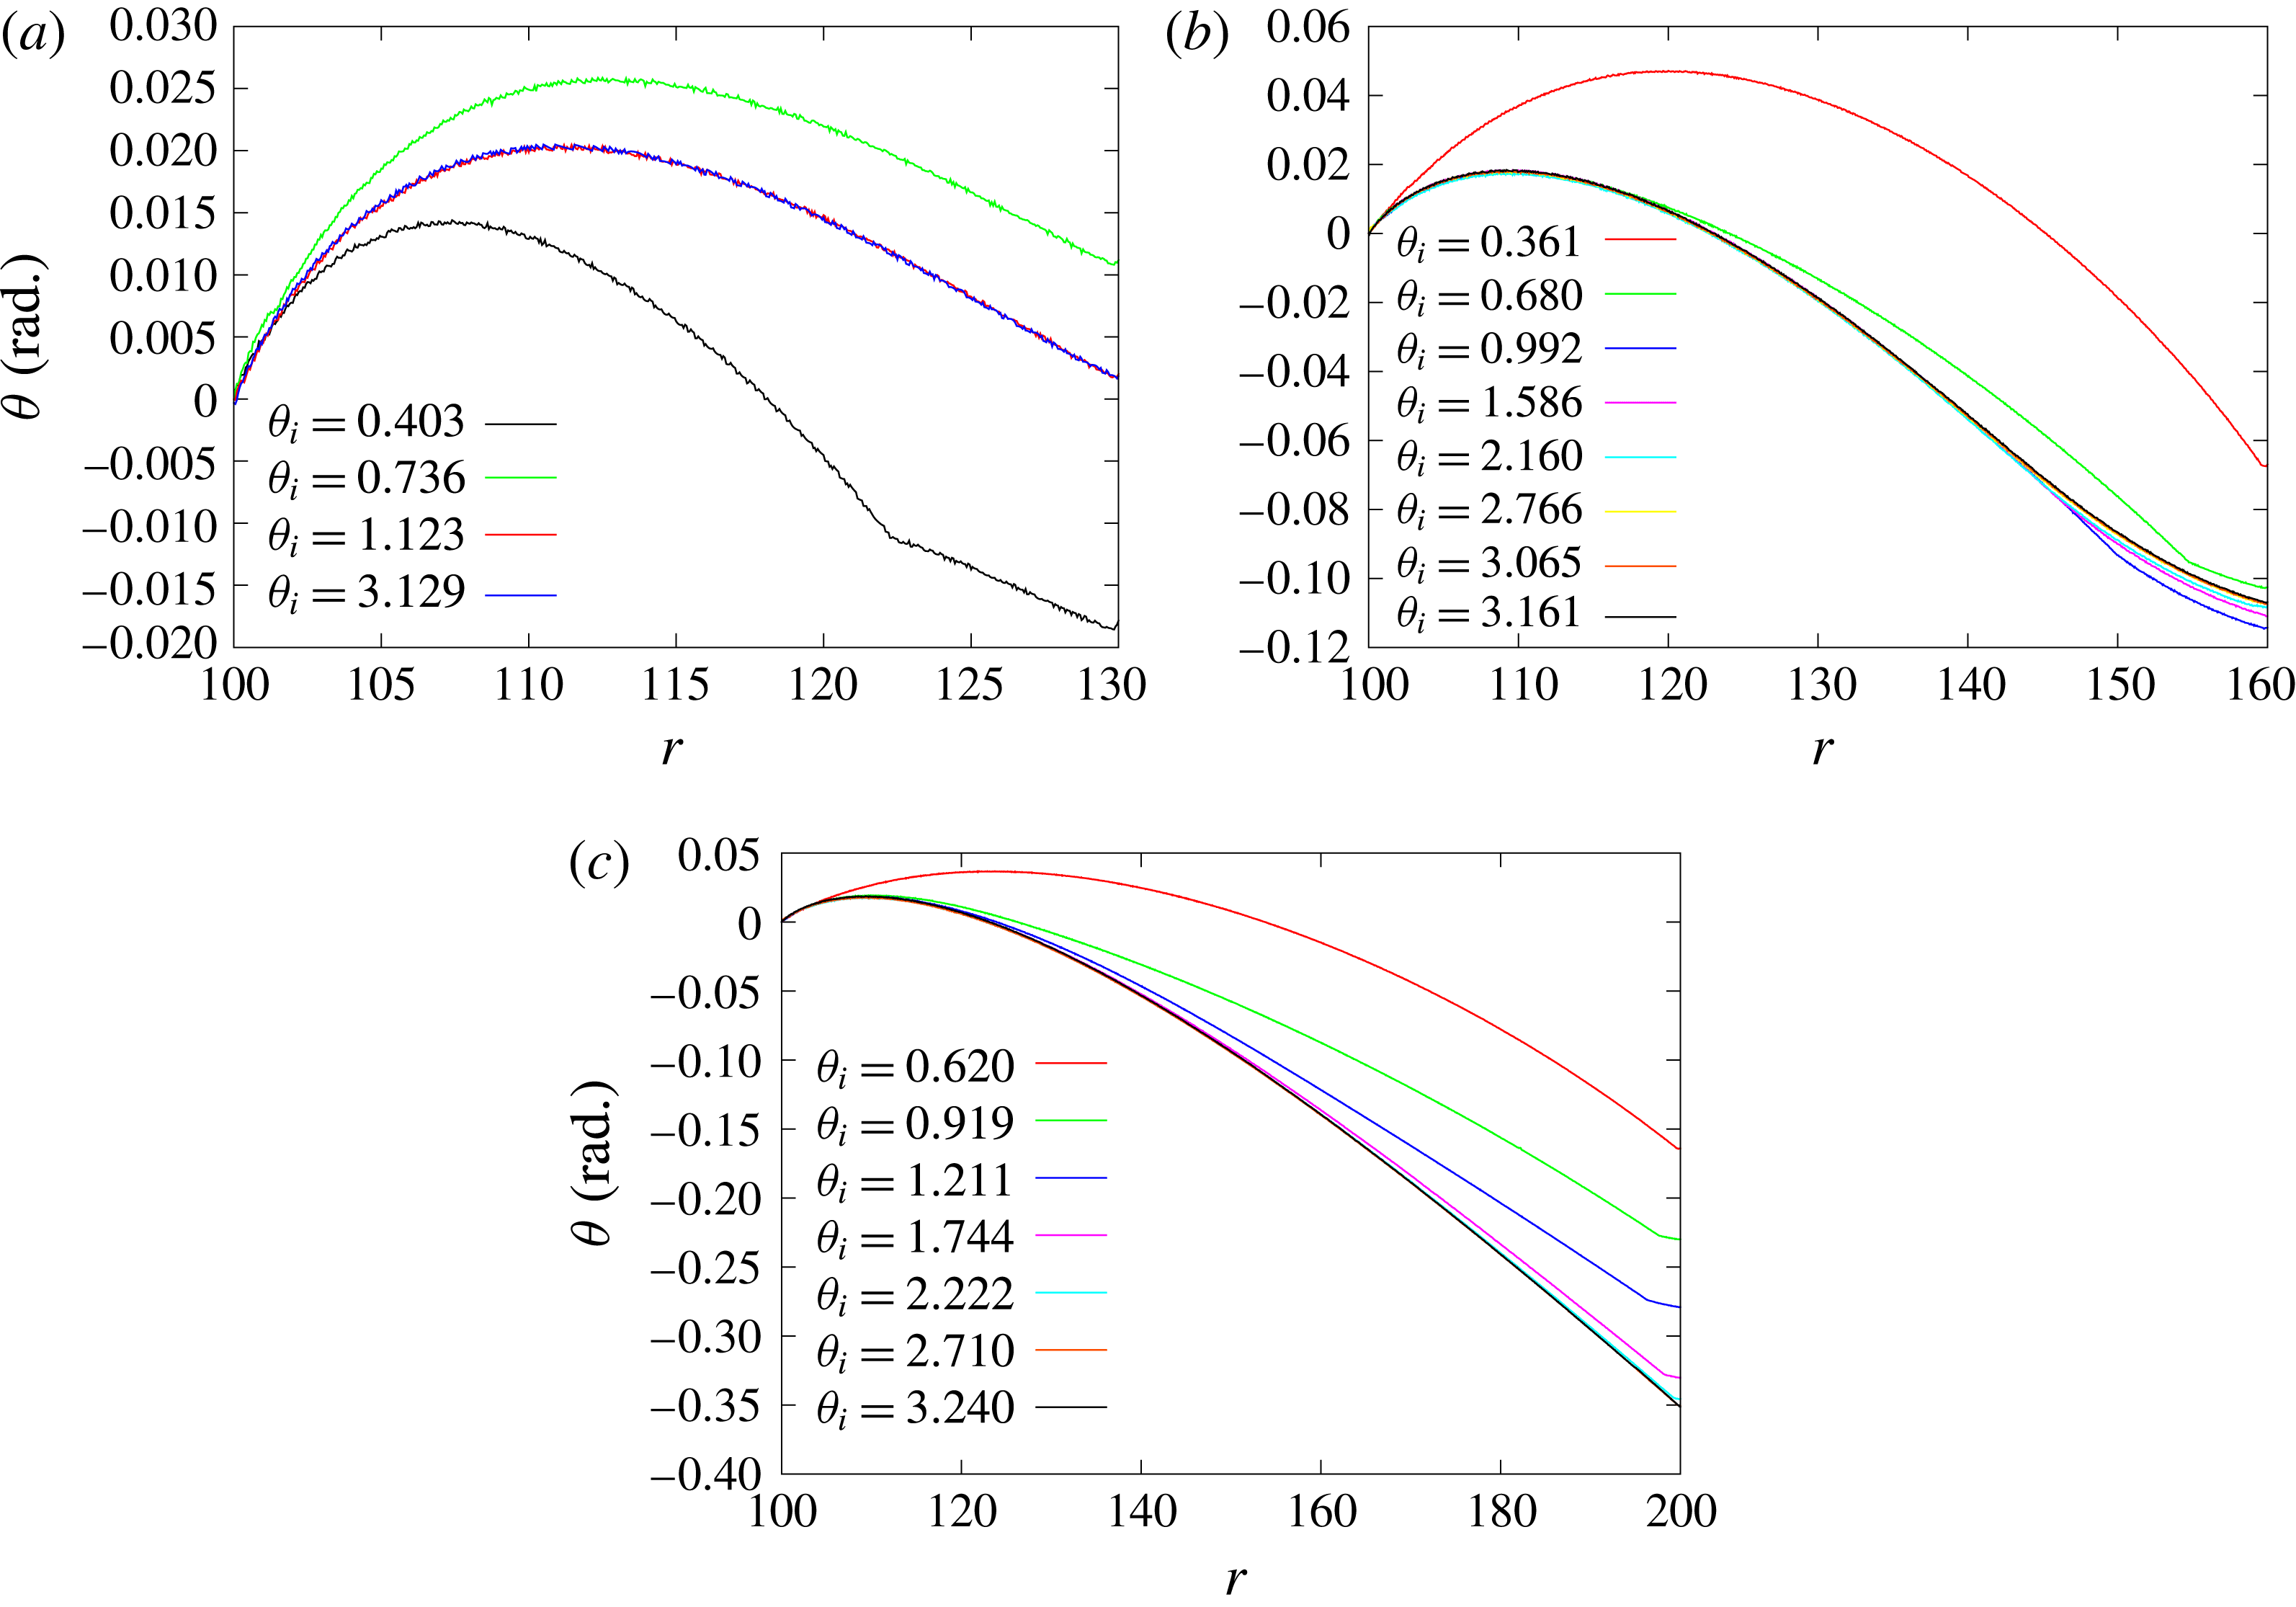
to reach steady state, which is approximately observed in figure 6. Figure 7 shows the evolution of the detonation front shape for
 $R_{e}=130$
,
 $160$
and
 $200$
. For
 $R_{e}=130$
, the complete wave front reaches steady state quickly. For
 $R_{e}=160$
, a significant section of the wave front has reached steady state by
 $\unicode[STIX]{x1D703}_{i}=0.992~\text{radians}$
. The region nearer to
 $r=R_{e}$
, which involves negative shock curvature, relaxes to steady state slower, but has reached steady state by
 $\unicode[STIX]{x1D703}_{i}=2.766~\text{radians}$
. For
 $R_{e}=200$
, the wave front has reached steady state by
 $\unicode[STIX]{x1D703}_{i}=2.710~\text{radians}$
.
Relaxation of the detonation shock locus in figures 4 and 5 to a steady-state evolution. The locus is shown as its polar angle variation versus radial position across the arc. The parameter
 $\unicode[STIX]{x1D703}_{i}$
indicates the polar angle of the shock locus point on the inner arc surface at the time the shock wave shape was extracted. For comparison purposes, all front shapes have been shifted such that the shock locus point on the inner arc surface is set to a polar angle of zero.

As for figure 6, but for (a)
 $R_{e}=130$
, (b)
 $R_{e}=160$
and (c)
 $R_{e}=200$
.

5.2 Angular speed variation
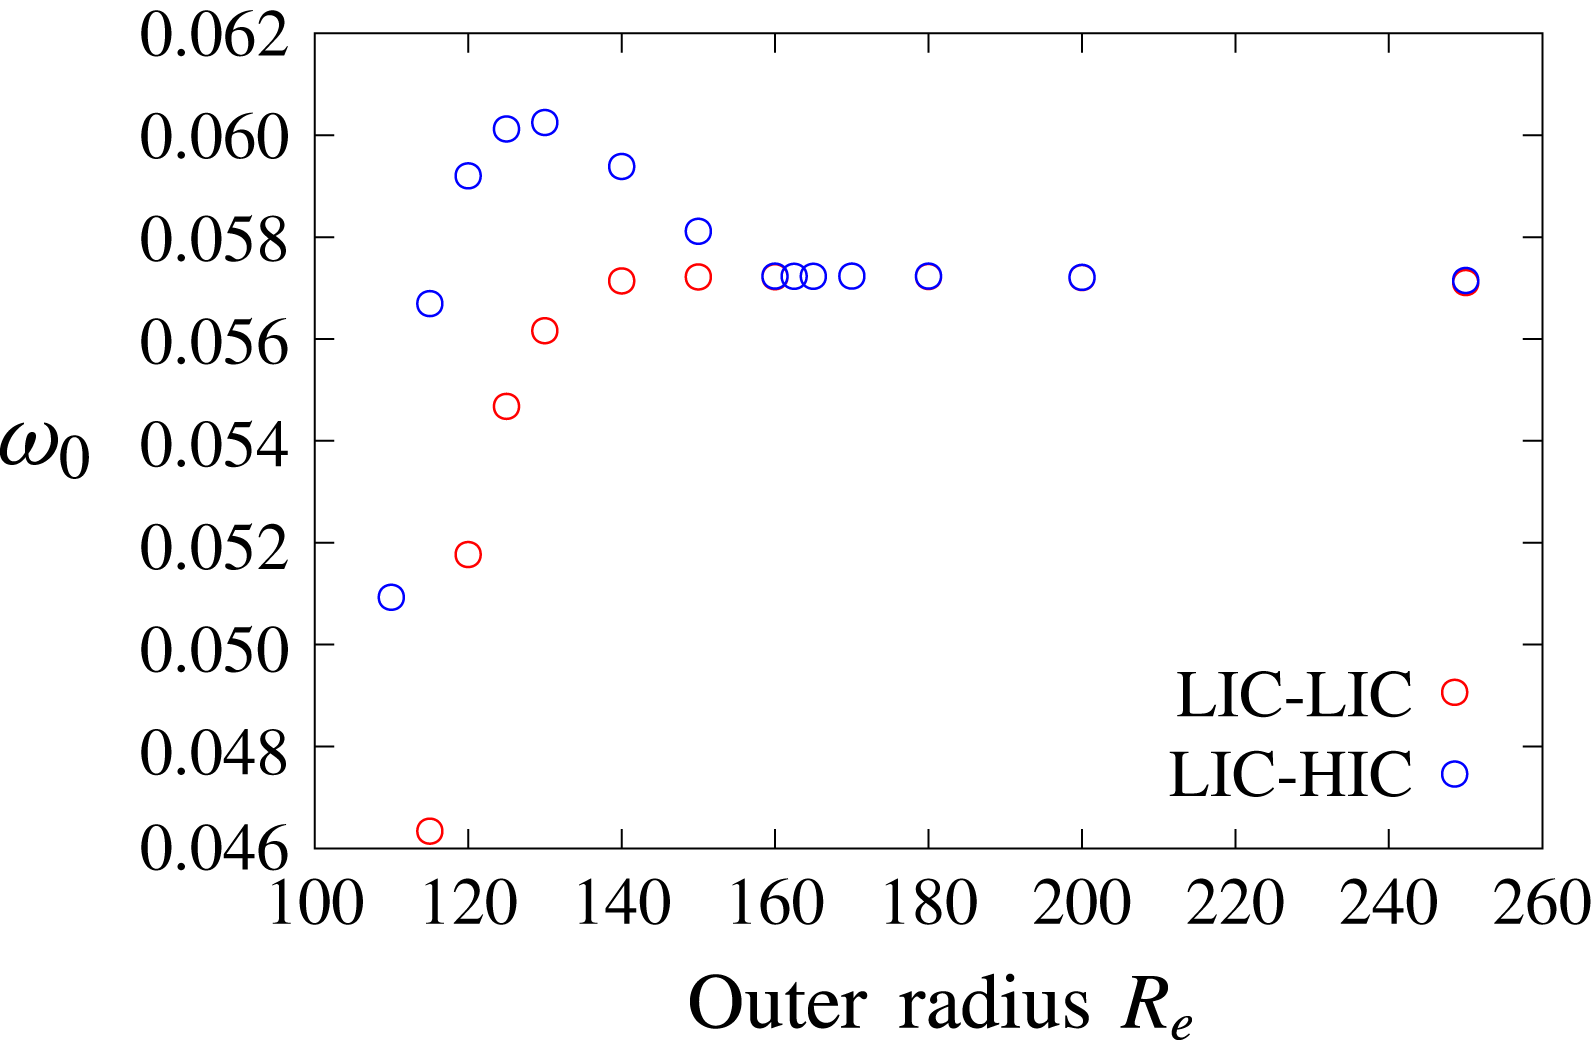
Variation of the angular speed
 $(\unicode[STIX]{x1D714}_{0})$
of the steady detonation wave as a function of outer radius
 $R_{e}$
for
 $R_{i}=100$
. The arc is confined by the LIC material along its inner surface and either by LIC or HIC material along its outer surface.

Figure 8 shows the variation in the angular speed
 $(\unicode[STIX]{x1D714}_{0})$
as a function of
 $R_{e}$
of the steady propagating detonation wave as it sweeps around the arc. Two confinement cases are plotted, both with LIC material surrounding the inner arc surface and either LIC or HIC material surrounding the outer arc surface. For sufficiently thin arcs,
 $\unicode[STIX]{x1D714}_{0}$
depends on both the outer arc radius
 $R_{e}$
, with
 $\unicode[STIX]{x1D714}_{0}$
increasing with increases in
 $R_{e}$
, and the type of confinement on
 $r=R_{e}$
, where
 $\unicode[STIX]{x1D714}_{0}$
is greater with HIC confinement on
 $r=R_{e}$
than for LIC on
 $r=R_{e}$
. For sufficiently thick arcs, however, the angular speed becomes independent of both
 $R_{e}$
and the outer arc confinement material. This appears to occur for
 $R_{e}\approx 154$
, and is consistent with the results of the DSD analysis (Short et al.
Reference Short, Quirk, Meyer and Chiquete2016) described in § 1. We explore the mechanisms underlying this property below for the reactive burn model simulations. A second interesting aspect of the
 $\unicode[STIX]{x1D714}_{0}$
variation seen in figure 8 is that of a maximum peak in
 $\unicode[STIX]{x1D714}_{0}$
when the outer arc confinement is the HIC material. Again, the mechanisms underlying this feature are explored below. For LIC material surrounding the outer arc, the angular speed increases monotonically with increasing
 $R_{e}$
before asymptoting to a constant value.
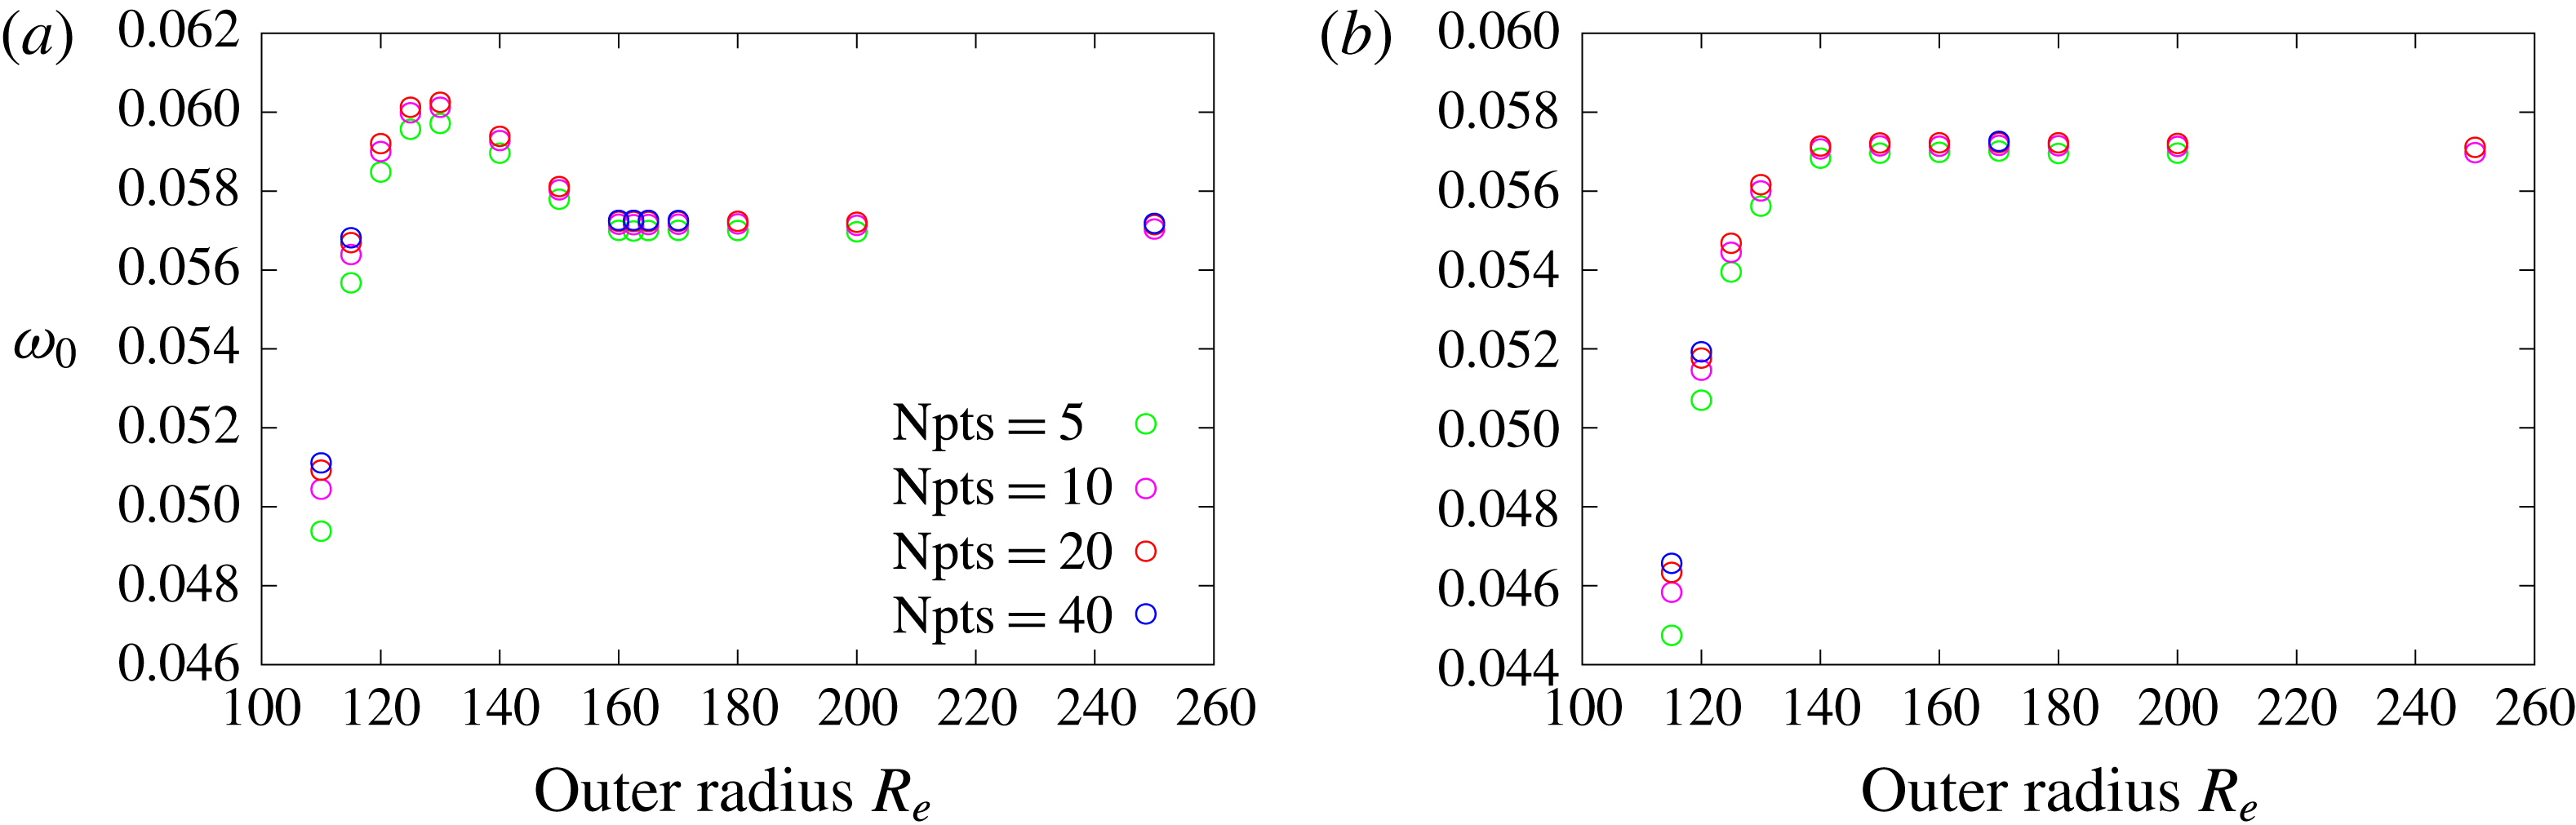
Variation of angular speed with computational resolution for the LIC-HIC (a) and LIC-LIC (b) confinement cases shown in figure 8.

Figure 9 shows the results of a resolution study for the angular speed variation for the LIC-LIC and LIC-HIC confinement cases shown in figure 8. Except for the thinner arcs, a moderate resolution of
 $\text{Npts}=10$
is required for adequate convergence of the angular speed variation. For thinner arcs, a resolution of at least
 $\text{Npts}=20$
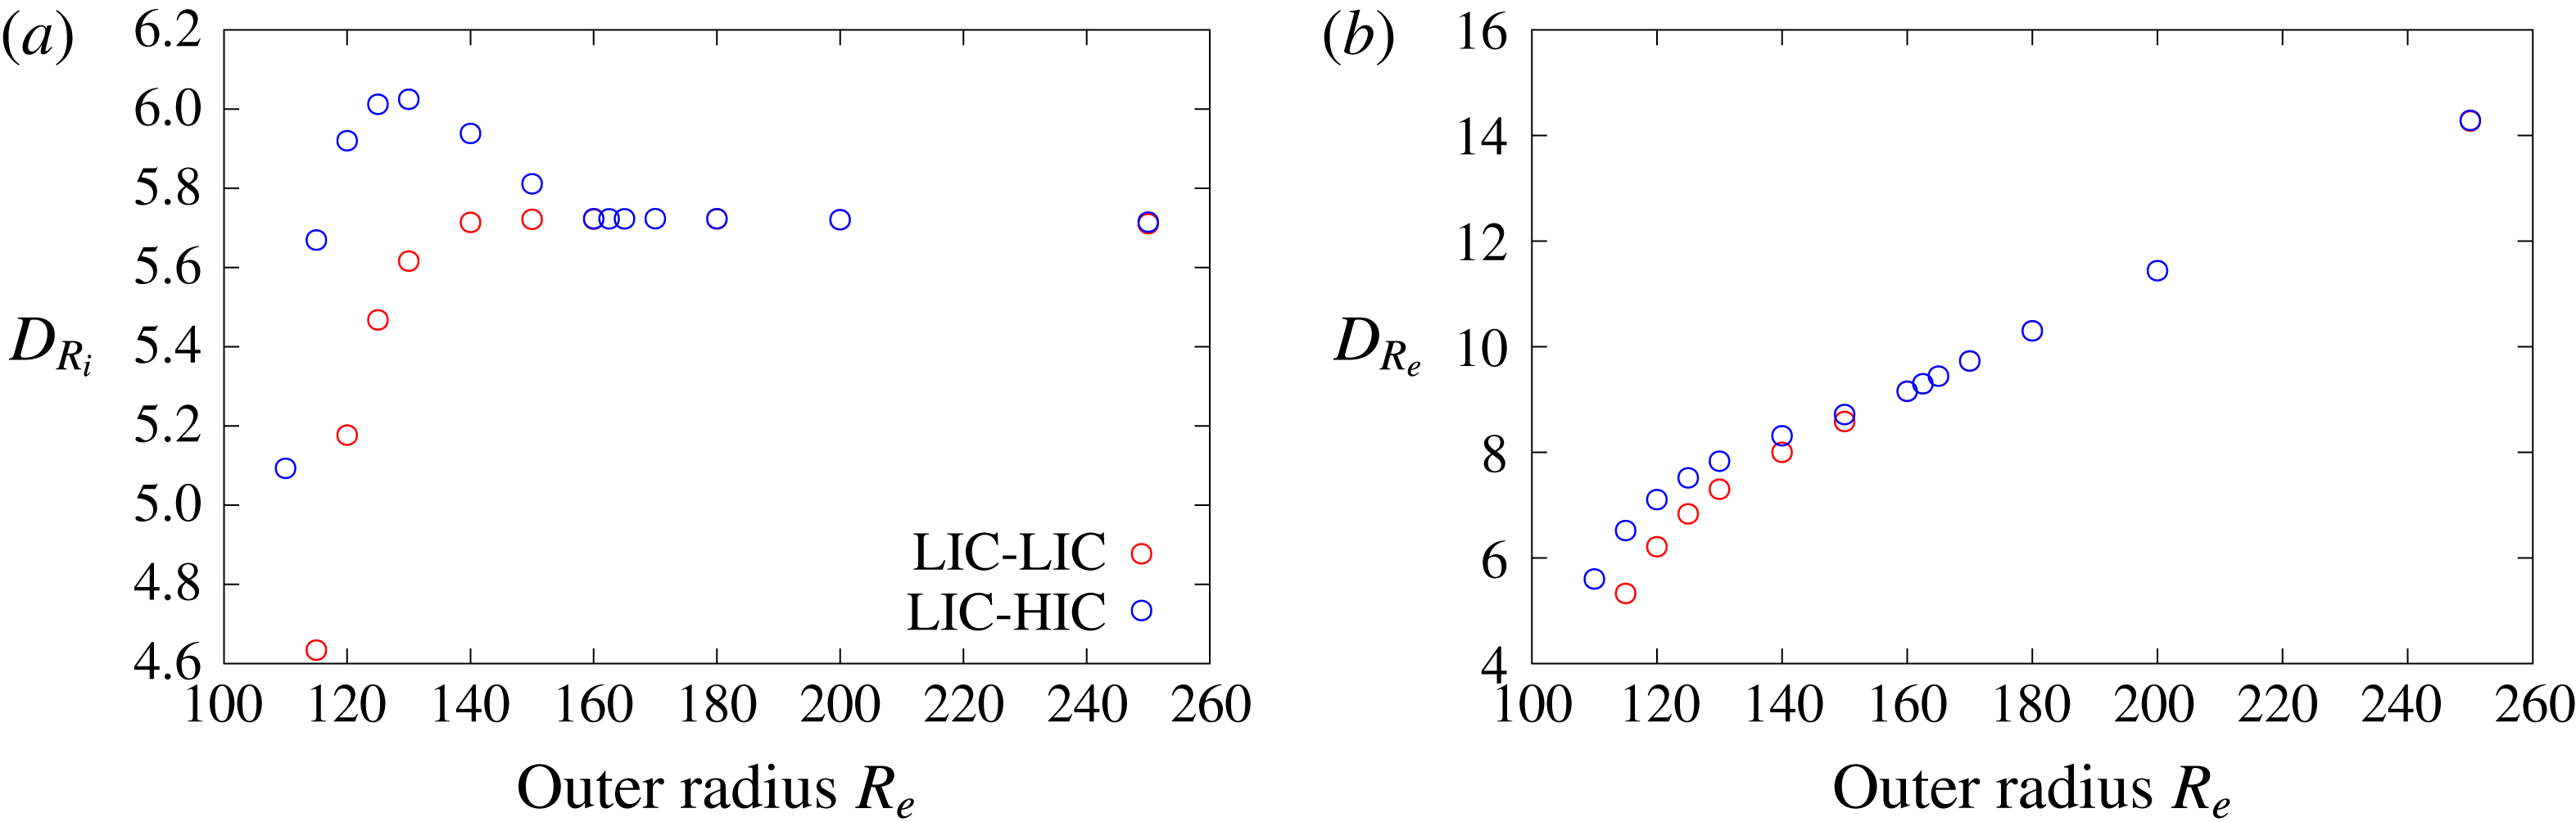
is required. Figure 10 shows the variation of the linear speed of the detonation on the inner and outer arc surfaces, a quantity which is measured experimentally in explosive arc configurations (Zhao et al.
Reference Zhao, Li, Zhao, Sun, Han, He and Gao1998; Bdzil et al.
Reference Bdzil, Aslam, Henninger and Quirk2003; Lubyatinsky et al.
Reference Lubyatinsky, Batalov, Garmashev, Israelyan, Kostitsyn, Loboiko, Pashentsev, Sibilev, Smirnov, Filin, Furnish, Gupta and Forbes2003). On the inner arc surface, since the inner radius is fixed, the linear speed variation
 $D_{R_{i}}$
is a simple scaling
 $(D_{R_{i}}=R_{i}\unicode[STIX]{x1D714}_{0})$
of the angular speed variation shown in figure 8. On the outer arc surface, since
 $R_{e}$
varies and
 $\unicode[STIX]{x1D714}_{0}$
is constant (as the wave is steady for each
 $R_{e}$
), we get the linear speed
 $D_{R_{e}}=R_{e}\unicode[STIX]{x1D714}_{0}$
variation shown in figure 10(b), where
 $D_{R_{e}}$
increases with
 $R_{e}$
. The linear speed on the outer arc surface can significantly exceed
 $D_{CJ}$
, hence the need to consider oblique polar wave diagrams with a phase speed greater than
 $D_{CJ}$
in the examination of potential confinement effects (§ 3).
Variation of the linear speed of the steady detonation wave along (a) the inner arc boundary and (b) the outer arc boundary as a function of outer radius
 $R_{e}$
for
 $R_{i}=100$
. The arc is confined by the LIC material along its inner surface and either by LIC or HIC material along its outer surface.

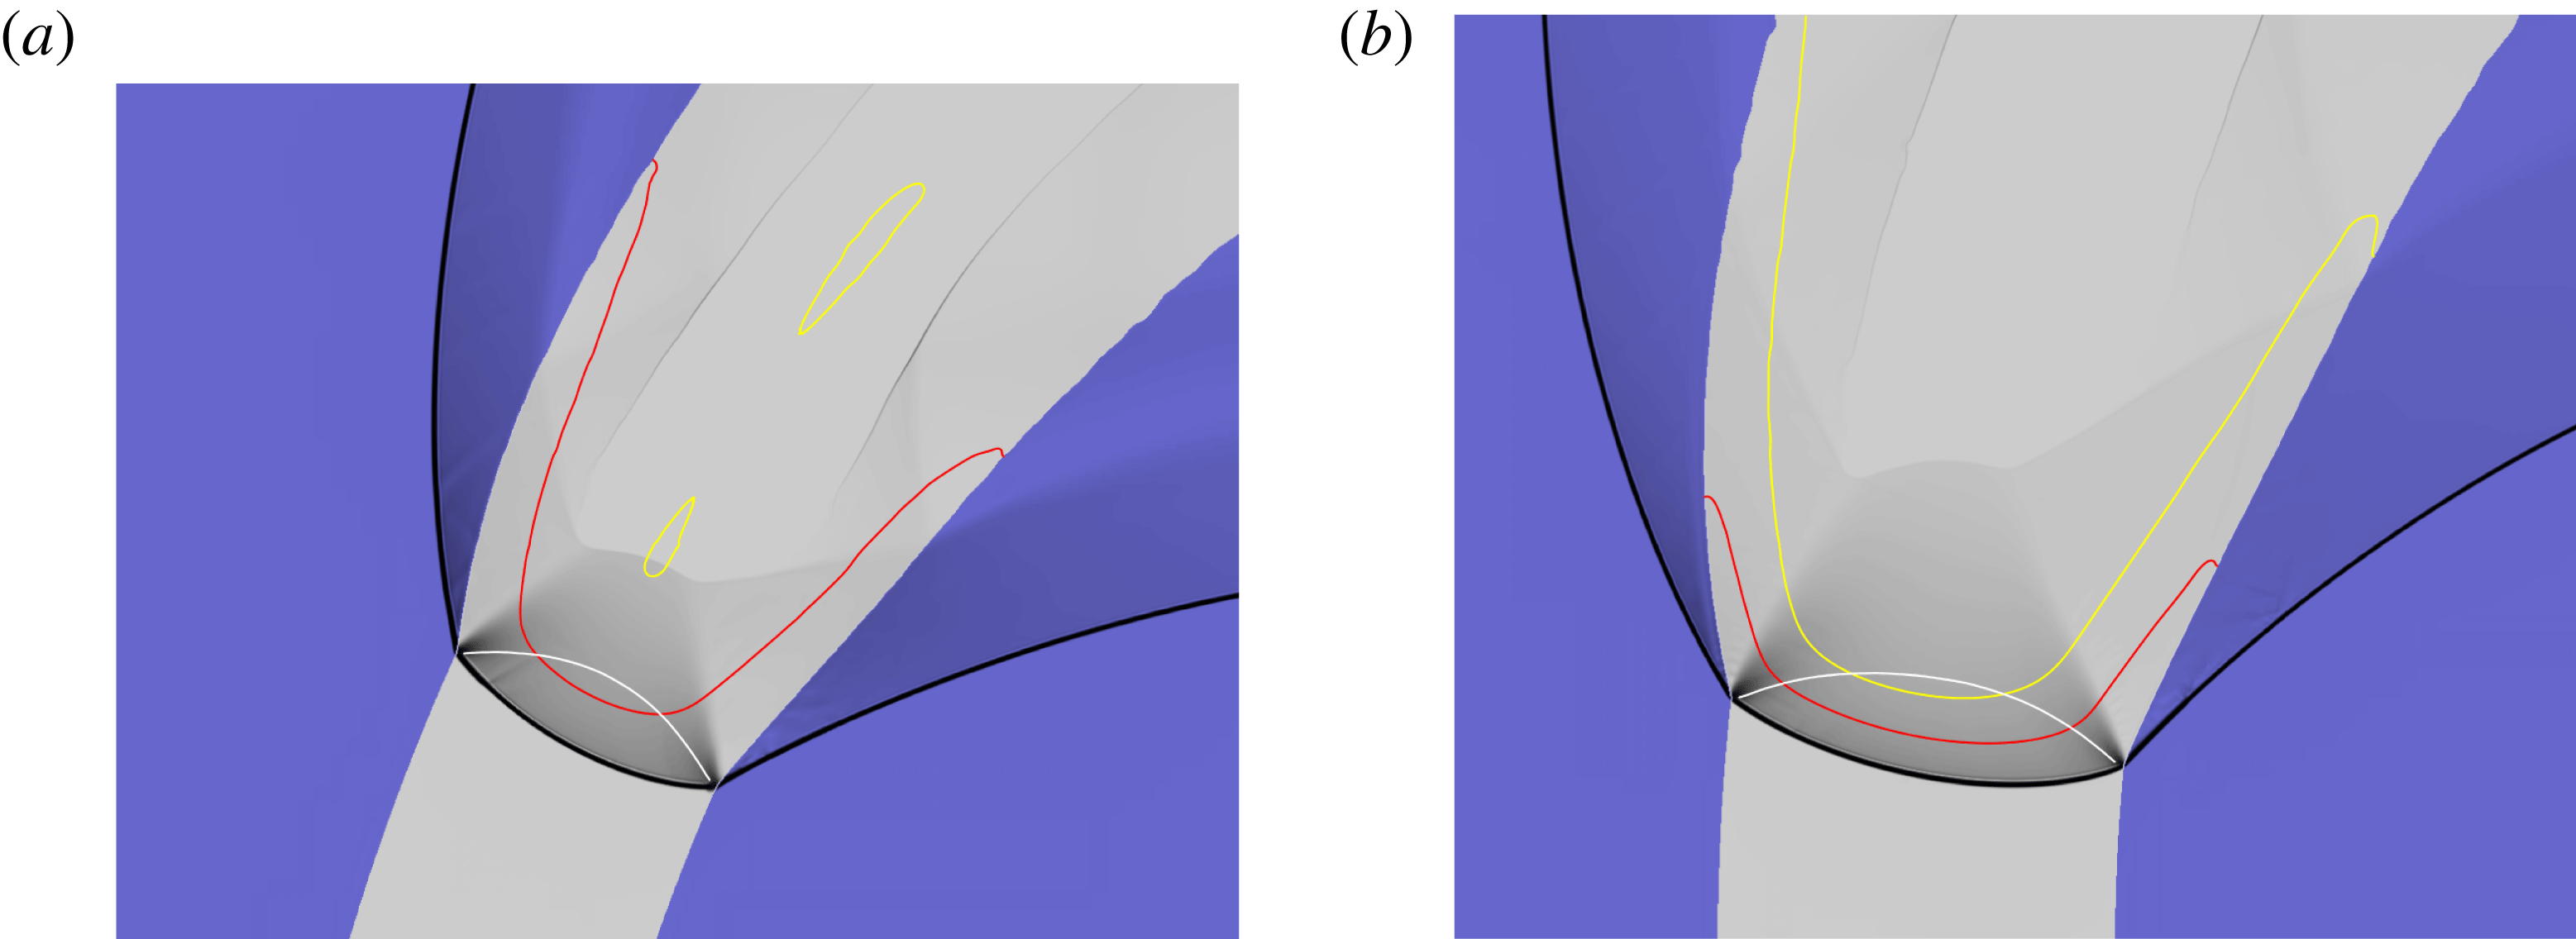
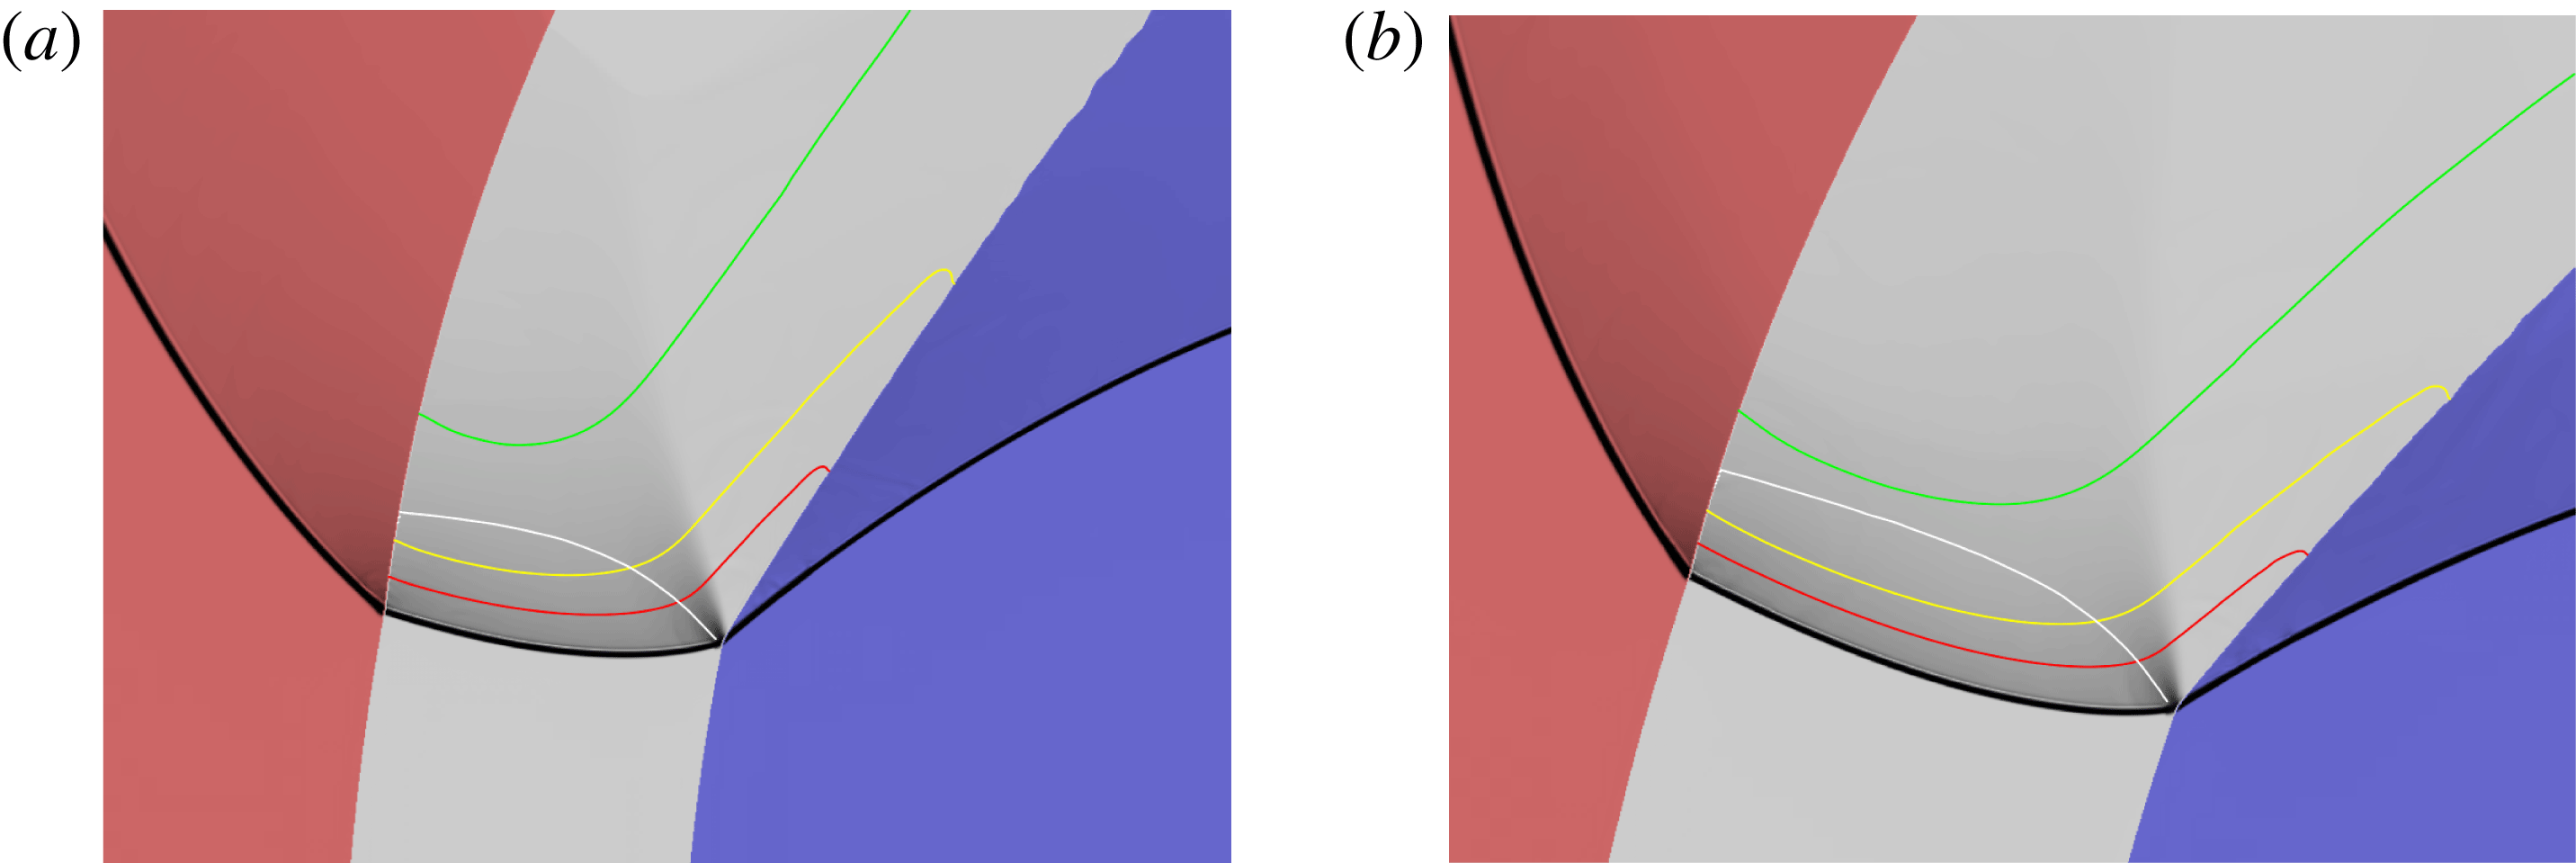
Weighted pressure gradient image representation of the steady detonation structure for
 $R_{i}=100$
with LIC confinement on the inner and outer arc surfaces. (a)
 $R_{e}=115$
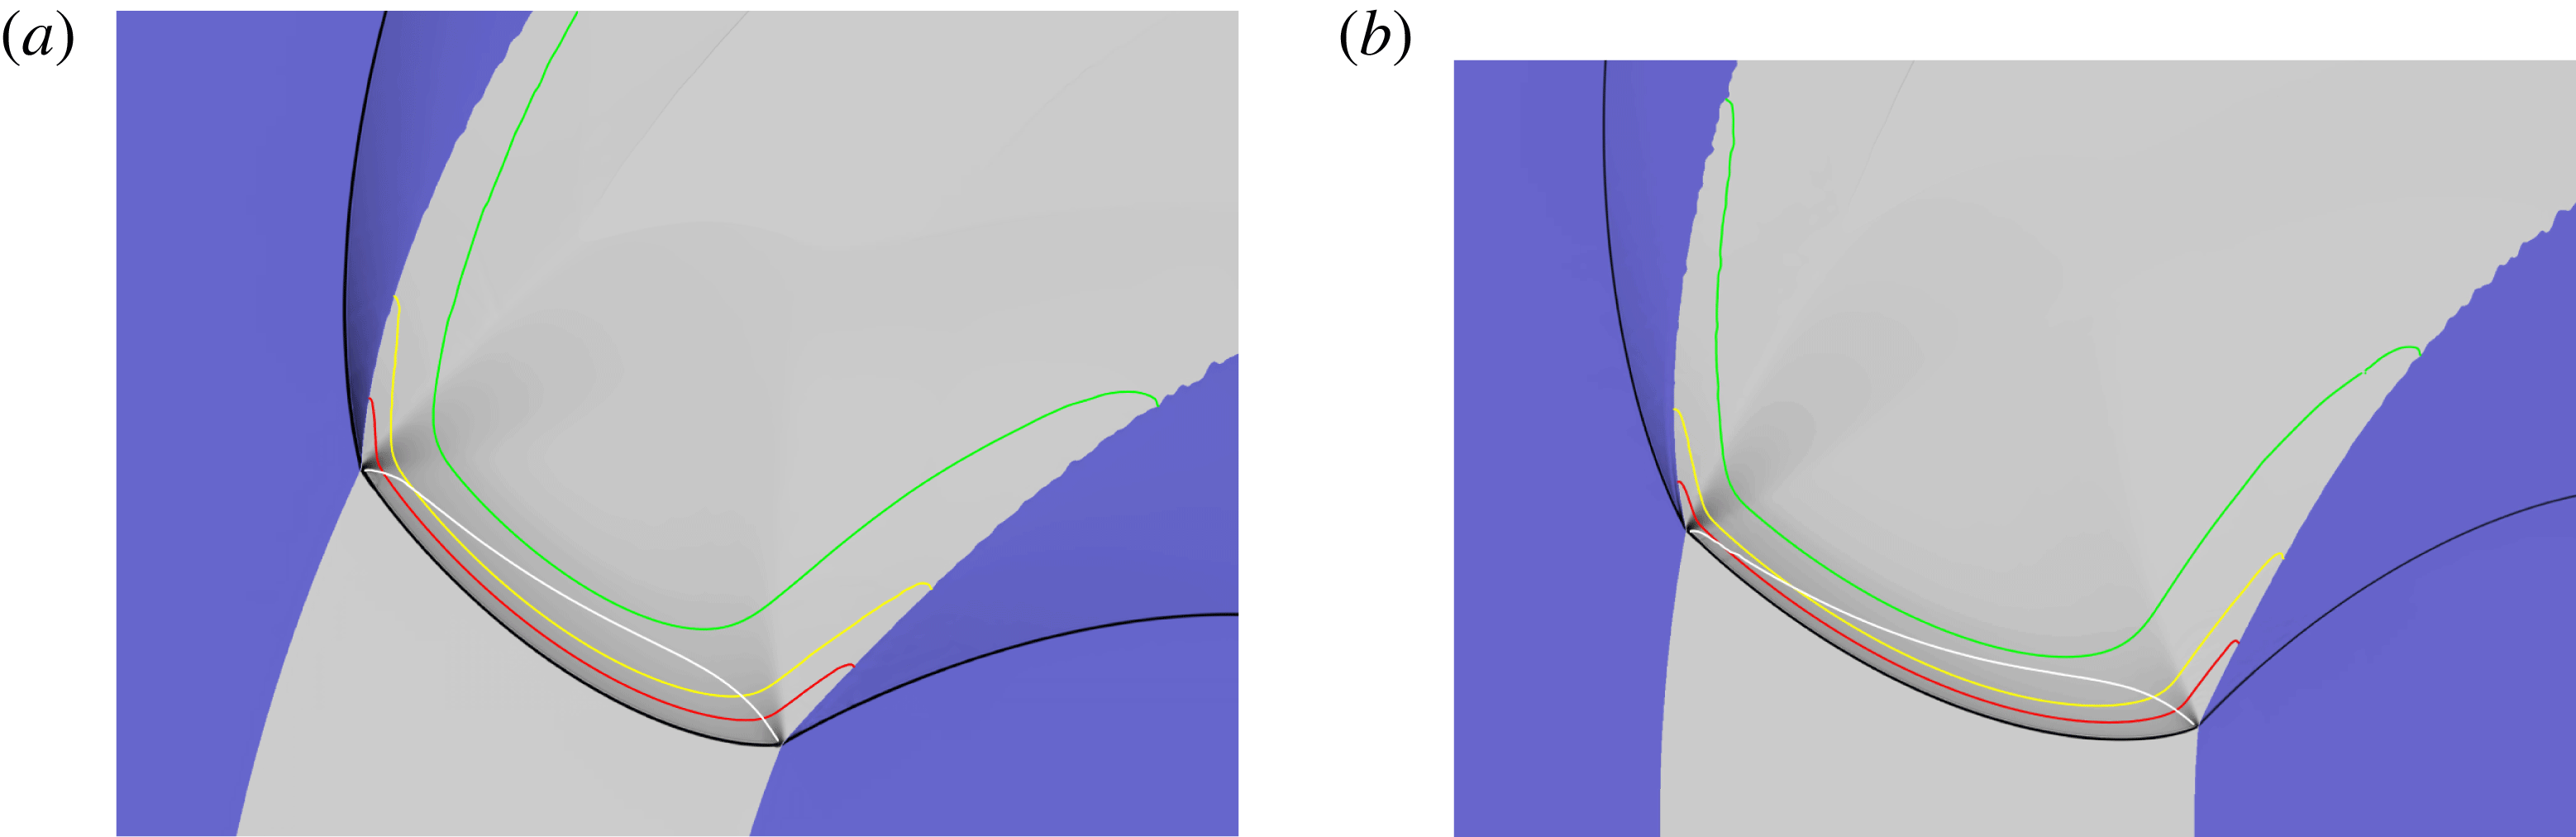
. The white line is the sonic flow contour in the HE region in a frame travelling with the steady detonation front. The red and yellow lines represent 50 % and 75 % reactant depletion contours, respectively. The green lines that appear in figures 12–16 below represent 99 % reactant depletion contours. The lower left hand corner
 $(LLHC)$
of the image is at the location
 $(-122.13,32.91)$
in the computational domain (see § 2.1). The image represents a domain width
 $(W)$
of
 $57.53$
and height
 $(H)$
of
 $43.88$
. (b)
 $R_{e}=120$
, with
 $LLHC=(-133.20,0.75)$
,
 $W=56.37$
and
 $H=46.39$
.

As for figure 11, with (a)
 $R_{e}=125$
,
 $LLHC=(-139.41,8.67)$
,
 $W=66.71$
,
 $H=47.45$
, and (b)
 $R_{e}=130$
,
 $LLHC=(-135.86,16.17)$
,
 $W=68.32$
,
 $H=52.94$
.

5.3 Steady detonation front shape and sonic locus analysis
5.3.1 LIC-LIC
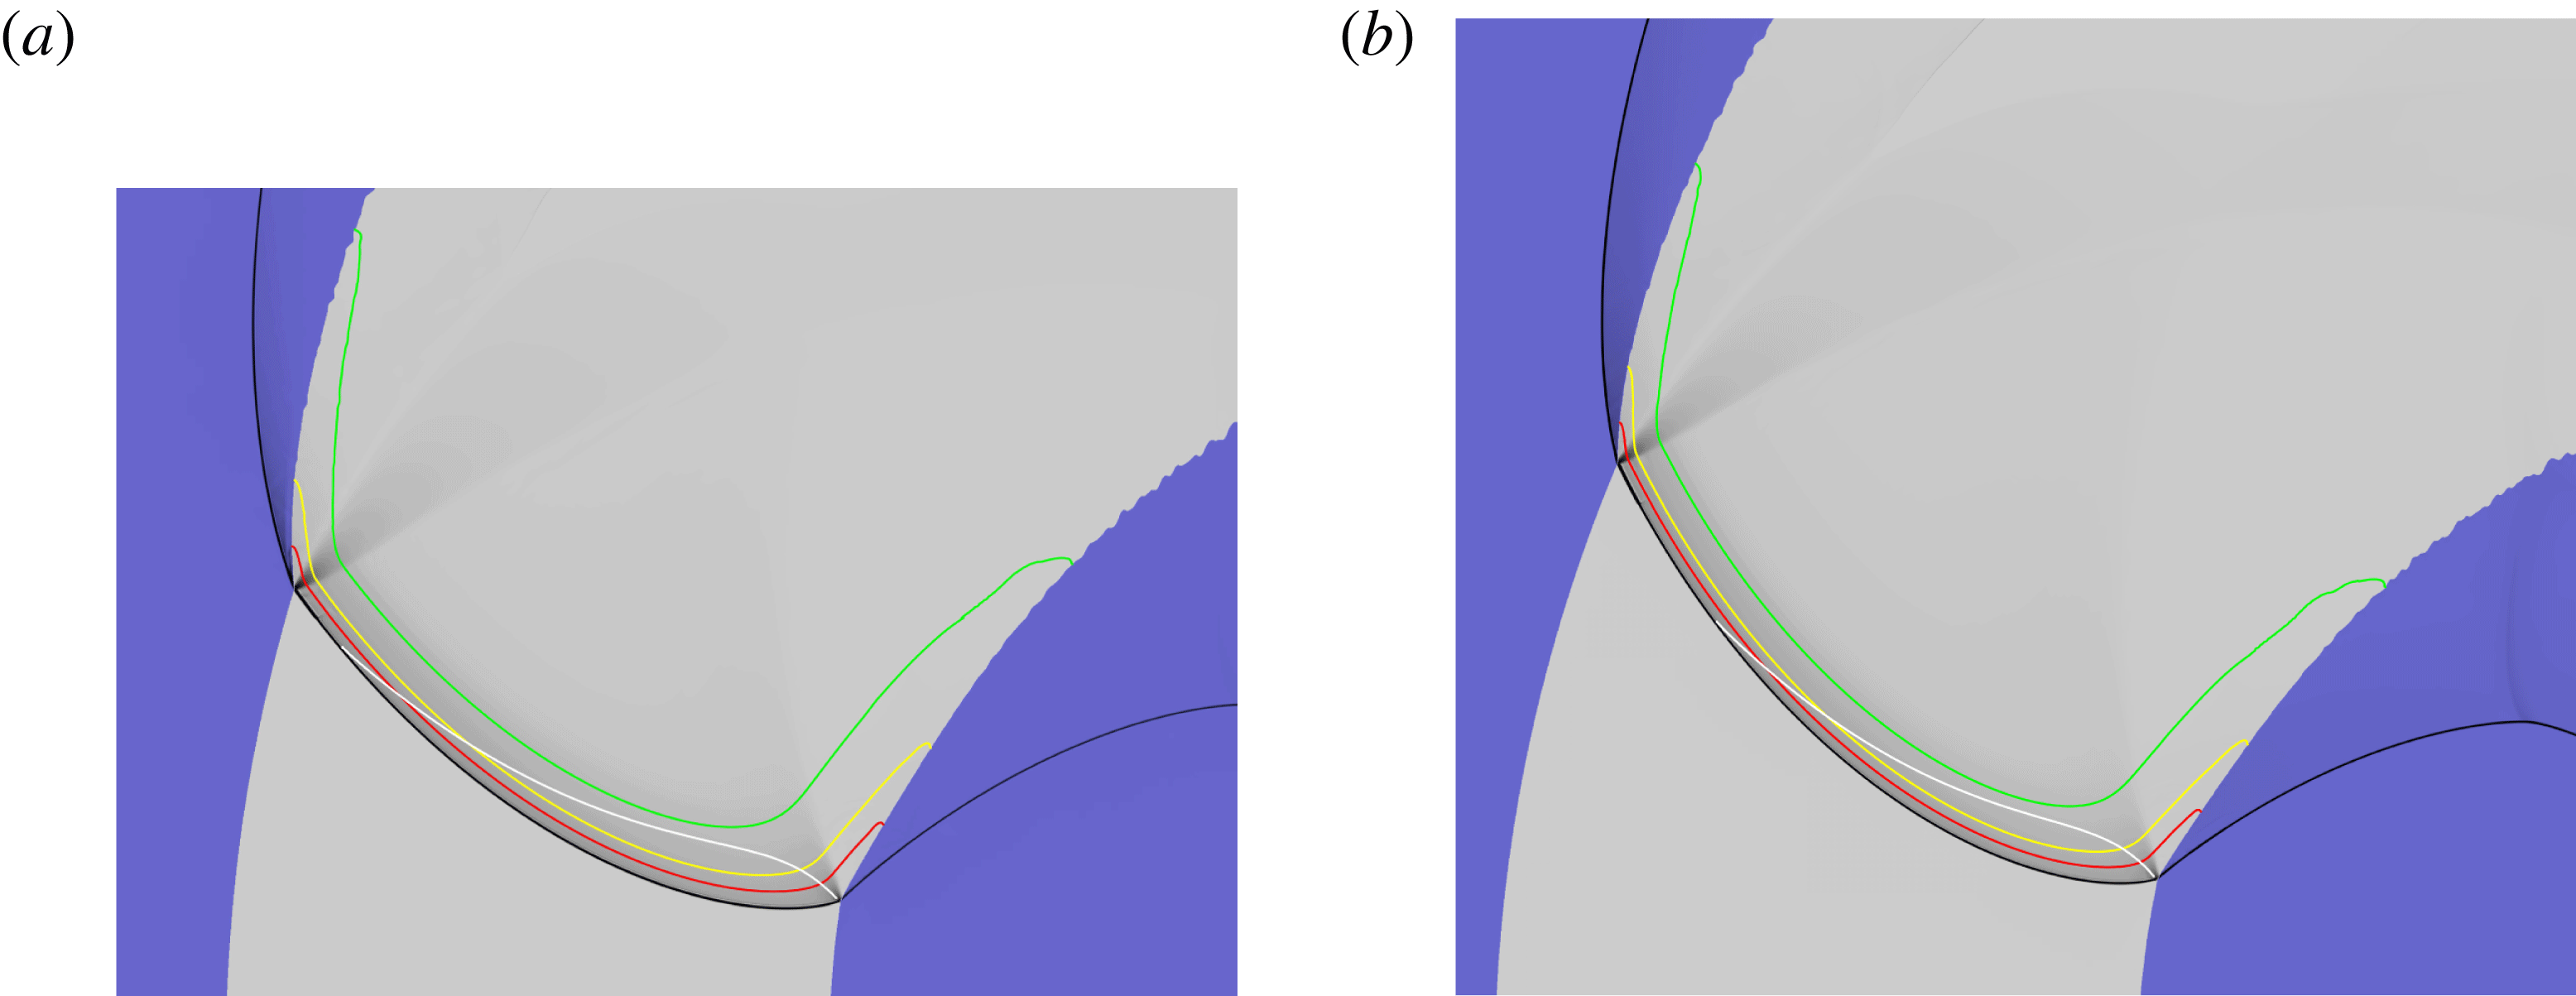
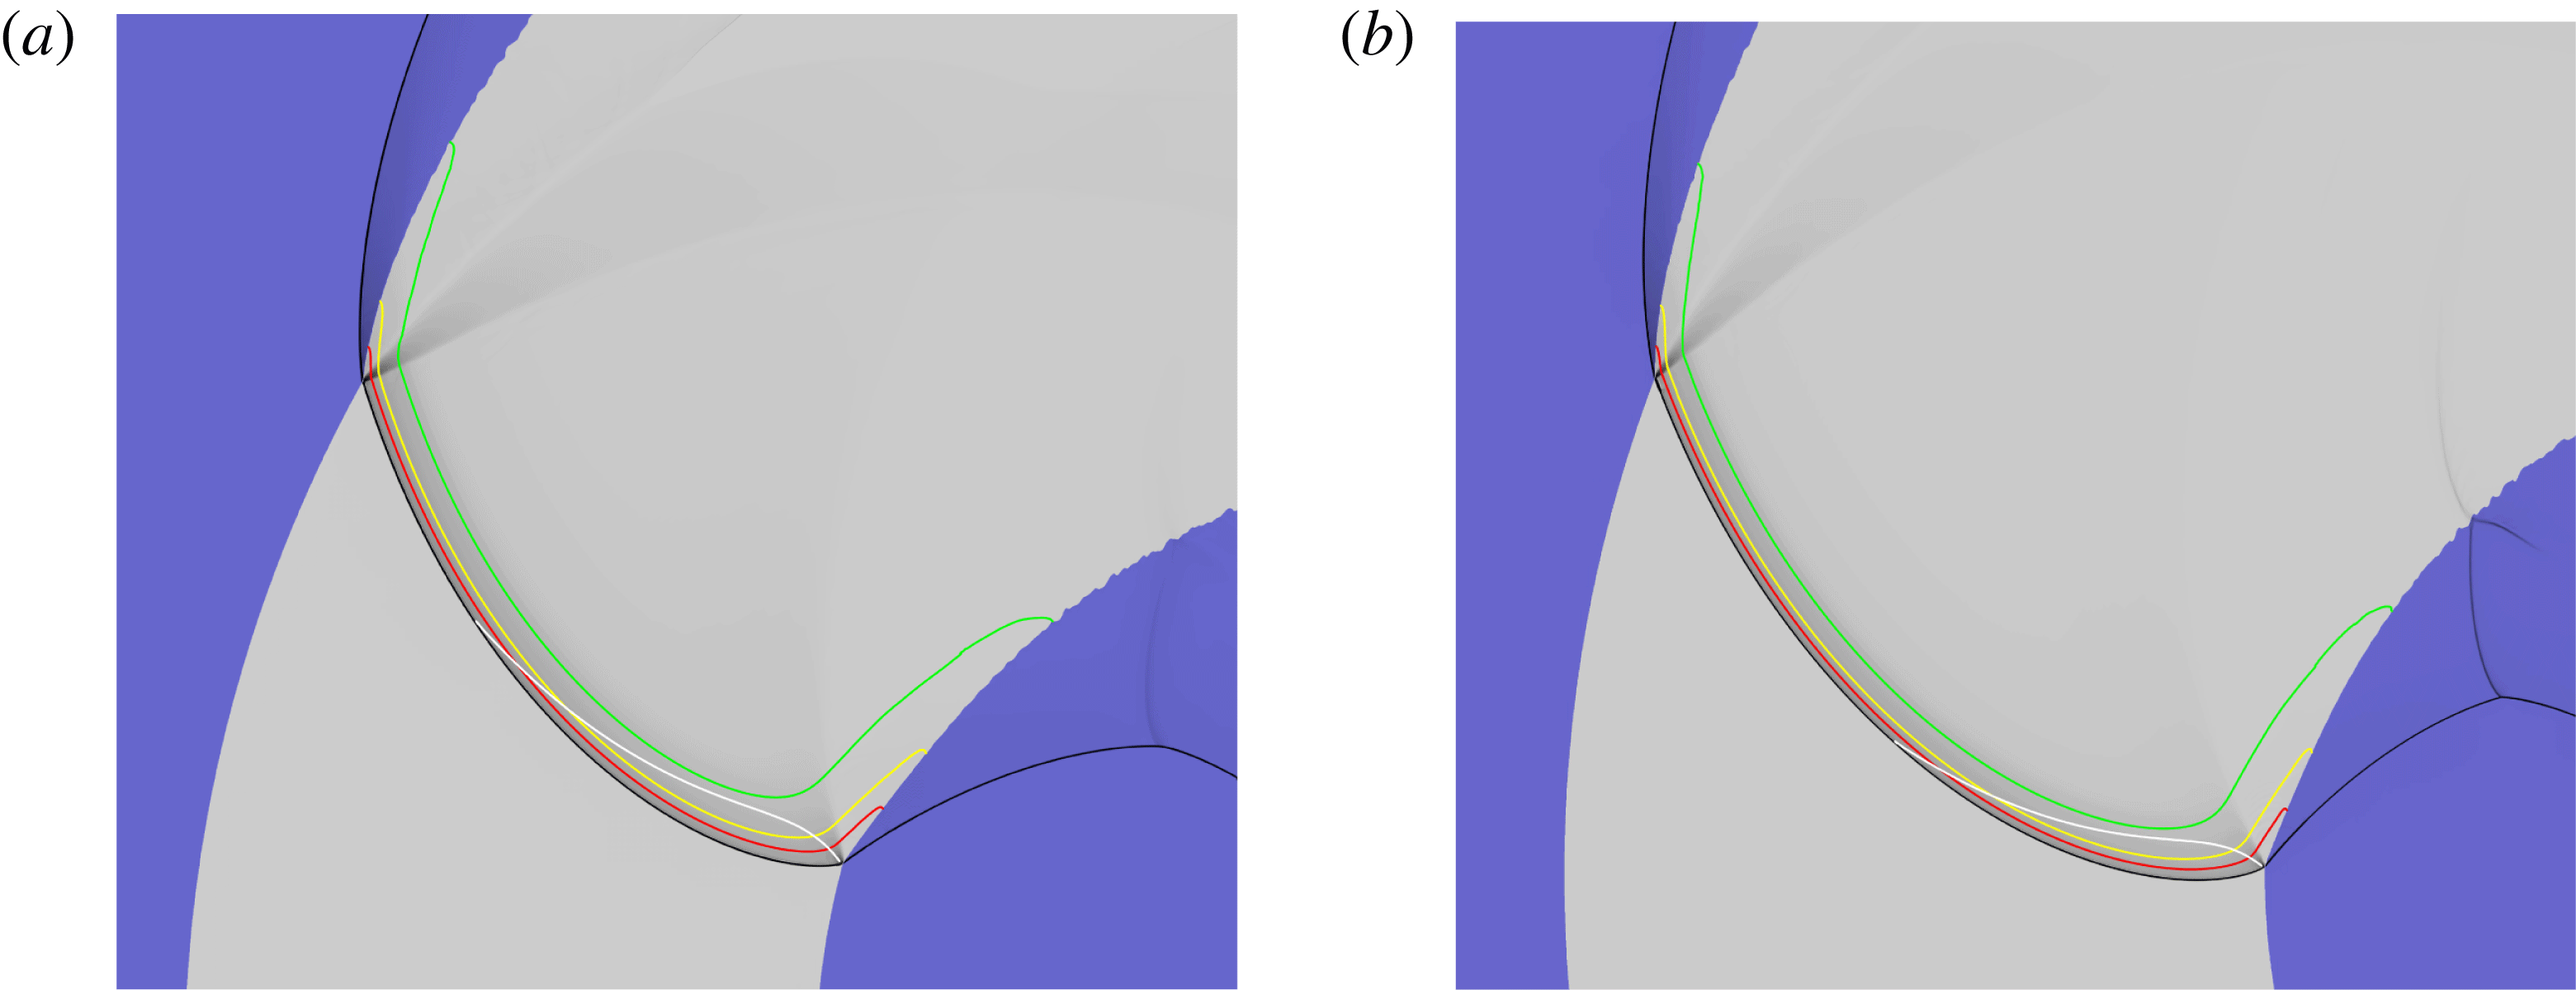
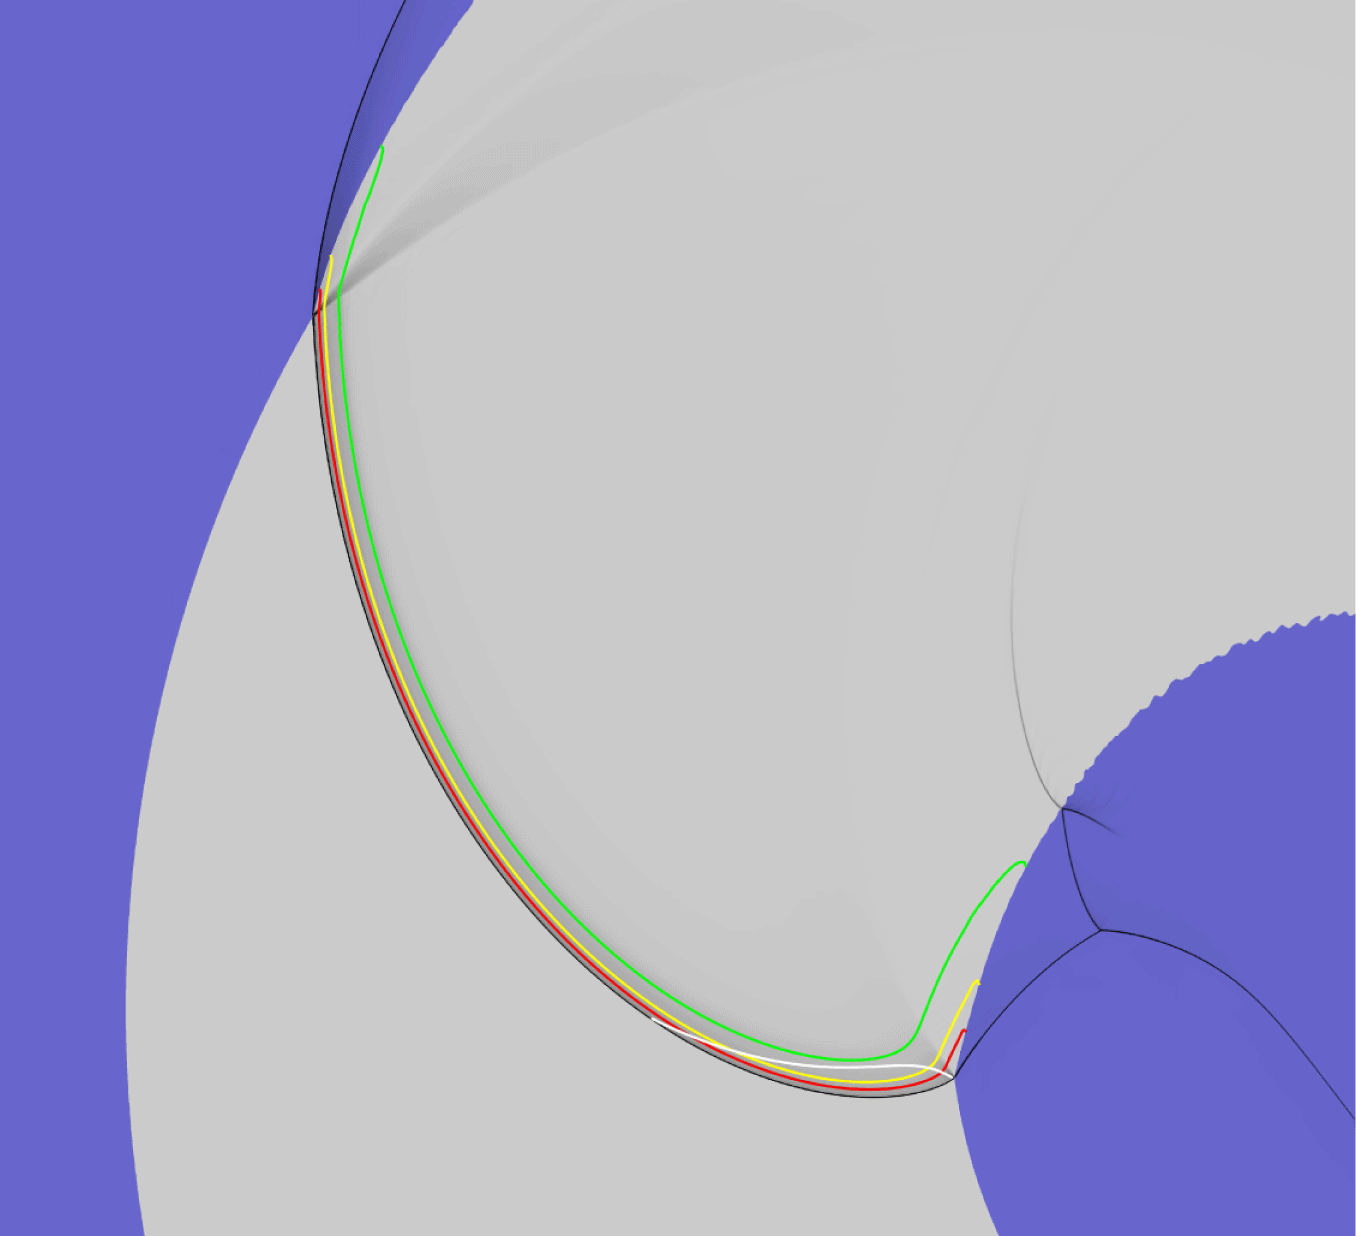
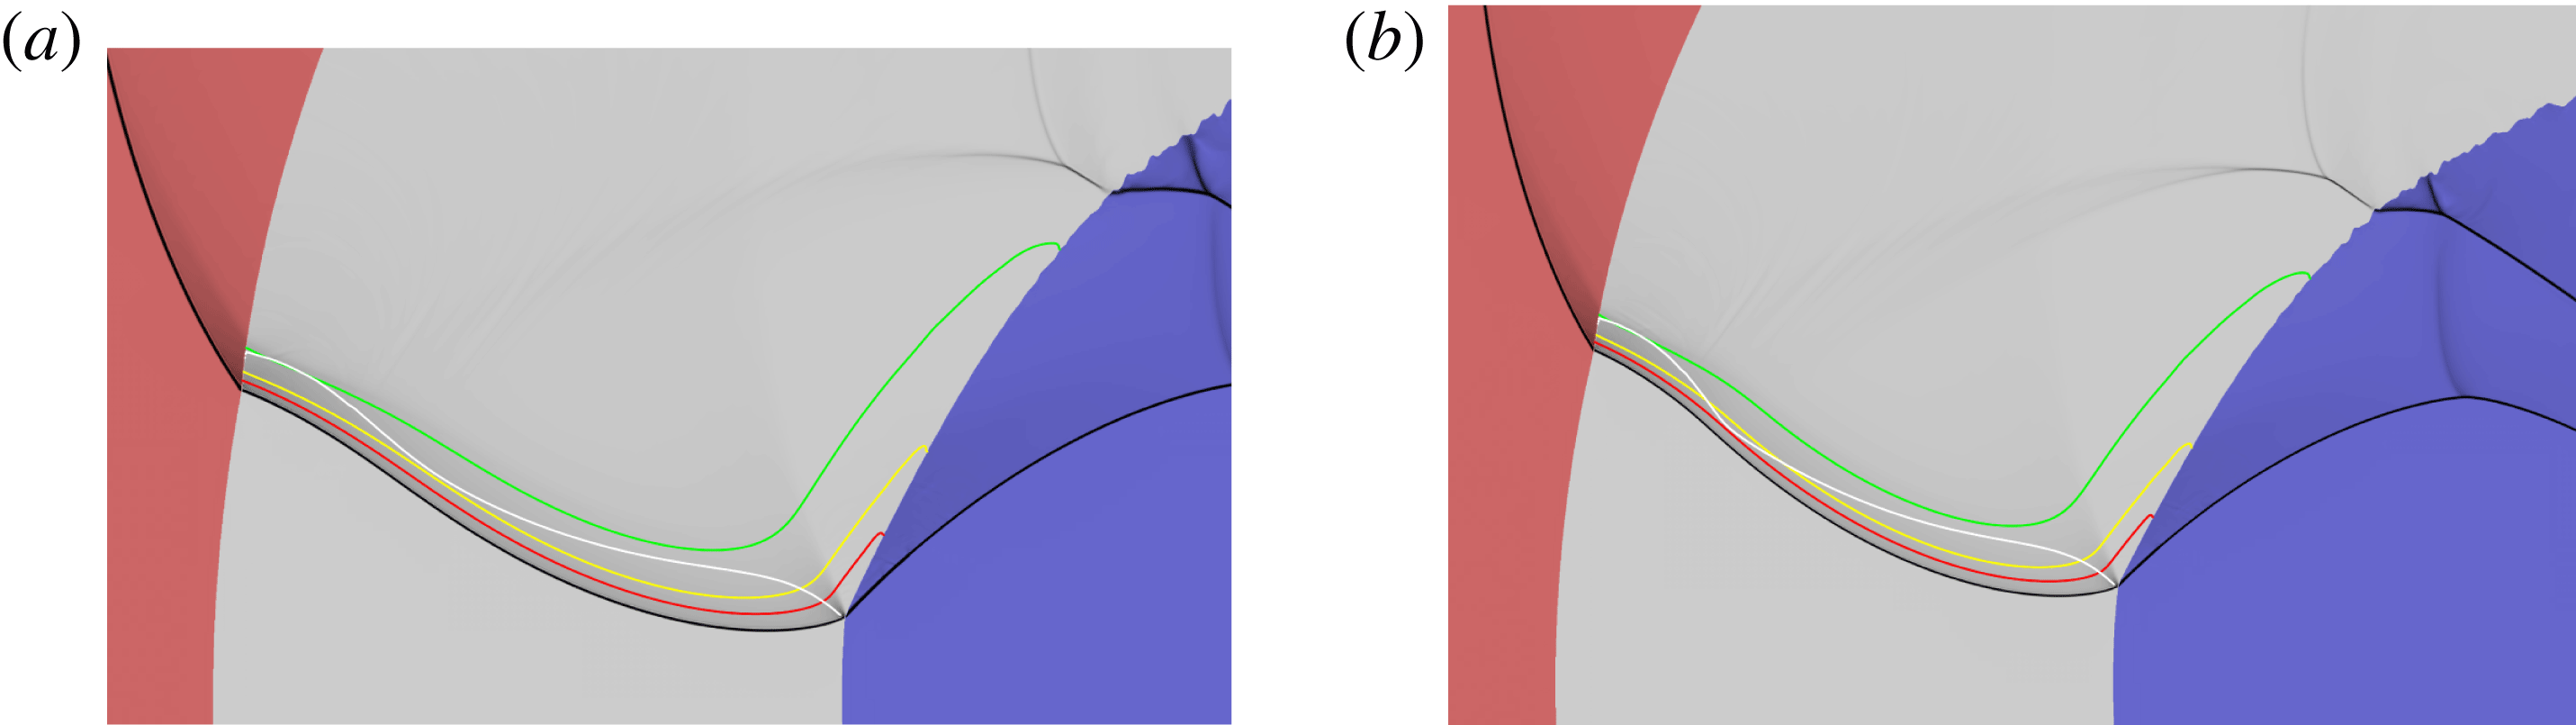
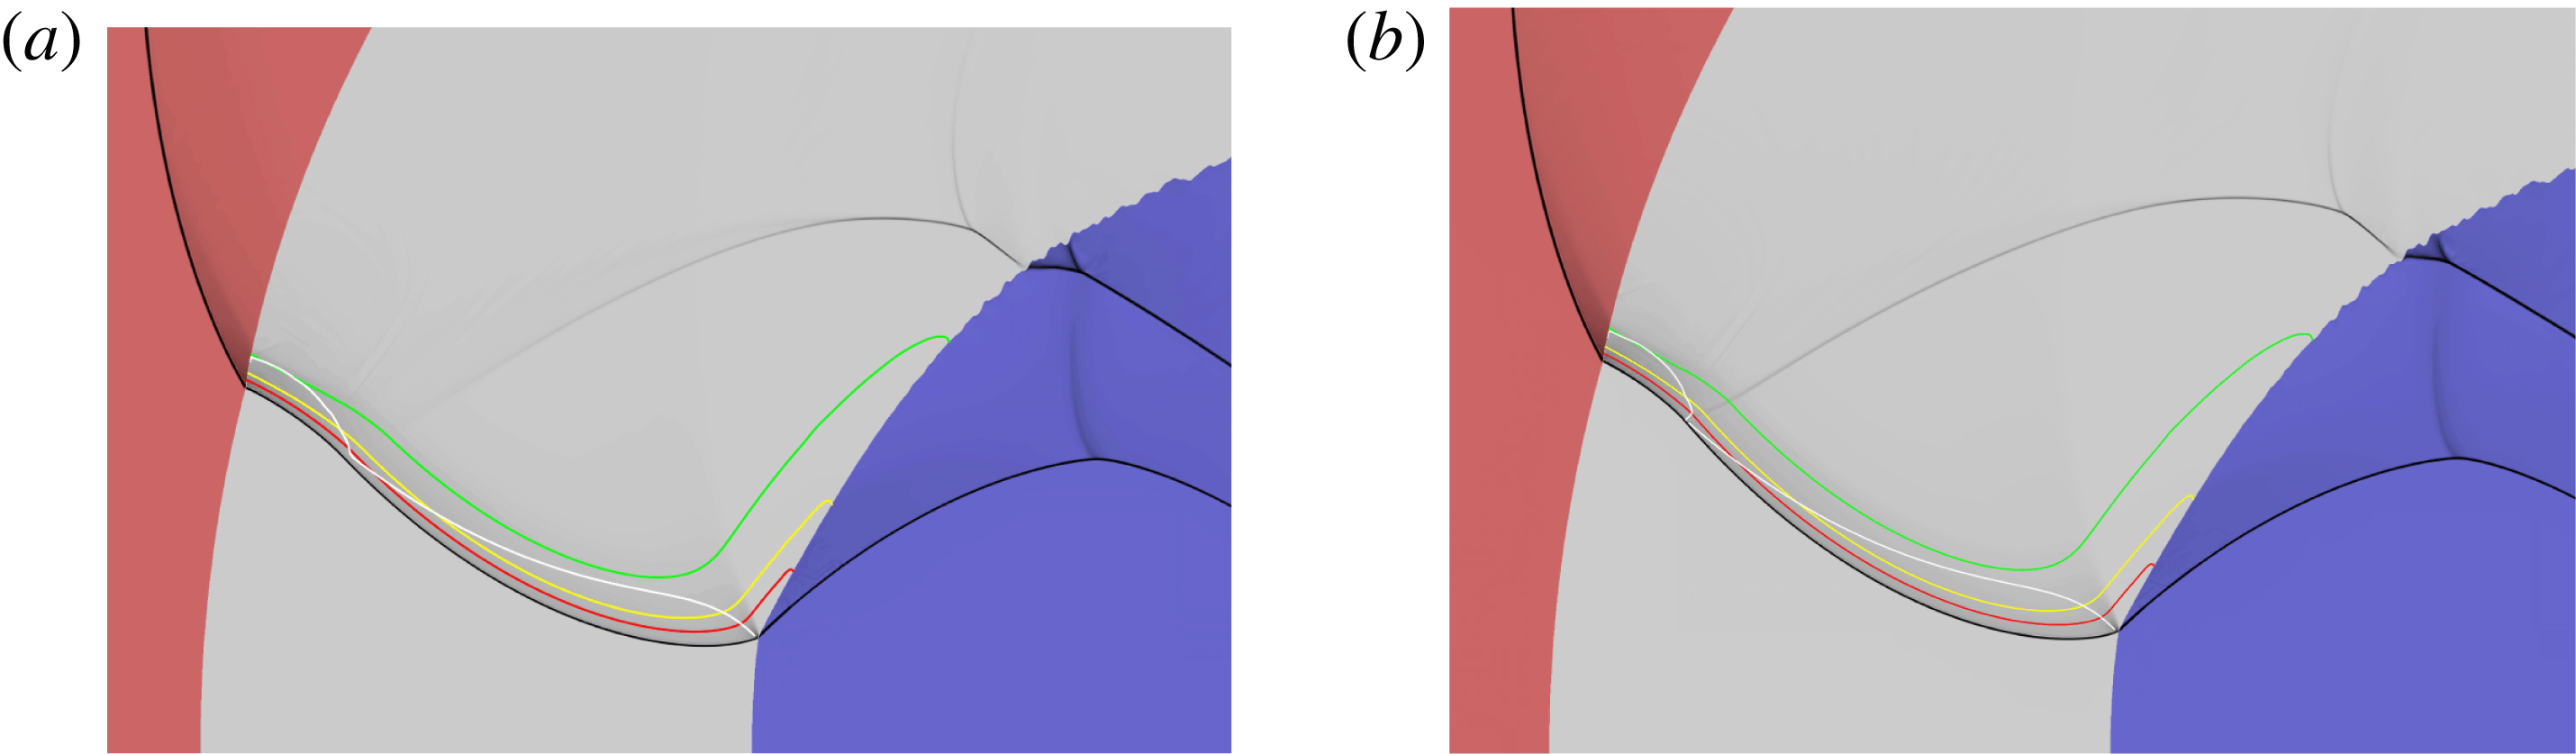
Figures 11–16 show weighted pressure gradient images that highlight the main flow structures (lead detonation shock, transmitted confiner shocks, PM fans) for steady propagating detonation waves in a series of varying arc widths with
 $R_{i}=100$
and with the LIC material on both the inner and outer arc surfaces. The DDZ structure is also shown, bounded by the detonation shock and sonic locus, along with various reactant depletion contours. Corresponding spatial variations of the detonation shock shape and the sonic locus for each outer radius
 $R_{e}$
are shown in figure 17. Figures 11–13 show the DDZ and wave structure for
 $R_{e}$
ranging from
 $R_{e}=115$
to
 $R_{e}=150$
. In each case, the sonic line intersects the lead detonation shock close to the inner and outer arc boundaries. A PM fan is evident at the detonation shock-material interface intersection points on both the inner and outer arcs, and thus for each case both the structure of the DDZ and the angular detonation speed are independent of the specific material properties of the LIC confinement. The observed inner and outer arc boundary interaction PM fan structures are consistent with the polar analysis described in § 3. Associated with this, we observe that the rate of reaction is lower near the inner and outer arc boundaries relative to that in the central section of the arc. The spatial variation of the DDZ structures with increasing
 $R_{e}$
in the range
 $R_{e}=115{-}150$
are shown in figure 17. The area of the DDZ grows significantly as
 $R_{e}$
increases, with the detonation shock becoming globally flatter. Moreover, the amount of reactant being depleted within the DDZ region increases as
 $R_{e}$
increases (figures 11–13). This results in an increase in the angular speed at which the detonation sweeps around the arc with increasing
 $R_{e}$
. Note that the angle that the incident detonation shock makes with the tangent to the outer arc surface decreases with increasing arc thickness (figure 17).
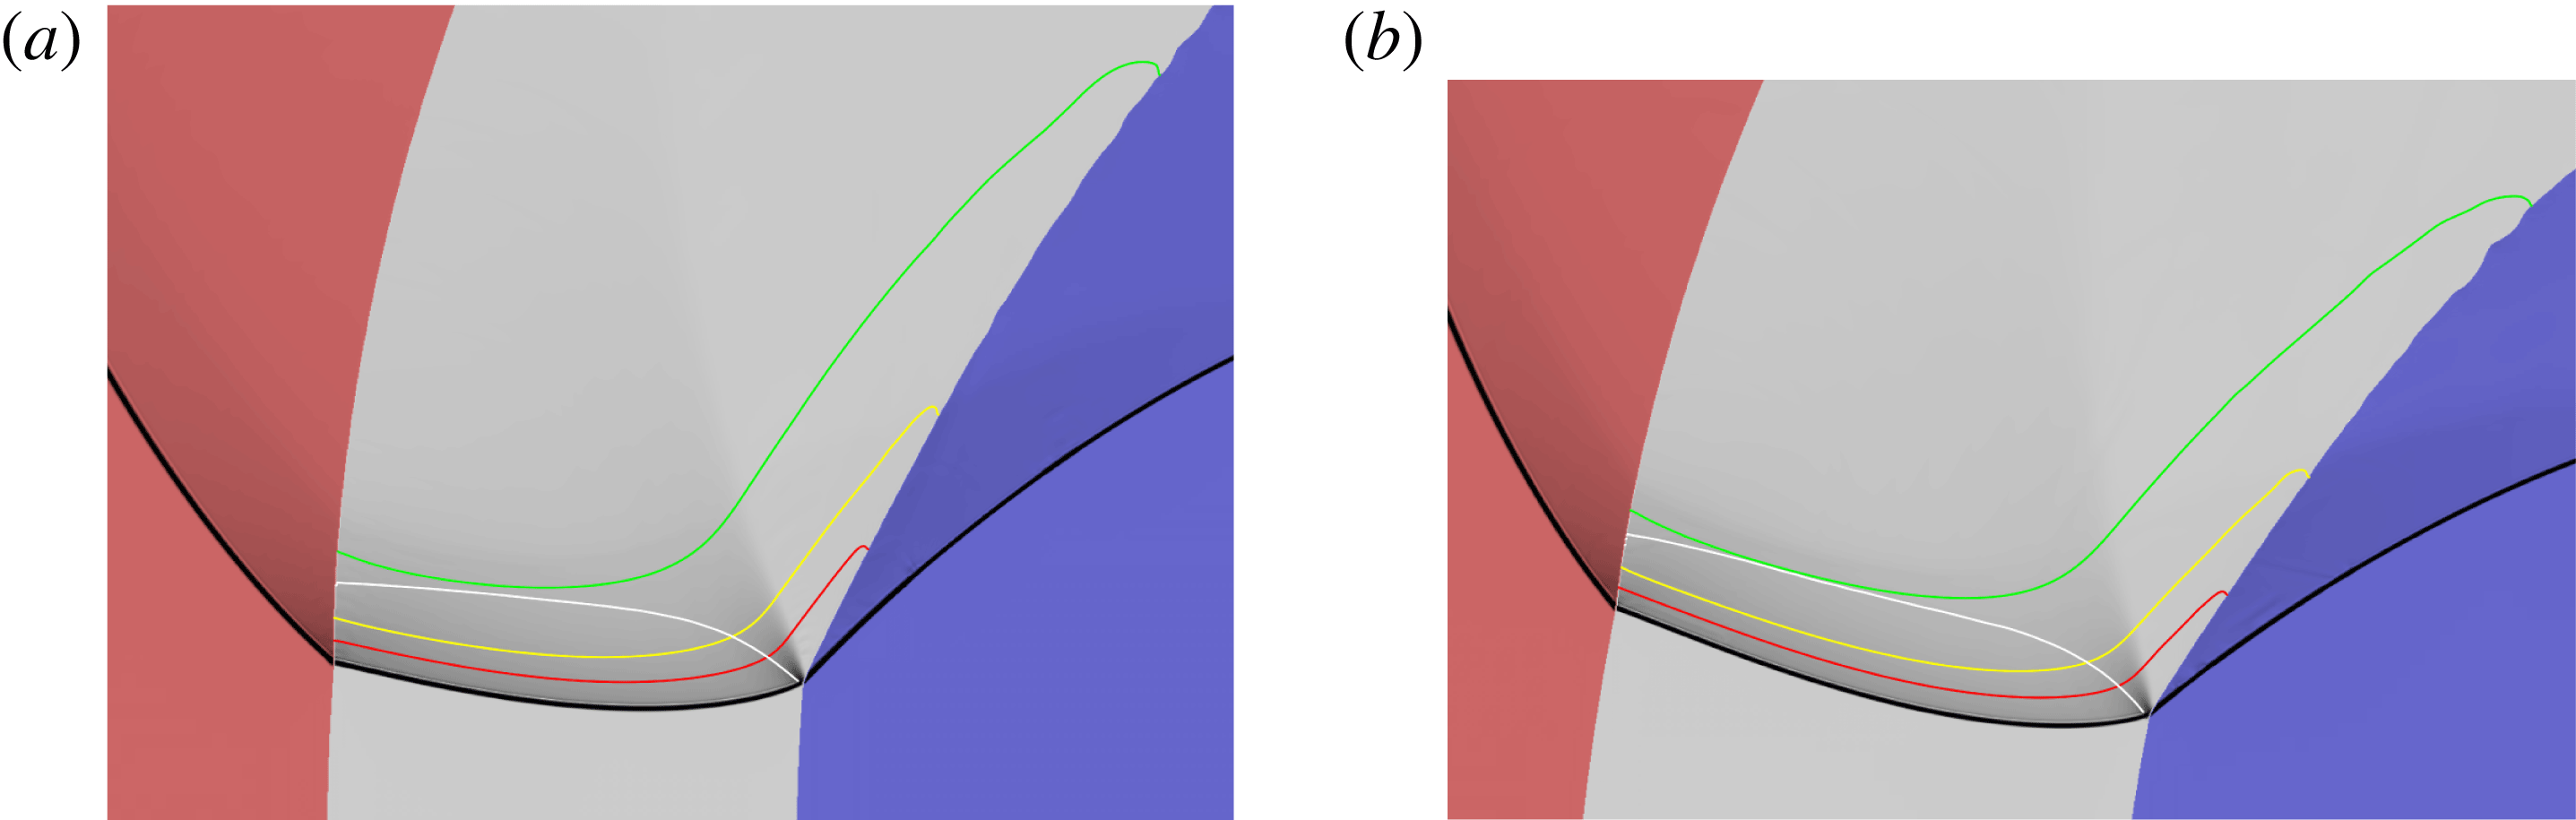
As for figure 11, with (a)
 $R_{e}=140$
,
 $LLHC=(-146.39,29.93)$
,
 $W=90.34$
,
 $H=66.39$
, and (b)
 $R_{e}=150$
,
 $LLHC=(-169.22,-1.70)$
,
 $W=104.88$
,
 $H=72.56$
.

As for figure 11, with (a)
 $R_{e}=160$
,
 $LLHC=(-170.83,5.75)$
,
 $W=111.28$
,
 $H=80.03$
, and (b)
 $R_{e}=170$
,
 $LLHC=(-174.18,8.27)$
,
 $W=121.84$
,
 $H=106.22$
.

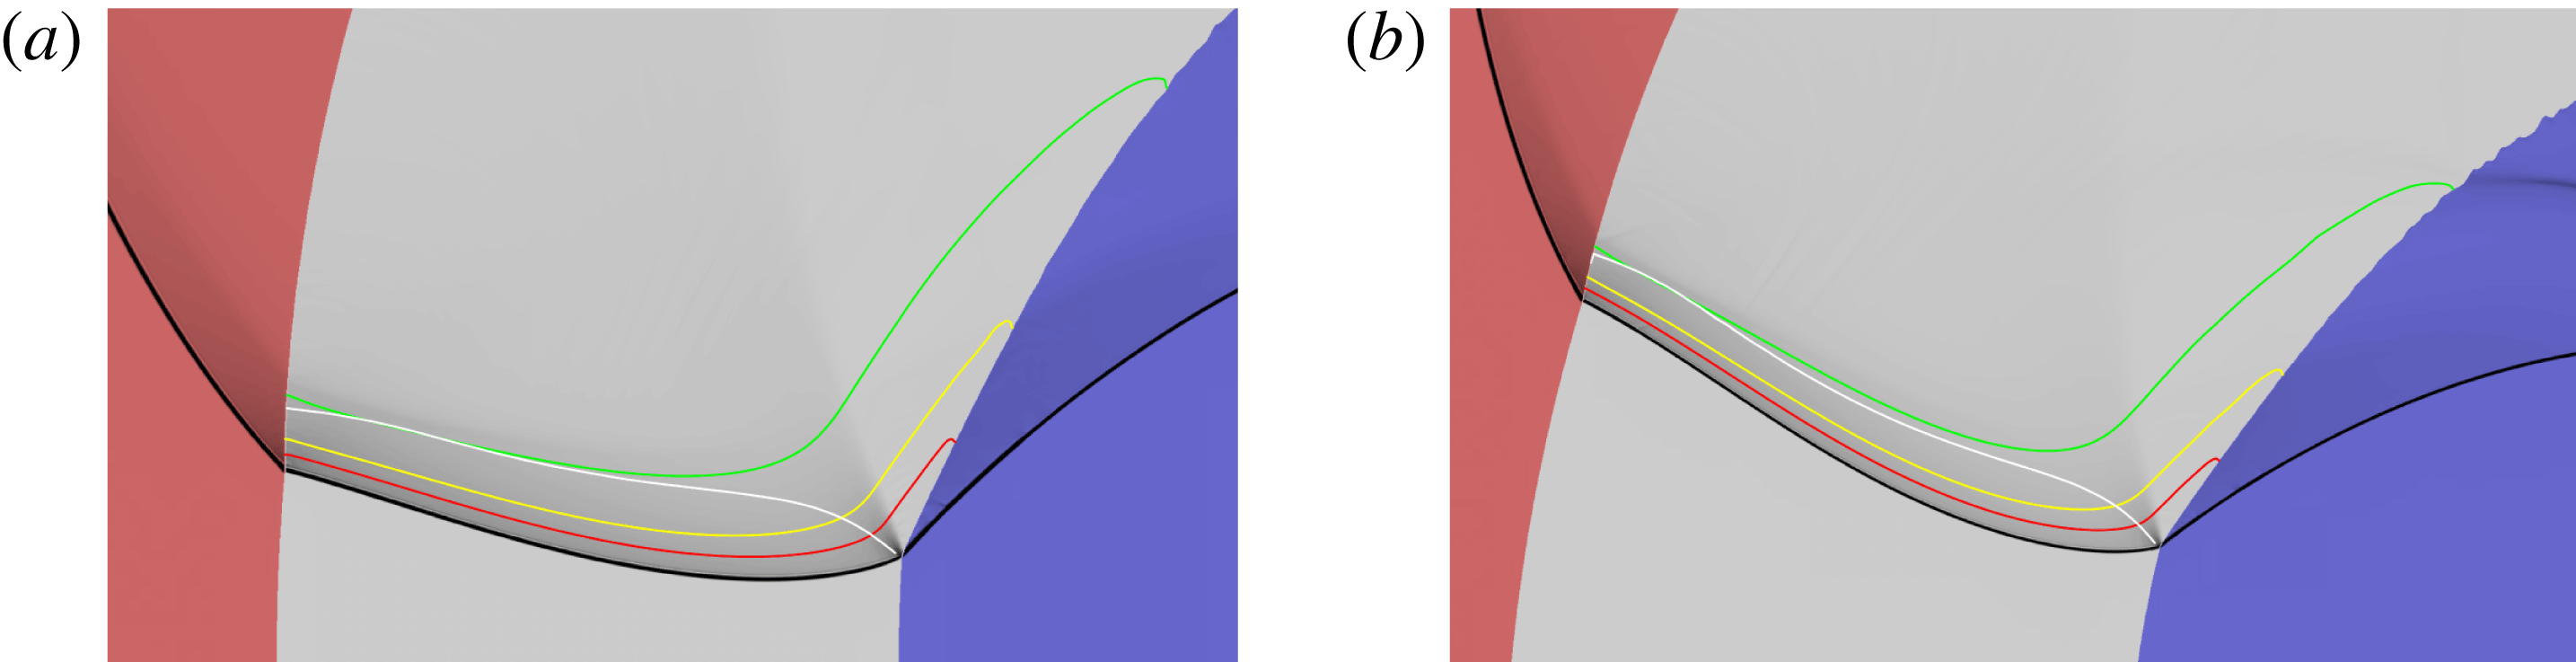
As for figure 11, with (a)
 $R_{e}=180$
,
 $LLHC=(-180.57,10.48)$
,
 $W=141.90$
,
 $H=123.49$
. (b)
 $R_{e}=200$
,
 $LLHC=(-215.31,-16.33)$
,
 $W=159.52$
,
 $H=137.76$
.

As for figure 11, with
 $R_{e}=250$
,
 $LLHC=(-272.62,-40.87)$
,
 $W=246.03$
,
 $H=224.60$
.

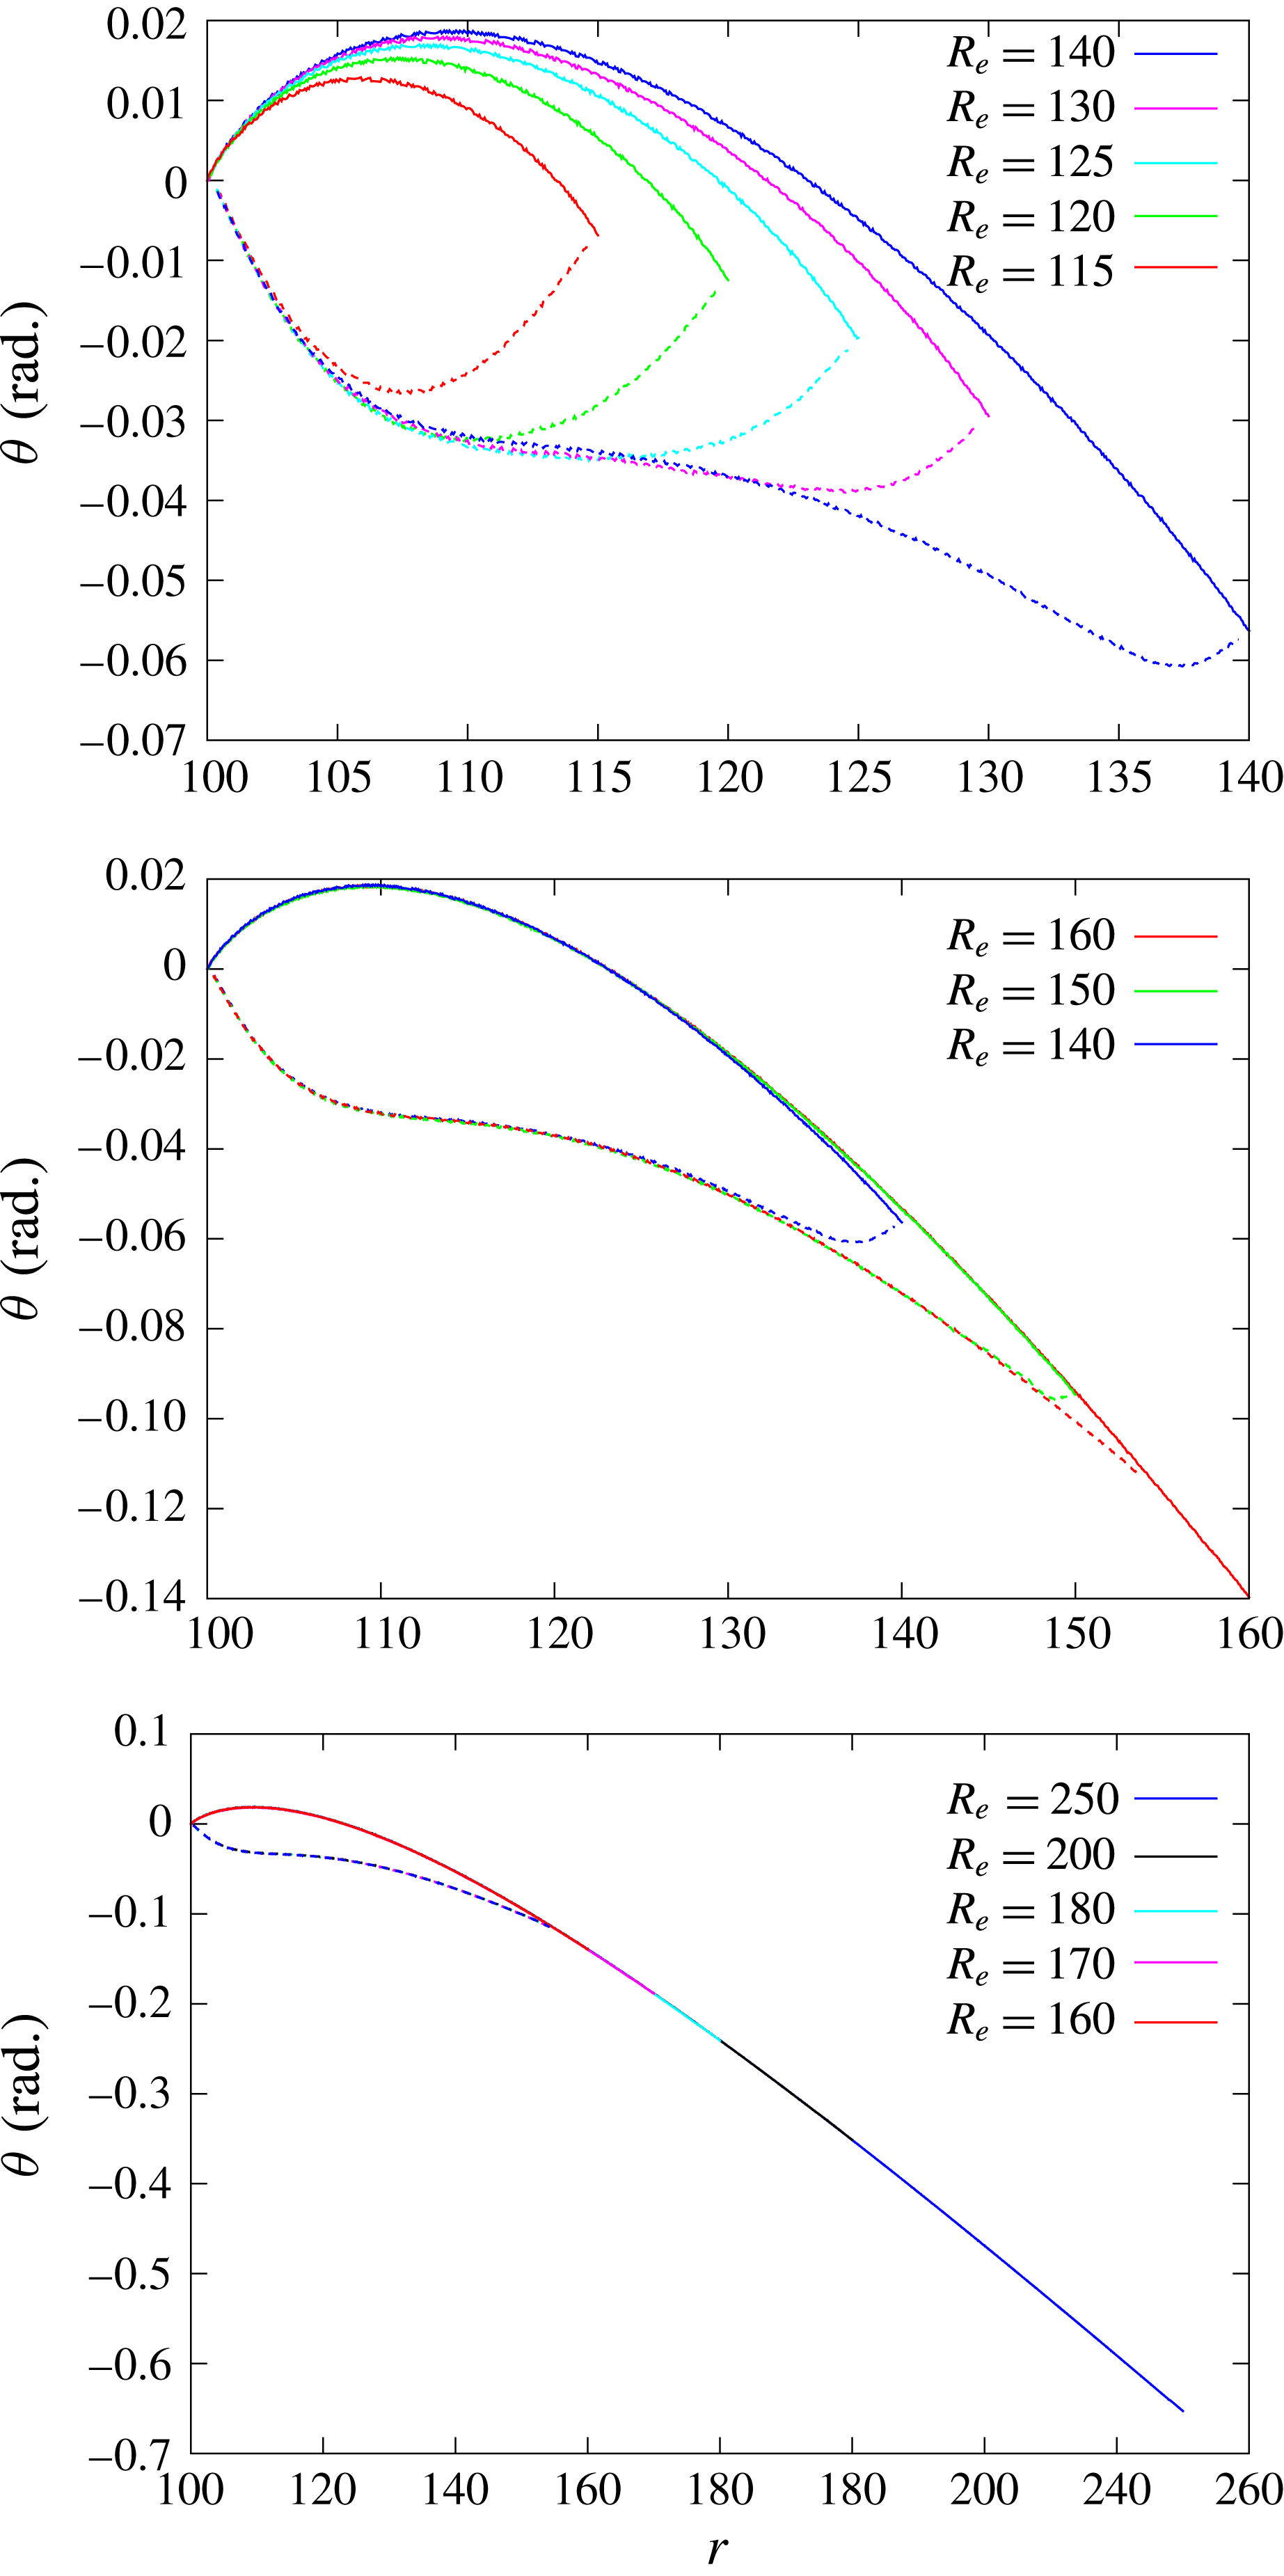
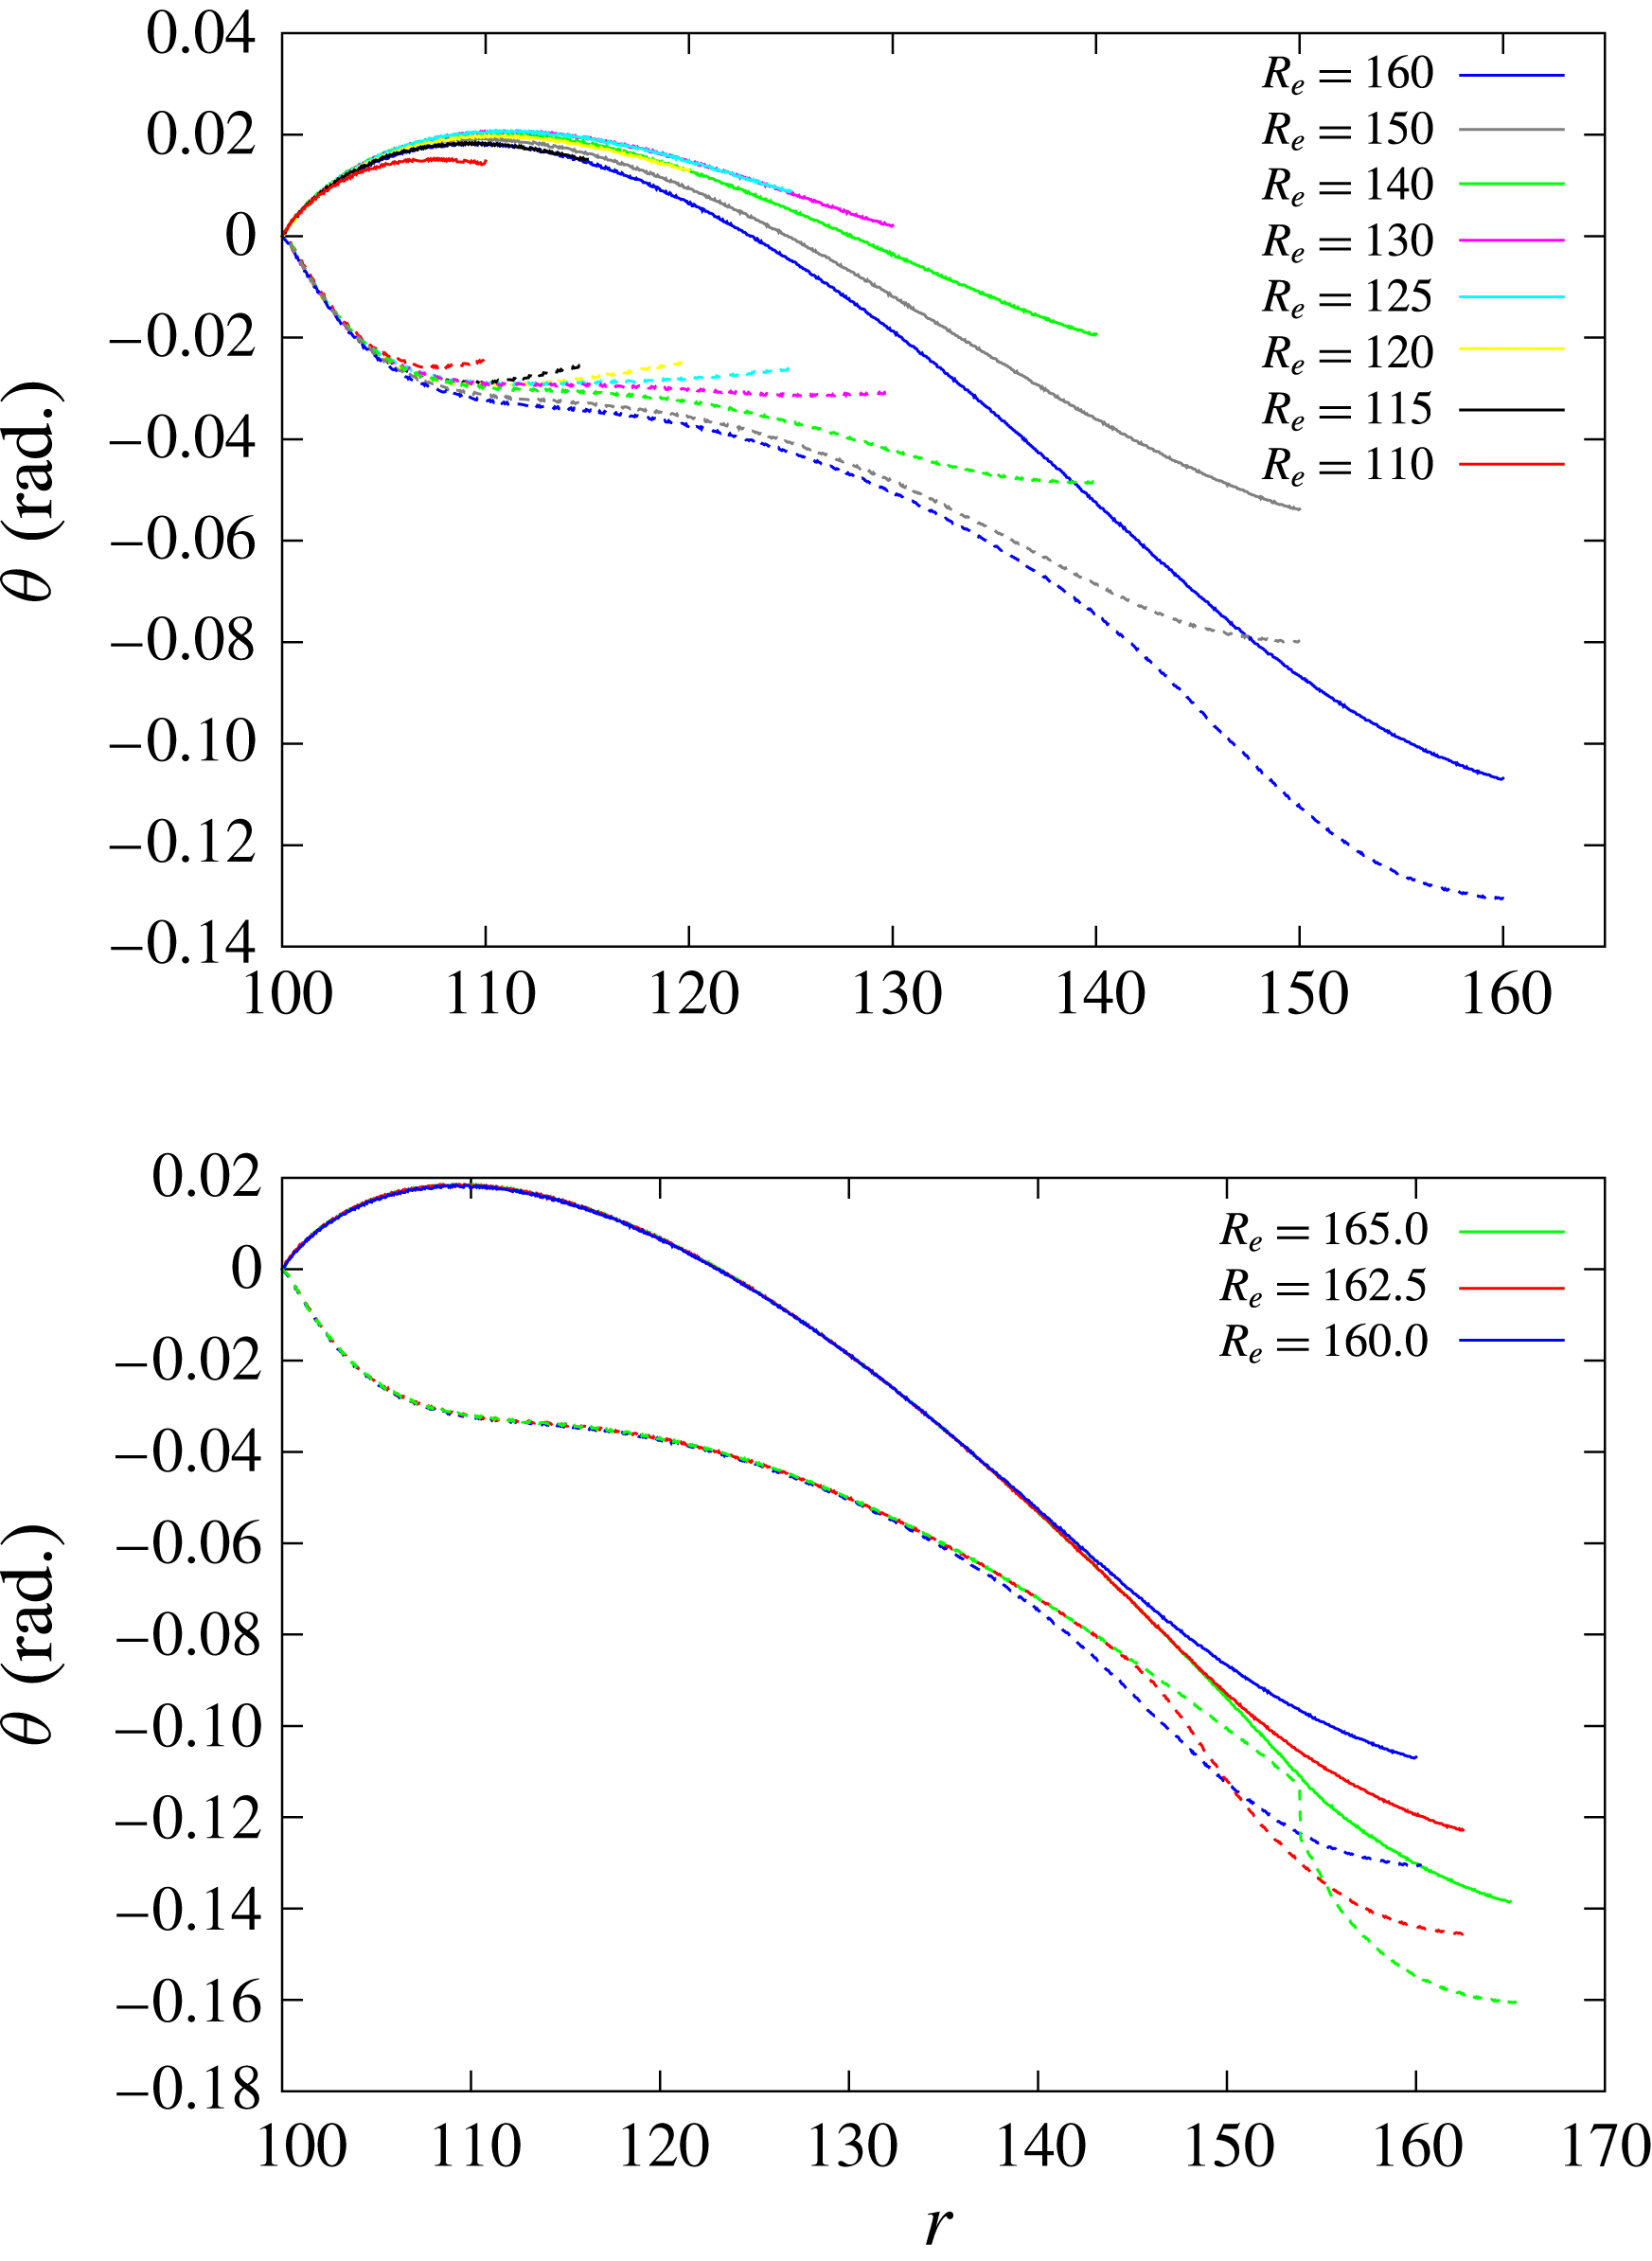
Comparison of the steady detonation shock (solid lines) and sonic (dashed lines) loci for the outer arc radii
 $(R_{e})$
indicated, corresponding to figures 11–16. The loci are represented by their polar angle variation as a function of radial coordinate. The reference point for each radius
 $R_{e}$
is set such the polar angle of the shock locus point on the inner arc boundary is set to zero.

At
 $R_{e}=150$
, a significant asymmetry has developed in the DDZ structure between the regions near the inner and outer arc surfaces. A pinching of the DDZ structure near the outer arc surface is evident. At
 $R_{e}=160$
(figure 14
a), the incident angle of the detonation shock to the outer arc surface becomes too low to sustain sonic flow at the arc boundary. The sonic edge of the DDZ structure has moved internal to the arc (figures 14
a and 17). Except for a narrow region at the edge of the DDZ for
 $R_{e}=160$
, the sonic locus and shock shape are essentially coincident with the DDZ structure for
 $R_{e}=150$
. The threshold radius at which detachment of the DDZ structure occurs from the outer arc surface appears to be
 $R_{e}\approx 154$
. Behind the detonation shock in the region between the outer edge of the DDZ and the outer arc radius, all reaction is occurring in supersonic flow. A reflected PM fan in the HE is present at the outer arc surface. Figures 14–16 show the DDZ structure for outer arc radii in the range
 $R_{e}=160{-}250$
. Once the DDZ detachment occurs, it is evident that the DDZ structure extending from the inner arc surface becomes spatially frozen. This is confirmed by the overlap of the spatial profiles of the detonation shock surface and sonic loci shown in figure 17 for different
 $R_{e}$
in the range 160–250. In each case, the DDZ extends from
 $R_{i}=100$
to
 $R_{e}\approx 154$
. With the DDZ structure now frozen, the region of supersonic flow behind the detonation shock between the outer edge of the DDZ structure and the outer arc surface grows. Figure 17 also shows that the shape of the oblique detonation shock from the end of the DDZ to the outer arc surface does not change spatially, but rather it is simply extended in space as
 $R_{e}$
increases. This may indicate that in the post shock supersonic flow region the two characteristics are pointing away from the shock. In each case, a reflected PM fan in the HE is observed at the outer arc surface. The freezing of the DDZ structure observed for
 $R_{e}>154$
, along with reaction occurring in supersonic flow outside of the DDZ region, is the reason that the angular speed of the detonation limits to a constant for sufficiently wide arcs (figure 8). The rate of reaction remains lower in regions near the inner and outer arc boundaries relative to that in the central section of the arc. Also, with increasing arc thickness, and with the detonation driving zone now spatially frozen, the radial extent of the DDZ originating at the inner arc surface that determines the angular speed makes up a smaller proportion of the arc thickness. This is consistent with the result obtained asymptotically by Short et al. (Reference Short, Quirk, Meyer and Chiquete2016) through a DSD model, in which the effects of curvature dependency of the DSD surface motion and confinement on the inner arc are felt in a narrow boundary layer near the inner arc boundary.
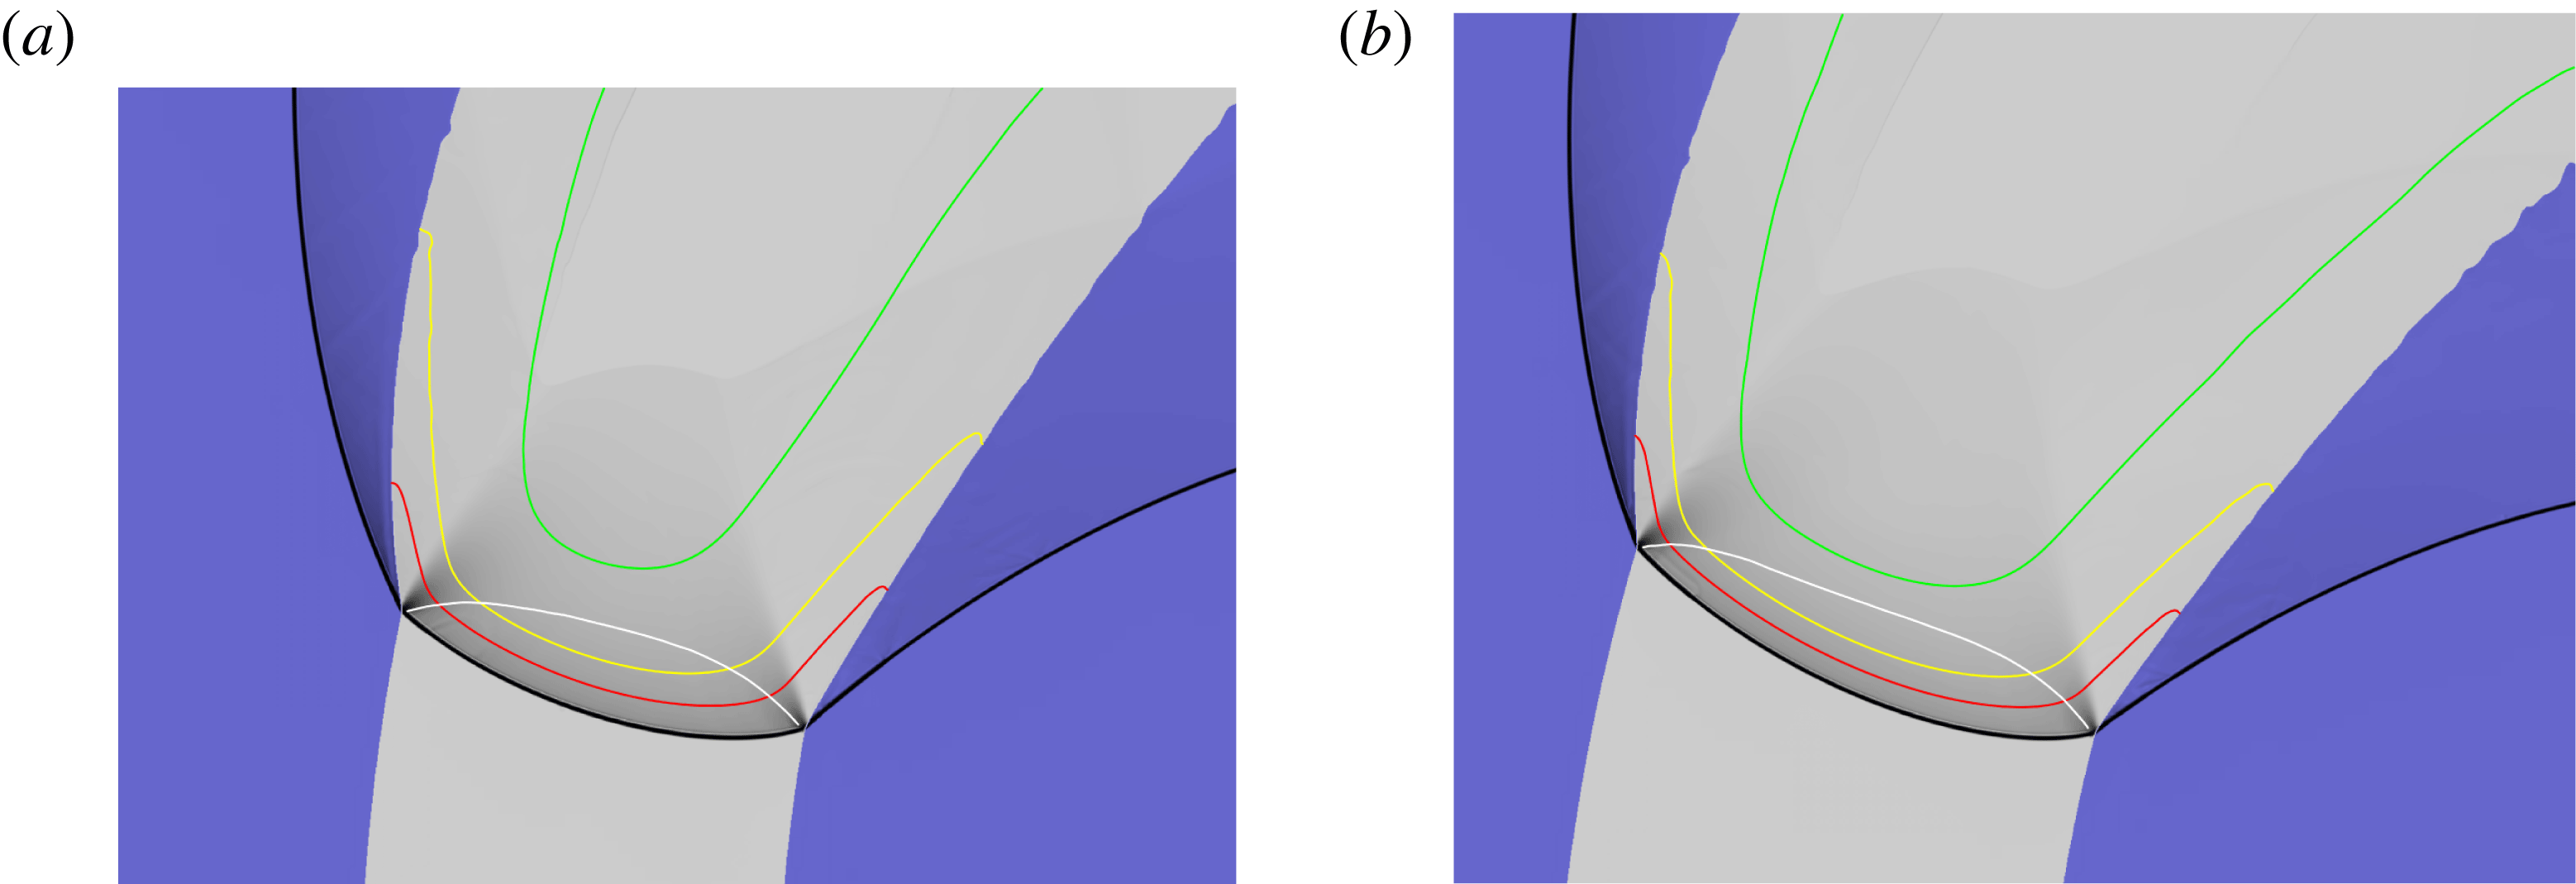
Weighted pressure gradient image representation of the steady detonation structure with LIC confinement on the inner arc surface and HIC confinement on the outer arc surface. (a)
 $R_{e}=115$
. The white line is the sonic flow contour in the HE region in a frame travelling with the steady detonation front. The red, yellow and green lines represent 50 %, 75 % and 99 % reactant depletion contours, respectively. The lower left hand corner
 $(LLHC)$
of the image is at the location
 $(-125.54,9.75)$
in the computational domain (see § 2.1). The image represents a domain width
 $(W)$
of
 $49.97$
and height
 $(H)$
of
 $37.78$
. (b)
 $R_{e}=120$
, with
 $LLHC=(-123.22,27.06)$
,
 $W=44.65$
and
 $H=33.55$
.

As for figure 18, with (a)
 $R_{e}=125$
,
 $LLHC=(-136.73,1.02)$
,
 $W=59.95$
,
 $H=43.37$
, and (b)
 $R_{e}=130$
,
 $LLHC=(-136.64,14.34)$
,
 $W=62.06$
,
 $H=40.68$
.

As for figure 18, with (a)
 $R_{e}=140$
,
 $LLHC=(-150.88,0.00)$
,
 $W=72.65$
,
 $H=41.90$
, and (b)
 $R_{e}=150$
,
 $LLHC=(-154.20,14.46)$
,
 $W=90.42$
,
 $H=52.44$
.

As for figure 18, with (a)
 $R_{e}=160$
,
 $LLHC=(-170.07,-2.38)$
,
 $W=107.14$
,
 $H=64.46$
, and (b)
 $R_{e}=162.5$
,
 $LLHC=(-174.49,-4.76)$
,
 $W=126.36$
,
 $H=80.61$
.

As for figure 18, with (a)
 $R_{e}=163.75$
,
 $LLHC=(-174.49,-1.02)$
,
 $W=129.76$
,
 $H=83.67$
, and (b)
 $R_{e}=165$
,
 $LLHC=(-176.53,-0.34)$
,
 $W=130.27$
,
 $H=86.05$
.

As for figure 18, with (a)
 $R_{e}=170$
,
 $LLHC=(-177.89,5.44)$
,
 $W=132.31$
,
 $H=84.01$
, and (b)
 $R_{e}=180$
,
 $LLHC=(-188.61,-6.29)$
,
 $W=147.11$
,
 $H=92.01$
.

As for figure 18, with (a)
 $R_{e}=200$
,
 $LLHC=(-219.22,-1.70)$
,
 $W=184.52$
,
 $H=135.37$
, and (b)
 $R_{e}=250$
,
 $LLHC=(-287.50,-30.95)$
,
 $W=254.56$
,
 $H=202.38$
.

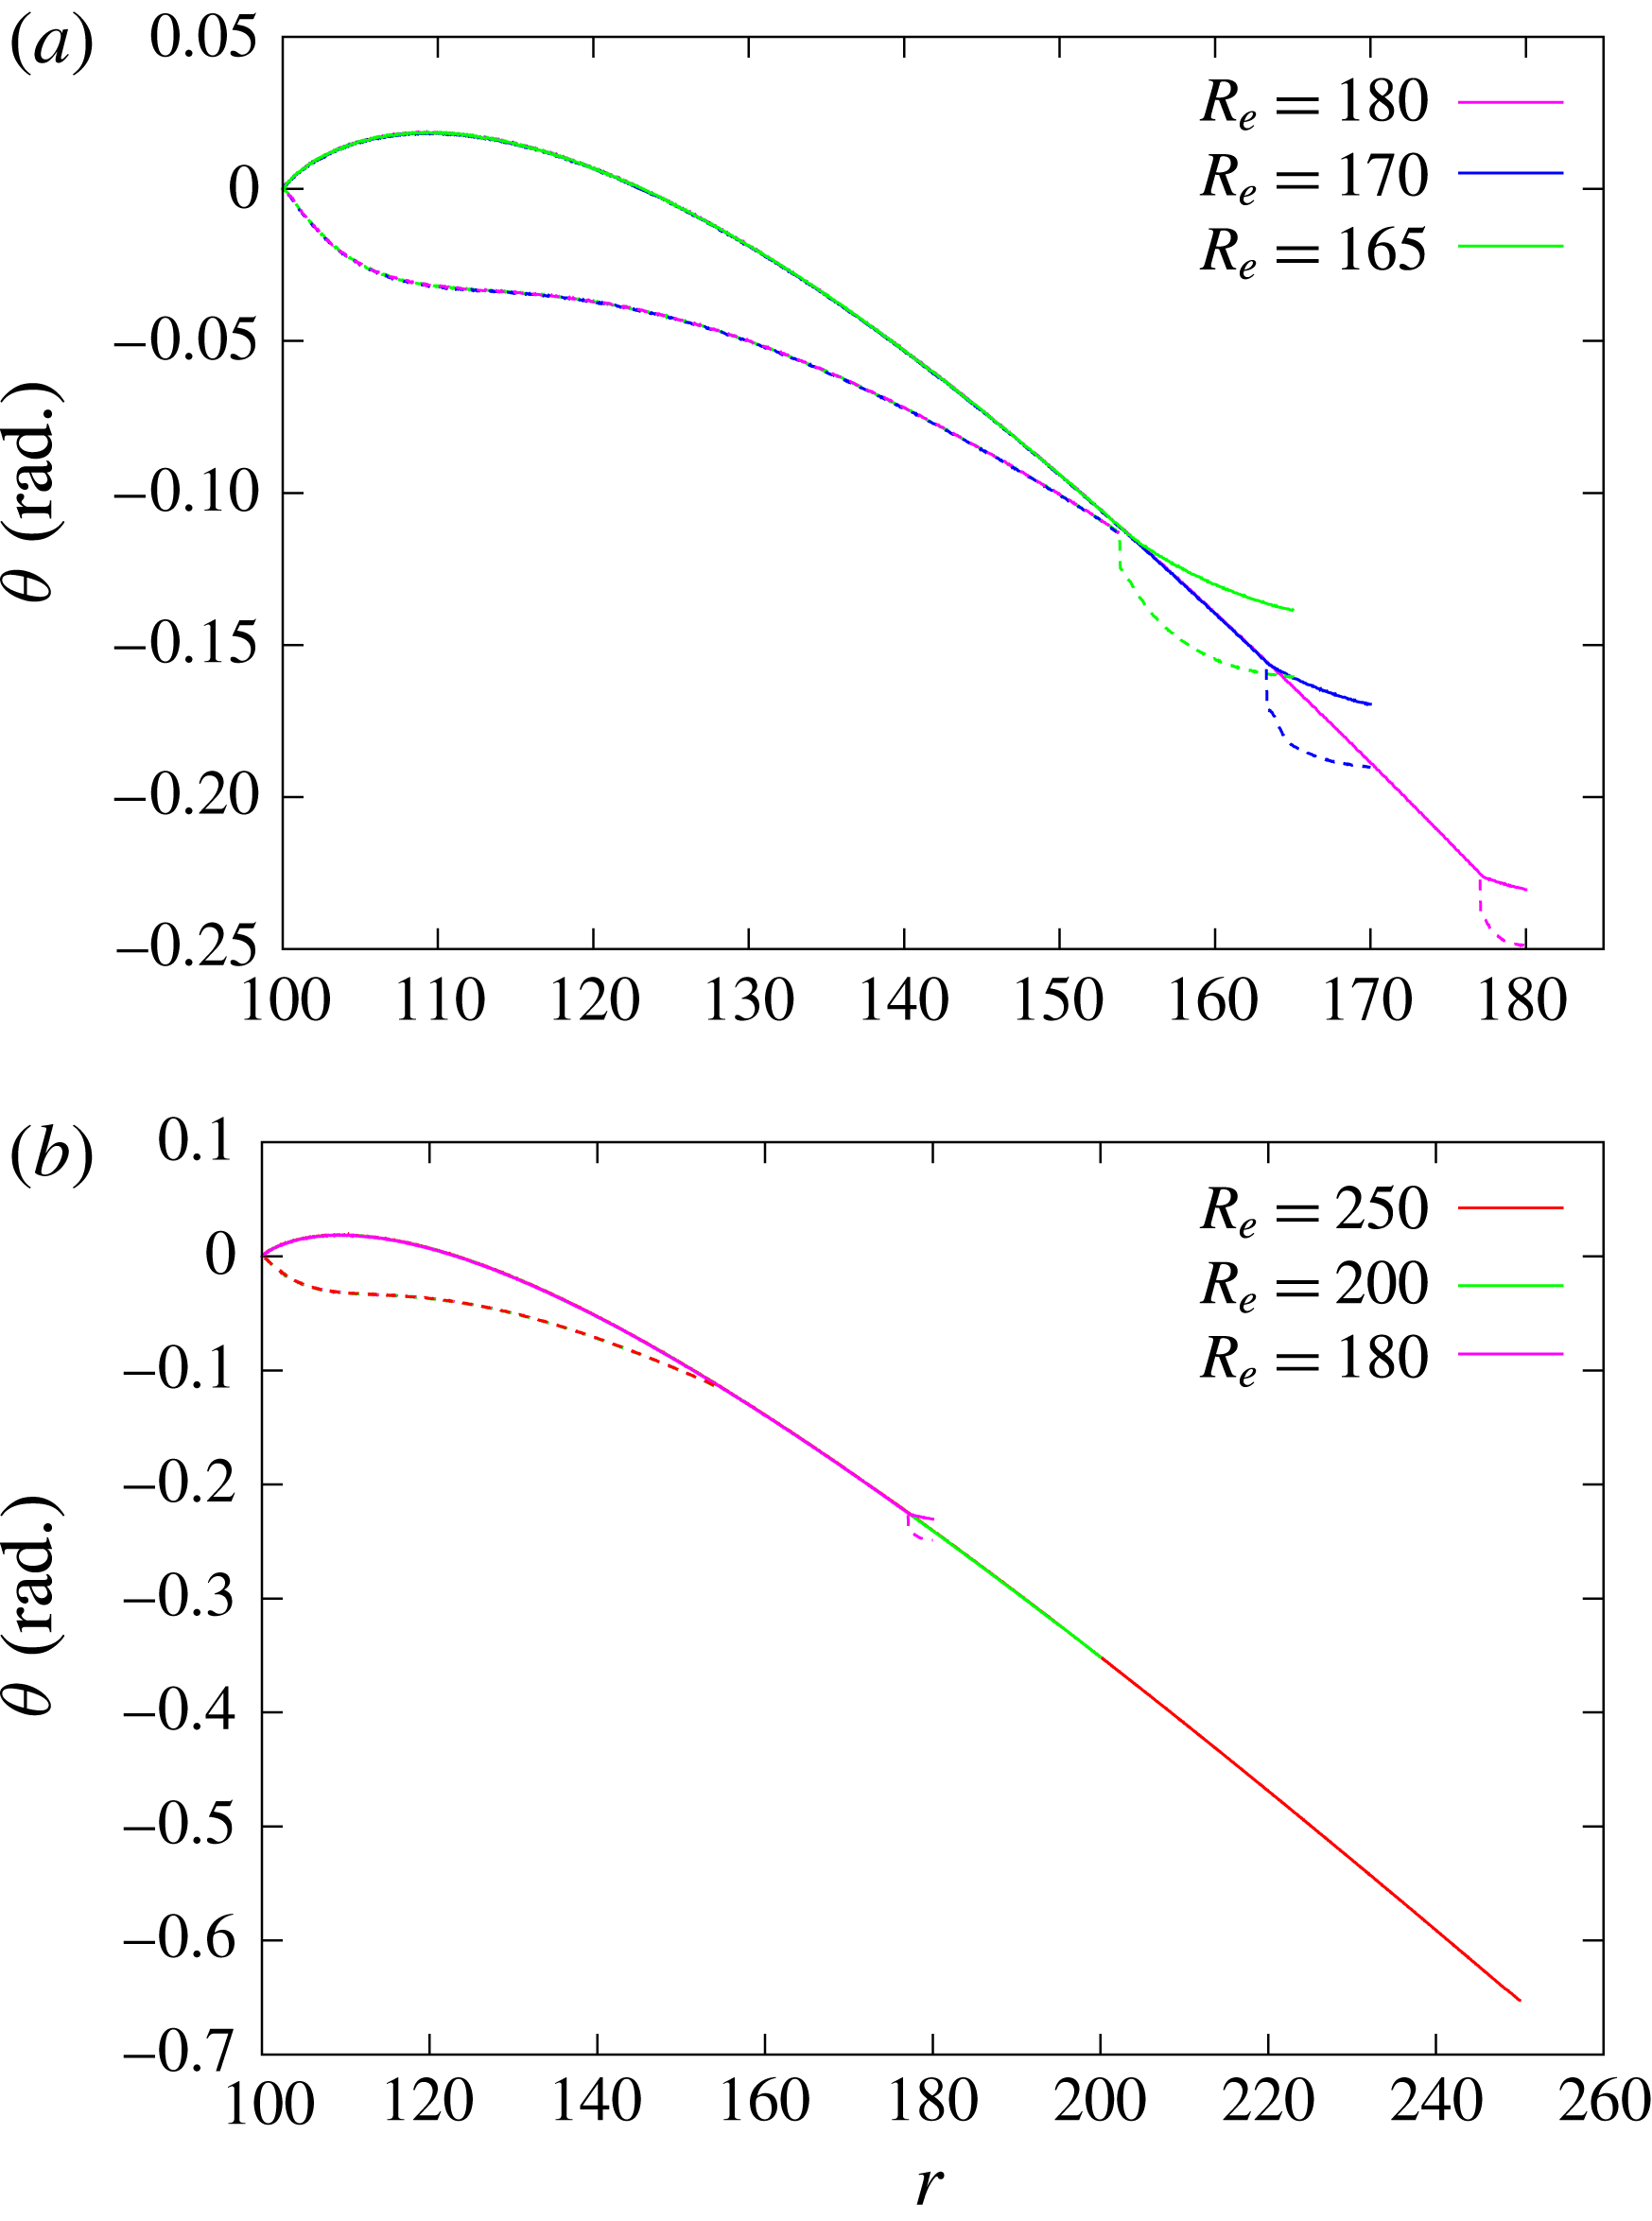
Comparison of the steady detonation shock (solid lines) and sonic (dashed lines) loci for the outer arc radii
 $(R_{e})$
indicated, corresponding to figures 18–22. The loci are represented by their polar angle variation as a function of radial coordinate. The reference point for each radius
 $R_{e}$
is set such the polar angle of the shock locus point on the inner arc boundary is set to zero.

5.3.2 LIC-HIC
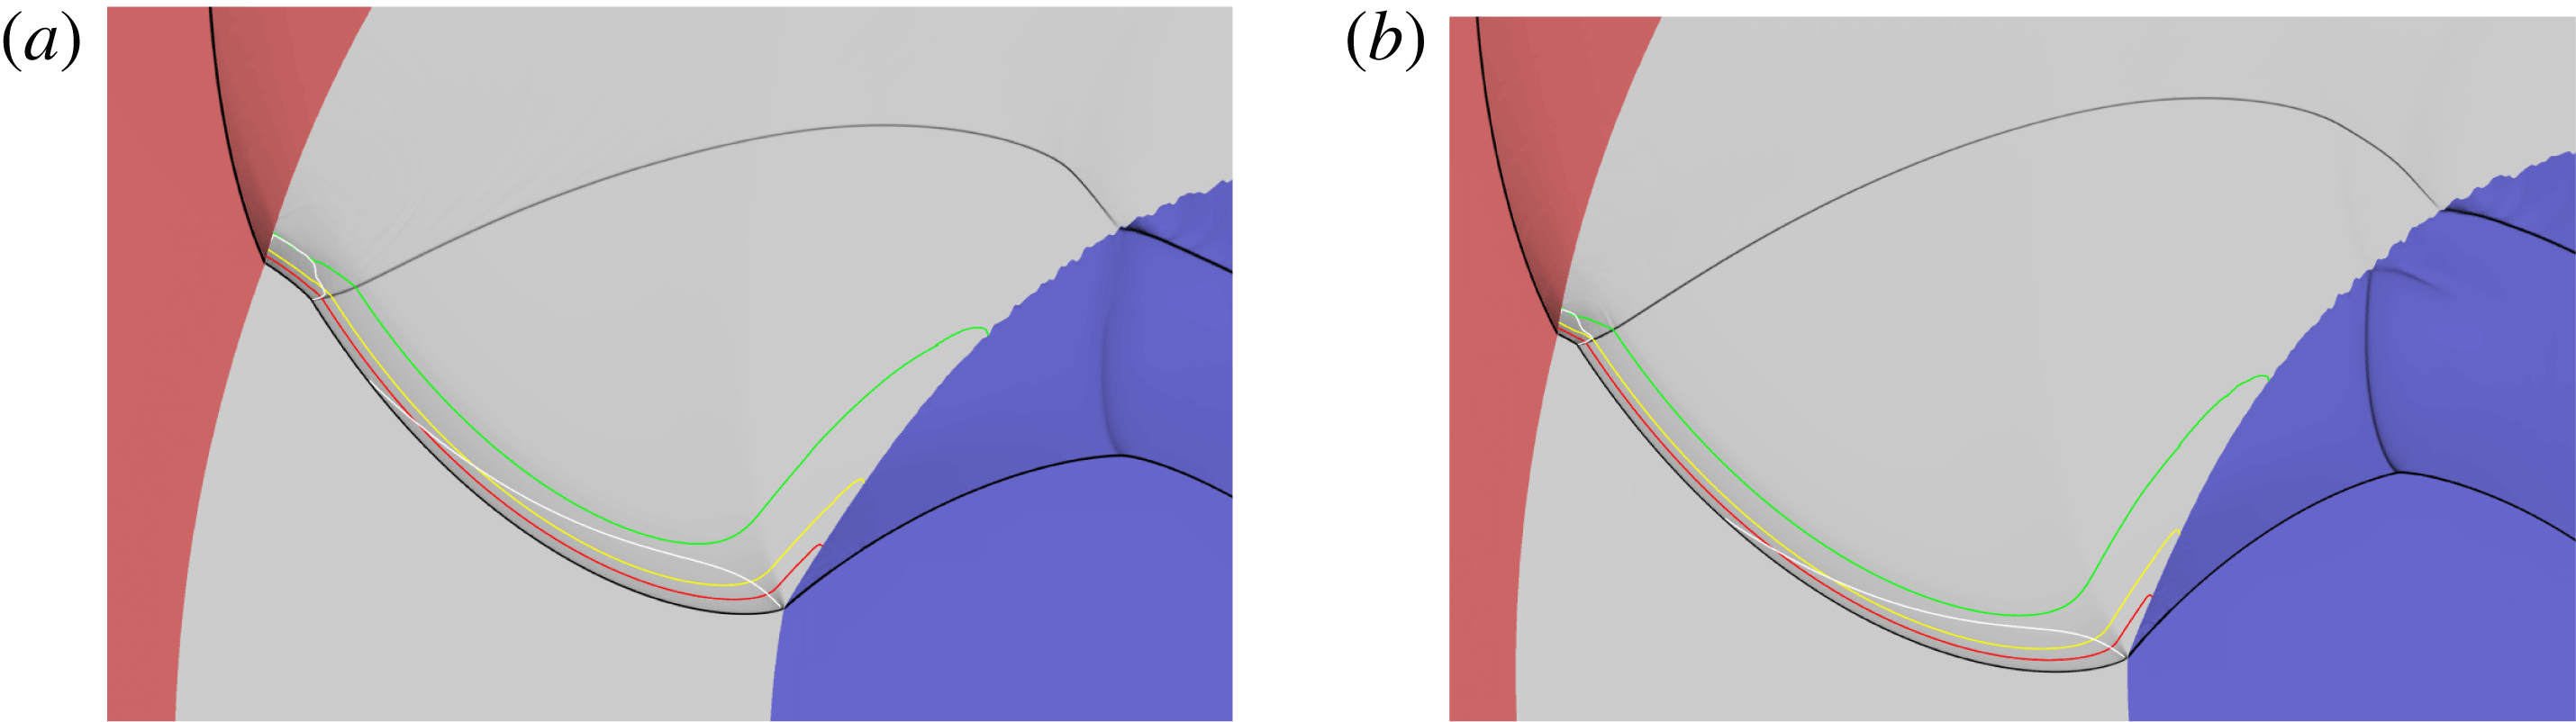
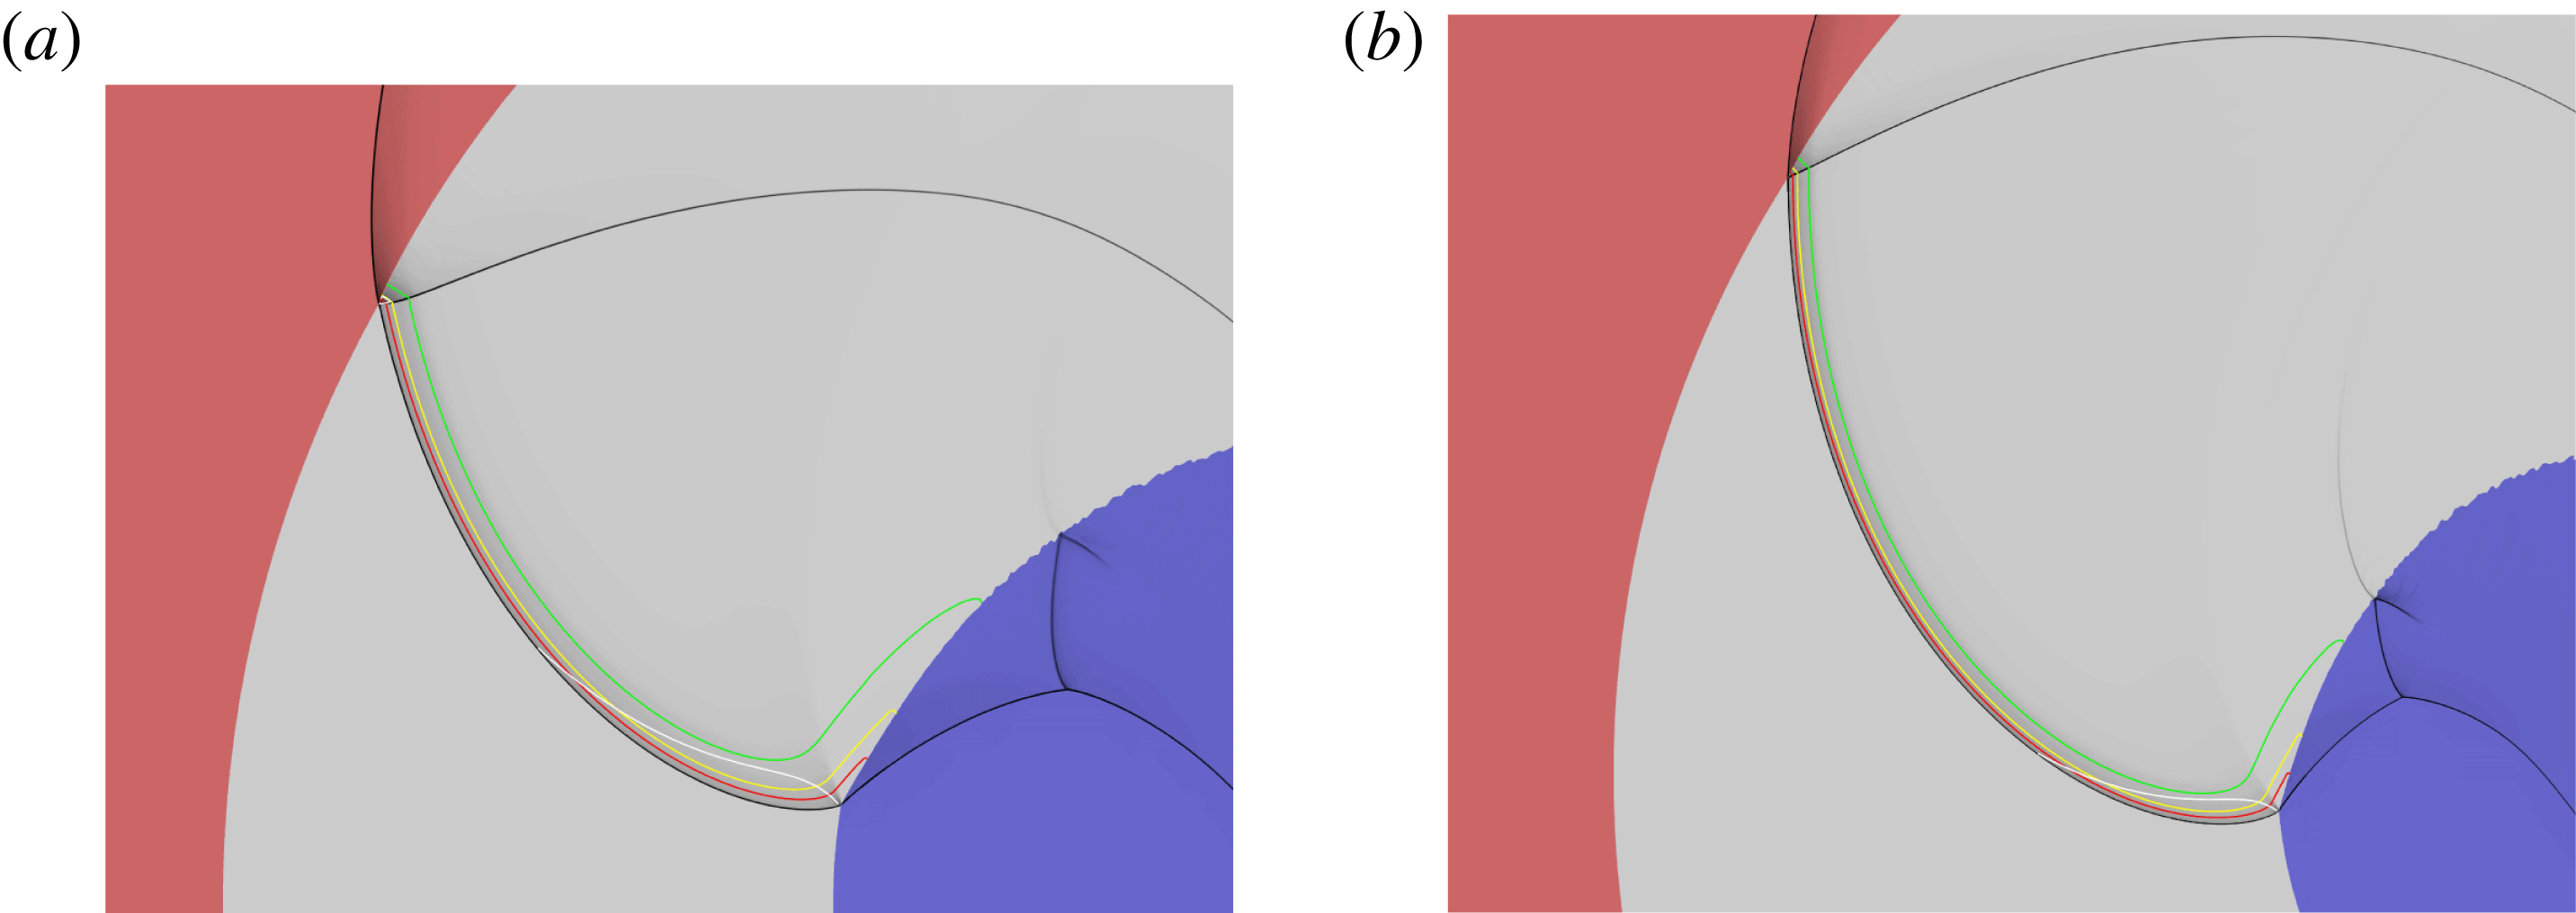
Figures 18–24 show weighted pressure gradient images that highlight the main flow structures (lead, Mach and reflected detonation shock, transmitted confiner shocks, PM fans) for steady propagating detonation waves for a series of varying arc widths with
 $R_{i}=100$
and with LIC confinement on the inner arc surface and HIC confinement on the outer arc surface. Corresponding spatial variations of the detonation shock shape and the sonic locus for each outer radius
 $R_{e}$
are shown in figures 25 and 26. Figures 18–20 show the DDZ and wave structure for
 $R_{e}$
ranging from
 $R_{e}=115$
to
 $R_{e}=150$
. In each case, at the inner arc LIC boundary, the sonic line defining the DDZ intersects the detonation shock near the material interface. A PM fan is also present at the intersection point, and thus the flow along the inner arc boundary in the HE is supersonic. On the other hand, at the outer arc HIC boundary, the sonic line of the DDZ intersects the material boundary downstream of the detonation shock. Consequently, the flow in the HE along the material boundary between the sonic line and detonation shock is subsonic, and the DDZ structure will be influenced by the material properties of the HIC. The observed inner and outer arc boundary interaction structures are again consistent with the polar analysis described in § 3. As the width of the arc increases, the degree of reaction occurring within the DDZ increases. However, the rate of reaction is significantly lower in the region near the inner arc boundary relative to the rest of the arc. For
 $R_{e}=140$
and
 $150$
, outside of a layer near the inner arc surface, the sonic line lies close to the end of the reaction zone.
For this confinement configuration, figure 8 shows that the angular speed of the detonation first increases with increasing
 $R_{e}$
, reaches a maximum for an outer radius of
 $R_{e}\approx 130$
, before decreasing and then limiting to a constant value for sufficiently large
 $R_{e}$
. Since the only difference between this configuration and the LIC-LIC configuration shown in § 5.3.1 is the HIC confinement on the outer arc, the peak in
 $\unicode[STIX]{x1D714}_{0}$
must be due to the HIC material confinement effect. In simpler geometries, such as the 2D axisymmetric rate-stick, increasingly stiffer confinement for a given rate-stick radius results in faster detonation waves. For the arc, there is an added complication due to a geometric effect. As will be demonstrated below, and as seen for the LIC-LIC confinement examined in § 5.3.1, for the HIC outer arc confinement the DDZ will detach from the outer arc surface at a sufficiently large radius. Thus, as the arc thickness increases, the effect of outer arc confinement on the DDZ will eventually weaken, and subsequently the DDZ will evolve independently of the outer arc confinement. The competition between confinement and geometric effects on the outer arc surface appears to result in a peak in the angular detonation speed.


For
 $R_{e}=130{-}150$
, even though the wave is propagating steadily, figures 19(b), 20 and 25 indicate that the detonation shock has a region of smoothly varying negative curvature near the HIC outer arc surface, which becomes more prominent as
 $R_{e}$
increases. Interestingly, the sonic locus lies internal to the reaction zone in these negative curvature regimes. Evidently, the negative shock curvature is required to turn the HE flow streamlines to be consistent with the confinement conditions imposed by the HIC. By
 $R_{e}=160$
, some additional flow structures of interest are developing. Downstream of the reaction zone, a local HE Mach stem structure has appeared on the inner arc surface, with a corresponding transmitted structure appearing in the confiner (figure 21
a). The origin of the incident shock of the HE Mach stem is the HE reaction zone, and is actually a reflected shock behind the HE reaction zone that occurs due to the HIC confinement. This can be inferred from the discussion on detonation evolution in the arc in § 5.1. Correspondingly, we also note a region internal to the arc where the sonic locus has begun to collapse towards the detonation shock (figure 25). For
 $R_{e}=162.5$
, the internal sonic locus collapse to the detonation shock continues further (figure 25). The incident shock making up the HE Mach stem structure on the inner arc surface has grown towards the detonation reaction zone (figure 21
b). There are two compressive waves which appear to merge to form the incident shock. At
 $R_{e}=163.75$
, one leg of the compressive wave has grown stronger and the incident shock to the HE Mach stem at the inner arc surface now forms just downstream of the reaction zone (figure 22
a). At this point, the flow in the reaction zone remains smooth, but the shock front now has a region of stronger negative curvature near the outer arc surface (figure 25). If this were a CJ detonation in which the reaction is instantaneous, we would expect the reflected shock to attach itself to the detonation front to form a Mach stem configuration on the detonation front. However, the change in energy due to reaction through the finite reaction zone has the ability to influence and turn streamline shapes (Bdzil & Short Reference Bdzil and Short2017), playing the role that a reflected shock would play for a Mach stem configuration on the detonation front. For
 $R_{e}=165$
, flow streamline turning by reaction is not sufficient, and the reflected shock has moved through the reaction zone and has just reached the detonation shock (figures 22
b and 25). A single point of the sonic locus has now collapsed to the detonation shock, where the reflected shock intersects the detonation shock. Interestingly, from figure 25, this occurs exactly at the radius where the sonic locus separates from the outer arc surface in the LIC-LIC case, i.e. for
 $r\approx 154$
. A triple-point Mach-stem structure has now formed on the detonation shock. At this point, the DDZ structure now becomes independent of the outer arc thickness or confinement material.
For
 $R_{e}=170$
and
 $R_{e}=180$
, a supersonic flow region has now appeared and separates the DDZ from the detonation shock-Mach stem structure (figures 23 and 26). The structure of the DDZ remains fixed, and is identical in spatial structure to that observed for the LIC-LIC problem for
 $R_{i}>154$
. This is because the DDZ evolution is now controlled by the properties of the inner arc radius and confinement. The outer arc radius and confinement can no longer influence the DDZ structure. It also appears that the subsonic flow region behind the Mach stem does not contribute to driving the wave forwards, but rather the region of supersonic flow and Mach stem structure are driven by the DDZ dynamics as it sweeps around the arc, as indicated by the overlapping of the oblique detonation shock shapes outside of the DDZ for increasing
 $R_{e}$
(figure 26). The relative radial position of the Mach stem on the detonation shock moves closer to the outer arc boundary as the arc thickness increases. However, for each fixed arc thickness, the Mach stem propagates steadily parallel to outer arc surface. At
 $R_{e}=200$
(figure 26
a), the Mach stem has reached the outer arc surface, and subsequently disappears. For
 $R_{e}=250$
(figure 26
b), the detonation structure consists of the DDZ and supersonic flow regions, but now with a reflected shock at the outer arc boundary. The bulk of the reaction is occurring outside of the DDZ in supersonic flow. As for the LIC-LIC case, the radial extent of the DDZ that determines the angular speed of the detonation makes up an increasingly smaller proportion of the overall arc thickness.
6 Summary
In this paper, we have examined the structure of steady propagating detonation in a 2D HE circular arc geometry using a reactive flow model approach. The arc has a fixed inner radius and is surrounded by a LIC on its inner surface, while its outer surface is surrounded either by the LIC or by a HIC. A second-order finite volume method with adaptive mesh refinement was used to integrate the flow equations in the explosive arc and confiner regions.
We have shown that the structure of steady propagating detonation in a 2D circular arc geometry can be surprisingly complex, generating a range of compressible flow structures that are required by the geometric and confinement constraints of the arc. We have explored and detailed the properties of the angular speed of the steady detonation, and both the overall detonation structure as well as its detonation driving zone (DDZ) structure (the region between the detonation shock and sonic flow locus) as a function of arc thickness and outer arc boundary confinement.
For LIC confinement on the inner and outer arc boundaries, and for sufficiently thin arcs, the angular speed (
 $\unicode[STIX]{x1D714}_{0}$
) of the steady detonation increases with increasing arc thickness, but subsequently limits to a constant value for sufficiently thick arcs. In the regimes where
 $\unicode[STIX]{x1D714}_{0}$
is sensitive to changes in arc thickness, the flow is sonic (in a frame travelling with the detonation shock) at the intersection of the detonation shock with the inner and outer HE arc boundaries, with PM fan structures expanding into the HE at both the inner and outer arc surfaces. The DDZ structure, in which the flow is subsonic, is modified by the HE arc thickness and as a result
 $\unicode[STIX]{x1D714}_{0}$
increases with increasing arc thickness. For sufficiently thick arcs, the angle that the detonation shock makes with the tangent to the outer arc surface becomes too small to support sonic flow, and a region of supersonic flow develops at the outer arc surface. The DDZ is observed to detach from the outer arc surface. With further increases in arc thickness, the DDZ structure remains spatially frozen, and an increasingly larger region of supersonic flow appears behind the detonation shock and between the DDZ and outer arc surface. A PM fan is reflected from the outer arc surface. As there is no change in the DDZ structure, the angular speed of the detonation sweeping around the arc does not change with increasing arc thickness, and the evolution of the detonation is controlled by the inner arc radius and its confinement. As the arc thickness increases further, the DDZ extends an increasingly smaller radial percentage of the overall arc thickness, and for sufficient wide arcs most of the energy release associated with reaction occurs in supersonic flow.
For HIC confinement on the outer arc surface, the angular speed of the steady detonation first increases with increasing arc thickness, reaches a maximum, and then decreases, limiting to the same constant value observed with LIC material on the outer arc surface. For sufficiently thin arcs, the DDZ structure again extends the arc thickness, with sonic flow observed at the intersection of the detonation shock and inner arc LIC surface, but subsonic flow observed along the outer arc HIC material interface in the DDZ. Thus, the material properties of the strong confiner influence
 $\unicode[STIX]{x1D714}_{0}$
, driving its magnitude above the limiting thick arc angular speed observed with LIC confinement on the outer surface. As the arc thickness increases, we observed that a region of the detonation shock near the HIC surface developed a region of smoothly varying negative curvature, despite the detonation travelling steadily around the arc. The magnitude of the negative curvature on the shock increased as the arc thickened. We conjectured that the negative curvature region developed in order to turn the flow streamlines near the outer arc surface so that the flow was compatible with the boundary confinement imposed by the HIC material.
At a certain arc thickness, we then observed a Mach wave reflection pattern develop on the inner arc surface downstream of the DDZ. The origin of the incident shock wave of the Mach reflection pattern appeared to be the negative curvature region of the HE detonation reaction zone near the outer arc surface. As the arc thickness increased further, the reflected shock downstream of the reaction zone moved closer to the end of the detonation reaction zone, but did not penetrate the HE detonation reaction zone due to the streamline turning properties associated with the energy release due to reaction. At this point, the sonic locus making up the DDZ structure began to collapse towards the the detonation shock at a point internal to the arc. For a sufficiently wide arc, streamline turning by reaction was not sufficient to prevent the reflected shock from moving through the reaction zone. As a result, a Mach reflection structure on the detonation shock front was created, with a curved Mach shock connecting the reflected wave to the outer arc boundary. The radial coordinate at which the reflected shock first intersected the lead detonation shock was very close to the outer arc radius where the DDZ separated from the outer arc surface for the LIC material outer confinement case. With further increases in the arc thickness, a supersonic flow region developed and separated the DDZ structure from the Mach wave structure present towards the outer arc surface. At this point, the spatial structure of the DDZ region became independent of the HE arc thickness and outer arc confinement, and was identical to the frozen DDZ structure observed for the LIC outer arc confinement, while the angular speed of the detonation became constant and limited to that of the LIC outer arc confinement case. Despite the subsonic flow region present behind the Mach shock along the front, it did not contribute to driving the detonation forwards, and the angular speed of the detonation was controlled by the inner arc radius and its confinement. The spatial extent of the Mach shock attached to the outer arc surface reduced as the arc thickness increased further, and for sufficiently large arc thicknesses, the Mach reflection along the detonation front disappeared leaving a reflected shock structure at the outer arc surface. As for the LIC outer arc confinement case, as the arc thickness increases, the DDZ extends an increasingly smaller radial percentage of the overall arc thickness.
In future work, we will examine the effects of changing the inner arc radius and confinement, particularly in light of the results of Short et al. (Reference Short, Quirk, Meyer and Chiquete2016) which showed that for weak confinement on the inner arc, the influence of curvature of the detonation wavefront on the angular speed of the detonation moving around the arc becomes more significant than that of the confinement. On the other hand, for strong confinement on the inner arc surface, the influence of both curvature of the detonation wavefront and the inner arc confinement on the angular speed are comparable. We will also develop a DSD-model-based normal velocity – curvature
 $(D_{n}-\unicode[STIX]{x1D705})$
surface propagation law that is calibrated to the reactive flow model studied in the present paper. This will allow us to compare the predictions of the DSD-model-based surface motion in the arc geometry directly to the reactive burn model simulations studied here. Finally, we plan on studying the effect on the observed wave patterns due to variations in the reaction rate pressure-sensitivity-exponent
 $n$
and reaction-order
 $\unicode[STIX]{x1D708}$
for the model currently under study, as well as examining more complex reaction rate and equation-of-state forms, such as the Wescott–Stewart–Davis model (Wescott, Stewart & Davis Reference Wescott, Stewart and Davis2005) that have been calibrated to specific explosives. For instance, increasing the reaction order or decreasing the pressure-sensitivity-exponent generates a lower rate of heat release, and consequently a longer reaction zone, an effect that might weaken the streamline turning capability of the reaction zone (Bdzil & Short Reference Bdzil and Short2017). Our expectation is that while quantitative differences will be observed, we will retain the overall qualitative dependence of the angular speed on the confinement material properties and outer arc radius, as well as the appearance of the wave patterns observed in the current study.