Introduction
Species distribution models (SDMs) are a widely applied and rapidly developing statistical tool used in the study of wildlife, with new methods regularly proposed as solutions to various challenges encountered during modelling (Elith & Leathwick Reference Elith and Leathwick2009, Franklin Reference Franklin2010). A deficiency of most SDMs is the failure to account for imperfect detection – the possibility that a species may go undetected even when it is present (Lahoz-Monfort et al. Reference Lahoz-Monfort, Guillera-Arroita and Wintle2014). Occupancy models, a similar but distinct field of research from SDMs, account for this scenario by separating the species–environment response from that of the detection process through the use of a hierarchical modelling framework (MacKenzie et al. Reference MacKenzie, Nichols, Hines, Knutson and Franklin2003). Another challenge for most SDMs is how to appropriately use presence-only (PO) data, which are often the most common type of data used in SDMs due to their ease of collection. This type of data is sometimes also referred to as presence-background (PB) for the class of models that combine PO data with the background environment in order to estimate species–environment responses. Recently, the challenge of using PO data in SDMs has been addressed through the use of point process models (Warton & Shepherd Reference Warton and Shepherd2010, Renner et al. Reference Renner, Elith, Baddeley, Fithian, Hastie, Phillips and Warton2015). Integrated SDMs (ISDMs) represent a new development that uses both of these approaches, combining opportunistic (e.g., PO) and higher-quality site-occupancy (SO) data in the same model (Dorazio Reference Dorazio2014, Fithian et al. Reference Fithian, Elith, Hastie and Keith2015, Koshkina et al. Reference Koshkina, Wang, Gordon, Dorazio, White and Stone2017). ISDMs have potential as useful tools, but they require further investigation (i.e., sensitivity analyses), as there are few applied examples to follow.
Data simulation is a powerful tool used to answer questions about how models react to various user decisions (Zurell et al. Reference Zurell, Berger, Cabral, Jeltsch, Meynard, Münkemüller and Grimm2010, Miller Reference Miller2014). However, the design of simulated studies sometimes assumes data conditions that are unrealistic for many rare or cryptic species. The assumptions of the simulations used in the two studies that introduced ISDMs (Dorazio Reference Dorazio2014, Koshkina et al. Reference Koshkina, Wang, Gordon, Dorazio, White and Stone2017) include a larger and more even sample than is typically available for most species. Simulation studies that do not mirror reality are especially problematic for a species like the endangered Baird’s tapir (Tapirus bairdii), which is wide ranging and relatively rare, leading to wide gaps in spatial coverage of high-quality presence data. Schank et al. (Reference Schank, Cove, Kelly, Mendoza, O’Farrill, Reyna-Hurtado and Miller2017) applied an ISDM to c. 800 PO observations and 1600 camera trap detection histories (created from SO data) for Baird’s tapir. This research estimated a total population size of c. 200,000 individuals for the species, more than an order of magnitude higher than expert estimates, which range from 3000 mature adults to 16,500 total individuals (Medici et al. Reference Medici, Carrillo, Montenegro, Miller, Carbonell, Chassot and Mendoza2005, García et al. Reference García, Jordan, O’Farril, Poot, Meyer, Estrada and Ruiz-Galeano2016). There are a variety of reasons that could explain this discrepancy, including violations of model assumptions and the sensitivity of the model to various modelling decisions. We focus on two assumptions: independence between sites and population closure. As with most statistical models, occupancy models require independent observations (MacKenzie et al. Reference MacKenzie, Nichols, Royle, Pollock, Bailey and Hines2006). In this case, observations would not be independent if the same individual was detected at more than one site during the same observation period. In order to avoid this possibility, Schank et al. (Reference Schank, Cove, Kelly, Mendoza, O’Farrill, Reyna-Hurtado and Miller2017) used a spatial subsampling procedure to enforce a minimum distance between sites, as many of the sites were so close together that independence would be violated. Occupancy models also assume population closure, which states that no immigration or emigration of individuals from the site occurs during the sampling period (MacKenzie et al. Reference MacKenzie, Nichols, Royle, Pollock, Bailey and Hines2006). Violation of the closure assumption can originate from a sampling period that is too long (Rota et al. Reference Rota, Fletcher and Dorazio2009).
Our research here investigated the effect of user decisions on model outputs and population estimates when using ISDMs, focusing on how issues of spatial and temporal scale relate to the model assumptions above. Specifically, we investigated the effect of different settings for site area, subsampling radius and season length using data from our prior Baird’s tapir analysis (Schank et al. Reference Schank, Cove, Kelly, Mendoza, O’Farrill, Reyna-Hurtado and Miller2017). ISDMs have great potential as useful tools for conservation; however, researchers using these tools need clear recommendations for how to apply them, particularly when making conservation and management decisions for threatened and data-deficient species. The results of this research shed light on how these models can be applied appropriately to such species of conservation concern.
Methods
The complete sensitivity analysis covered three model formulations (PB, SO and integrated), four site area sizes and three season lengths, with 100 spatially subsampled iterations – a total of 3600 models. Custom R code was adapted from Dorazio (Reference Dorazio2014) and Royle and Dorazio (Reference Royle and Dorazio2008) to run the models.
Model Descriptions
With ISDMs, two separate models are formulated to accommodate the two types of data used (PB and SO), both based on a Poisson point process model. In these models, λ(s) is the expected intensity (number of individuals per unit area) at location s. In the context of the SDM, λ(s) is formulated as a log-linear function of unknown parameters and location-specific regressors x(s):
 $$\log (\lambda (s)) = {\beta _0} + \beta 'x(s)$$
The general class of models used here are hierarchical models, which have separate levels for abundance (the process of interest) and detection (the nuisance process). Though they share the same SDM based on a point process model, the two types of data use different model formulations to account for imperfect detection, including that which results from spatially biased survey effort. With opportunistic data, spatial bias and imperfect detection are incorporated through an independent thinning of the point process. This thinned point process is the product of the original point process and ppb (s), the probability that the site is surveyed and the species is detected. ppb (s) is formulated as a logistic function of unknown parameters and location-specific regressors wpb (s):
 $$\log {\rm{it(}}{p_{pb}}{\rm{(}}s{\rm{))}} + {\alpha _{0.pb}} + {\alpha _{pb}}'{w_{pb}}(s)$$
With data from planned surveys (SO), imperfect detection is modelled following a zero-inflated binomial distribution (Koshkina et al. Reference Koshkina, Wang, Gordon, Dorazio, White and Stone2017). Under this model, the presence or absence of the species at a site i follows a Bernoulli distribution. In this case, the detection histories at each site, yi, have non-detections (i.e., zeros) due to both species absence and imperfect detectability – the fact that an individual may go undetected even when present (MacKenzie et al. Reference MacKenzie, Nichols, Hines, Knutson and Franklin2003). This relationship is modelled as a Binomial distribution with J trials and the probability of success (i.e., species detection) equal to the product of zi (the occupancy state, zi = I(Ni > 0)) and pso, the probability of detection at the site. As with detectability in the PB model, pso(s) is formulated as a logistic function of unknown parameters and location-specific regressors wso(s):
 $$\log {\rm{it(}}{p_{so}}{\rm{(}}s{\rm{))}} = {\alpha _{0.so}} + {\alpha _{so}}'{w_{so}}(s)$$
In ISDMs, the PB and SO models are estimated simultaneously, such that one set of parameters for the SDM is created (i.e., the β values), while separate detectability parameters are estimated (i.e., the α values) for the two models.
Model Convergence and Parameter Identifiability
We determined two levels of model convergence. First, the optim function in R was used to estimate model parameters from the model likelihood. Occasionally, this function failed to return an optimized set of parameters. Next, if estimates were returned from this function, we determined whether or not they were correctly identified using the reciprocal of the condition number. This number is the ratio of the smallest to the largest eigenvalues in the Fisher information matrix and can be used to determine whether the parameters of the SDM are identifiable (Dorazio Reference Dorazio2014). The reciprocal of the condition number falls between 0 and 1, with values near zero indicating ill conditioning (Golub & Van Loan Reference Golub and Van Loan2012). If this number fell below a certain threshold (in this case 1 × 10⁻⁶), the results for that model were not used in the subsequent analysis.
Presence Data
The species presence data used here consisted of 784 PO observations compiled from 11 data sources and 1595 camera trap detection histories from 19 sources. These data came from a multinational collaboration examining Baird’s tapir occurrence and distribution (for more details about the compilation and processing of the data, see Schank et al. Reference Schank, Cove, Kelly, Mendoza, O’Farrill, Reyna-Hurtado and Miller2017).
Spatial Subsampling
We processed the presence data prior to model fitting using a random spatial subsampling procedure to help preserve independence among sites. The algorithm began by randomly choosing one observation point and removing any other observation points within a given radius. We added the chosen observation to the subset and repeated the steps until no observations were left in the original data. A similar type of subsampling is sometimes used to remove survey bias in observation data (Beck et al. Reference Beck, Böller, Erhardt and Schwanghart2014). However, this grid-based approach can lead to samples that remain close in space if they fall just across a boundary in an adjacent grid cell.
The effect of this procedure was to enforce a minimum distance between sampling points. This minimum distance was matched to the site area to ensure that no site contained more than one data point. For example, we used a subsampling radius of 5657 m for a site area of 16 km2 (the diagonal length of a square that size). This process was repeated 100 times for each radius to capture the variability introduced by the randomness of the sampling. Model parameters were then averaged across iterations. A set of models also were fit on the complete (non-subsampled) presence data to investigate the effect of violating the independence assumption.
Predictor Variables
Environmental variables were grouped into five classes: climate, land cover, anthropogenic, topographic and sampling variables (i.e., the variables used in the detection process). Climate variables at 1-km resolution were downloaded from CHELSA (Karger et al. Reference Karger, Conrad, Böhner, Kawohl, Kreft, Soria-Auza and Kessler2017) and included annual precipitation, maximum temperature of the warmest month, temperature seasonality and precipitation seasonality. Land cover variables consisted of percentage tree cover for the year 2000 at 30-m resolution (Hansen et al. Reference Hansen, Potapov, Moore, Hancher, Turubanova, Tyukavina and Townshend2013), distance to/within protected areas (IUCN & UNEP-WCMC 2014) and mean enhanced vegetation index (EVI) from MODIS for years 2000–2015 downloaded using Google Earth Engine. Anthropogenic variables included forest loss between 2000 and 2014 (Hansen et al. Reference Hansen, Potapov, Moore, Hancher, Turubanova, Tyukavina and Townshend2013), road density (Eugster & Schlesinger Reference Eugster and Schlesinger2010) and density of fires between 2001 and 2014 (NASA 2017). Anthropogenic variables were then converted to focal averages using a moving circular window and a 10-km radius (centred on each 1-km pixel in the study area) to account for the fact that humans are mobile and presence in one area means access is likely within a reasonable distance (Barber et al. Reference Barber, Cochrane, Souza and Laurance2014). Slope was calculated from 90-m resolution elevation data downloaded from the ‘raster’ package in R (Hijmans et al. Reference Hijmans, van Etten, Cheng, Mattiuzzi, Sumner, Greenberg and Wueest2016).
Sampling variables (i.e., those used in the detectability process) for the PB data included binary indicators for forest (Arino et al. Reference Arino, Perez, Kalogirou, Bontemps, Defourny and Van Bogaert2012) and protected status (IUCN & UNEP-WCMC 2014) and distance to roads (Eugster & Schlesinger Reference Eugster and Schlesinger2010), while sampling variables for SO data were the same tree cover and distance to/within protected areas used in the land cover group, as well as distance to roads and maximum slope. With the PB data, these variables were meant to capture sampling bias in the PO data, which we believe heavily favours forested and protected areas that are reasonably accessible by road. We included a quadratic term for distance to roads, as there could be optimal locations that are far enough from roads to minimize anthropogenic factors, but close enough to facilitate sampling. With SO data, the sampling variables were chosen as variables that might influence the detectability of the species. For example, tapir detectability might decrease as distance from protected areas increases due to likely increased levels of hunting outside of protected areas and thus increased response by the species to avoid humans (de la Torre et al. Reference de la Torre, Rivero, Camacho and `lvarez-Márquez2017, Ferreguetti et al. Reference Ferreguetti, Tomás and Bergallo2017).
All variables were scaled to have a mean of zero and a standard deviation of one, except distance to/within protected areas (zero represents the border of the protected area). The models also incorporated quadratic terms for all climate variables, EVI and distance to road to account for their suspected non-monotonic relationships with tapir occurrence (aided by single-variable response curves created in the early stages of the modelling process).
We resampled all environmental variables to four spatial resolutions: 1, 2, 4 and 8 km. These resolutions correspond to site areas of 1, 4, 16 and 64 km2. Estimates of home range size for Baird’s tapir vary from 1.25 km2 reported in Costa Rica (Foerster & Vaughan Reference Foerster and Vaughan2002) to 8–10 km2 in Nicaragua (Jordan et al. Reference Jordan, Hoover, Dans, Schank, Miller, Reyna-Hurtado and Chapman2019), while estimates of maximum distance travelled range up to 10.5 km in Mexico from camera trap data on a marked individual over 4 years (Reyna-Hurtado et al. Reference Reyna-Hurtado, Sanvicente-López, Pérez-Flores, Carrillo-Reyna and Calmé2016). From this information, it is possible that an individual could be detected at more than one site, but the likelihood of this is probably small, especially for the larger site areas used in this analysis.
Season Length
When creating camera trap detection histories, researchers can adjust their data structure by defining the length of each sampling occasion and the number of sampling occasions to use in a discretized season. Since camera traps operate continuously, there is some flexibility in determining the sampling occasion and season length. These decisions can be made (and adjusted) after the data are collected and will determine the balance of detections and non-detections. It is also important to consider the behaviour of the target species. For sampling occasion length, one suggestion is to select a length of time during which an individual will visit all or most of its home range, and GPS telemetry data suggest Baird’s tapirs cycle through their home ranges about once every 10–12 days (Jordan Reference Jordan2015). For this reason, we used a sampling occasion length of 10 days.
With season length (i.e., number of sampling occasions), it is important to consider the assumption of closure and to choose a length of time during which immigration/emigration at a site is unlikely. As the season length increases, it becomes more likely that the assumption of closure will be violated. On the other hand, it is crucial to include enough sampling occasions to estimate detectability reliably. Some recommendations suggest three as the minimum number of occasions to use, though this number should be higher for species with low detectability (MacKenzie & Royle Reference MacKenzie and Royle2005). Baird’s tapir is unsurprisingly a species with a low detection probability (range of 0.2–0.3) (Cove et al. Reference Cove, Pardo Vargas, de la Cruz, Spínola, Jackson, Saénz and Chassot2014, Jordan Reference Jordan2015). Considering a detectability in this range, there is an approximately 4–13% chance a present individual will go undetected after nine sampling occasions. With the SO data, we tested season lengths of 30, 60 and 90 days (three, six and nine samples). The PB data contain only one sample, as there are not repeat observations at each site for this dataset.
Accuracy Assessment
We used two PO accuracy measures to assess the spatial predictions of each model: the Boyce Index (Boyce et al. Reference Boyce, Vernier, Nielsen and Schmiegelow2002) and the minimum predicted area (MPA) (Engler et al. Reference Engler, Guisan and Rechsteiner2004). We did not use detection/non-detection data with accuracy measures that require presence–absence data given the difficulty of properly defining absences (Lobo et al. Reference Lobo, Jiménez-Valverde and Hortal2010) and given the bias of these measures when test data are missing from large portions of the study area (Bean et al. Reference Bean, Stafford and Brashares2012). After the spatial subsampling step, the retained PO data were randomly split following a 75/25 training/testing ratio (Fielding & Bell Reference Fielding and Bell1997). For both accuracy measures, intensity was converted to occupancy, ψ, which ranges from 0 to 1, using the formula from Dorazio (Reference Dorazio2014), where N is the number of individuals in the spatial unit, C:
 $$Pr(N(C) \,\gt\, 0) = \psi = 1 - exp( - \mu (C))$$
 $$\mu (C) = \int_C^{} {} \lambda (s)ds$$
To calculate the Boyce Index, we partitioned the occupancy surface into bins (i.e., 0.0 < ψ < 0.1, …, 0.9 < ψ < 1.0) and calculated the percentage of test data occurring in each bin (Pi). We then compared the proportion of the area covered by the bin with respect to the study area (Ei). Finally, we converted these two measures to a ratio: Fi = Pi/Ei. If the model correctly predicts low-suitability areas, the low-suitability classes should contain fewer test points than expected by chance (i.e., Fi < 1) and the graph of Fi versus average suitability of each bin should be monotonically increasing. The Boyce Index is the correlation between the average suitability of each bin and its respective Fi, with values greater than zero indicating a model whose predictions are consistent with the test data and negative values indicating an incorrect model. The continuous version of this measure uses overlapping bins (Hirzel et al. Reference Hirzel, Le Lay, Helfer, Randin and Guisan2006).
The MPA is the smallest possible area covered by a thresholded prediction map that contains at least 90% of the test PO points. The smaller the MPA, the more parsimonious the model and the less likely there are to be errors of commission in the predictions (Rupprecht et al. Reference Rupprecht, Oldeland and Finckh2011).
Results
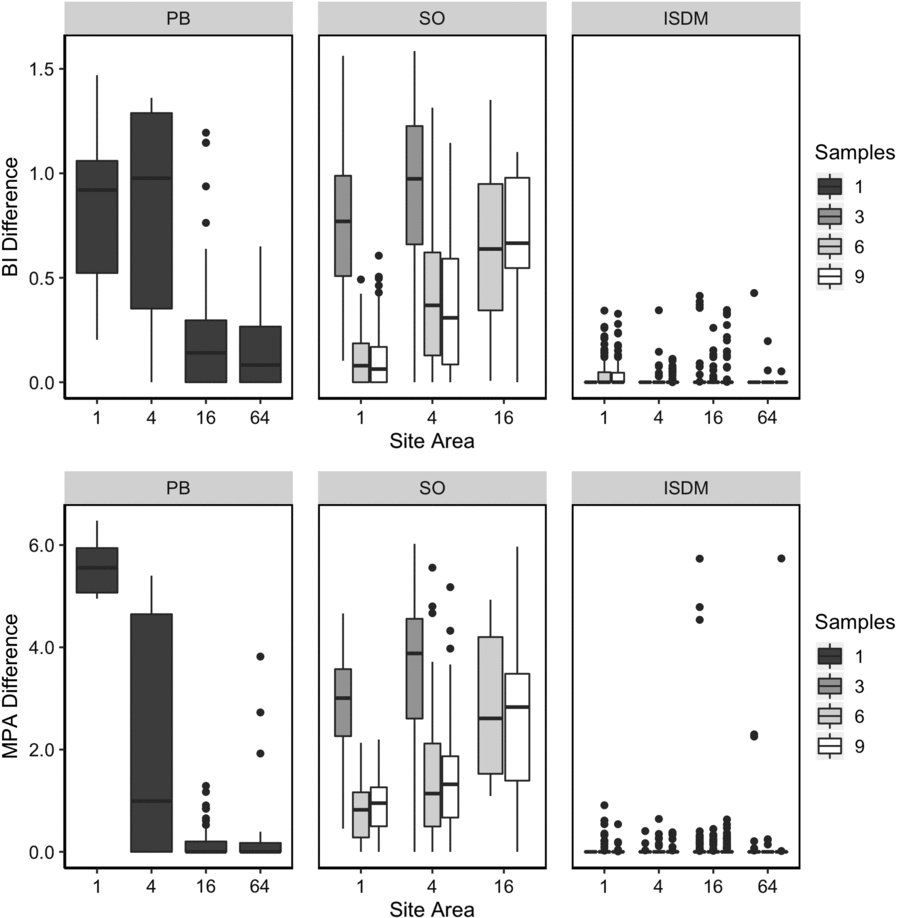
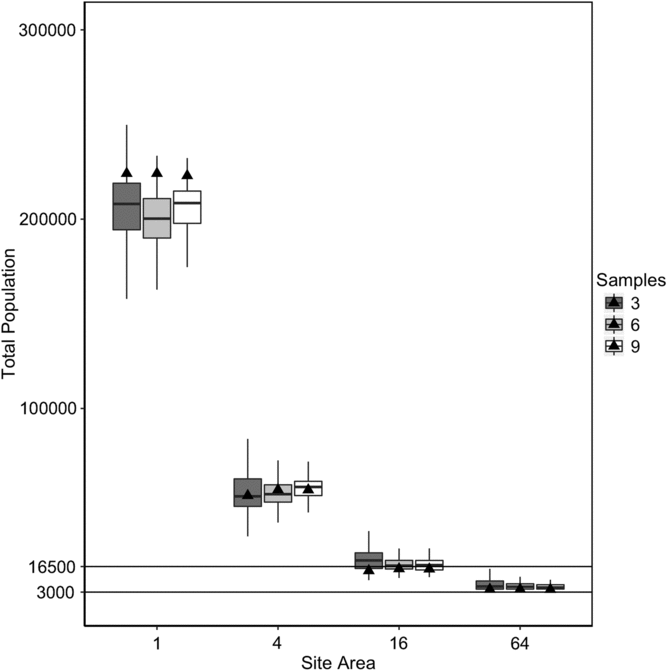
The ISDM converged (with estimated standard errors) in more than 97% of model iterations, while the PB model had low convergence rates across site areas and the SO model exhibited a sharp drop-off in convergence at 16 km2 and above (See Supplementary Material, available online). Both measures of model accuracy showed that the ISDM was the most accurate framework, a relationship that was consistent across site area and number of samples (Fig. 1). Focusing on the ISDM, estimates of total population decreased exponentially as site area increased (Fig. 2). The number of samples used and whether the data had been subsampled had much smaller effects on population estimates.
Model accuracy using Boyce Index (BI) and minimum predicted area (MPA). The difference is calculated from the maximum (i.e., most accurate) BI and from the minimum (i.e., most accurate) MPA within each combination of model settings. The greater the difference (from zero), the less accurate the result. MPA differences have been rescaled to positive numbers and are represented in units of 100,000 km2. ISDM = integrated species distribution model; PB = presence-background; SO = site occupancy.

Population estimates from the integrated species distribution model framework. Horizontal lines are placed at expert population estimates for the species of 3000 (current Red List assessment: Garcia et al. 2017) and 16,500 (Population Viability Assessment Report: Medici et al. Reference Medici, Carrillo, Montenegro, Miller, Carbonell, Chassot and Mendoza2005). Black triangles are the estimates for models run on the complete (not subsampled) set of presence data.

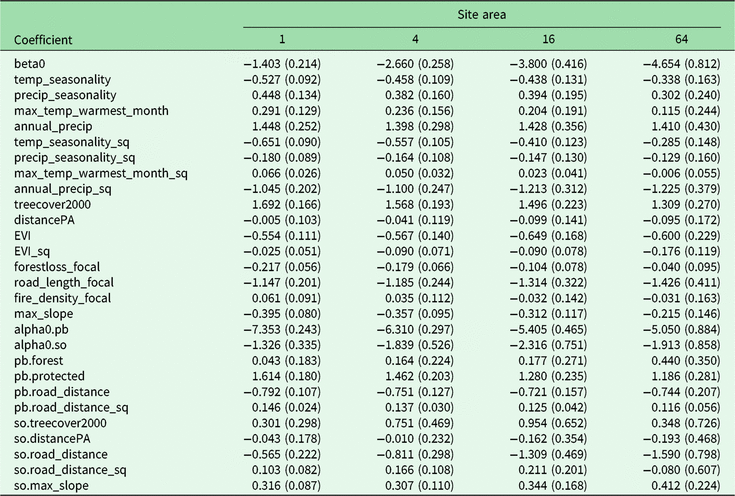
The decrease in population estimates across site areas was driven by estimates of model intercepts, primarily β0, while the coefficients representing species–environment relationships remained relatively stable (Table 1). Annual precipitation (+), tree cover (+) and road density (–) were the three most important environmental variables in the model. Temperature seasonality (–), precipitation seasonality (+), maximum temperature of the warmest month (+), EVI (–), forest loss (–) and maximum slope (–) also appeared as significant environmental predictors. Annual precipitation was the only environmental variable with a clearly significant quadratic term. In the PB detectability process, presence in a protected area (+) was the most important variable. Distance to roads (–) was significant in both detectability components (PB and SO). Maximum slope (+) was also a significant variable in the SO detectability process.
Coefficient estimates and standard errors for the integrated species distribution model (samples = 6) averaged across 100 model iterations fit on randomly subsampled presence data.

Discussion
In the SO model, convergence decreased for larger site areas, possibly due to reduced sample sizes following the subsampling step (mean sample sizes: 1 km2, 663; 4 km2, 370; 16 km2, 182; 64 km2, 93). The ISDM was able to maintain convergence at these larger site areas possibly because of the added information from the PB data. However, there was a detectable decline in convergence with shorter season lengths at these larger site areas. Clearly, sample size is affected by both number of sites and number of repeated observations at those sites (MacKenzie & Royle Reference MacKenzie and Royle2005). In addition to higher rates of convergence, the ISDM was consistently the most accurate model. Taken together, these results demonstrate the importance of this new modelling framework. The ability to combine two types of presence data in the same model leads to better results.
In the ISDM, many of the species–environment relationships exhibited the expected outcome for this species (e.g., a preference for forest and avoidance of humans; Cove et al. Reference Cove, Pardo Vargas, de la Cruz, Spínola, Jackson, Saénz and Chassot2014, Jordan et al. Reference Jordan, Schank, Urquhart and Dans2016). However, there are two results that contradicted expectations. First, EVI had a negative relationship with tapir intensity, as also seen in Schank et al. (Reference Schank, Cove, Kelly, Mendoza, O’Farrill, Reyna-Hurtado and Miller2017). Tapir intensity should be positively associated with increasing vegetation (higher EVI) because vegetation is both a food source and it provides cover (Brooks et al. Reference Brooks, Bodmer and Matola1997, Pettorelli et al. Reference Pettorelli, Ryan, Mueller and Bunnefeld2011). This outcome could be explained if secondary forest is associated with higher EVI values, as there is evidence that tapir prefer these areas (Foerster & Vaughan Reference Foerster and Vaughan2002). In fact, subsequent modelling efforts that included an interaction term between forest cover and EVI provide evidence of this relationship (see chapter 4 in Schank Reference Schank2018).
Also surprising was the positive relationship with maximum slope in the detectability of the SO data. This variable was included in this part of the model as it was suspected to either have a negative effect on sampling effort, because steep terrain is harder to sample, or on actual detectability of tapirs due to the same constraints, as difficult terrain is an impediment to wildlife movement as well (Bailey et al. Reference Bailey, Gross and Laca1996, Mair & Ruete Reference Mair and Ruete2016).
Clearly, the most important factor driving estimated population (and underlying magnitude of intensity) was the assumption about the size of our sampling unit, which we refer to as ‘site area’. The number of sampling occasions and whether or not the presence data had been subsampled to preserve site independence had much smaller effects, with no discernible patterns. The models developed in Dorazio (Reference Dorazio2014) and Koshkina et al. (Reference Koshkina, Wang, Gordon, Dorazio, White and Stone2017) explicitly incorporate site area in a way that is different from in traditional occupancy models. This likely explains the behaviour of total population changing proportional to the area of a grid cell used in the analysis. In the traditional formulation of an occupancy model (see panel 3.8 in Royle & Dorazio Reference Royle and Dorazio2008), site area is not included anywhere in the model likelihood. The important question that remains is: what exactly constitutes a site? For sessile species or species that have small home ranges relative to the survey method, the site is easily defined as the area covered during the survey (i.e., a quadrat). However, when the species is relatively mobile, with a home range that is much bigger than the area covered in the survey, the concept of the site is less straightforward (Efford & Dawson Reference Efford and Dawson2012).
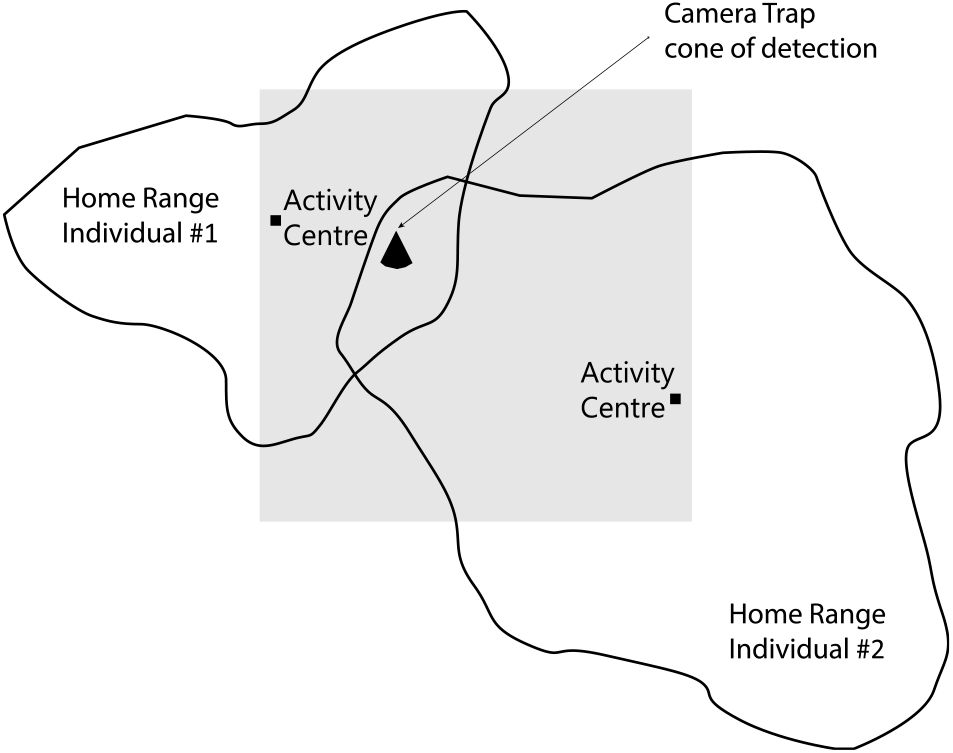
For example, when using camera traps, the cone of detection (i.e., the area in which a species can trigger the camera) is often very small in relation to the movements of the target species, which are typically large and mobile. The effective sampling area (ESA) is the area that contains the activity centres of any individuals that could come into contact with this cone of detection (Fig. 3) (White, Reference White1982). This area should be approximately equal to the average home range of the species. Original estimates of the home range for Baird’s tapirs were c. 1 km2 (Foerster & Vaughan Reference Foerster and Vaughan2002), which is surprisingly small for a species of its size. More recent estimates put the home range size closer to 10 km2 (Jordan et al. Reference Jordan, Hoover, Dans, Schank, Miller, Reyna-Hurtado and Chapman2019). The differences in reported estimates of home range size could be due to differences in the methodology used and differences in topography and the availability of resources, specifically regarding the availability of water. In mountainous sites with complex topography and permanent availability of quality water throughout the year, the home range could be much smaller than in flat sites with very marked seasonality (Botello et al. Reference Botello, Romero-Calderón, Sánchez-Hernández, Hernández, López-Villegas and Sánchez-Cordero2017). Interestingly, using a site area of 16 km2 provides a total population estimate that is within the range of expert estimates for the species (Fig. 2).
Effective sampling area. A simplified diagram of two individuals with overlapping home ranges and a camera trap in the area of their intersection. The effective sampling area is equal to the area that incorporates the activity centres of all individuals detected at the camera.

In Schank et al. (Reference Schank, Cove, Kelly, Mendoza, O’Farrill, Reyna-Hurtado and Miller2017), the model was implemented using a site area of 1 km2. To contextualize the population estimates from that model, the results were compared to multiple independent studies that focused on the estimated abundance of Baird’s tapir (Naranjo-Piñera Reference Naranjo-Piñera1995, Gonzalez-Maya et al. Reference González-Maya, Schipper, Polidoro, Hoepker, Zárrate-Charry and Belant2012, Carbajal-Borges et al. Reference Carbajal-Borges, Godínez-Gómez and Mendoza2014, Mejía-Correa et al. Reference Mejía-Correa, Diaz-Martinez and Molina2014, Botello et al. Reference Botello, Romero-Calderón, Sánchez-Hernández, Hernández, López-Villegas and Sánchez-Cordero2017). The estimates from those studies were similar to the estimates using the ISDM, which provided a conflicting story, as the total population estimates were thought to be overestimates by at least an order of magnitude. Most of these independent studies used capture–recapture methods and did control for the ESA; however, they used the old estimate of home range size from Foerster and Vaughan (Reference Foerster and Vaughan2002). Clearly, accounting for the size of a species’ home range and the variability in those estimates has a huge effect on abundance and population estimates using the ISDM (Fig. 2).
In fact, some authors have called into question the ability to use capture–recapture on a species like Baird’s tapir, which does not have obvious and distinct markings by which individuals can be identified (Foster & Harmsen Reference Foster and Harmsen2012). In the case of Baird’s tapirs, sexually immature sub-adults lose their juvenile pelage before 1 year of age and develop very quickly (CA Jordan, pers. comm. 2018). In addition to making individual adults difficult to identify, this makes older juveniles effectively indistinguishable from mature adults in camera traps. This means that sexually immature individuals have likely been included in prior population estimates using capture–recapture methods, and this puts into doubt whether those studies accurately estimate the effective population size.
In addition to problems with misidentification of individuals, capture–recapture can overestimate species abundance due to the ad hoc correction of ESA (Noss et al. Reference Noss, Gardner, Maffei, Cuéllar, Montaño, Romero-Muñoz and O’Connell2012), which can also lead to large errors in population estimates due to extrapolation (Foster & Harmsen Reference Foster and Harmsen2012). These critiques recommend the use of the newer spatial capture–recapture (Royle et al. Reference Royle, Chandler, Sollmann and Gardner2013), which explicitly accounts for species movement using an additional scaling parameter in the model.
Conclusion
Our research has demonstrated the potential connection between ISDMs and the ESA. Yet, the methods used in this research include ad hoc procedures that should be replaced by formal incorporation into the statistical model. In our models, accounting for the ESA is done in a way that matches site area with the best information about average movements for the species. Spatial capture–recapture provides an example for properly scaling the model to incorporate animal movement (Royle et al. Reference Royle, Chandler, Sollmann and Gardner2013). Rather than approximating this effect through the selection of an appropriate site area, it would be better to combine concepts from spatial capture–recapture with the ISDMs used here.
Second, sometimes additional ad hoc steps must be taken in order to ‘fix’ the data. In this case, we used the spatial subsampling approach to avoid duplicate observations of the same individual at more than one site. Here, spatial capture–recapture can provide some guidance as well. These models require that sites are close enough to ensure that individuals are observed at more than one site, and they use this information to help estimate the spatial scalar of movement for the species. Thus, combining concepts from spatial capture–recapture with ISDMs may allow for the use of all data possible, although some alterations may be necessary for sites that have data covering more than one season (as the tapir data used here do).
A significant contribution of this research is the linkage between ESA and estimating abundance using ISDMs (or any other SDM/occupancy model). It is unclear why the discussion of ESA is almost entirely tied to capture–recapture models that use marked individuals. However, there is at least one study that addresses this issue as it relates to occupancy models (Efford & Dawson Reference Efford and Dawson2012). The issue created by incorrectly accounting for ESA only becomes apparent in a small number of situations: when studying mobile species, estimating their abundance and extrapolating these estimates to produce population estimates. With Baird’s tapir, these steps made it clear that something could be incorrect in our model. While it is possible to hypothesize multiple reasons for this disparity (see the conclusion section in Schank et al. Reference Schank, Cove, Kelly, Mendoza, O’Farrill, Reyna-Hurtado and Miller2017), the most straightforward answer is that ESA was not properly accounted for.
The incorporation of ESA into SDMs and occupancy models could use additional research. Failure to account for this properly could lead to inaccurate estimation of occupancy or abundance. However, as is seen in this research, species–environment relationships might remain the same. In order to improve our understanding, a future study using a detailed simulation (incorporating the movement of individuals) is needed. Future modelling efforts for this species should also explore unexpected species–environment relationships in more detail (e.g., negative associations between species presence and EVI and positive associations between species detectability and slope). It is possible that there is some interaction with other variables that caused these unexpected results. Finally, the reciprocal of the condition number used to determine parameter identifiability is new to species distribution modelling and should be investigated further.
Author ORCIDs
Margot A. Wood, 0000-0001-6004-7378
Supplementary Material
For supplementary material accompanying this paper, visit http://www.journals.cambridge.org/ENC.
Author Contributions
CJS conceived the research; CJS, MVC, MJK, CKN, GO, NM, CAJ, JFG-M, DJL, RM, MD, VM, JCCD, GPM, JAT, EB-M, MAW and JG collected the data; CJS analysed the data; CJS, MVC and JAM led the writing. All authors contributed to writing the manuscript.
Financial Support
Funding for CJS during the research and writing of this manuscript was provided by the Donald D Harrington Fellowship through the Graduate School at the University of Texas at Austin. GPM: National Commission of Protected Natural Areas of Mexico and Biosphere Reserve Selva El Ocote Direction by the PROCER program 2014-2016. RR-H: El Colegio de la Frontera Sur in Mexico provided time and money to collect some data. NM and RM: funding from MWH, Ministerio de Ambiente de Panamá, GEMAS/Fondo Darién and Fundación Natura. JF: funding from PANTHERA, GEMAS/Fondo Darien and Fundación Natura, with additional support from the McIntire-Stennis Cooperative Forestry Research Program, Department of Forestry and Cooperative Wildlife Research Laboratory at Southern Illinois University. Permits from Ministerio de Ambiente de Panamá. Logistical support from PeaceCorps – Panamá and Azuero Earth Project. EB-M: Zoological Society of London and American Society of Mammalogists for providing funding. Sistema Nacional de Áreas de Conservación of Costa Rica for logistical support. JAT and MR: Conservation Program of Endangered Species (PROCER-Mexico) of the National Commission of Protected Areas (CONANP-Mexico) and the Natural Resources Protection Area La Frailescana.
Conflict of Interest
None.
Ethical Standards
None.
Acknowledgements
Angelica Diaz-Pulido, Andrew Carver, Carolina Saenz Bolaños, Celso Poot, Eduardo Carrillo Jimenez, Eduardo Mendoza, Francisco Botello, Jessica Fort, Joel Saenz, Manolo Garcia, Manuel Spinola, Marina Rivero, Nereyda Estrada, Oscar Godínez-Gómez, Rafael Reyna-Hurtado, Niall McCann, Raquel Leonardo and Sebastian Mejia are acknowledged for providing data.