1. Introduction
It is well established that global anthropogenic emissions of long-lived greenhouse gases (LLGHG) such as carbon dioxide (CO2) and nitrous oxide (N2O) and fluorinated gases are causing global climate change. More recently, air pollutants’ climate change impacts have been gaining recognition. For example, through the publication of the UNEP synthesis report on near-term climate protection (Kuylenstierna et al., Reference Kuylenstierna, Zucca, Amann, Cardenas, Chambers, Klimont, Hicks, Mills, Molina, Murray, Pearson, Sethi, Shindell, Sokona, Terry, Vallack, van Dingenen, Williams, Wilson and Zusman2011; Shindell et al., Reference Shindell, Kuylenstierna, Vignati, van Dingenen, Amann, Klimont, Anenberg, Muller, Janssens-Maenhout, Raes, Schwartz, Faluvegi, Pozzoli, Kupiainen, Hoglund-Isaksson, Emberson, Streets, Ramanathan, Hicks, Oanh, Milly, Williams, Demkine and Fowler2012) and creation of the Climate and Clean Air Coalition in 2012. Scientifically, these effects are discussed in the 5th and 6th climate change assessment reports published by the Intergovernmental Panel on Climate Change (IPCC) (Myhre et al. Reference Myhre, Shindell, Bréon, Collins, Fuglestvedt, Huang, Koch, Lamarque, Lee, Mendoza, Nakajima, Robock, Stephens, Takemura, Zhang, Stocker, Qin, Plattner, Tignor, Allen, Boschung, Nauels, Xia, Bex and Midgley 2013a; Forster et al., Reference Forster, Storelvmo, Armour, Collins, Dufresne, Frame, Lunt, Mauritsen, Palmer, Watanabe, Wild and Zhang2021; Szopa et al., Reference Szopa, Naik, Adhikary, Artaxo, Berntsen, Collins, Fuzzi, Gallardo, Scharr, Klimont, Liao, Unger, Zanis, Masson-Delmotte, Zhai, Pirani, Connors, Pean, Berger, Caud, Chen, Goldfarb, Gomis, Huang, Leitzell, Lonnoy, Matthews, Maycock, Waterfield, Yelekci, Yu and Zhou2021).
Air pollutants with effects on climate change are usually referred to as short-term climate forcers (SLCFs), although other terms have been used over the years. This group contains aerosols (fine particulate matter) and chemically reactive gases (Szopa et al., Reference Szopa, Naik, Adhikary, Artaxo, Berntsen, Collins, Fuzzi, Gallardo, Scharr, Klimont, Liao, Unger, Zanis, Masson-Delmotte, Zhai, Pirani, Connors, Pean, Berger, Caud, Chen, Goldfarb, Gomis, Huang, Leitzell, Lonnoy, Matthews, Maycock, Waterfield, Yelekci, Yu and Zhou2021). Some of these are mitigating the climate change induced by increased CO2 concentration in the atmosphere, while others are exacerbating climate change. Furthermore, many SLCFs are co-emitted with CO2 into the atmosphere through combustion of fossil fuels.
In contrast to LLGHGs, the climate change effect of SLCFs is affected by the source, region, as well as time of year for emissions (Aamaas et al., Reference Aamaas, Berntsen, Fuglestvedt, Shine and Bellouin2016). Given that LLGHGs are stringently and perpetually controlled, research shows that global temperature rise, and peak temperature can be slowed/reduced if SLCFs are increasingly controlled (Bowerman et al., Reference Bowerman, Frame, Huntingford, Lowe, Smith and Allen2013; Shoemaker et al., Reference Shoemaker, Schrag, Molina and Ramanathan2013).
The co-benefits of climate policy are often overlooked in climate change science and policy development. Nevertheless, there is a rapidly expanding knowledge on climate policy co-benefits, where improved air quality is the most examined co-benefit in the literature. However, more research is needed, including on how to describe the total economic value of different co-benefits (Karlsson et al., Reference Karlsson, Alfredsson and Westling2020). The need for integrating air quality and climate change policies is often highlighted by policy makers and researchers (Kuylenstierna & Hicks, Reference Kuylenstierna and Hicks2008; Maas & Grennfelt, Reference Maas, Grennfelt, Maas and Grennfelt2016; Vandyck et al., Reference Vandyck, Keramidas, Tchung-Ming, Weitzel and Van Dingenen2020).
Several SLCFs are governed by environmental policies in the European Union (e.g., the EU National Emissions Reduction Commitment (NEC) Directive) and the UNECE (the Convention on Long Range Transboundary Air Pollutants (CLRTAP)) due to their effects on air quality. These include emissions of sulphur dioxide (SO2), nonmethane volatile organic compounds (NMVOC), nitrogen oxides (NOx), ammonia (NH3), and fine particular matter with an aerodynamic diameter below 2.5 μm (PM2.5). PM2.5 is of special interest for climate change since the subspecies black carbon (BC) exacerbates climate change (Bond et al., Reference Bond, Zarzycki, Flanner and Koch2011), while the other main subspecies organic carbon (OC) mitigates climate change (Collins et al., Reference Collins, Fry, Yu, Fuglestvedt, Shindell and West2013). The climate effect of the noncarbonaceous residual parts of PM2.5 (PMres) has not been studied explicitly. The greenhouse gas methane (CH4), which is included in the SLCF group due to its relatively short atmospheric perturbation time of about a decade (Aamaas et al., Reference Aamaas, Berntsen, Fuglestvedt, Shine and Bellouin2016), is important for NEC and CLRTAP as a driver of ground-level ozone pollution, although not formally regulated in these (Sarofim et al., Reference Sarofim, Waldhoff and Anenberg2017; Mar et al., Reference Mar, Unger, Walderdorff and Butler2022).
For the air quality policies mentioned above, monetized economic damage costs of pollution are well established and used in benefit–cost analysis to guide policy development as in EU NEC and infrastructure developments such as the Eurovignette road charges. However, the current estimates of such damage costs mainly include effects on human health, material corrosion, crop growth, and some ecosystem damages (Holland, Reference Holland2014; Amann et al., Reference Amann, Borken-Kleefeld, Cofala, Heyes, Höglund-Isaksson, Kiesewetter, Klimont, Rafaj, Schöpp, Wagner, Winiwarter, Holland and Vandyck2020; Schucht et al., Reference Schucht, Real, Létinois, Colette, Holland, Spadaro, Opie, Brook, Garland and Gibbs2021). To make air pollution damage cost assessments more complete, and to better integrate air pollution and climate change research and policies, it is useful to monetize economic values of climate change damage costs induced by air pollutants with effects on radiative forcing.
Earlier examples of monetization of SLCF climate change costs are scarce in the literature, and when monetized they often focus on CH4 and aggregate climate change and human health effects. Such aggregation makes it difficult to use the values to complement already existing monetized damage costs of air pollution. The only applicable example we have found is Shindell (Reference Shindell2015), in which social costs of atmospheric release are presented for 2010 emissions. Shindell (Reference Shindell2015) shows inter alia that the monetized climate change costs of SLCF emissions in 2010 were US$2007 196,000, 8700, and 160 per ton BC, SO2, and NOx, respectively. However, Shindell (Reference Shindell2015) made the calculations for 2010 emissions and shows results for global emissions, while studies show that both emission year and emission region are important for the climate change effects of SLCFs (Shindell et al., Reference Shindell, Schulz, Ming, Takemura, Faluvegi and Ramaswamy2010; Aamaas et al., Reference Aamaas, Berntsen, Fuglestvedt, Shine and Bellouin2016). Shindell (Reference Shindell2015) also omitted some of the pollutants covered by the NEC Directive. For LLGHGs, climate change damage costs are better studied, and results are usually presented as social cost of carbon (SCC) or social cost of methane (SCM) (Nordhaus, Reference Nordhaus2017; Shindell et al., Reference Shindell, Fuglestvedt and Collins2017; Ricke et al., Reference Ricke, Drouet, Caldeira and Tavoni2018; Hänsel et al., Reference Hänsel, Drupp, Johansson, Nesje, Azar, Freeman, Groom and Sterner2020).
In summary, it is important to integrate climate and air policy and research, and economic valuations of emissions are important for air pollution and climate policy but are currently incomplete. Furthermore, there is a lack of earlier studies, and there is some incompleteness in Shindell (Reference Shindell2015). Correspondingly, the purpose of the analysis made in this study is to present economic damage costs of European air pollutants’ effect on climate change for current and future years. We analyze and estimate the climate change damage costs of European emissions of short-lived climate pollutants and compare these costs with established economic damage costs of air pollution in Europe.
2. Data and method
Estimating the climate impact of a given SLCF with large-scale climate models costs time and money and requires an effort that is beyond the capacity of most climate policy studies, including SLCF studies (Aamaas et al., Reference Aamaas, Peters and Fuglestvedt2013). Hence, it is common to use greenhouse gas (GHG) emission metricsFootnote 1 such as global warming potential (GWP), global temperature potential (GTP), or regional temperature potential normalized against the climate impact of CO2 or CH4 (Myhre et al. Reference Myhre, Shindell, Bréon, Collins, Fuglestvedt, Huang, Koch, Lamarque, Lee, Mendoza, Nakajima, Robock, Stephens, Takemura, Zhang, Stocker, Qin, Plattner, Tignor, Allen, Boschung, Nauels, Xia, Bex and Midgley2013a; Aamaas et al., Reference Aamaas, Berntsen, Fuglestvedt, Shine and Bellouin2016, Forster et al., Reference Forster, Storelvmo, Armour, Collins, Dufresne, Frame, Lunt, Mauritsen, Palmer, Watanabe, Wild and Zhang2021). This use of metrics allows for quick estimates of the climate impact—or rather climate equivalent (ex: CO2eq, CH4eq) emissions—that LLGHG and SLCF emissions give rise to (Schmale et al., Reference Schmale, van Aardenne and von Schneidemesser2014).
To identify numerical values of SLCF climate impact, we expand on the literature search made in Åström and Johansson (Reference Åström and Johansson2019), with focus on the recent IPCC assessment report and completeness with respect to coverage of all SLCF pollutants of relevance for this study (Myhre et al. Reference Myhre, Shindell, Bréon, Collins, Fuglestvedt, Huang, Koch, Lamarque, Lee, Mendoza, Nakajima, Robock, Stephens, Takemura, Zhang, Stocker, Qin, Plattner, Tignor, Allen, Boschung, Nauels, Xia, Bex and Midgley2013a; Forster et al., Reference Forster, Storelvmo, Armour, Collins, Dufresne, Frame, Lunt, Mauritsen, Palmer, Watanabe, Wild and Zhang2021; Szopa et al., Reference Szopa, Naik, Adhikary, Artaxo, Berntsen, Collins, Fuzzi, Gallardo, Scharr, Klimont, Liao, Unger, Zanis, Masson-Delmotte, Zhai, Pirani, Connors, Pean, Berger, Caud, Chen, Goldfarb, Gomis, Huang, Leitzell, Lonnoy, Matthews, Maycock, Waterfield, Yelekci, Yu and Zhou2021). The literature search is made with Google scholar. The most common metrics have shortcomings in their ability to correctly represent long-term effects on climate change as emission levels change over time, especially when moving toward low-GHG emission futures (Allen et al., Reference Allen, Shine, Fuglestvedt, Millar, Cain, Frame and Macey2018). Correspondingly, several new metrics have been developed, most prominently GWP* (Allen et al., Reference Allen, Shine, Fuglestvedt, Millar, Cain, Frame and Macey2018; Cain et al., Reference Cain, Lynch, Allen, Fuglestvedt, Frame and Macey2019; Smith et al., Reference Smith, Cain and Allen2021) and the Combined GTP and GWP (CGTP, CGWP) (Collins et al., Reference Collins, Frame, Fuglestvedt and Shine2020). These metrics are better at representing the actual climate impact of SLCFs in emission scenarios, by allowing for consideration of both emission “rates” (historic changes) and emission “stocks” for a given year. But it has been shown that these metrics can give unexpected and reversed metric values if emissions are decreasing rapidly (Dhakal et al., Reference Dhakal, Minx, Toth, Abdel-Aziz, Meza, Hubacek, Jonckheere, Kim, Nemet, Pachauri, Tan, Wiedmann, Amon and Stern2022), as is the case for emissions of most European SLCFs considered in this study. Further, Dhakal et al. (Reference Dhakal, Minx, Toth, Abdel-Aziz, Meza, Hubacek, Jonckheere, Kim, Nemet, Pachauri, Tan, Wiedmann, Amon and Stern2022) report that although the most common GWP 100 metric poorly reflects climate change effects at a specific point in time, it is estimated to be consistent with use in cost–benefit analyses (in which the cumulative effect over time is of interest).
Likewise, climate damage costs are usually estimated with climate integrated assessment models with economic activities represented, such as DICE (Nordhaus, Reference Nordhaus2017), FUND (Anthoff & Tol, Reference Anthoff and Tol2014; Waldhoff et al., Reference Waldhoff, Anthoff, Rose and Tol2014), PAGE (Hope, Reference Hope2011; Yumashev, Reference Yumashev2020), and IMAGE (van Vuuren et al., Reference van Vuuren, den Elzen, Lucas, Eickhout, Strengers, van Ruijven, Wonink and van Houdt2007). These models are used to estimate the SCC which is a useful estimate for policymakers to determine the proposed costs and benefits of a climate policy (Carleton & Greenstone, Reference Carleton and Greenstone2021). The SCC is used to estimate, in monetary terms, the discounted social costs of all damages caused by burning an additional unit of CO2. In other words, the SCC indicates how much it is worth to avoid emissions today to avoid predicted damages in the future. Analogous metrics for methane (CH4) and N2O have been estimated using the same methodology as for CO2 (Rennert et al., Reference Rennert, Prest, Pizer, Newell, Anthoff, Kingdon, Rennels, Cooke, Raftery, Ševčíková and Errickson2021).
To identify climate damage costs of SLCFs, we conduct a structured literature search in Google Scholar using the search words “social cost of carbon” and “social cost of methane.” The first 20 papers have been selected for further consideration in this study. The reliability and policy usefulness of these modeled SCC estimates are contested (Pindyck, Reference Pindyck2013, Reference Pindyck2017; Pezzey, Reference Pezzey2019), and values resulting from these models are varying dependent on model functionality, emission year, and assumptions. Earlier studies presented SCC estimates of, for example, US$ 4–9 per ton carbon (Pearce, Reference Pearce2003), but recent studies are showing higher values: US$ 31 and US$ 34 per ton CO2 emitted in 2015 (Nordhaus, Reference Nordhaus2017, Reference Nordhaus2018) and US$ 177–805 per ton CO2 in 2020 (Ricke et al., Reference Ricke, Drouet, Caldeira and Tavoni2018). A recent review by Wang et al. (Reference Wang, Deng, Zhou and Yu2019) shows values of US$ 31 per ton CO2 as an average assessment over several IAM model studies. The three-model assessments made by the US Interagency Working Group on Social Cost of Greenhouse Gases (2021) presents average social costs of carbon values of US$ 54/ton CO2 in 2020, rising to 88 in 2050 when assuming a 3% discount rate.
Partly as a response to the criticism against these modeled social costs of carbon estimates, more recent studies utilize expert surveys to derive SCC estimates. Pindyck (Reference Pindyck2019) presents SCC values of US$ 80–100 per ton CO2 when removing outlier responses, and Hänsel et al. (Reference Hänsel, Drupp, Johansson, Nesje, Azar, Freeman, Groom and Sterner2020) present SCC values of US$ 101–208 per ton CO2 emitted in 2020, rising to some US$400–500 by 2100.
The representation of damages incorporated into the term SCC is not always represented in detail in the literature. Knowledge about the damages considered in the models is important for our study to avoid double counting with other already quantified damage costs of SLCFs. For some models, the information is readily available. For the FUND model, the damage costs are functions of temperature and sometimes CO2-concentrations and include effects on agriculture, forestry, water resources, energy consumption for space heating and cooling, sea level rise, ecosystems (biodiversity, species, landscape), human health (diarrhea, vector-borne diseases, cardiovascular and respiratory mortality, morbidity), and extreme weather (tropical storms, extratropical storms) (Anthoff & Tol, Reference Anthoff and Tol2014). Out of these damages, only cardiovascular and respiratory mortality and mortality are at potential risk of double counting, but since they are functions of temperature and do not include any relation to air quality, the risk is deemed as insignificant.
Even though SCC is the dominant indicator used to describe damages from climate change, there are indications in the literature that other metrics are more useful when estimating climate change effects of SLCF emissions.
According to Martín (Reference Martín2021), the SCM is a preferred metric to be used when policymaking is specifically aimed at reducing the impact of methane emissions. Although not as common as the SCC estimates, there are a several studies presenting values for social costs of methane. Shindell et al. (Reference Shindell, Fuglestvedt and Collins2017) present social costs of methane to be US$ ~3600 per ton CH4 when calculated with a 3% discount rate, and Errickson et al. (Reference Errickson, Keller, Collins, Srikrishnan and Anthoff2021) present values of US$ 471–1570 per ton of CH4 in a high temperature scenario. Furthermore, Colbert et al. (2020) present a central value estimate of US$ 1163/ton CH4 when calculated with a 3% discount rate. Martín et al. (Reference Martín, Azar, Johansson and Sterner2022) present SCM for an abatement scenario to be US$ 7000/ton CH4 in 2020, rising to 15,300/ton in 2050. The US Interagency Working Group on Social Cost of Greenhouse Gases (2021) also presents average SCM values of US$ 1557 /ton CH4 in 2020, rising to US$ 3234/ton CH4 in 2050 for a 3% discount rate, although the latter values have been criticized since the models used does not incorporate all known climate damages or reflect the pathways with which methane affects climate correctly (Howard, Reference Howard2014; Martín et al., Reference Martín, Azar, Johansson and Sterner2022; Shindell et al., Reference Shindell, Fuglestvedt and Collins2017).
2.1. Data selection
2.1.1. Climate change impact of short-lived climate forcers
As mentioned, the academic literature contains a range of metrics developed for different purposes and catching different perspectives. Most of the estimates are made for single pollutants, and various regional scales are produced with different types of models. However, given the policy importance of the IPCC climate change assessment reports, it is natural to focus on the metrics expressed there, i.e., GWP integrated over 20 and 100 years (GWP20, GWP100) and GTP with a 20- and 100-year time horizon (GTP20, GTP100) and emissions from Europe. The IPCC AR6 does not make any recommendations on which emission metric to use for which purposes. Neither does it provide any synthesis of emission metric values for all the pollutants considered in our study (Forster et al., Reference Forster, Storelvmo, Armour, Collins, Dufresne, Frame, Lunt, Mauritsen, Palmer, Watanabe, Wild and Zhang2021; Szopa et al., Reference Szopa, Naik, Adhikary, Artaxo, Berntsen, Collins, Fuzzi, Gallardo, Scharr, Klimont, Liao, Unger, Zanis, Masson-Delmotte, Zhai, Pirani, Connors, Pean, Berger, Caud, Chen, Goldfarb, Gomis, Huang, Leitzell, Lonnoy, Matthews, Maycock, Waterfield, Yelekci, Yu and Zhou2021). Therefore, we use the same source material for European emissions in this study as was used in AR5 (Shindell et al., Reference Shindell, Faluvegi, Koch, Schmidt, Unger and Bauer2009; Collins et al., Reference Collins, Fry, Yu, Fuglestvedt, Shindell and West2013; Myhre et al., Reference Myhre, Shindell, Bréon, Collins, Fuglestvedt, Huang, Koch, Lamarque, Lee, Mendoza, Nakajima, Robock, Stephens, Takemura, Zhang, Stocker, Qin, Plattner, Tignor, Allen, Boschung, Nauels, Xia, Bex and Midgley2013a,Reference Myhre, Shindell, Bréon, Collins, Fuglestvedt, Huang, Koch, Lamarque, Lee, Mendoza, Nakajima, Robock, Stephens, Zhang, Aamaas, Boucher, Dalsøren, Daniel, Forster, Granier, Haigh, Hodnebrog, Kaplan, Marston, Nielsen, O’Neill, Peters, Pongratz, Ramaswamy, Roth, Rotstayn, Smith, Stevenson, Vernier, Wild, Young, Jacob, Ravishankara, Shine, Stocker, Qin, Plattner, Tignor, Allen, Boschung, Nauels, Xia, Bex and Midgley b).
We accommodate for metric value uncertainty by assigning low, mid, and high numerical values of CH4eq and CO2eq emissions for each pollutant and emission metric. The low and high numerical values correspond to 5th and 95th percentiles, respectively.
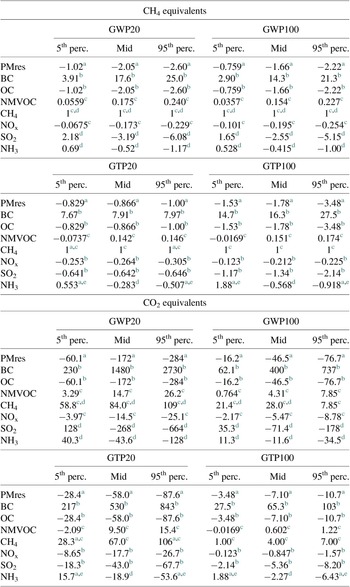
To achieve the data presented in Table 1, we make several adaptations of literature data. As in the literature, we assume that the uncertainty of SLCF climate impact is normally distributed. Correspondingly, when literature uncertainty is given as one standard deviation, we inflate the range into 5th and 95th percentiles with the equation:
 $$ x=\mu + Z\sigma $$
Metric values for European SLCF emissions as CH4-equivalences and CO2-equivalences per pollutant and emission metric considered in the analysis.

Note: Due to lack of consistent data, values for SO2 and NH3 are for global emissions.
a Own assumption.
b Collins et al. (Reference Collins, Fry, Yu, Fuglestvedt, Shindell and West2013).
e Shindell et al. (Reference Shindell, Faluvegi, Koch, Schmidt, Unger and Bauer2009).
where x = the value for a given percentile.
μ = the average value.
Z = percentile-specific constant (−1.645 for the 5th percentile, +1.645 for the 95th percentile).
σ = the standard deviation.
For GWP20 and GWP100 values, we make the following adjustments. The uncertainty range for absolute GWP (AGWP) for BC in Collins et al. (Reference Collins, Fry, Yu, Fuglestvedt, Shindell and West2013) is normalized against the AGWP for CO2 and used as indicator of the uncertainty range for BC. We assume that the GWP20 values for OC are identical to those for particulate organic matter in Collins et al. To indicate GWP20 uncertainty range for OC, we use the same approach as for BC as presented above. For NMVOC and NOx, the values in Myhre et al. (Reference Myhre, Shindell, Bréon, Collins, Fuglestvedt, Huang, Koch, Lamarque, Lee, Mendoza, Nakajima, Robock, Stephens, Takemura, Zhang, Stocker, Qin, Plattner, Tignor, Allen, Boschung, Nauels, Xia, Bex and Midgley2013a); Table 8.A.5 & Table 8.A.3 are given for the carbon content of NMVOC and nitrogen content of NOx, respectively. These thus needed to be converted to NMVOC and NOx equivalences. For this conversion, we assume an NMVOC molar weight of 44 g/mol, out of which 36 g is carbon (corresponding to propane), and we assume an NOx molar weight of 38 g/mol (out of which 14 is nitrogen). For CH4, we use the values from Tables 8.7 and 8.SM.14 in Myhre et al. (Reference Myhre, Shindell, Bréon, Collins, Fuglestvedt, Huang, Koch, Lamarque, Lee, Mendoza, Nakajima, Robock, Stephens, Takemura, Zhang, Stocker, Qin, Plattner, Tignor, Allen, Boschung, Nauels, Xia, Bex and Midgley2013a,Reference Myhre, Shindell, Bréon, Collins, Fuglestvedt, Huang, Koch, Lamarque, Lee, Mendoza, Nakajima, Robock, Stephens, Zhang, Aamaas, Boucher, Dalsøren, Daniel, Forster, Granier, Haigh, Hodnebrog, Kaplan, Marston, Nielsen, O’Neill, Peters, Pongratz, Ramaswamy, Roth, Rotstayn, Smith, Stevenson, Vernier, Wild, Young, Jacob, Ravishankara, Shine, Stocker, Qin, Plattner, Tignor, Allen, Boschung, Nauels, Xia, Bex and Midgley b). For SO2, we cannot find any literature on global climate change impact of European emissions but used the global values presented by Shindell et al. (Reference Shindell, Faluvegi, Koch, Schmidt, Unger and Bauer2009). Global values from the same source are used for NH3, with the added assumption that Shindell et al. (Reference Shindell, Faluvegi, Koch, Schmidt, Unger and Bauer2009) express values per unit nitrogen in NH3 (molar weight NH3 = 17 g / mol).
For GTP20 and GTP100 values for BC, OC, NOx, and SO2, we use Table 2 values in Collins et al. (Reference Collins, Fry, Yu, Fuglestvedt, Shindell and West2013). For NMVOC, we use values reported in Myhre et al. (Reference Myhre, Shindell, Bréon, Collins, Fuglestvedt, Huang, Koch, Lamarque, Lee, Mendoza, Nakajima, Robock, Stephens, Takemura, Zhang, Stocker, Qin, Plattner, Tignor, Allen, Boschung, Nauels, Xia, Bex and Midgley2013a); Table 8.A.5. The values for CH4 are taken from Table 8.7 and page 713 in Myhre et al. (Reference Myhre, Shindell, Bréon, Collins, Fuglestvedt, Huang, Koch, Lamarque, Lee, Mendoza, Nakajima, Robock, Stephens, Takemura, Zhang, Stocker, Qin, Plattner, Tignor, Allen, Boschung, Nauels, Xia, Bex and Midgley2013a). But for GTP20, no uncertainty ranges are given in the literature. We therefore assume that the ratio between reported uncertainty ranges for GWP100 and GWP20 is identical to the ratio between the reported GTP100 uncertainty range and the unknown GTP20 uncertainty range. For NH3, we use values from Table 8.SM.19 in Myhre et al. (Reference Myhre, Shindell, Bréon, Collins, Fuglestvedt, Huang, Koch, Lamarque, Lee, Mendoza, Nakajima, Robock, Stephens, Zhang, Aamaas, Boucher, Dalsøren, Daniel, Forster, Granier, Haigh, Hodnebrog, Kaplan, Marston, Nielsen, O’Neill, Peters, Pongratz, Ramaswamy, Roth, Rotstayn, Smith, Stevenson, Vernier, Wild, Young, Jacob, Ravishankara, Shine, Stocker, Qin, Plattner, Tignor, Allen, Boschung, Nauels, Xia, Bex and Midgley2013b) and assume that these are given per unit N (molar weight NH3 = 17 g/mol). To estimate uncertainty range of NH3, we use NH3 radiative forcing uncertainty range as reported in Shindell et al. (Reference Shindell, Faluvegi, Koch, Schmidt, Unger and Bauer2009) (emissions-based instantaneous radiative forcing for NH3 1750–2000 = −0.09 W/m2, uncertainty ±0.01 W/m2). For both GWP100 and GTP100, as recommended in Myhre et al. (Reference Myhre, Shindell, Bréon, Collins, Fuglestvedt, Huang, Koch, Lamarque, Lee, Mendoza, Nakajima, Robock, Stephens, Takemura, Zhang, Stocker, Qin, Plattner, Tignor, Allen, Boschung, Nauels, Xia, Bex and Midgley2013a), we scale GWP100 and GTP100 values with 0.94 and 0.92 to accommodate for more recent knowledge on CO2 climate sensitivity. The metric values for PMres are assumed to be identical to those for OC. Finally, the CO2-equivalent values are renormalized to CH4-equivalences by using the corresponding CO2eq values of CH4 emissions as basis. In Table 1, whether the 5th and the 95th percentile values are assigned as low or high depends on whether the mid impact of the respective SLCF is warming or cooling.
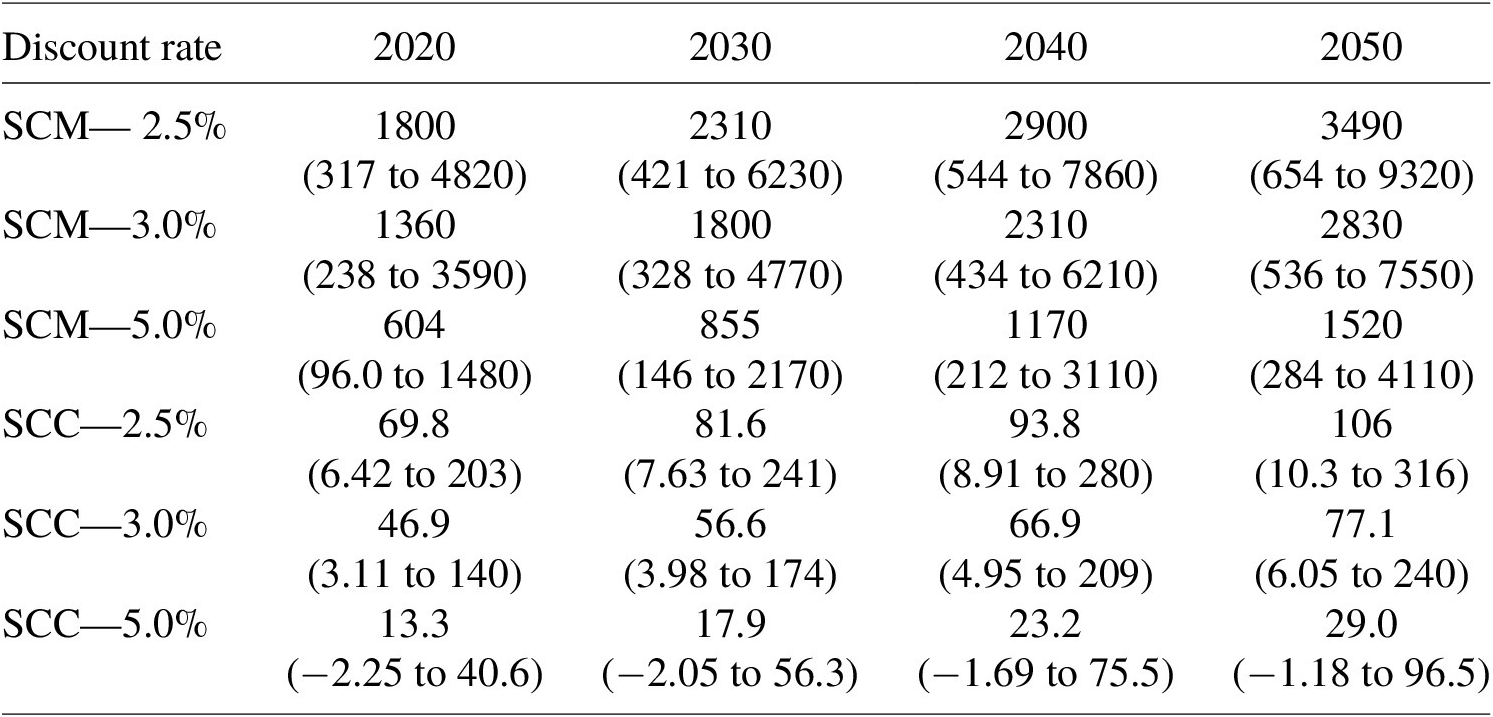
Social cost of methane (SCM) and carbon (SCC) in €2020/ton CH4 and €2020/ton CO2, 5th and 95th percentile within brackets.

2.1.2. Climate change damage costs
The climate change damage costs available in the literature are produced by a range of approaches and models, where model completeness and assumptions on economic growth, temperature, and discount rates can have large effects on the results. Furthermore, the values are inherently uncertain, while all estimates show increasing damage costs over time. Correspondingly, we do not average values of several papers and deemed papers with clear representation of uncertainty and development over time as most suitable for our calculations. With this criterion, it is only the US Interagency Working Group on Social Cost of Greenhouse Gases (2021) report that is suitable for further calculations. The SCM (and SCC) is taken from IWG and converted from dollars to euro (0.876 €/$) using the OECD exchange rate for 2020 (OECD, 2022).
Another consideration of importance for our study is that SCM and carbon estimates can be affected by assertions on economic growth, GHG emission control, and endogenous discount rates, since they include different future scenarios for how society will develop and which climate policies that are implemented. To reduce such uncertainty, we have removed the climate policy scenario “the 5 Scenario” from the SCC and SCM in the IWG 2021 report (Table 2). The resulting SCM and SCC values are seen in Table 2.
2.1.3. Adjusting for differences in atmospheric lifetime of pollutants
Although SCM is a more suitable metric than SCC, methane has a longer lifetime in the atmosphere and a different temporal profile (how long after an emission pulse that the temperature response occurs) than the other SLCFs. Since future values are discounted, it is reasonable to adjust the SCC values with respect to difference in temporal profiles. To do this, we use the results from IWG (2021) and information from Figure 6.15 in Szopa et al. (Reference Szopa, Naik, Adhikary, Artaxo, Berntsen, Collins, Fuzzi, Gallardo, Scharr, Klimont, Liao, Unger, Zanis, Masson-Delmotte, Zhai, Pirani, Connors, Pean, Berger, Caud, Chen, Goldfarb, Gomis, Huang, Leitzell, Lonnoy, Matthews, Maycock, Waterfield, Yelekci, Yu and Zhou2021) and the following assumptions:
-
• An emission pulse of an SLCF has no significant surface air temperature response after 400 years,
-
• the net-present values of SCM given by IWG are based on similar surface air temperature response temporal profiles as reported for gases with a 10-year lifetime as in Figure 6.15 in Szopa et al. (Reference Szopa, Naik, Adhikary, Artaxo, Berntsen, Collins, Fuzzi, Gallardo, Scharr, Klimont, Liao, Unger, Zanis, Masson-Delmotte, Zhai, Pirani, Connors, Pean, Berger, Caud, Chen, Goldfarb, Gomis, Huang, Leitzell, Lonnoy, Matthews, Maycock, Waterfield, Yelekci, Yu and Zhou2021).
-
• Mitigating and exacerbating SLCFs with the same lifetime have the same global mean surface air temperature response in absolute terms.
The full method description for the temporal profile adjustment is supplied in the Supplementary Material S1.
2.2. Calculations
2.2.1. Climate damage costs of European SLCF emissions
The calculation of SLCF climate change damage cost is made by multiplying the unit climate effect given by a specific emission metric (Table 1) with the economic unit damage cost for the specific year (Table 2):
 $$ SLCF\ Climate\hskip0.5em {damage\ cost}_{p,\hskip0.2em m,\hskip0.2em t,\hskip0.2em i}={CI}_{pm}\ast {DC}_{t,i} $$
where:
SLCF climate damage cost (€2020/ton pollutant).
CI = climate impact specified per SLCF (p) and per emission metric (m) (equivalent per ton pollutant).
DC = unit damage cost specified per year (t) and discount rate (i) (€2020 per equivalent).
The calculations are made in Microsoft Excel.
As mentioned in Section 1, standard emission metrics normalized against CO2 give unrealistic long-term climate impact of SLCFs when applied on emission scenarios (Allen Reference Rennert, Prest, Pizer, Newell, Anthoff, Kingdon, Rennels, Cooke, Raftery, Ševčíková and Errickson2018), which can cause confusion when prioritizing climate mitigation solutions according to their cost-effectiveness. As a response, researchers have advocated that policymakers indicate how much of the policy target that consists of controlling long-lived climate forcers and how much that consists of controlling short-lived climate forcers (SCLFs) (Allen et al., Reference Allen, Peters, Shine, Azar, Balcombe, Boucher, Cain, Ciais, Collins, Forster, Frame, Friedlingstein, Fyson, Gasser, Hare, Jenkins, Hamburg, Johansson, Lynch, Macey, Morfeldt, Nauels, Ocko, Oppenheimer, Pacala, Pierrehumbert, Rogelj, Schaeffer, Schleussner, Shindell, Skeie, Smith and Tanaka2022). In that spirit, in this study we chose to make the main calculations based on GWP100 CH4-equivalents, SCM as representing climate damage costs, and a 3% discount rate as recommended by the IWG 2021 report and consistent with GWP100 for CH4 (Dhakal et al., Reference Dhakal, Minx, Toth, Abdel-Aziz, Meza, Hubacek, Jonckheere, Kim, Nemet, Pachauri, Tan, Wiedmann, Amon and Stern2022).
In our sensitivity analysis, we also calculate SLCF climate damage costs for the metrics GTP20, GTP100, and GWP20 normalized against both CO2 and CH4 and use also social costs of carbon to represent climate damage costs. Furthermore, we make the calculations over 2.5%, 3.0%, and 5% discount rates.
2.2.2. Comparing with human health and environmental damage costs
Although our results will improve the completeness of an air pollution cost–benefit analysis, it is also interesting to study whether these climate damage costs are small or large in comparison with more established damage costs of air pollution. To explore this, we compare our results with the reported country-specific damage costs European air pollution in 2017 (Schucht et al., Reference Schucht, Real, Létinois, Colette, Holland, Spadaro, Opie, Brook, Garland and Gibbs2021). These established costs include consideration of human health, damages to buildings, and crop losses, but not damages through acidification, eutrophication, and biodiversity loss. Since the climate damage costs increase over time, we need to extrapolate the results from Schucht from 2017 until 2050. Following recommendations from the literature (Atkinson et al., Reference Atkinson, Braathen, Groom and Mourato2018), we inflate the part of the damage costs in Schucht et al. (Reference Schucht, Real, Létinois, Colette, Holland, Spadaro, Opie, Brook, Garland and Gibbs2021) that are based on willingness-to-pay studies with an assumed growth in real income of 2% per year between 2017 and 2050. The remaining costs are as reported in Schucht. We use the values from Schucht based on damages estimated with respect to life expectancy and values of life-years lost.
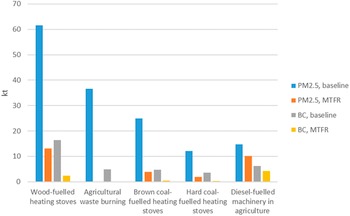
Another interesting comparison relates to the fact that the exacerbating BC emissions always are co-emitted with mitigating OC and PMres emissions, but the proportions are source dependent. To show the net effect on climate damage costs from BC-sources, we compare the effects on climate damage costs if implementing best available technologies to reduce PM2.5 emissions in sectors which are known to cause relatively high BC emissions. Supporting data from this comparison are taken from UNECE (2021) (Figure 1).
Modeled emissions in the European Union, Norway, Switzerland, and the United Kingdom from high black carbon priority sectors in 2030—baseline versus maximum technically feasible reduction (kton). Figure copied from UNECE (2021), “Prioritizing reductions of particulate matter from sources that are also significant sources of black carbon - analysis and guidance.”

The difference between PM2.5 emissions and BC emissions is equal to OC and PMres emissions, so we can calculate sector-specific climate damage costs from 2030 PM2.5 emissions per sector for a scenario corresponding to expected use of PM2.5 emission control solutions (Baseline) and for a scenario corresponding to implementation of best available technological solutions (MTFR).
3. Results
3.1. Climate damage costs of European SLCF emissions
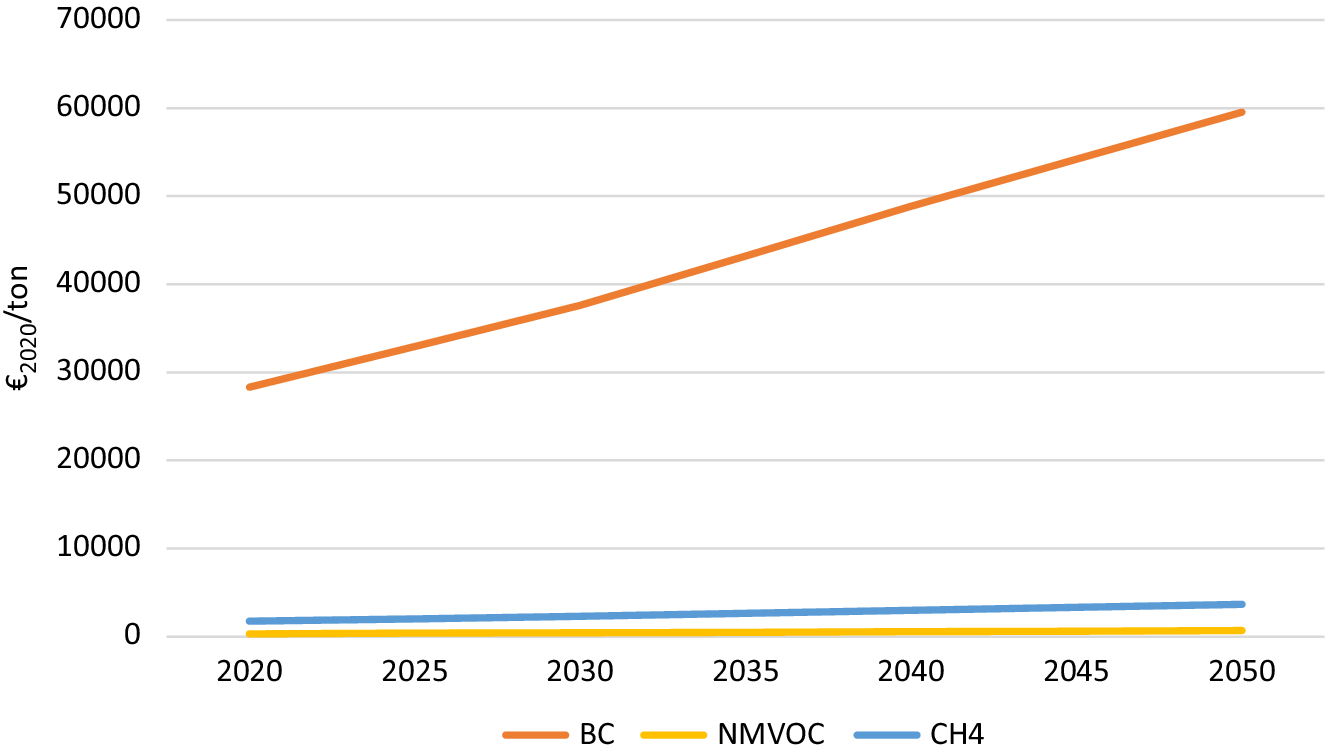
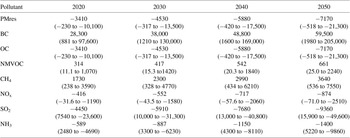
The results in this chapter are presented for the main calculations. Results from the sensitivity analysis are included in Supplementary Material S2. The results show that the EU-average climate damage costs per ton of exacerbating SLCF emissions are highest for black carbon and lowest for NMVOC (Figure 2). Following the increasing climate damage costs over time, the damage costs will almost double between 2020 and 2050.
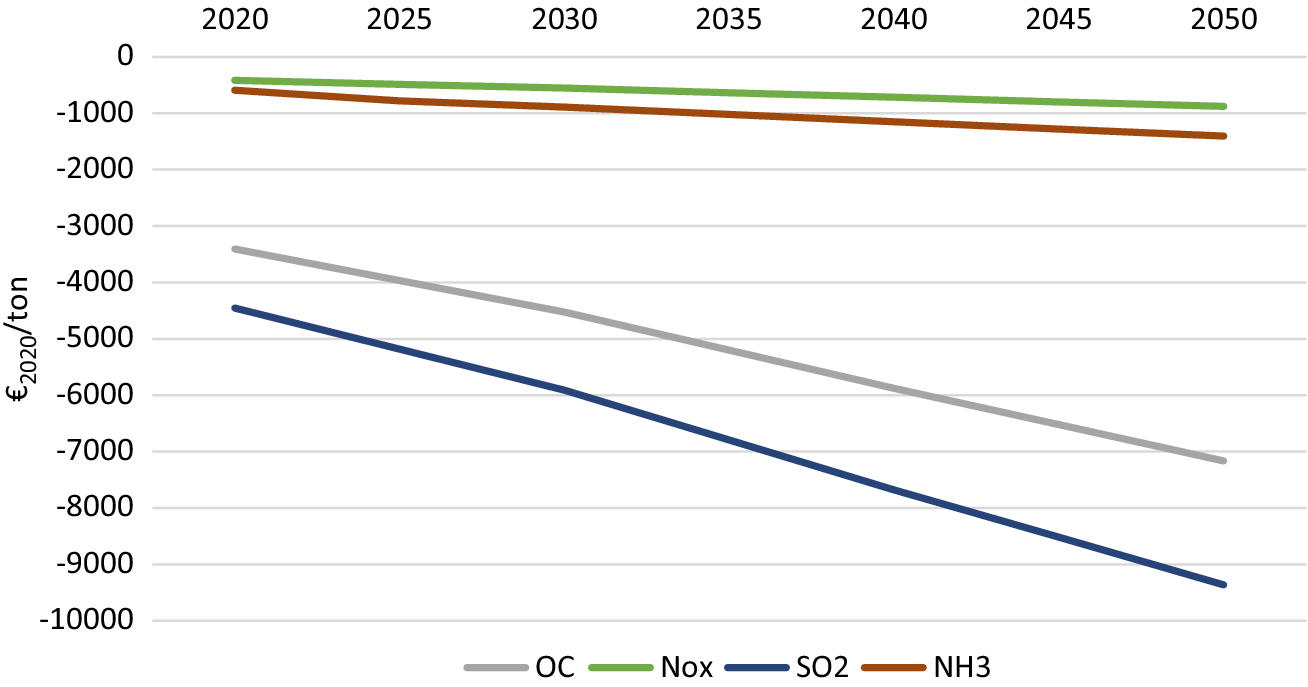
Average climate damage costs of mitigating European SLCF emissions (GWP100CH4eq, 3.0% discount rate).

For the mitigating SLCF emissions, average unit damage costs are lowest for SO2 and highest (least negative) for NOx (Figure 3). As for the exacerbating SLCFs, the absolute value of the climate damage costs will almost double between 2020 and 2050.
Average climate damage costs of exacerbating European SLCF emissions (GWP100CH4eq, 3.0% discount rate).

The calculations are made for the average, 5th and 95th percentiles values of both the emission metrics and climate damage costs to better illustrate the fat tail of climate damage costs. There is often a wide range between the maximum and minimum values of the SLCF climate damage costs (Table 3). The largest variance of the unit climate damage costs is found for BC, with a variance corresponding to more than a factor 100, and the smallest variance is found for NH3 and SO2, with variance factors corresponding to 2 and 3, respectively. Given the uncertainty in climate change impact of SO2 and NH3 stated in the literature, and the fact that we use data from global emission average GWP and GTP values for these, the climate damage costs of these SLCFs will in the outliers have an inverse sign from the average estimate. This outcome would not have been seen if the results would have been calculated on one standard deviation uncertainty of the climate change impact of SLCPs.
Average European SLCF climate damage costs, €2020/ton, GWP100CH4eq and 3.0% discount rate (results for the cumulative 10th and 90th percentiles within brackets).

The results presented in the sensitivity analysis (SM2) emphasize several aspects of relevance. First, utilizing the SCM as basis for estimation of climate damage costs—as we have done in the main calculations—provides substantially lower absolute values of the SLCF climate damage costs for 2020 than when we use social costs of carbon as basis. However, the increase in costs over time is steeper when based on SCM. For some pollutants, the 2050 climate damage costs of SLCFs are higher when based on SCM than on SCC.
3.2. Climate damage costs versus human health and environmental damage costs
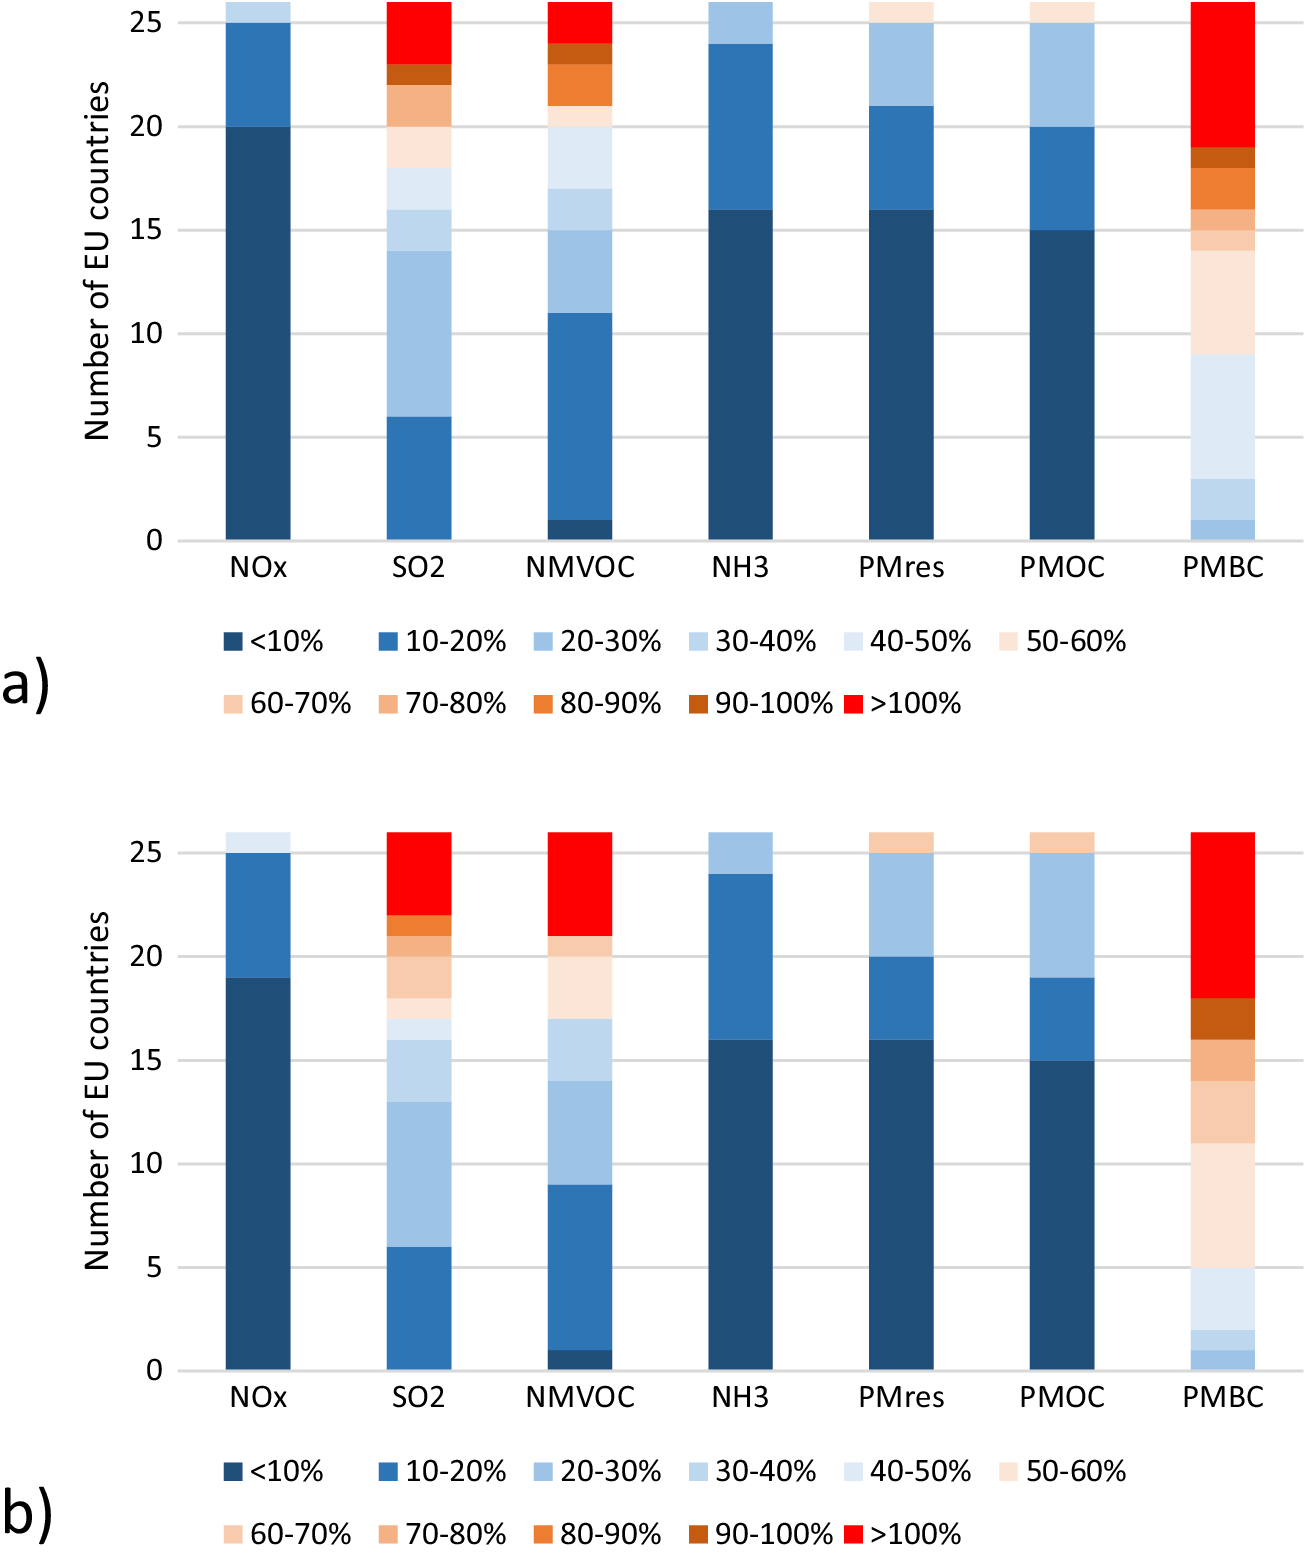
The comparison of our calculated climate damage costs and already established damage costs shows three things. First, for most pollutants and EU countries, our estimated climate damage costs of air pollution are smaller than the other damage costs. Second, while acknowledging that health costs can increase with an aging population, the absolute value of climate damage costs is increasing faster than the established external costs. Third, by 2050, there will be several pollutants and some countries for which the climate damage costs are larger than the other damage costs. Figure 4 shows how many countries that have climate damage costs/other damage cost ratios between 0 and > 100%, grouped into 10% intervals. In Figure 4, the climate damage costs are EU-average and pollutant-specific, while the other damage costs are based on pollutant- and country-specific effects in combination with EU-average monetized values per effect. All costs are for emissions in 2050. The figure shows that for 25 countries, the average climate damage costs of NOx emissions are under 20% of the other damage costs. It also shows that for BC, the average climate damage costs are larger than the other damage costs for eight of the EU countries.
Average 2030 (a) and 2050 (b) climate damage costs as shares of health damage costs for EU countries (GWP100CH4eq, 3.0% discount rate). The health damage costs are average values for all EU countries and the parts of the damage costs associated with mortality are based on effects on life expectancy and valued using Value of Life Year Lost.

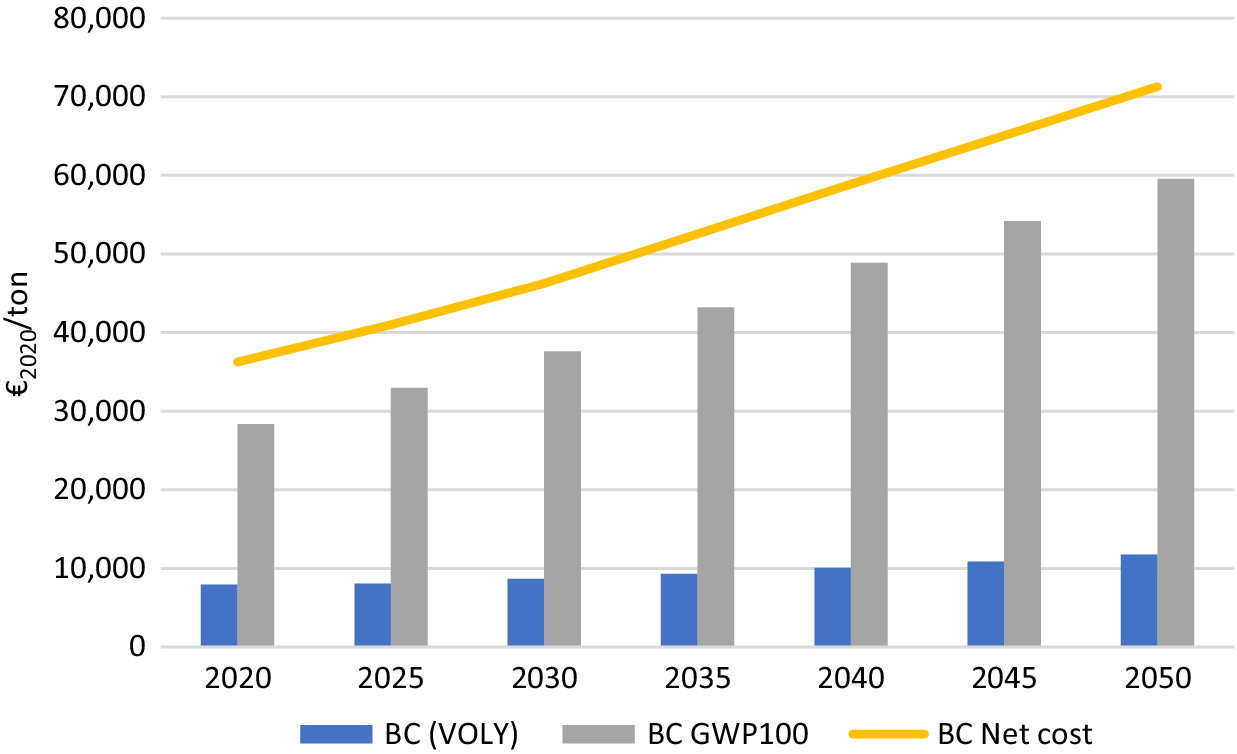
Although the overall picture is that climate damage costs are substantially lower than other damage costs, it is interesting to study some of the outliers. As an example, the damage costs of BC emissions from Estonia would be four times higher in 2020 if including climate damage costs indicated with GWP100, than given by only current damage cost estimates indicated with VOLY (Figure 5). Following increase in climate damage costs over time, the climate damage costs would become almost six times higher than the other damage costs by 2050.
BC health and climate damage costs in Estonia per ton emission. Average climate damage costs calculated for GWP100CH4eq and a 3.0% discount rate. Health damage costs are based on effects on life expectancy and valued using Value of Life Year Lost.

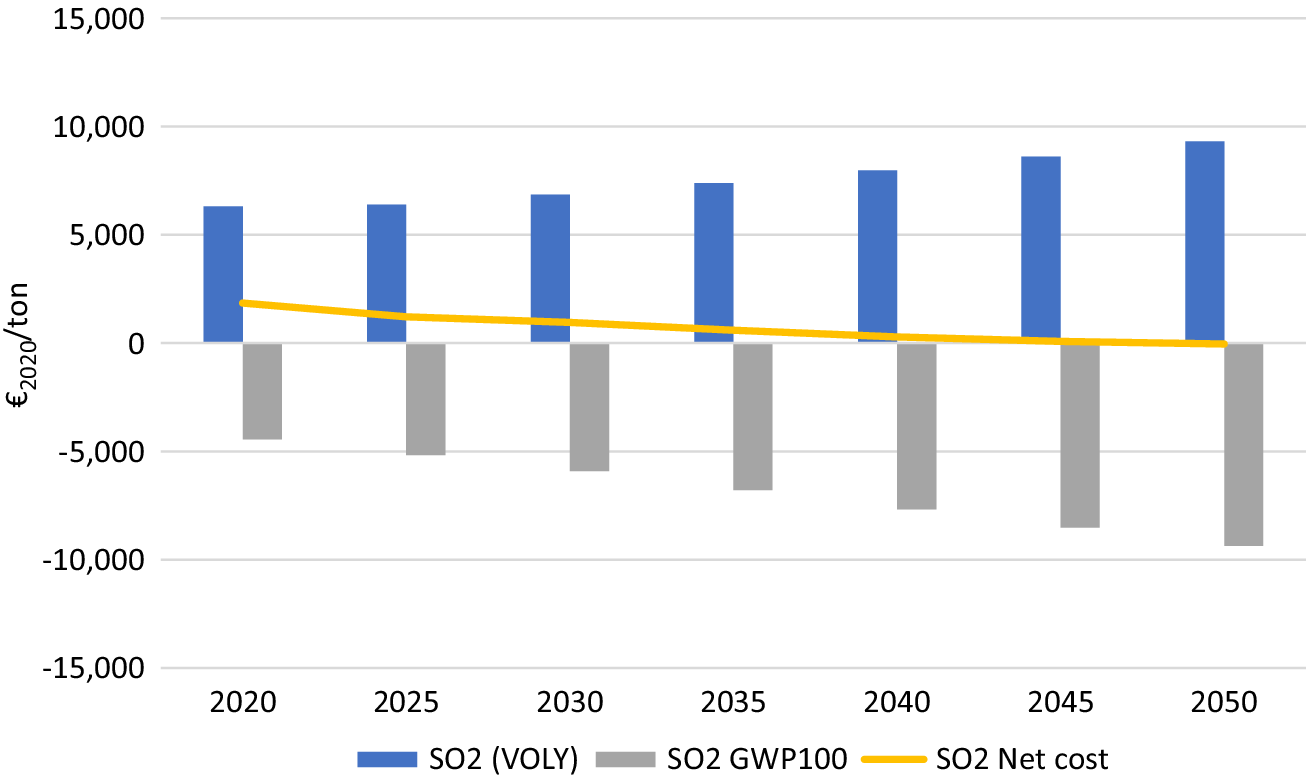
A counterexample can be seen for Swedish SO2 emissions. Here, the mitigating properties of SO2 emissions would be so high that by 2050 the net climate damage cost is just as large in absolute terms as the damage costs associated with effects on human health, crops, and buildings (Figure 6). It is however important to stress that established damage cost estimates of SO2 omit valuation of acidification, one of the key damages of SO2 emissions.
SO2 health and climate damage costs in Sweden per ton emission. Average climate damage costs calculated for GWP100CH4eq and a 3.0% discount rate. Health damage costs are based on effects on life expectancy and valued using Value of Life Year Lost.

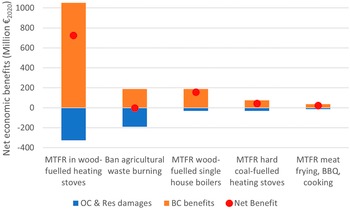
The resulting net effects on climate damage costs from strict PM2.5 emission control in BC-intensive sectors turn out to be rather varying between sectors (Figure 7). The results are shown as total benefits and costs through effect on climate damage costs in million €2020 per year in 2030, and the red dot shows the net benefit. If the red dot is above zero, the shift from standard solutions in a baseline scenario to strict emission control (MTFR) would imply reduction in climate damage costs, i.e., a socioeconomic benefit via reduced effect on climate change. The comparison shows that controlling EU PM2.5 emissions from wood-fueled heating stoves and boilers would imply large reductions in climate damage costs from PM2.5 emissions. They also show that a ban on agricultural waste burning would imply almost a net zero effect on climate damage costs.
Monetized total annual climate benefits and damages of European 2030 PM emission reductions in BC-intense sectors (GWP100CH4eq, 3.0% discount rate).

4. Discussion
Our results indicate varying climate damage costs of the analyzed air pollutants and provide a first attempt at increasing the completeness of future air pollution policy benefit assessments. The absolute value of the climate damage cost is largest for BC and smallest for NMVOC, because of their different GWP values. Furthermore, when comparing with already established human health and environmental damage costs of these SLCFs, the results show that climate damage costs for most SLCFs and EU countries are small compared to human health and environmental damage costs. But for SO2 and BC and a couple of countries, the absolute value of climate damage costs can be much higher than the other damage costs.
Although our economic values are based on SCM calculations, adapted with respect to differences in temporal profile for the SLCFs, we use the term climate damage costs to clarify that our values are slightly different from some of the other SCM values available in the literature. First, our values strive to only include the damage costs of emissions, not costs associated with low emission strategies. This ambition is to at least some extent ensured by only using climate scenarios with no active climate policy. Correspondingly, our climate damage costs are high due to high temperature scenarios in the supporting calculations. Second, we have checked so that the SCM studies used in our study excludes human health and environmental damages of elevated ozone concentrations driven by methane emissions. This is important since such values already are included in the established SLCF damage costs for the ozone precursors. Our values are thereby compatible with already published air pollution damage cost estimates.
Some of the results from the sensitivity analysis are relevant to highlight. Not surprisingly, the SLCF climate damage costs based on GWP20 are highest in absolute terms and lowest for GTP100. The use of SCC as basis for the calculations instead of SCM or social cost of other SLCFs would imply higher SLCF climate damage costs in 2020. Also, since the social costs of carbon estimates for 5% discount rate and the 5th percentile are negative, the end results based on SCC can be unexpected. The climate damage costs based on SCM and other SLCFs increase faster than those based on SCC. By 2050, the SLCF climate damage costs are often higher in absolute terms than the corresponding calculations based on SCC. As is implicit in the concept, the climate damage costs are higher when calculated based on low discount rates than with high discount rates.
There are numerous uncertainties and data gaps necessary to discuss prior to drawing conclusions. Looking at climate change impact, it can be discussed whether a constant value of GWP or GTP is reasonable to assume. Van Dingenen et al. (Reference Van Dingenen, Crippa, Maenhout, Guizzardi and Dentener2018) present that CH4 emissions are becoming more and more important for atmospheric formation of ozone in Europe. With European emissions of other ozone precursors (NOx, NMVOC) projected to decline due to air pollution regulations (Amann et al., Reference Amann, Borken-Kleefeld, Cofala, Heyes, Höglund-Isaksson, Kiesewetter, Klimont, Rafaj, Schöpp, Wagner, Winiwarter, Holland and Vandyck2020), CH4 might become more important for ozone formation in the future. Furthermore, the climate impact of CH4 is both short and long term, which is not fully captured in the GWP100 metric (Mar et al., Reference Mar, Unger, Walderdorff and Butler2022). Whether these aspects would change the emission metric values of the SLCFs is yet to be studied. Another phenomenon that could change the emission metric values of European SLCF emissions is the effect on the Arctic snow and ice cover, where continuing melting of the ice cap could for the future change the emission metric values of the SCLFs. Furthermore, our results are only based on European annual average emissions (global average for SO2 and NH3). But as shown by Aamaas et al. (Reference Aamaas, Berntsen, Fuglestvedt, Shine and Bellouin2016) inter alia, also the season affects the climate effect of SLCP emissions. Further, it can be argued that the metric values should be disaggregated into Arctic and non-Arctic emissions, given the importance for SLCFs on Arctic amplification.
With respect to economic values, it is known that the climate damages represented in calculations of the SCC and methane in the WGI model ensemble are incomplete (Howard, Reference Howard2014; Hänsel et al., Reference Hänsel, Drupp, Johansson, Nesje, Azar, Freeman, Groom and Sterner2020; Carleton & Greenstone, Reference Carleton and Greenstone2021). It is therefore reasonable to assume that our results are low estimates in absolute terms. Furthermore, there are potential regional climate effects that can change the sign of our values. As is presented in Shindell (Reference Shindell2015), the economic value of regional climate effect of aerosols can be just as large or larger in absolute terms than the global climate change values for several of the mitigating SLCFs. Through the regional climate effects, all SLCFs might have positive signs on the climate damage costs, in contrast to the values we present. However, adding some regional effects into the damage cost calculations renders some difficulty in interpretation of the results since also global climate change by some models is presented as economically beneficial for certain regions (Ricke et al., Reference Ricke, Drouet, Caldeira and Tavoni2018). Further yet, recent analysis on updated PAGE models (PAGE-ICE) reveals higher values for SCC (and thus SCM) than in the version used by IWG (2021), much due to inclusion of economic dynamic effects on economic growth (Kikstra et al., Reference Kikstra, Waidelich, Rising, Yumashev, Hope and Brierley2021). The manuscript by Martín et al. (Reference Martín, Azar, Johansson and Sterner2022) also shows larger values for SCM than used in this study.
Widening the discussion, it is important to mention that we have strived to remain consistent with the methodology used for calculating air pollution damage costs associated with effects on human health, the environment, and buildings. To do this, we are implicitly using SCM studies that are without any active CH4 or CO2 abatement and with high future temperatures and climate change. Our climate damage cost values are therefore best applicable to high-temperature futures. Given that the marginal damages associated with underpinning the climate damage costs are increasing with increasing temperature, the climate damage cost values for a 1.5- or 2.0-degree future would be lower than the ones we present here (for a given trajectory on economic growth and discount rates). On the other hand, the phenomena representing climate damage costs in the models are incomplete, and the values should thereby be considered underestimations. In here lies a conundrum for how to use these numbers in air pollution benefit–cost analyses. If one strives to be theoretically consistent, the climate damage cost values used should align to the projected temperature given the climate policies currently being implemented. But if doing so, the values might be lower than the ones presented here. In other words, the 1.5–2.0-degree targets are political targets set not always supported by current climate damage costs in the IAMs used as sources for our climate damage cost calculations. But if shifting to a marginal abatement cost approach or expert opinions as basis for climate damage costs, as proposed by Pezzey (Reference Pezzey2019) and Pindyck (Reference Pindyck2019), the climate damage cost values are no longer consistent with the approach taken when valuing, for example, health-related damage costs of SLCFs.
5. Conclusion
Based on the data, method, results, and discussion, we propose that an inclusion of climate damage costs into economic valuation of SLCF emissions is important for future air pollution and climate economic benefit–cost analyses and policy impact assessments. Given the uncertainties associated both with the physical effects and the economic damages, our numerical results are merely indicative. However, based on the understanding of climate change and climate economics developed over the last years, our indicative values are most likely underestimations.
Future research should focus on studying regional and seasonal emission metrics of all SLCFs already regulated in air pollution policies, and an exploration of whether emission metric values change for future years. With respect to economic research, more of the known climate impacts should be added to IAMs, and correlation between climate damage costs and endpoint temperature change should be illustrated to better represent SLCF climate damage costs correlated with existing climate policy targets.
Supplementary material
The supplementary material for this article can be found at http://doi.org/10.1017/bca.2023.8.
Competing interest
The authors declare none.