Introduction
Spain, like other European countries, has recently observed increases in the prevalence of overweight and obesity due to changing diets and activity patterns (Serra-Majem et al., Reference Serra-Majem, Ribas, Treserras, Ngo and Salleras1995; Moreno et al., Reference Moreno, Sarría and Popkin2002; WHO, 2006; OECD, 2008). For instance self-reported data from the Spanish National Health Surveys (SNHSs) that will be used in this study indicate that obesity among the Spanish population aged 16+ increased during the period 1987–2006 from 10% to 15%. In fact, according to the last survey more than half (52%) of all adults were either overweight or obese, compared with 43% in 1987.
This study aimed to provide a detailed description of trends in adult weight and BMI by disentangling age and sex differences. A quasi birth-cohort analysis on the data was also performed in order to better capture changing trends among different segments of the population. This is because exclusively employing standard cross-sectional analyses may mask generation-specific life course experiences related to nutrition, especially given the pace of the socioeconomic changes that have taken place in Spain since the 1950s.
Data and Methods
The Spanish National Health Survey
The dataset consists of self-reported height and weight from the micro-data of the SNHSs (waves of 1987, 1993, 1995, 1997, 2001, 2003 and 2006). This is the only Spanish national and sub-national representative health survey that has been conducted on a regular basis.
Subjects are randomly sampled by means of a complex multi-stage stratified sampling design according to age, sex and place of residence (region, province and municipality size). The adult health survey is taken among the non-institutionalized population aged 16+ and subjects are interviewed face-to-face. The wording of the questions on height and weight has remained constant across all waves. People were asked for their approximate height without shoes on and their approximate weight without clothes on. In the case of pregnant women, they were asked for their weight before pregnancy. For this study, respondents 20 years or older have been selected to prevent both large variations in body weight and height related to the completion of the physical growth process, and younger than 80 years of age in order to avoid sex, age and time/cohort combinations containing fewer than 500 cases. Moreover, previous studies on adult overweight and obesity from self-reported measures have mostly used ages up to 70 or 80 as irregularities are often observed in the information provided by elderly respondents (Kuczmarski et al., Reference Kuczmarski, Kuczmarski and Najar2001). Older people are also under-represented in the non-institutionalized population that is usually targeted for health surveys.
Cross-sectional and quasi cohort approaches
The SNHS is not a panel survey, meaning that people interviewed in one survey wave are not followed up in successive waves. Although this impedes performing a more typical longitudinal cohort study where the cohort acts as a baseline group whose health status is periodically checked, in demography and other social sciences alternative methods are applied to approximate a longitudinal study using cross-sectional data. Two illustrative examples are the calculation of life expectancy or the total fertility rate using synthetic cohorts.
In this study the different SNHSs, which covered almost two decades and included 120,550 persons aged 20–79, were aggregated into one database. Individuals were subsequently designated to so-called quasi birth-cohorts in function of their age and the year they were interviewed. The same dataset was recently used to show that average height – a personal characteristic that should not change over time once adulthood is reached and until the ageing-related shrinkage process sets in – varied insignificantly between surveys for all but the elderly population (Spijker et al., Reference Spijker, Pérez and Cámara2008). Hence, the data were considered suitable for the study of age- and time-specific changes in the average levels of weight and BMI of quasi birth-cohorts.
Notwithstanding, some small sample biases did have to be dealt with. As the elderly and the less-populated regions were oversampled during certain waves, samples were weighted with official population data from the National Statistics Institute (INE). Data were also screened for errors and omissions with respect to the variables age, sex, residence region, height and weight, reducing the sample size to 105,878 persons. In addition, the 1995 and 1997 waves were combined for the cross-sectional analyses due to their low sample sizes (respectively 4790 and 4970 respondents compared with 20,283 in 1987, 15,780 in 1993, 17,083 in 2001, 18,977 in 2003 and 23,995 in 2006).
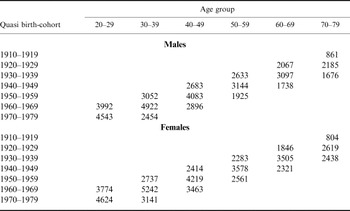
The sample reliability and its comparability across time and quasi birth-cohorts was further increased by calculating 10-year birth cohorts and aggregating single ages into 10-year age groups, whereby age–cohort combinations with fewer than 500 respondents were also discarded. This provided a final sample size of almost 100,000 (see Table 1).
Number of after-screening sample cases used in the analysis by sex, age and quasi birth-cohort

Source: micro-data from the Spanish National Health Surveys 1987–2003. Own calculations.
On the strength and limitations of cross-sectional self-reported anthropometrics for trend studies
Self-reported anthropometric measures are known to be biased in function of the age, sex and actual anthropometric measures of a respondent. For instance, with regard to height, older adults tend to over-report it (as they recall it from early adulthood), as do those who are short (Gunnell et al., Reference Gunnell, Berney, Holland, Maynard, Blane, Frankel and Smith2000). However, even though an over-reporting of height among the elderly produces an underestimation of the BMI, the bulk of BMI changes between successive age groups can be ascribed to weight changes. This is because shrinkage occurs gradually after age 50 (Birrell et al., Reference Birrell, Pearce, Francis and Parker2005) and mainly at older ages, accounting for a total loss of about 2–5 cm depending on the age reached by the subject (Borkan et al., Reference Borkan, Hults and Glynn1983; de Groot et al., Reference de Groot, Perdigao and Deurenberg1996; Dey et al., Reference Dey, Rothberg, Sundh, Bosaeus and Steen1999). This bias is also less relevant for age-specific cohort differences in BMI. In addition, the average self-reported male height obtained by the SNHSs was also comparable to Spanish military recruitment records (mandatory until the mid-1990s, and accordingly contains height data for male cohorts born before the mid-1970s) and should therefore be taken as the maximum height reached by a given cohort before the ageing-related shrinkage process sets in. This is to say that self-reported height provides a type of age-standardized measure that allows trends in BMI to be interpreted by changes in weight status.
As for the weight component of BMI, overweight and obese persons are more likely to under-report their weight, particularly young adult females (Rowland, Reference Rowland1990; Nawaz et al., Reference Nawaz, Chan, Abdulrahman, Larson and Katz2001; Ezzati et al., Reference Ezzati, Martin, Skjold, Vander Hoorn and Murray2006). Self-reported measures may therefore not be valid for epidemiological or clinical studies where a high accuracy at the individual level is required. However, given the high correlation between both types of data – even among the elderly who are less susceptible to the cultural pressures that lead to under-report weight (Lawlor et al., Reference Lawlor, Bedrod, Taylor and Ebrahim2002) – self-reported measures may still be used to establish long-term trends within large populations. Likewise, earlier tests on the reliability of self-reported weight from the SNHSs showed that, at least at the aggregated level, age- and sex-specific patterns match standard biological growth and maturation cycles (Cámara & Spijker, Reference Cámara and Spijker2008). As the human physical maturation process concludes around age 25, any increase in weight observed for the aggregated age interval 20–29 years may be partly attributable to it. After that, weight is more dependent on the individual's control irrespective of existing differences in metabolism that influence the exposure to overweight and obesity and therefore any weight change should be mostly read in environmental terms. Additionally, for women both pregnancy prevention (e.g. contraceptive pills contain oestrogens that may cause metabolic changes) and motherhood (women permanently keep some of the weight gained during pregnancy) are also factors that contribute to weight gain (Bogin, Reference Bogin1991).
Regarding Spanish literature on reported height and weight biases, a regional health survey held in Catalonia (north-eastern Spain) in 2006 included both self-reported and actual anthropometric measures, thus allowing potential biases of self-reported height and weight of this Spanish subpopulation aged 15–65 to be estimated (Gil & Mora, Reference Gil and Mora2009). It was found that, as expected, the oldest age group (56–65) tended to over-report its height the most (1.42 cm). The largest bias for weight was found among those aged 25–35. In total, authors estimate a mean underestimation of 1.42 kg in self-reported weight and a 0.64 cm gap between self-reported and measured height (i.e. individuals over-reported their statures). In terms of BMI this corresponds to a 3.5% and 2.1% bias for women and men aged 15–65, respectively. Similar values were obtained when BMI categories were analysed. For instance, if corrections based on this regional sample were applied to the last SNHS in 2006, obesity prevalence would rise from 15% to about 18%.
Finally, beyond the nature and specific problems of self-reported data, an additional limitation of using serial cross-sectional data for the analysis of cohort trends is the selective effect of mortality. This is especially the case for underweight or obese individuals. For instance, while the proportion of obese persons of a particular birth cohort can be calculated, the proportion of that cohort who already died from obesity is unknown. This bias would be most relevant for the eldest cohorts and will be subject of specific comments in the discussion section.
After the required data from the seven SNHSs were screened, the BMI was calculated by dividing the respondent's weight by the square of their height (kg/m2). Body mass index has become a widely used indicator to assess the prevalence of overweight and obesity once adulthood has been reached (Rolland-Cachera, Reference Rolland-Cachera, Ulijaszek, Johnston and Preece1998). Indeed, the weight and height measurements are precise (highly repeatable), accurate (close to the true value) and valid (representing what they are thought to present), correlating highly with fatness (% fat, fat mass) but less well with height (Norgan, Reference Norgan1994). One important criticism, however, of only using BMI in epidemiological studies is the lack of potentially important information on body composition (e.g. % fat, skinfold thickness) and shape (relative skeletal dimensions of the body). For this reason Norgan (Reference Norgan1994), who examined the relationships between BMI and body composition and shape in different population groups, concluded that while differences in the relationships of body composition to BMI are minor over the range of BMI 20–25 kg/m2, to interpret BMI in terms of body composition more specifically it is necessary to take into account sex, age and ethnicity (due to its relation to body shape). Although the aforementioned limitations are present in the SNHS data (i.e. on body composition and shape) the current study sample was mainly composed of Spanish nationals who are very homogenous in terms of ethnicity (Spanish nationals comprised 97% or more of the interviewees of the 1987 to 2003 surveys and 89% of the 2006 survey) and men and women and age groups were analysed separately. It is therefore unlikely that differences in body composition and shape will affect the results of BMI trends in a substantial manner.
Both continuous and the customary categorical BMI values are analysed, i.e. underweight (<18.5 kg/m2), normal weight (18.5–24.9 kg/m2), overweight (25.0–29.9 kg/m2) and obesity (>30.0 kg/m2).
Results
Cross-sectional analysis by sex and age
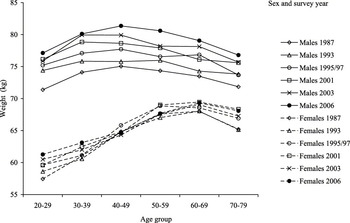
Between 1987 and 2006 average weight among Spanish adult males aged 20–79 increased steadily from 73.4 kg to 79.4 kg, a difference of 6 kg and an increase of 8.2%. Women, in turn, restricted the increase in average weight to just 1.8 kg (2.8%), equalling 65.1 kg in 2006, with no increase being observed since the mid-1990s. As shown in Fig. 1, age-specific increases observed for men were quite uniform over time. Increases ranged between 5.0 and 6.3 kg and were statistically significant at the 95% level. In contrast, weight increases observed between the first and last survey were much less among women, but nevertheless statistically significant for most age groups (20–29, 30–39, 60–69 and 70–79), ranging from 1.3 to 3.8 kg.
Weight by sex, age group and survey year. Source: micro-data from the Spanish National Health Surveys 1987–2003. Own calculations.

Quasi birth-cohort analysis by age and sex
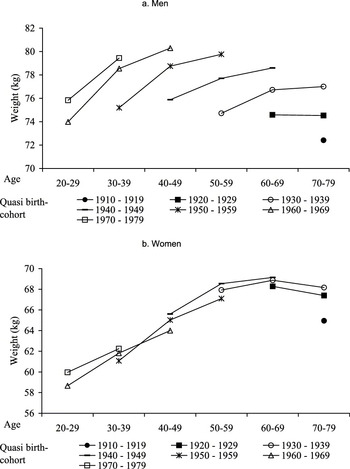
Figure 2 presents the change in average weight experienced by people belonging to quasi birth-cohorts at different ages. The results show for men that at any given age, each birth cohort is on average heavier than the previous one. For instance, the cohort 1920–29 weighted on average 74.6 kg when they were 60–69 years old. When the generation 1930–39 reached the same age, they weighted on average 76.7 kg. This increased a further 1.9 kg to 78.6 kg for those born between 1940 and 1949. While the results in Fig. 1 may partly be explained by changes in height across the different generations, Fig. 2 also manifests changes within the same quasi birth-cohort. It would also appear that the slope of changes in average weight between two 10-year age groups in the same cohort is steeper for the earlier cohorts, i.e. that weight increase occurs for younger cohorts at a faster rate and perhaps for a shorter period.
Weight by sex, age group and cohort. Source: micro-data from the Spanish National Health Surveys 1987–2003. Own calculations.

For females, 20- to 29-year-olds born in the 1970s were on average 1.3 kg heavier than those born 10 years earlier. A similar pattern can be found among 30- to 39-year-olds: the 1970–79 cohort weighted about 0.4 kg more than those born between 1960 and 1969, who, in turn, were 0.7 kg heavier than the 1950–59 quasi birth-cohort. On the other hand, regarding the 40- to 49-year-olds, the youngest 10-year cohort actually weighted less on average than when both older cohorts reached that age. For the two oldest age groups the pattern was again similar, though less pronounced, to that for men as the younger quasi birth-cohorts were heavier than the older ones. The exception was the 70–79 age group born in the 1920s who were 2.4 kg heavier on average than the 1910–19 cohort.
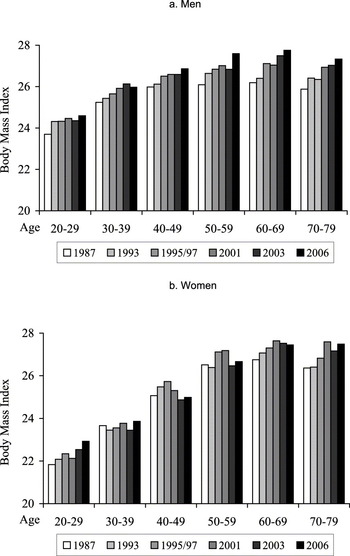
As regards to the results for male cohorts born since the 1940s and females after 1960, the heavier average weight observed in younger cohorts for a given age group is partly explained by their concomitant height increase, which is why BMI was analysed (Fig. 3). However, BMI also augmented over time among most adult age groups, especially men aged 30–79, the same age group that observed the largest increases in weight. If the first and last surveys (1987 and 2006) are compared, differences are most apparent in age groups 50–59, 60–69 and 70–79. The latter two age groups also witnessed BMI gains in the female population, whereas the younger age groups maintained relatively stable levels. The increase in average weight observed among 20- to 29-year-olds appears to be exclusively the result of an increase in height. To better assess whether the increases observed for the middle-aged and young–old are due to a shift towards overweight or obesity, for the first and last SNHS waves the BMI distributions for each age group and sex have also been analysed according to the different ordinal categories.
BMI by sex, age and survey year. Source: micro-data from the Spanish National Health Surveys 1987–2003. Own calculations.

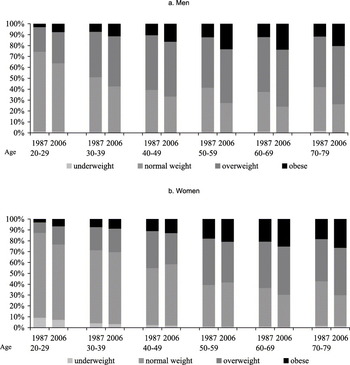
The proportion of the population between ages 20 and 79 years with a normal BMI declined between 1987 and 2006, although more among men (from 50.1% to 38.9%) than among women (55.3% to 52.1%). From this 11% net shift in the male population from normal to higher levels of BMI, overweight increased by 4.6% and obesity by 7.0%. Regarding women, the prevalence of overweight was stable between the two periods, although obesity increased by 3.3%.
As regards to specific age groups (Fig. 4), declines in normal levels of BMI among men are especially noticeable among young adults aged 20–29 (10.4%) and those between ages 50 and 79 (13–14% lower). Rather disconcerting as well is that for some age groups this came almost entirely on the account of the BMI category obesity. For instance, obesity in the male population aged 50–59 and 60–69 increased between 11% and 12%, i.e. doubling its level compared with 1987. Although this cannot be tested, the most likely scenario would be that most people move from one BMI category to a higher one, for example, from normal to overweight or from overweight to obesity. Overall, in 2006 three-quarters of 50- to 79-year-old men were either overweight or obese.
BMI category by sex, age group and first and last survey year. Source: micro-data from the Spanish National Health Surveys 1987–2003. Own calculations.

For each age group and both the first and last year analysed there were proportionally more women than men with normal BMI levels, whereby the sex difference also increased over time. Even so, the proportion with normal weight among women aged 20–29 and 70–79 declined substantially (respectively, from 78.1% to 69.3% and from 40.9% to 28.3%). Concomitantly, both the proportion of overweight and obese women aged 20–29 increased, respectively, from 9.7% to 16.8% and from 3.1% to 6.7%, while only the prevalence of obesity increased in the case of elderly women aged 70–79 (from 17.5% to 26.5%). Other age groups observed fewer changes in the BMI structure between the two periods. In 2006, the highest proportions with excess weight in the female population were observed for 60- to 69 and 70- to 79-year-olds (about 70%). While this is slightly less than for men, more women were perceived as obese.
Finally, while underweight plays an insignificant role among men, 7% of young women suffered from it in 2006. Among older women (30+), underweight is much less prevalent, with age-specific rates ranging between 1% and 3%. No clear discernable trend in underweight could be observed across health surveys.
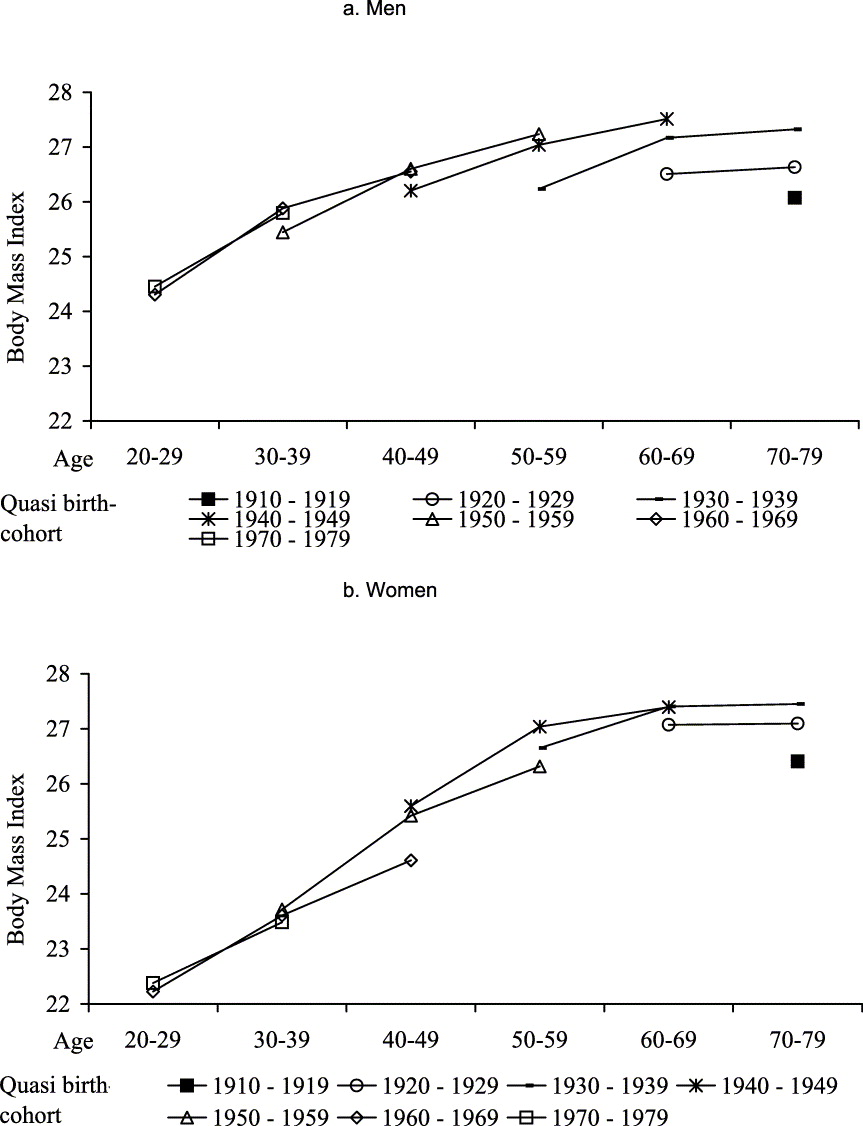
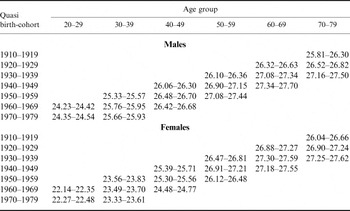
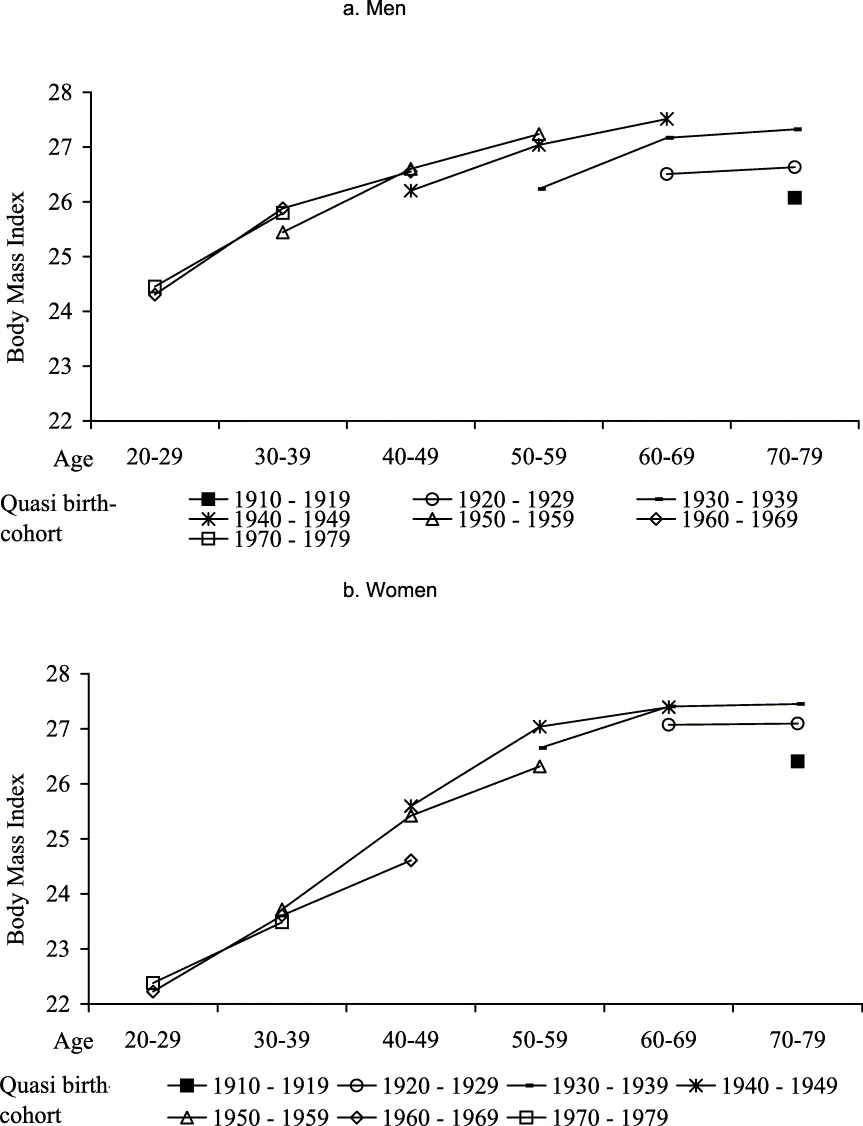
Figure 5 and Table 2 show the sex-specific trends in BMI from a cohort perspective. Nearly all surviving adult male Spanish cohorts increase their mean BMI as they moved from one 10-year age interval to the next until they were in their sixties. As the BMI takes height into account, differences between cohorts are much less, as was observed earlier when weight was analysed. The 30- to 39-year-olds of the cohorts born during the 1960s and 1970s have only a slightly higher, though statistically significant at the 95% level, average BMI than those who were born in the 1950s. Much larger cohort differences, however, can be observed for age groups 50–59 to 70–79 with regard to the birth cohorts 1910–19 to 1940–49. This confirms the more concerning situation affecting the older middle-aged and elderly population, as average levels of BMI observed in each 10-year age group increase by between 0.2 and 0.8 for each successive 10-year cohort.
BMI by sex, age group and quasi birth-cohort. Source: micro-data from the Spanish National Health Surveys 1987–2003. Own calculations.
95% confidence intervals of BMI by sex, age group and quasi birth-cohort

Source: Micro-data from the Spanish National Health Surveys 1987–2003. Own calculations.
Although the average level of BMI among women is lower for the youngest age groups and only converges to the male level around the age of 50, the general age-specific pattern is similar. The cohort pattern, however, is less clear-cut, as some cohorts reported a lower rather than higher average BMI than an earlier-born cohort, such as is the case with the 1950s versus the 1940s cohort when they were aged between 50 and 59 years. On the other hand, women born in the 1930s had a much higher average BMI when aged 70–79 years than those born in the 1920s, who in turn were significantly heavier than those born in 1910–19, i.e. a similar pattern as that observed for men.
Discussion
The main strength of this research was being able to analyse changes in the prevalence of overweight and obesity in Spain among both age and quasi birth-cohorts. This was done by aggregating the data from all seven cross-sectional National Health Surveys held since 1987. It provided a sample of about 100,000 subjects aged 20–79 years. The results in terms of trends over time should not substantially change if corrected by actual anthropometric measurements given their high correlation (usually over 0.90) with BMIs that are obtained from self-reported height and weight for both the overall adult population (Ezzati et al., Reference Ezzati, Martin, Skjold, Vander Hoorn and Murray2006; Gil & Mora, Reference Gil and Mora2009) and specifically the elderly (Gunnell et al., Reference Gunnell, Berney, Holland, Maynard, Blane, Frankel and Smith2000). Furthermore, although height overestimation cannot prevent the prevalence rates of BMI being underestimated, differences are not necessarily large. Moreover, biases tend to be set within acceptable margins when the data are not analysed at the individual level but in representative age-by-sex groups (Lawlor et al., Reference Lawlor, Bedrod, Taylor and Ebrahim2002). Furthermore, the results for obesity are almost identical to those from a compendium of epidemiological studies carried out in Spain in the period 1990–2000. For instance, according to Aranceta et al. (Reference Aranceta, Perez Rodrigo, Serra Majem, Ribas Barba, Quiles Izquierdo and Vioque2005), 14.5% of the population aged 25–60 was considered obese. If the 1995/7 results for this same population are used, a prevalence of 14.2% is obtained. Nevertheless, as expected, the categorical BMI status calculated from self-reported weight and height is likely to be lower than that from real measurements in clinical studies, particularly among the elderly (cf. Gutiérrez-Fisac et al., Reference Gutiérrez-Fisac, López, Banegas, Graciani and Rodríguez Artalejo2004).
According to the results obtained in this study the prevalence of obesity among Spanish adults has risen sharply over the last two decades, especially among men. Indeed, after controlling for height, statistically significant BMI gains were observed for almost all age–sex categories that were analysed. Results showed that the average adult puts on weight with age regardless of quasi birth-cohort until the age of 80. It means that becoming older does not seem to lead to a weight stabilization or decline. Conversely, young adults (supposed to be leading the main shifts in food consumption and lifestyle patterns) seem to be more successful in maintaining their weight as almost 70% of women until the age of 39 and 63% of men in their twenties recorded normal levels of BMI in 2006. Similarly, the 40- to 49-year-old women born in the 1960s actually had a 1 point lower BMI than the 1940–49 cohort, while the 50- to 59-year-olds born between 1950 and 1959 had a BMI level that was 0.7 lower than the 1930–39 cohort. Conversely, the 60- to 79-year-olds presented the most significant increases in overweight and obesity, particularly males born between 1930 and 1949. Finally, although the transition from normal to overweight was less severe among women than for men, among older women the prevalence of obesity increased more than overweight did.
Potential factors involved
Cross-sectionally, the bulk of the obtained results are consistent with the general trends in food consumption and lifestyle shifts in Spain during the last decades. By 1970, the average intake among adults older than 20 was estimated at about 2734 kcal (29% coming from fats) and three decades later (2001) this had risen to 3422 kcal (40% coming from fats) (INE, 1995; MHC, 2005a). Given that Spanish and European society has also become more sedentary (Varo, Reference Varo2002) and is ageing, as basal metabolism slows down with age (Rolland-Cachera, Reference Rolland-Cachera, Ulijaszek, Johnston and Preece1998; Shetty, Reference Shetty, Ulijaszek, Johnston and Preece1998) it is not surprising that overweight and obesity have recently become more widespread.
Analysing the data from a quasi birth-cohort perspective invites one to consider historical and cultural factors as additional components of this complex causality. Most elderly people in Spain lived their infancy or adolescence close to the threshold of food shortage, at least until the mid-1950s after which a proper food intake level was attained (Cussó, Reference Cussó2005). In the case of the oldest cohorts they also faced hunger and severe deprivation during the Spanish Civil War (1936–39) and post-war years under Franco's dictatorship. For some people, having experienced hardship may have made overfeeding, obesity and fatness a desirable condition, even associated with health, thereby creating a culture where fatness is appreciated beyond the reproductive goals as it used to be in traditional societies (Ulijaszek, 1998). To this regard, previous studies have shown the relevance of educational levels in managing nutritional status and controlling excess weight in developed societies (Halkjær & Sørensen, Reference Halkjær and Sørensen2004). Moreover, Gutierrez-Fisac et al. (1999) detected an increasing negative association between educational level and obesity among Spanish adults aged 20–64 between 1987 and 1993. From a cohort perspective a considerable portion of the above-mentioned age group in Spain attained a low level of education. In addition, there was also a lack of educational programmes or public policies regarding nutritional behaviour in Spain until 2005, when the first public health strategy to prevent overweight and obesity was implemented (MHC, 2005b). As a consequence, the rapid transition towards a society with a high standard of living led many people to adopt unhealthy eating habits. In this sense, a sort of retrospective echo with potential perverse cumulative effects may occur: adults who were neither overweight nor obese in their infancy and adolescence are becoming so now, and are bringing their descendants into the same situation. This is coherent with studies on weight status during childhood and adolescence that have showed how low-income and/or low-educated parents do not perceive their offspring being overweight but ‘well nourished’ (Kirchengast & Schober, 2006). In the case of Spain, many of those born before 1940 experienced stunted growth due to the higher prevalence of childhood illnesses, shortage of (nutritious) food and other adverse childhood and adolescent environmental conditions (e.g. the Spanish Civil War). However, once the country overcame the irregular food supply and general uncertainty, there were few factors that compensated weight gain caused by a positive energy intake. For instance, in relation to educational levels, few changes are detectable in the Spanish population with regard to the concept of ‘time preference’, which refers to the rate at which people are willing to trade current benefit for future benefit and is used in economics to explain savings and investment behaviour. When applied to health research, weight control requires one to forego current consumption in order to gain future potential health benefits, so the rate at which future benefits are discounted will bear directly on the individual's current food consumption decisions (Komlos et al., Reference Komlos, Smith and Bogin2004). In other words, in the case of Spain and in the absence of preventive mechanisms to control weight gain, the harder that early life conditions were, the lower the will to manage current lifestyle towards future health utility. This appears to be the case for cohorts born between 1920 and 1959, especially men, many of whom experienced both the Civil War (1936–39) and the difficult post-war period (1940s), which experienced significant increases in BMI levels over time. The fact that this argument does not seem to hold for those born prior to 1920 is likely to be due to a selection effect (excess mortality among obese persons) and because the elderly are less prone to partake in changing food consumption patterns and lifestyles.
Finally, the importance of genetic explanations for the observed sex differences and cohort trends in BMI levels should also be acknowledged. It is known that one reason why women accumulate more body fat than men is their reproductive history and sex differences in hormonal metabolism, as pregnancy and accompanying hormonal alterations are known to promote weight gain in women (Brown et al., Reference Brown, Kaye and Folsom1992; Harris et al., Reference Harris, Ellison and Holliday1997; Szklarska & Jankowska, Reference Szklarska and Jankowska2003). Given the sharp decline in the total cohort fertility rate in Spain (from 2.55 in the 1930 birth cohort to 1.76 in the 1960 cohort, respectively; Frejka & Sardon, Reference Frejka and Sardon2004) it is perhaps no coincidence that 40- to 49-year-old women born between 1950 and 1959 observed significantly lower average BMI levels than the 1930–39 birth cohort when they were of the same age. Also, the fact that women beyond childbearing age are no longer exposed to maternity and lose more muscular and bone mass than do males due to the menopause and subsequent ageing process (Leidy, Reference Leidy, Ulijaszek, Johnston and Preece1998) also fits in with the result that their relative weight at older ages was less than for men.
In answering the question whether Spain will become a ‘super size’ country, the overall dimension of the obesity epidemic among the adult population aged 20–79 is currently not too alarming as it affected only 15% of the population in 2006. However, this is not to say that there are no risk groups. Although levels are still highest among elderly women, since 1987 obesity rates almost doubled among 50- to 79-year-old men. Given the high prevalence and increasing trend in childhood and adolescent obesity in Spain (Rios et al., Reference Rios, Fluiters, Pérez, García-Mayor and García-Mayor1999; Moreno et al., Reference Moreno, Sarría, Fleta, Rodríguez, Pérez González and Bueno2001; Serra Majem et al., 2003), whether obesity will reach epidemic proportions in future will depend on the effectiveness of ongoing public health measures targeted at promoting healthier lifestyles.
Acknowledgments
This research was funded by the Spanish Ministry of Science and Education (research project ‘El futuro de la actividad, la salud y la dependencia. Una aproximacion generacional desde la Demografia’ ref. SEJ2006-002686/GEOG) and Spanish Institute of Older Persons and Social Services (IMSERSO) (research project ‘Cambios generacionales de la salud en España’ ref. 85/05).