Implications
Measuring lying behaviour in animals is an important component to overall animal welfare. Automated recording devices can eliminate the necessity of time-consuming live observations, and have been validated in cattle. This study is the first report of the validation of an automatic recording device (Onset Pendant G data logger) to accurately measure standing and lying behaviour in adult horses. Information on lying behaviour is a useful complement to a variety of measures when studying the behaviour and welfare of horses.
Introduction
Measuring lying behaviour in animals by direct or video observations can be a time-consuming process, especially in animals which spend a relatively small proportion of their day lying down. Adult domestic mares, for example, spend <1% of their time lying down (Sweeting et al., Reference Sweeting, Houpt and Houpt1985), while adult dairy cows may spend between 20% and 50% of a 24-h time period lying down (Ledgerwood et al., Reference Ledgerwood, Winckler and Tucker2010). In an effort to remove the necessity for a live observer, either to manually record behavioural data or retrospectively analyse video footage, automated recording devices have been used and validated, particularly for cattle (Ledgerwood et al., Reference Ledgerwood, Winckler and Tucker2010). The large proportion of time spent lying and their familiarity with human handling make dairy cattle an excellent model for testing the accuracy and effectiveness of a variety of different types of data loggers. Devices attached to the leg of the animal appear to be the most accurate in measuring animal movements and monitoring animal behaviour (Trénel et al., Reference Trénel, Jensen, Decker and Skjøth2009) compared with data loggers attached to the neck (Martiskainen et al., Reference Martiskainen, Järvinen, Skön, Tiirikainen, Kolehmainen and Mononen2009) and body (Champion et al., Reference Champion, Rutter and Penning1997). Multiple brands of data loggers, each with different dimensions and weights, have been validated for use in cattle (e.g. Actiwatch (Cambridge Neurotechnology, Cambridgeshire, UK), IceTags (IceRobotics, Edinburgh, UK), and Tinytag Plus (Gemini Data Loggers, Chichester, UK); see Ledgerwood et al., Reference Ledgerwood, Winckler and Tucker2010). Since their validation, these data loggers have been used in numerous studies relating to cow comfort behaviours to gain a better understanding of the lying patterns of cattle for welfare purposes (e.g. Watters et al., Reference Watters, Meijer, Barkema, Leslie, von Keyserlingk and Devries2013).
Recently, the Onset Pendant G, a small, lightweight data logger, was shown by Ledgerwood et al. (Reference Ledgerwood, Winckler and Tucker2010) to accurately record standing and lying behaviour in dairy cattle using a sampling window of 30 s or less. Data logger recordings scored 99% in predictability, sensitivity and specificity, making them comparable to continuous video sampling (Ledgerwood et al., Reference Ledgerwood, Winckler and Tucker2010). The use of a z-axis to provide three-dimensional measurements allowed researchers to determine laterality during lying, which had not previously been measured in cattle using data loggers (Ledgerwood et al., Reference Ledgerwood, Winckler and Tucker2010). The Onset Pendant G is the eighth model to be validated for use in cattle, and its small size may make it useful for the automatic recording of standing and lying behaviour in other domestic livestock species.
On average, adult horses are reported to spend a relatively small proportion of a 24-h time period lying down (Arnold, Reference Arnold1984; Sweeting et al., Reference Sweeting, Houpt and Houpt1985), though lying time may be greater in younger animals (Duncan, Reference Duncan1980). Lying behaviour is of particular interest in horses as changes in time budgets are understood to reflect a change to the animal’s environment or stress level (e.g. mares become more vigilant and lie down less postpartum; Houpt et al., Reference Houpt, O'Connel, Houpt and Carbonaro1986). In horses, an increase in lying time has been associated with higher social rank (Fader and Sambraus, Reference Fader and Sambraus2004), increased exercise (Caanitz et al., Reference Caanitz, O’Leary, Houpt, Petersson and Hintz1991) and larger stall size (Raabymagle and Ladewig, Reference Raabymagle and Ladewig2006). Stabling of horses on straw bedding as opposed to wood shavings led to a three-fold increase in time spent in lateral recumbency, perhaps indicative of rapid eye movement (REM) sleep (Pedersen et al., Reference Pedersen, Sondergaard and Ladewig2004).
The aim of this study is to validate the use of Onset Pendant G data loggers for measuring standing and lying behaviour in adult domestic horses. Though other data loggers such as global positioning systems have been used on horses (e.g. travelling distance, see Hampson et al., Reference Hampson, Morton, Mills, Trotter, Lamb and Pollitt2010), this is the first study to validate this model of triaxial accelerometer for equine use. A simple electronic device that can calculate the length and number of lying bouts in horses would remove the requirement for human observation either by live observation or from video footage.
Material and methods
Animals
This study was conducted continuously over a 5-day period in June 2013. Two Standardbred horses (one gelding, one mare; ages 9 and 16, respectively) were housed in box stalls (3.6×3.6 m) from 1700 to 0800 h, with turnout together in a grass paddock (0.1 ha) during the day. They were provided with ad libitum access to hay and water in both locations. All experimental procedures described here were approved by the Animal Care Committee at the University of Guelph in accordance with the Canadian Council on Animal Care (2009).
Equipment
Data loggers (Onset Pendant G, Model No. UA-004-64; Hoskin Scientific, ON, Canada) were positioned on the lateral side of one metatarsus of each horse using a colour-coded self-adhesive bandage to hold it in place (Supplementary Figure S1). In an effort to prevent skin damage or chaffing, the logger was layered against a diaper pad, and loggers were removed and re-secured to the alternate hind leg every 48 h. Loggers were set to record G-force values (where 1 G=9.8 m/s2) for the x-axis, y-axis and z-axis at 20 s intervals. Loggers were placed vertically due to the anatomy of the horse’s leg. In this orientation, the data logger registered G-force values for vertical movement towards the earth (x-axis), and along the horizon in a caudal direction (y-axis) and a midplane direction (z-axis). In brief, a movement towards the earth led to a negative G-force value whereas a movement away from the earth led to a positive G-force value.
Behaviour observations
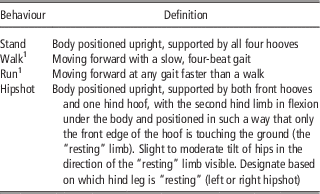
To ensure inter-observer reliability, the two observers involved in the study each independently visually observed the behaviour of the two horses for the first 9 h of the trial. As there was no significant difference between live behavioural observations recorded by the two observers (paired sample t-test; t=1, d.f.=72, P=0.3207), for the remaining 4 days, observers alternated recording behaviour live in 4-h shifts from 0800 to 2200 h. Instantaneous sampling every 10 min recorded standing, walking and running behaviours. The only other movement observed and recorded which changed the orientation of the leg wearing the data logger was standing hipshot (see Table 1 for operational definitions of behaviour patterns). Continuous observation was used over the full observation period to record lying bouts and rolling events, for which the time and duration were recorded. The lying bout was timed from when the flank of the animal met the ground and ended when all four legs returned perpendicular to the ground to support the animal’s weight (adapted from Ledgerwood et al., Reference Ledgerwood, Winckler and Tucker2010). A rolling event began when the animal’s carpi touched the ground, continued if the animal rolled onto its back and/or onto its other side, and ended once the animal rose and all four legs were perpendicular to the ground (adapted from Strand et al., Reference Strand, Tiefenbacher, Haskell, Hosmer, McDonnell and Freeman2002).
Definitions of specific equine behaviours measured during live observations

1 Adapted from Strand et al. (Reference Strand, Tiefenbacher, Haskell, Hosmer, McDonnell and Freeman2002).
From 2200 to 0800 h, when horses were stalled, behaviour was captured by a Panasonic HC-X900M High Definition Video Camera (Panasonic Canada Inc., Mississauga, ON, Canada) mounted above the stalls in such a way as to be able to view both horses simultaneously. Videos were analysed retrospectively using continuous sampling for lying events. Only one observer scored the night-time video recordings, noting the time and duration of each lying event.
Onset pendant G data output
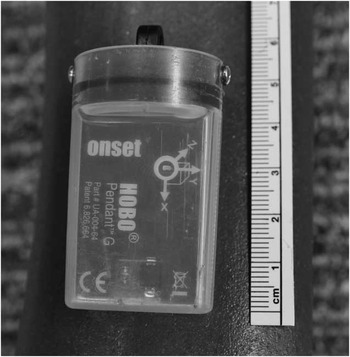
Data from the loggers was downloaded to a computer using the Onset HOBOware Software (Onset Computer Corporation, Hoskin Scientific) and exported to Microsoft Excel. The G-force values recorded by the loggers ranged from −3.2 to 3.15 g. In order to remove negative values, the constant of 3.2 was added to each value, making the new range of values from 0 to 6.35 g. To correct for the fact that the data loggers were attached to the animals such that the x and y-axes were reversed (x is generally the horizontal axis but in this case it was oriented as the vertical axis; Figure 1), the x-axis values were multiplied by a negative constant (−1).
Orientation of axes on the data logger as it was placed on the horse’s leg. The x-axis is oriented towards the ground.

Using visual observations for validation, cut-off values were determined for standing (x<2.875) and lying (x⩾2.875) bouts recorded by the loggers. These values were entered into a SAS macro (SAS 9.2, Cary, NC, USA), a program that calculated the number and duration of standing and lying bouts as well as total time spent standing and lying per 24-h period. Similar to the macro used by Ledgerwood et al. (Reference Ledgerwood, Winckler and Tucker2010) and for ease of calculation, the macro used in this study converted values recorded by the data logger into strings of 1’s (x<2.875=standing) and 0’s (x⩾2.875=lying) based on the cut-off point determined by the visual observations. After the data had been run through the macro, the number of bouts and duration of time spent lying and standing by hour and by day for each individual animal were calculated.
Statistical analysis
Following the work done by Ledgerwood et al. (Reference Ledgerwood, Winckler and Tucker2010), predictability (logger-recorded lying events that were also observed), sensitivity (lying events observed that were picked up by the logger), and specificity (standing events observed that were identified by the logger) were calculated as well as overall agreement between the logger and observational data using a paired sample t-test. Lying times were expressed on a 24-h basis as per Ledgerwood et al. (Reference Ledgerwood, Winckler and Tucker2010). A paired sample t-test (JMP version 10) compared lying bout duration calculated from observations and data loggers.
Results
Behaviour observations
Both horses spent all of the daytime observation hours standing or walking and only one instance of rolling was observed. Lying bouts occurred only when the horses were stalled during the night and after the observers had left. Latency to lie ranged from 4 to 445 min from the time the observers left the barn. Each horse had three to five lying bouts per night. On average, lying bouts lasted for 30.02±20.89 min (mean±s.d.), with a range of 4 to 66 min.
Data logger validation
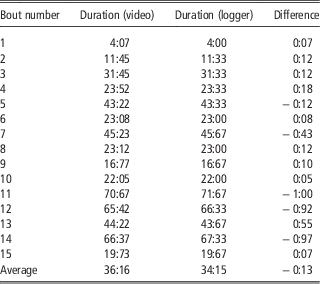
Predictability (corroboration of the data logger with the video for lying events), sensitivity (corroboration of the video with the data logger for lying events) and specificity (corroboration of the data logger and the video for standing events) were calculated for both animals cumulatively, and in all cases values were above or equal to 99.9%. A summary of logger and video recording agreement and disagreement by animal can be seen in Table 2. A summary of logger and video recording duration of lying bouts (determined using the video recordings) can be found in Table 3. In all cases the lying bout duration recorded by the data loggers was ±1 min and not significantly different from the visual observations (P>0.05).
Total number of lying and standing bouts recorded from two horses observed continuously over 5 days by video camera or Onset Pendant G data loggers affixed to the lateral side of one hind limb and set to record at 20 s intervals

Adapted from Ledgerwood et al. (Reference Ledgerwood, Winckler and Tucker2010).
1 Recordings (n) when both the Onset data loggers and the video observations detected a lying event.
2 Recordings (n) when only the video observations detected a lying event.
3 Recordings (n) when only the Onset data loggers detected a lying event.
4 Recordings (n) when neither the Onset data loggers nor video observations detected a lying event (i.e. standing).
Duration of lying bouts (min : s) according to video recordings and Onset Pendant G data loggers and the difference between their values

Data represents all lying bouts (n=15) observed from two horses over 5 days from video observations and data loggers affixed to the lateral side of one hind limb.
Discussion
The Onset Pendant G data loggers were able to accurately distinguish between standing and lying postures of adult horses and correctly determined the number and duration of lying bouts as validated by live observations and video recordings. G-force values were consistent with those found by Ledgerwood et al. (Reference Ledgerwood, Winckler and Tucker2010) using the same device on mature dairy cattle, and predictability, sensitivity and specificity were all >99%.
Interestingly, the loggers recorded both positive and negative G-force values while the animal was lying down. Videos allowed observers determine whether horses were lying or standing, however in certain positions the leg to which the accelerometer was attached was out of view, which prevented the observers from seeing movements that might have generated the negative acceleration values. When run through the SAS macro, however, the loggers still correctly recorded lying behaviour once the constant of 3.2 had been added to all data values. The SAS macro was able to correctly tabulate the exact number of lying bouts per individual animal. When the data was divided by hour and cross-referenced with the video recordings (lying did not occur during any period of live observation), the logger was able to record the length of the bout with a margin of error <1 min. This difference is likely due to the fact that lying bouts were deemed to have started on the video when the horse’s flank touched the ground, however the legs must bend first in order for the animal’s flank to be lowered, thus registering changes in the data logger. Furthermore, one animal was less visible than the other due to the camera angle, making it difficult to precisely determine exactly when the flank touched the ground, and thus perhaps introducing some measurement error. Given that the differences between the durations generated by the video recordings and the data loggers were not significantly different, this does not appear to be a concern. Owing to the angle of the video camera, the observers were not able to determine if the horses lay on their left or right side, thus laterality of lying behaviour was not able to be calculated. However, the data loggers still correctly predicting standing and lying behaviour regardless of the leg upon which the animal was wearing the data logger.
The data loggers did not categorize standing hipshot as a lying bout despite the change in angle of the logger when the accelerometer was on the leg that was held under its body. It is unclear what values the data logger would record when animals were rolling; the one instance of rolling that was observed occurred very quickly and fell between the 20 s recording intervals set on the data loggers. Given the nature of the rolling movements, and the potential for horses to roll immediately before getting up from a lying bout (Hansen et al., Reference Hansen, Estvan and Ladewig2007) it is worth noting that research is lacking on what effect this might have on the accuracy of data logger recordings to differentiate lying from rolling. It is also unclear whether the editing parameters of the macro would remove short rolling bouts. As rolling is a fairly common behaviour in horses that is not generally seen in cattle, this aspect requires further investigation in the future.
The average length of a lying bout was 30.02±20.89 min (mean±s.d.) which is similar to the maximum bout length (32.5 min) documented by Chaplin and Gretgrix (Reference Chaplin and Gretgrix2010) for horses that were partially stabled, however the standard deviation indicates that there was considerable variation among bouts. Bout duration ranged from as little as 4 min to as long as over an hour, and little is known about what factors affect lying bout duration. Stall size, bedding, and location remained identical throughout the present experiment and the horses were kept in a secluded location to avoid being disturbed. Nevertheless, activities outside of the stable itself such as night patrols or moving vehicles may have influenced lying duration.
Lying bouts occurred during the night, which is consistent with the existing literature (Chaplin and Gretgrix, Reference Chaplin and Gretgrix2010). These findings are further supported by earlier work done by Dallaire and Ruckebusch (Reference Dallaire and Ruckebusch1974) who reported that older horses were less likely to lie down during the day when compared with younger animals. It is unclear if the presence of the data loggers affected the animals’ willingness to lie down for longer periods of time or at all. However, given the consistency of our data with the aforementioned existing literature taken from live observations, it appears that wearing the loggers did not significantly affect lying behaviour.
Although the Onset Pendant G data loggers have the capability to record acceleration direction and velocity, this was not an aim in this study. Observations of walking and running were recorded to determine whether limb movement affected accuracy of the logger data recordings. If walking and running events were to be classified by the data loggers, a much higher sampling rate would be necessary (e.g. 33 readings/s; de Passillé et al., Reference de Passillé, Jensen, Chapinal and Rushen2010). The sampling rate of once every 20 s in this study would fail to identify locomotor behaviour patterns.
Characterization of lying behaviour in horses has significant implications for welfare assessments. Specifically, the requirement for horses to achieve lateral recumbency for REM sleep (Hale and Huggins, Reference Hale and Huggins1980) may have direct effects on biological functioning. Sleep deprivation may result from chronic pain or environmental insecurity such as social isolation, causing other impairments including severe weight loss or cataplexy (Bertone, Reference Bertone2006).
There may be limitations to the use of the data loggers which were not addressed in this study. While our two study horses were turned out together during the day, this social grouping of two may not represent normal activity in larger social groupings. For example, high activity levels, such as foals at play, may need to be accounted for if such movements significantly alter the axes. The length of time the data loggers can remain on the leg was not studied, although no abrasions or external damage occurred over a 48 h time span. Additionally, foals or curious animals may try to remove the loggers, especially if group-housed.
Overall, the Onset Pendant G data logger was able to accurately measure both standing and lying behaviour with respect to the number and duration of lying bouts when analysed and filtered using a SAS macro. The validation of automated data recording devices such as the Onset Pendant G data logger will assist in reducing the time expenditure of live observation and improve our understanding of equine time budgets with respect to standing and lying behaviour by allowing more complete 24 h/day recordings of these activities.
Acknowledgements
The authors would like to thank Gosia Zobel and Gordon Vander Voort for their time and coding assistance with the SAS macro.
Supplementary material
To view supplementary material for this article, please visit http://dx.doi.org/10.1017/S175173111400247X