INTRODUCTION AND AIMS
Climate change is affecting the world's coastlines; the sea level is rising and the intensity and frequency of climatically induced extremes are increasing (Mitchell et al., Reference Mitchell, Lowe, Wood and Vellinga2006; Seneviratne et al., Reference Seneviratne, Nicholls, Easterling, Goodess, Kanae, Kossin, Luo, Field, Barros, Stocker, Qin, Dokken, Ebi and Mastrandrea2012). Coastal communities are vulnerable, as coastal systems are highly dynamic. Globally, 2.8 billion people live at a distance of less than 100 km from the coastline; 200 million live within areas less than 5 m above the present sea level (Bollmann et al., Reference Bollmann, Bosch, Colijn, Ebinghaus, Froese, Güssow and Khalilian2010; Bange et al., Reference Bange, Bathmann, Behrens, Dahlke, Ebinghaus, Ekau and Emeis2017). Processes that control coastal systems are related to changes in climate circulation patterns and relative sea level (RSL). The latter reflects local to regional variations of the coastline, influenced by the volume of the oceans as well as vertical land movements (Rovere et al., Reference Rovere, Stocchi and Vacchi2016). Changes in climate and sea level affect not only humans but also ecosystems (McGowan et al., Reference McGowan, Cayan and Dorman1998). However, uncertainties remain regarding the response of marine and terrestrial ecosystems to RSL change (Lovejoy and Hannah, Reference Lovejoy and Hannah2005). Local studies in selected key areas are therefore necessary to understand the processes that control ecosystem changes. Here, we demonstrate that mangrove-fringed coastal lagoons serve as sedimentary archives that can be used to reveal an ecosystem's reaction to physical stress.
Globally, mangroves are declining rapidly (Polidoro et al., Reference Polidoro, Carpenter, Collins, Duke, Ellison, Ellison and Farnsworth2010). As much as 35% of mangrove area has been lost since the 1980s (Curnick et al., Reference Curnick, Pettorelli, Amir, Balke, Barbier, Crooks and Dahdouh-Guebas2019). Mangrove forests are threatened by urban development, agriculture, aquaculture, tourism, and other developments in coastal areas. In addition to physical habitat destruction, global warming-related process changes are another factor to be considered (Ellison and Stoddart, Reference Ellison and Stoddart1991).
Our study area is the coastline of northeastern Oman, along the shore of the northern Indian Ocean. Here, human activities have been documented in the archaeological record since the Neolithic period (Cleuziou and Tosi, Reference Cleuziou, Tosi, Cleuziou and Tosi2007). Neolithic archaeological evidence indicates that lagoons must have existed along the coastline, which is characterized by hyper-arid conditions today. Studies show that these lagoons were fringed by mangroves (Lézine et al., Reference Lézine, Saliège, Mathieu, Tagliatela, Mery, Charpentier and Cleuziou2002; Berger et al., Reference Berger, Charpentier, Crassard, Martin, Davtian and López-Sáez2013, Reference Berger, Guilbert-Berger, Marrast, Munoz, Guy, Barra and López-Sáez2020; Marrast et al., Reference Marrast, Béarez and Charpentier2020). Owing to their sensitivity to salinity and temperature, and also to their intertidal position, mangrove ecosystems are excellent archives of environmental changes in climate and sea level. Moreover, mangrove-fringed lagoons are exceptional natural records, as they serve as sediment traps with anoxic conditions. Therefore, we focus on the localization of the spatial distribution of mangrove forests along the shoreline of the Arabian Sea during the Holocene. Our study addresses three main topics, as outlined below.
Holocene sea-level variation
We shed light on the development of the RSL from the mid-Holocene until today. We center our attention on whether there is field evidence for a mid-Holocene sea-level highstand in the study area. By investigating mangrove ecosystems as a sea-level indicator as well as some nonmangrove coastal profiles we hope to make a valuable contribution to this research field.
Climatic change
We contribute to the ongoing discussion on climate change in the region during the mid-Holocene (Fleitmann et al., Reference Fleitmann, Burns, Mudelsee, Neff, Kramers, Mangini and Matter2003). Climate conditions are arid today, but there are various lines of evidence showing that the climate was substantially wetter during the early and mid-Holocene (Lézine et al., Reference Lézine, Saliège, Mathieu, Tagliatela, Mery, Charpentier and Cleuziou2002, Reference Lézine, Ivory, Braconnot and Marti2017; Enzel et al., Reference Enzel, Kushnir and Quade2015, Reference Enzel, Quade and Kushnir2017; Engel et al., Reference Engel, Matter, Parker, Parton, Petraglia, Preston and Preusser2017). We hypothesize that the effects of climate change are documented in mangrove sediments.
Relationship between humans and coastal ecosystems
In our study area, archaeological evidence indicates that hunter-and-gatherer populations exploited mangrove ecosystems during the Neolithic period and the Bronze Age (Lézine et al., Reference Lézine, Saliège, Mathieu, Tagliatela, Mery, Charpentier and Cleuziou2002, Berger et al., Reference Berger, Guilbert-Berger, Marrast, Munoz, Guy, Barra and López-Sáez2020). Thus, archaeological investigation is an appropriate way to localize paleo-mangrove settings. We aim to reconstruct the environmental conditions during the mid-Holocene.
STUDY AREA
Regional setting
Oman represents the most eastern part of the Arabian Peninsula. Today, most of this peninsula is dominated by desert environments, and the climate is semi-arid to arid, and even hyper-arid, locally (Glennie and Singhvi, Reference Glennie and Singhvi2002). In the northern part of Oman, moisture is received from winter rainfall supplied by the westerlies, a wind regime that transports rain from the Mediterranean. Humid air masses from the Mediterranean reach the Hajar Mountains from the northwest. This mountain chain is up to 3000 m high and acts as a topographical obstacle and initiates rainfall on the windward side. The southernmost part of the peninsula, namely parts of Yemen and the Dhofar region in southern Oman, receives considerable amounts of precipitation throughout the summer months. This rainfall is associated with the seasonal northward movement of the Intertropical Convergence Zone (ITCZ) and the accompanying Indian summer monsoon (ISM) (Hoffmann et al., Reference Hoffmann, Meschede, Zacke and Al Kindi2016). The ITCZ is the main component of the global atmospheric circulation pattern that significantly influenced the climatic variability in the area of the northwest Indian Ocean during the Quaternary (Fleitmann et al., Reference Fleitmann, Burns, Mudelsee, Neff, Kramers, Mangini and Matter2003). With some local exceptions, other parts of southern Arabia receive between 50 and 200 mm of annual precipitation. Precipitation events are often sporadic and can be intense, with a high erosional potential and regional flooding. Our main study area is located on the east coast of northern Oman. This part of the coast is dominated by arid conditions and aeolian processes. Former marine lagoons are silted up and form sabkhas (salt pans). Precipitation values are below 80 mm per year (Enzel et al., Reference Enzel, Kushnir and Quade2015). Flooding occurs due to episodic rainfall events when water fills the plain areas, leaving interlayered deposits of silt and evaporates. Today, Oman witnesses sporadic landfall of tropical cyclones, including Cyclones Gonu in 2007 and Phet in 2010 (Fritz et al., Reference Fritz, Blount, Albusaidi, Al-Harthy and Charabi2010).
The coastline is characterized by a mesotidal regime, with a maximum tide range of 3 m during spring tide (McLachlan et al., Reference McLachlan, Fisher, Al-Habsi, Al-Shukairi and Al-Habsi1998). The sandy beaches face low to moderate wave-energy levels, with wave heights of up to 1 m (McLachlan et al., Reference McLachlan, Fisher, Al-Habsi, Al-Shukairi and Al-Habsi1998). The water level and wave height can increase significantly during storms events like Gonu (Fritz et al., Reference Fritz, Blount, Albusaidi, Al-Harthy and Charabi2010).
The sea surface temperature (SST) of the Gulf of Oman is as low as 23°C in January. The coastline of northeastern Oman shows SSTs of 24–25°C (Luis and Kawamura, Reference Luis and Kawamura2002). The atmospheric forcing is the northeast monsoon/winter monsoon, which influences the SST in this location. Wind turbulences can additionally diminish SST up to 2°C (Luis and Kawamura, Reference Luis and Kawamura2002). The wind patterns switch twice a year, influenced by the ISM in summer and the Mediterranean westerlies in winter. The wind influences seawater currents, which leads to a current from the southwest to northeast in summer and from the northwest to southeast in winter. The latter activates an upwelling of cold, nutrient-rich water masses (Piontkovski et al., Reference Piontkovski, Al-Gheilani, Jupp, Al-Azri and Al-Hashmi2012).
Mangrove ecosystems in Oman
Mangrove habitats are scattered along the Omani shoreline, with approximately 30 small sites commonly not exceeding 2–3 km2 (Al-Hashmi et al., Reference Al-Hashmi, Al-Azri, Claereboudt, Piontkovski and Amin2013). These are locally called khawrs. Oman is located at the outer margin of the potential mangrove distribution area. Mangroves inhabit intertidal areas in tropical to subtropical regions, roughly between 35°N and 35°S. Global expansion is mainly restricted by the SST during winter months. Although SST tolerance shows an intraspecific variation, a general threshold for the more tolerant species can be correlated with the 24°C SST isotherm (Tomlinson, Reference Tomlinson2016). The SST is highly influenced by ocean currents, which leads to an irregular-shaped potential distribution pattern of mangroves (Ricklefs and Latham, Reference Ricklefs, Latham, Ricklefs and Schluter1993). A mean SST of about 23°C in the winter months along the northern coastline of the Arabian Peninsula reduces species variation to robust mangroves like Rhizophora mucronata and Avicennia marina (Ward et al., Reference Ward, Friess, Day and Mackenzie2016). Because of arid to semi-arid climate conditions with low precipitation of <120 mm/yr (Kwarteng et al., Reference Kwarteng, Dorvlo and Vijaya Kumar2009), mangrove forests in Oman are made up solely of the more salt-tolerant species of A. marina. Physical stresses like low temperature and high salinity inhibit plant growth, which results in a plant cover of scrubby bushes instead of large trees (Tomlinson, Reference Tomlinson2016). The spatial distribution of mangrove forests is limited to sheltered environments such as lagoons. Mangroves develop in brackish lagoons and are fed by fresh water, either through input of wadis or by underground fresh water. Examples of recent mangrove habitats depending on fluvial input are Qurum and Quriyat to the east of Muscat. The lagoons of Sur and Khawr al Jaramah belong to the groundwater-fed type (Lézine et al., Reference Lézine, Saliège, Mathieu, Tagliatela, Mery, Charpentier and Cleuziou2002). They are located in the most eastern part of the country, next to the eastern tip of the Arabian Peninsula, which is called Ras al Hadd. Lagoonal embayments near Bandar al Khayran are surrounded by steep hillsides from which fresh water flows directly to the mangrove-fringed lagoons. South of Ras al Hadd, along the eastern coast of northern Oman, up to the peninsula of Bar al Hikman, no suitable habitats for mangrove settlement exist.
During the Neolithic, mangrove forests were popular spots, as they guaranteed fresh water, food, and wood. Archaeological evidence in the form of debitage and food leftovers is preserved as shell middens (Biagi, Reference Biagi1994). Fossil species compositions of these shell middens reflect the source of food supply (Waselkov, Reference Waselkov and Schiffer1987). This can be open sea or lagoonal fauna. At some sites, the latter includes mangrove-associated species like the gastropod Terebralia palustris (Martin, Reference Martin2005; Berger et al., Reference Berger, Charpentier, Crassard, Martin, Davtian and López-Sáez2013, Reference Berger, Guilbert-Berger, Marrast, Munoz, Guy, Barra and López-Sáez2020).
Today, the population in Oman is encroaching on coastal areas; increasing human activities are therefore endangering the marine environment, including mangrove forests. In Oman, mangrove ecosystems are protected areas, which restrict anthropogenic destruction, the major threat that mangroves currently face. Chopping down mangrove forests was very common and still is in some places. People use mangrove wood for cooking, livestock fodder, and construction (Cleuziou and Tosi, Reference Cleuziou, Tosi, Cleuziou and Tosi2007). It is used because alternative wood supplies are insufficient (Fouda and Al-Muharrami, Reference Fouda and Al-Muharrami1995), as the terrestrial vegetation cover is sparse and dominated by grasses and small bushes.
Awareness campaigns by governmental institutions are showing some initial positive results. Efforts are being undertaken to protect, recover, and spread mangrove ecosystems (e.g., reforestation programs initiated by the Omani Ministry of Environment and Climate Affairs [MECA], in cooperation with the Japan International Cooperation Agency, whereby a new environmental information center has been established in Qurum (Japan International Cooperation Agency, 2014).
Holocene sea level along the coastline of Oman
Quaternary RSL variation along the coastline of Oman has not been thoroughly investigated. Differential movement of the lithosphere during the Quaternary along the Omani coastline is reported by Hoffmann et al. (Reference Hoffmann, Rupprechter and Mayrhofer2013). Falkenroth et al. (Reference Falkenroth, Adolphs, Cahnbley, Bagci, Kázmér, Mechernich and Hoffmann2020) identified a coastal notch in Sur, associated with the last interglacial sea-level highstand, at an elevation of 3.9 m, and confirm the tectonic stability of this area. The elevation of the paleo-shoreline testifies to differential crustal movement, as the coastal area north of Sur shows uplift for at least 800 ka (Mattern et al., Reference Mattern, Moraetis, Abbasi, Al Shukaili, Scharf, Claereboudt, Looker, Al Haddabi and Pracejus2018; Moraetis et al., Reference Moraetis, Mattern, Scharf, Frijia, Kusky, Yuan and El-Hussain2018; Hoffmann et al., Reference Hoffmann, Schneider, Mechernich, Falkenroth, Dunai and Preusser2020).
Holocene sea-level research along the coastline of Oman is very limited. To our knowledge, no study has focused on the reconstruction of Holocene sea-level variability; only individual reports on Holocene marine deposits exist. Mid-Holocene sea-level estimates range from decimetres (Lézine et al., Reference Lézine, Saliège, Mathieu, Tagliatela, Mery, Charpentier and Cleuziou2002) to several meters above present values (Berger et al., Reference Berger, Charpentier, Crassard, Martin, Davtian and López-Sáez2013). In one location, Preusser et al. (Reference Preusser, Radies, Driehorst and Matter2005) report Holocene ages for marine deposits well above the recent sea level. In contrast, Beuzen-Waller et al. (Reference Beuzen-Waller, Stéphan, Pavlopoulos, Desruelles, Marrast, Puaud, Giraud and Fouache2019) postulate a stable RSL for the Quriyat area, based on sea-level index points (SLIPS) at least from 7416 to 7183 cal yr BP.
Detailed sea-level studies have been undertaken in adjacent areas, mainly in the Persian Gulf. Lokier et al. (Reference Lokier, Bateman, Larkin, Rye and Stewart2015), for example, report a possible sea-level highstand in excess of 1 m by 5290–4570 cal yr BP and a regression to recent levels by 1440–1170 cal yr BP. Bernier et al. (Reference Bernier, Dalongeville, Dupuis and de Medwecki1995) investigated Holocene shoreline variations and found these to vary up to 2 m. Parker et al. (Reference Parker, Morley, Parton, Preston, Russ, Armitage and Drechsler2018) were the first to use SLIPS in this area to find the variations significant but slightly reduced.
Knowledge about sea level, especially about a potential sea-level highstand, is important for reconstructing the paleo-coastal morphology. The latter is essential for archaeological research, as communities were living along the coastline during the Late Neolithic.
Holocene climate variability
The climate of the Arabian Peninsula has shown considerable variation throughout the Quaternary, resulting in drastic arid–humid transitions and fundamental environmental deviations that had an important impact on past human societies (Parker and Rose, Reference Parker and Rose2008; Petraglia et al., Reference Petraglia, Groucutt, Guagnin, Breeze and Boivin2020). As in most arid zones, the preservation potential of sediments that serve as terrestrial archives is poor; hence, detailed information on past environmental conditions is scarce.
Aeolian sediments have often been interpreted as indicators of phases of aridity in Arabia (Preusser et al., Reference Preusser, Radies and Matter2002, Reference Preusser, Radies, Driehorst and Matter2005; Bray and Stokes, Reference Bray and Stokes2004; Radies et al., Reference Radies, Preusser, Matter and Mange2004; Stokes and Bray, Reference Stokes and Bray2005; Atkinson et al., Reference Atkinson, Thomas, Goudie and Bailey2011). Aeolian deposition also reflects other factors, such as sediment availability and preservation (e.g., Preusser, Reference Preusser2009; Bailey and Thomas, Reference Bailey and Thomas2014). Past humid periods in Arabia have been identified by analyzing speleothems (Burns et al., Reference Burns, Matter, Frank and Mangini1998, Reference Burns, Fleitmann, Matter, Neff and Mangini2001; Neff et al., Reference Neff, Burns, Mangini, Mudelsee, Fleitmann and Matter2001; Fleitmann et al., Reference Fleitmann, Burns, Mudelsee, Neff, Kramers, Mangini and Matter2003, Reference Fleitmann, Burns, Mangini, Mudelsee, Kramers, Villa and Neff2007) and relict lake deposits (Radies et al., Reference Radies, Hasiotis, Preusser, Neubert and Matter2005; Rosenberg et al., Reference Rosenberg, Preusser, Fleitmann, Schwalb, Penkman, Schmid, Al-Shanti, Kadi and Matter2011, Reference Rosenberg, Preusser, Blechschmidt, Fleitmann, Jagher and Matter2012). These pluvials concur with maxima in fluvial activity and alluvial fan generation (Maizels, Reference Maizels1990; Rodgers and Gunatilaka, Reference Rodgers and Gunatilaka2003; Blechschmidt et al., Reference Blechschmidt, Matter, Preusser and Rieke-Zapp2009; Parker, Reference Parker, Petraglia and Rose2009). The climate variability recorded in terrestrial archives of southern Arabia, notably the change in moisture supply, is apparently controlled by changes in the location of the ITCZ and the associated rainfall belt of the Indian Ocean monsoon (IOM). During times of increased summer season insolation, the mean latitudinal position of the summer ITCZ shifts northward, and the IOM is drawn into the continent. Precipitation in Oman is estimated to have been 100–160 mm higher than the present owing to the shift of the summer rain impact of about 100–150 km northward, creating paleo-wetlands in Arabia (Enzel et al., Reference Enzel, Kushnir and Quade2015). Periods with a stronger monsoon circulation and increased humidity in the interior of the Arabian Peninsula are recorded for the early to mid-Holocene as well as for Marine Isotope Stages (MIS) 5a, 5c, 5e, 7a, and 9 (Burns et al., Reference Burns, Fleitmann, Matter, Neff and Mangini2001; Fleitmann et al., Reference Fleitmann, Burns, Mudelsee, Neff, Kramers, Mangini and Matter2003; Rosenberg et al., Reference Rosenberg, Preusser, Fleitmann, Schwalb, Penkman, Schmid, Al-Shanti, Kadi and Matter2011).
Holocene climate variability in Arabia is comparable to changes observed in northern Africa (Tierney et al., Reference Tierney, Pausata and deMenocal2017; Lüning et al., Reference Lüning, Gałka, Danladi, Adagunodo and Vahrenholt2018). The poleward-shift of the ITCZ led to significantly more rainfall in the Sahara between ~11 and 6 ka ago (Tierney et al., Reference Tierney, Pausata and deMenocal2017). This period is known as the African Humid Period (AHP) in Africa (deMenocal and Tierney, Reference deMenocal and Tierney2012) and is contemporaneous with the Early Holocene Humid Period (EHHP) in Arabia (Lézine et al., Reference Lézine, Ivory, Braconnot and Marti2017). Both are caused by a northward shift of the ITCZ, which affected the atmospheric circulation patterns of the African monsoon (Bonfils et al., Reference Bonfils, de Noblet-Ducoudré, Braconnot and Joussaume2001) as well as the ISM. During this period, lakes existed in, for example, the central Sahara (Gasse, Reference Gasse2002) and the Rub al Khali (Awafi Lake), where falling lake levels indicate the onset of climatic aridity ~5900 cal yr BP (Preston et al., Reference Preston, Parker, Walkington, Leng and Hodson2012). Griffiths et al. (Reference Griffiths, Johnson, Pausata, White, Henderson, Wood, Yang, Ersek, Conrad and Sekhon2020) investigated the relationship between the end of the AHP and an aridification of mainland Southeast Asia. They refer to a correlation of orbital forcing factors, less vegetation, and increased dust-load that influenced atmospheric circulation patterns and cooled the Indian Ocean during this time. By examining stalagmites in North Oman (Hoti cave) and South Oman (Qunf cave), Fleitmann et al. (Reference Fleitmann, Burns, Mangini, Mudelsee, Kramers, Villa and Neff2007) reconstructed the shift to drier conditions to be gradual and a consequence of a long-term trend of decreasing monsoon precipitation. This is supported by Lézine et al. (Reference Lézine, Ivory, Braconnot and Marti2017).
A significant change in wind patterns along the coast of northeastern Oman around the 4.2 ka event was identified by Watanabe et al. (Reference Watanabe, Watanabe, Yamazaki and Pfeiffer2019). Sr/Ca ratios and stable oxygen isotopes of fossil Porites spp. corals collected from this location indicate abrupt colder and wetter winter seasons ~4.1 ka. This change was caused by a shift in the winter shamals, also known as the Mediterranean northwesterlies. On the one hand, this led to an increased precipitation in the Gulf of Oman; on the other hand, it led to aridification in Mesopotamia, which according to Watanabe et al. (Reference Watanabe, Watanabe, Yamazaki and Pfeiffer2019), finally caused the collapse of the Akkadian Empire. Kathayat et al. (Reference Kathayat, Cheng, Sinha, Yi, Li, Zhang, Li, Ning and Edwards2017) see a long-term decreasing trend in the ISM over the last 5700 years for northern India and relate it to the decline of the Harappan civilization in the Indus Valley.
Archaeological investigations in eastern Arabia reveal a socioeconomic change marking the transition from the Late Neolithic to the Early Bronze Age. Evidence from the fourth millennium BC indicates that people in Oman changed from a mainly nomadic to a mainly sedentary way of life beginning in 3400 BC, based on a higher proportion of remains relating to a sedentary lifestyle (Biagi and Nisbet, Reference Biagi and Nisbet1999; Cleuziou and Tosi, Reference Cleuziou, Tosi, Cleuziou and Tosi2007). This corresponds to a climate change during that time. The socioeconomic transition results in what is known as the Great Transformation and is documented by the appearance of various settlements and the evolution of new cultures in the Early Bronze Age, namely the Hafit (3200–2700 BC) and the Umm an-Nar (2700–2000 BC) (Cleuziou, Reference Cleuziou2009; Gregoricka, Reference Gregoricka2016).
In summary, it can be concluded that wetter conditions are indisputable for the mid-Holocene in Arabia as well as in northern Africa (Staubwasser and Weiss, Reference Staubwasser and Weiss2006). However, there is ongoing debate about the quantity of precipitation (Enzel et al., Reference Enzel, Quade and Kushnir2017 [and references therein]). Further, the transition to more arid conditions has not been fully resolved, with both the ISM and the North African summer monsoon discussed as moisture sources (Enzel et al., Reference Enzel, Kushnir and Quade2015 [and references therein]).
METHODS
Site investigation and sampling
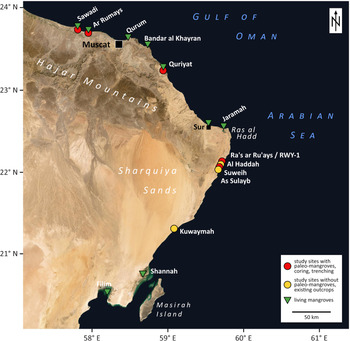
In total, five different localities along the northern and eastern coastline of Oman were investigated, with the focus on paleo-mangroves. The northernmost site is Sawadi, west of the Muscat city area. Following the coastline to the southeast, two sites are near Ar Rumays and Quriyat. South of Ras al Hadd, we found two outcrops near Al Haddah and As Sulayb that reveal coastal marine deposits. With a sedimentological profile analysis, we attained more information about sea-level variation in our study area. At the east coast, south of Ras al Hadd, we also found paleo-mangrove sites and cored sabkhas near Suwayh and Ras ar Ru'ays (Fig. 1). Coring was carried out at 48 sites in total, in order to get an overview of the paleo-lagoon spatial distribution. The core depth ranged from 28 to 320 cm, and coring was conducted using an Edelman clay auger. At those localities where paleo-lagoonal deposits were revealed by coring, trenches were dug to study the structure of the layers. In the trenches, the focus was on the documentation of structures like bioturbation and cross-lamination. The profile descriptions follow the standard protocol according to DIN EN ISO 14688-1 (Deutsches Institut für Normung e.V, 2011). The trenches allowed a proper sampling to be taken from uncontaminated material. Overall, 10 trenches were dug during this field campaign. The most promising sites are located on the eastern coastline. The coring and trenching in the sabkhas near Suwayh and Ras ar Ru'ays allowed us to construct cross sections. Trenches were 70 to 185 cm deep and were sampled every 2, 5, or 10 cm, depending on the stratigraphy. Where sediment was promising for pollen preservation, the profile was sampled every 2 cm for high-resolution analyses. Overall, 168 samples were taken.
(color online) Map of northeastern Oman showing the study area and the distribution of recent and paleo-mangroves (source: ESRI data, map created using ArcGIS 2015).

Sedimentological analyses
Granulometric analyses were performed by sieving and laser diffractometry, and 100 g of each sample was presorted by wet sieving using sieves measuring 2 and 0.063 mm. Material <0.063 mm in size was collected for further preparation and analysis with the laser particle sizer. The measurements were executed with a Horiba Partica LA 950V2 laser at the Department of Geography, University of Bonn. The Fraunhofer theory was used to convert the light-intensity patterns into grain size. Material >0.063 mm in size was stored in a compartment drier at 105°C for 24 h and then sieved dry. Sieves with mesh sizes of 2, 1, 0.5, 0.25, 0.125, and 0.063 mm were used. During the gradation test, a sieving loss ranging from 0 to 0.24% was determined. Sieving processes with a sieving loss of <1% (Deutsches Institut für Normung e.V, 1987a, 1987b) are valid, thereby rendering the gradation of this study valid.
Geochemical analyses
We carried out carbon, nitrogen, and sulfur (CNS) measurements (total carbon [TC], total nitrogen [TN], and total sulfur [TS]). A total of 40 ml of the sample was ground using the vibratory disc mill RS 200 from Retsch equipped with a tungsten carbide jar. The CNS measurements were carried out with the CNS analyzer vario EL cube by Elementar. A total of 20 mg of ground material from the sample was pyrolyzed at 1800°C, with O2 supply and He as a carrier gas. Detection limits are 0.23% for carbon, 0.04% for nitrogen, and 0.11% for sulfur. The total organic carbon (TOC) content was determined using the indirect muffle furnace method (Hirota and Szyper, Reference Hirota and Szyper1975; Keefe, Reference Keefe1994; Steinbeiss et al., Reference Steinbeiss, Beßler, Engels, Temperton, Buchmann, Roscher, Kreutziger, Baade, Habekost and Gleixner2008). To determine the total inorganic carbon (TIC) content, the organic substance must be removed (Bisutti et al., Reference Bisutti, Hilke and Raessler2004). This was done by double determination of a 2-g sample in a muffle furnace at 450°C for 16 h. The TIC content of the rest of the sample was determined by the CNS analyzer. The loss on ignition (450°C) was taken into account to relate the TIC content to the starting substance. The organic carbon concentration was then calculated as the difference between the TC and the TIC content. The TOC content helps to differentiate the source of carbon. The carbon/nitrogen ratio should help distinguish between the terrestrial and the aquatic organic matter (Perdue and Koprivnjak, Reference Perdue and Koprivnjak2007). The TS content is used as a proxy for marine influence (Berner and Raiswell, Reference Berner and Raiswell1984).
Topographic survey
In the sabkhas near Ras ar Ru'ays, at the sites of Quriyat and Ar Rumays, and in recent mangrove ecosystems near Sawadi, Sur, and Ras al Hadd, we conducted differential-GPS (D-GPS) measurements. This is a standard technique to precisely evaluate the height of a certain point above the present mean sea level to centimetre accuracy. Here, we aimed to detect Holocene sea-level variations. We used a Leica GS15 in real-time kinematic mode with two paired antennas. The elevations were measured relative to the base station, with an accuracy of 0.02 m or less. Coordinates were presented as meters in the Universal Transverse Mercator (UTM) projection, Zone 40Q, using the WGS 1984 reference ellipsoid. To calculate the absolute height, the sea level was first measured at different tidal datums and normed to mean sea level, with sea-level data derived from the web-based service of the Intergovernmental Oceanographic Commission.
By acquiring data about the modern vertical distribution of A. marina, we obtained more information about living mangroves in Oman to better interpret the findings from paleo-mangroves, particularly indicative meanings. We chose these three different places because the mangrove distribution is not limited by infrastructure or geomorphological obstacles, and the sites provide different ecological conditions. Mangroves in Sawadi grow in a creek system, Sur Lagoon is densely populated and attached to larger Wadi systems, and Ras al Hadd is a rather small, remote lagoon.
Shell midden investigations
We investigated shell middens next to the sabkhas to shed light on the human-environment interaction. We focused on the species assemblage, especially on the occurrence of the mangrove gastropod T. palustris. A suitable shell midden for taking samples was found next to the sabkha south of Ras ar Ru'ays. Here, gravel mining created a 2.3-m profile, and we sampled it every 50 cm to analyze the species assemblage. The species were identified according to Bosch et al. (Reference Bosch, Dance, Moolenbeek and Oliver1995). Three molluscs, specifically two oysters and one unspecified bivalve, were dated using radiocarbon.
14C AMS dating
We used the 14C method to date the sediment profiles and focused on the paleo-lagoon layers and the transition to the following sedimentological settings. We dated nine shells, one piece of wood, and five bulk sediment samples. The shell sampling material consisted of gastropods and bivalves. The latter were articulated shells to ensure a sample of in situ organisms. The piece of wood was found in a layer without carbonate macrofossils. To determine the reservoir effect, we needed carbonate and terrestrial material for comparison. We did not find molluscs or macrofossil terrestrial material in the same layer in any of the trenches. To better understand the reservoir effect, we decided to also date the bulk sediment samples after the carbonates were removed.
The bulk sediments samples were pretreated using a standard acid-base-acid solution to remove carbonates and humic acids (Lindauer et al., Reference Lindauer, Santos, Steinhof, Yousif, Phillips, Jasim, Uerpmann and Hinderer2017). Shells were pretreated with diluted acid (HCl) to remove the outer, most probably contaminated, part of the shell material. After pretreatment, sediments were combusted in an elemental analyzer (MicroCube, Elementar) and the CO2 collected and reduced to graphite. The shells were hydrolyzed with phosphoric acid, and the emerging CO2 was collected and graphitized. Samples were then measured in a MICADAS-type AMS (Kromer et al., Reference Kromer, Lindauer, Synal and Wacker2013), and fractionation was corrected. It should be noted that isotope data from 13C measured with an AMS system cannot be used for interpretation in the same way as stable isotope measurements. They only serve the fractionation correction of the measurement. Calibration and reservoir effect modeling were done with Oxcal 4.3 (Ramsey and Lee, Reference Ramsey and Lee2013) and the IntCal13 (Reimer et al., Reference Reimer, Bard, Bayliss, Beck, Blackwell, Ramsey and Buck2013) dataset. We used a phase model in Oxcal, with undetermined reservoir effect ΔR, as presented by Zazzo et al. (Reference Zazzo, Munoz, Saliège and Moreau2012). Data are presented as 2-sigma values, which represent a 95.4% confidence interval of finding the true age.
Radiocarbon dating of marine organisms requires determining a local reservoir effect. As these organisms mainly incorporate carbon provided in the marine environment, their ages often do not correspond to calendar ages. The difference is then called a reservoir age, known as R(t). These age differences can vary locally and over time, depending on marine conditions like upwelling and ocean circulation. Because of differences in habitat and diet, the reservoir age also has a strong species-specific component that must be considered. To determine the reservoir ages and the reservoir effect, it is necessary to take paired values of a marine sample and a contemporary terrestrial sample without any reservoir effect. If this is not possible, literature values might provide some help but usually are not suitable for determining precise chronologies. We determined preliminary reservoir effects for the shells that were dated in this study by using the sediments from the cores. Although of marine origin, no other terrestrial material was found. Hence, we decided to remove carbonaceous material and soluble humic acids. As we encountered a lot of root-penetration structures in the paleo-lagoonal sediment, we presume that the main content of the remaining organic material in the sediment should originate from mangroves. It was already shown in another study (Lindauer et al., Reference Lindauer, Marali, Schöne, Uerpmann, Kromer and Hinderer2016) that mangrove leaves measured with radiocarbon provide atmospheric ages without influence from the marine environment because of photosynthesis. Younger sediment ages can be a result of bioturbation or younger mangrove roots growing into older sediment (Woodroffe et al., Reference Woodroffe, Long, Punwong, Selby, Bryant and Marchant2015). Accordingly, bioturbation can transport older carbon into younger layers. Or, conversely, infaunal carbonate macrofossils bring younger carbon into older layers. For a precise chronology, the sediment must be checked for other indicators, such as pollen or foraminifera, which can also be dated.
RESULTS
Trenches south of Ras ar Ru'ays
The sediment sequences in the sabkhas near Suwayh and Ras ar Ru'ays on the east coast all show a similar pattern: dark gray fine-grained deposits at the base and overlying beige coarser sediments. The surface of the sabkhas is characterized by a salty crust and sometimes authigenic gypsum crystals. Often, mollusc shells cover the surface.
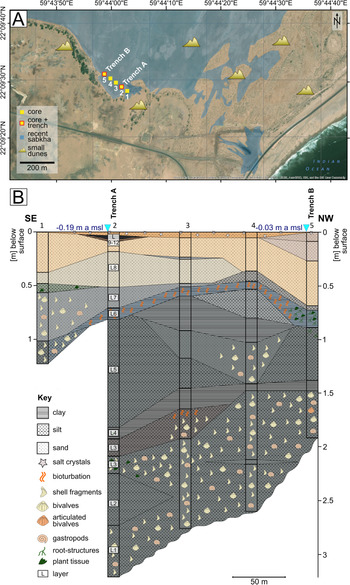
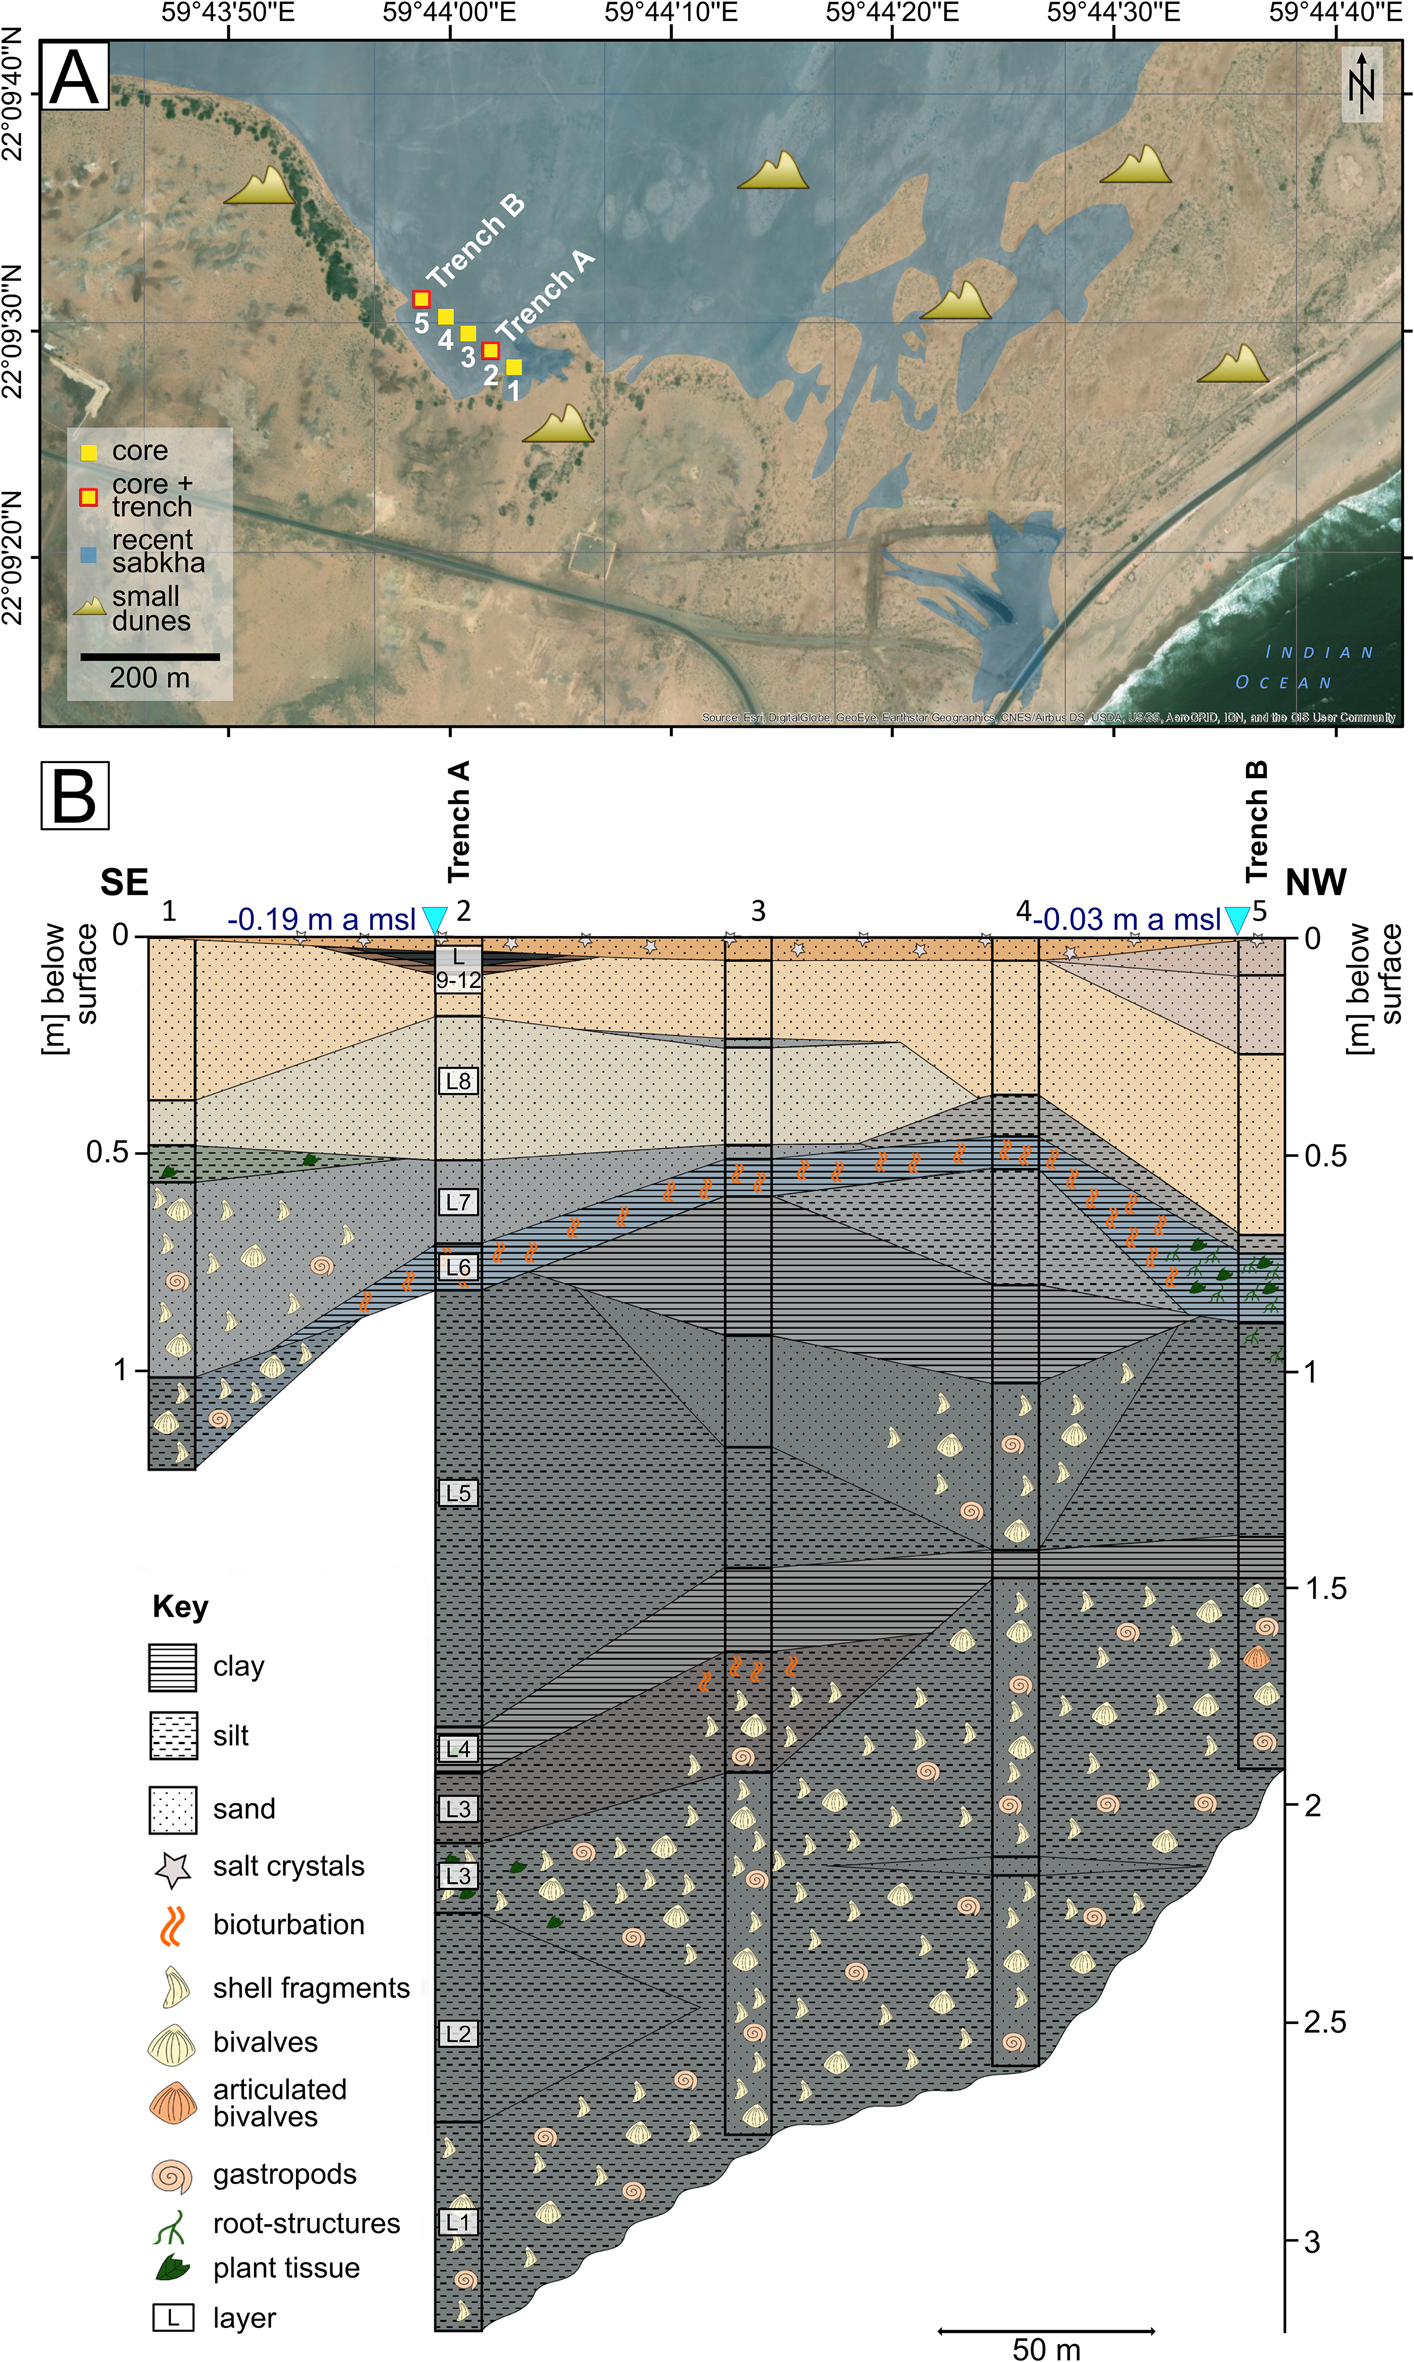
The sabkha south of Ras ar Ru'ays (40Q 781980, 2452862) is representative for this area and is thus described here in detail. It has a maximum length of 3 km from west to east and 1.5 km from north to south. Five core sites, each spaced 50 m apart, were located along a transect crossing the sabkha in the south (Fig. 2). The surface of the sabkha is featureless, except for some minor dunes of decimeter height. D-GPS measuring of the sabkha surface gave results ranging from -25 cm a msl at core site 4 to 15 cm a msl at core site 1 (Table 1). Two trenches, A and B, measuring 113 and 150 cm deep, respectively, were dug and sampled next to core sites 2 and 5. The stratigraphic sequences of profiles 1–5 in the transect are similar, hence the layers can be correlated. The basal layer is represented by at least 40 cm of dark gray, fine-grained, shell-rich sediments. The mollusc remains belong to both bivalves and gastropods, indicating marine to brackish environmental conditions. Some bivalves are thin-shelled, others are hard-shelled, and some are articulated and were found fossilized in situ in the sediment. This layer is overlain by a 7- to 18-cm-thick clay layer, followed by 41–104 cm of shell-less silt and 7–15 cm of clayey silt that shows bioturbation structures.
Transect in the southern part of a sabkha, south of Ras ar Ru'ays. (A) The yellow square and red-outlined yellow square show the coring and trenching locations, respectively; the blue area shows the extension of the recent sabkha, mostly limited by smaller dunes (map created using ArcGIS [2015] basemap imagery). (B) A correlated profile, including grain size and fossil content of the corings and trenches in the sabkha; the colors reflect those of the sediment, the blue triangles show the D-GPS measurements. (For interpretation of the references to color in this figure legend, the reader is referred to the web version of this article.)
D-GPS measurements of surface height a msl of selected investigated locations in the study area. Mean sea level is taken from the web-based service of the Intergovernmental Oceanographic Commission. Coordinates are presented as meters in the UTM projection, Zone 40Q, using the WGS 1984 reference ellipsoid.

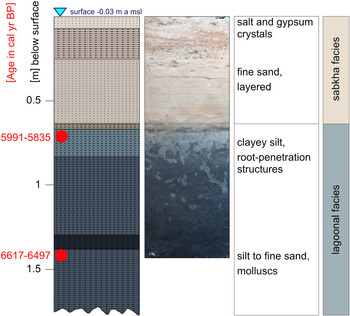
Trench B at core site 5 displays bioturbation in the form of tubes measuring 2–3 cm in diameter (Fig. 3). They are filled with light greenish gray silt. The tubes have an inner channel with organic plant remains and are therefore identified as root-penetration structures. In some structures, a light brown-gray clayey silt between the inner channel and the greenish gray silt is present, and the contact to the overlying sand is sharp. The layers above are 34–64 cm thick, and the color shifts from beige to light reddish brown toward the top. Salt and gypsum crystals are present in the upper 1–5 cm of all profiles.
(color online) The sediment profile of Trench B in the sabkha south of Ras ar Ru'ays. The 14C dates are based on bulk sediment dating.

Trench A at core site 2 was analyzed for granulometry and geochemistry. The profile consists of a 113-cm-deep trench that was extended by 187 cm with coring to reach 300 cm in length. A total of 12 layers (L1–L12) were documented. The basal layer (L1: 300–256 cm below surface) is a dark gray color and rich in millimeter- to centimeter-sized shell fragments. The sediment grain size fines upward, from fine sand at the base to silt at the top. The dark gray silt continues in L2 (256–213 cm), but no shell fragments are observed. Finer sediment on top (L3: 213–195 cm) includes a dark gray silty clay with millimeter-sized shell and plant fragments. This sequence is overlain by dark gray fine sandy silt (L4: 195–182 cm). L5 (182–170 cm) is a dark gray silty clay layer with millimeter-sized plant remains. L6 extends from 170 to 66 cm below the surface and was explored by coring (170–113 cm) and trenching (113–66 cm). It is a fining upward sequence, with silt to fine sand at the base to light clayey silt to fine sand at the top, all dark gray in color. The upper 10 cm are bioturbated with tubelike disturbances of 1–2 cm in diameter. These are filled with light gray fine sand from the overlaying sequence. L7 (66–48 cm) is composed of grayish fine sand containing silt and medium sand. A significant change in color to L8 (48–17 cm) is evident, and this layer consists of light beige light silty fine to medium sand with millimeter-sized orange layers in the upper 22 cm of the sequence. L9 (17–8 cm) is an orange-beige fine- to medium-sand layer. It is overlain by 2 cm of reddish brown clayey fine sand (L10: 8–6 cm) and 3 cm of reddish brown clay with black algal mats (L11: 6–3 cm). These mats display desiccation cracks filled with reddish brown clay. On top, a slightly reddish brown layer rich in salt crystals forms a salt crust (L12: 3–0 cm). Scattered gypsum crystals and mollusc shells are found on the surface. The dominating species is the gastropod Cerithidea cingulata, but other species and bivalves are also present.
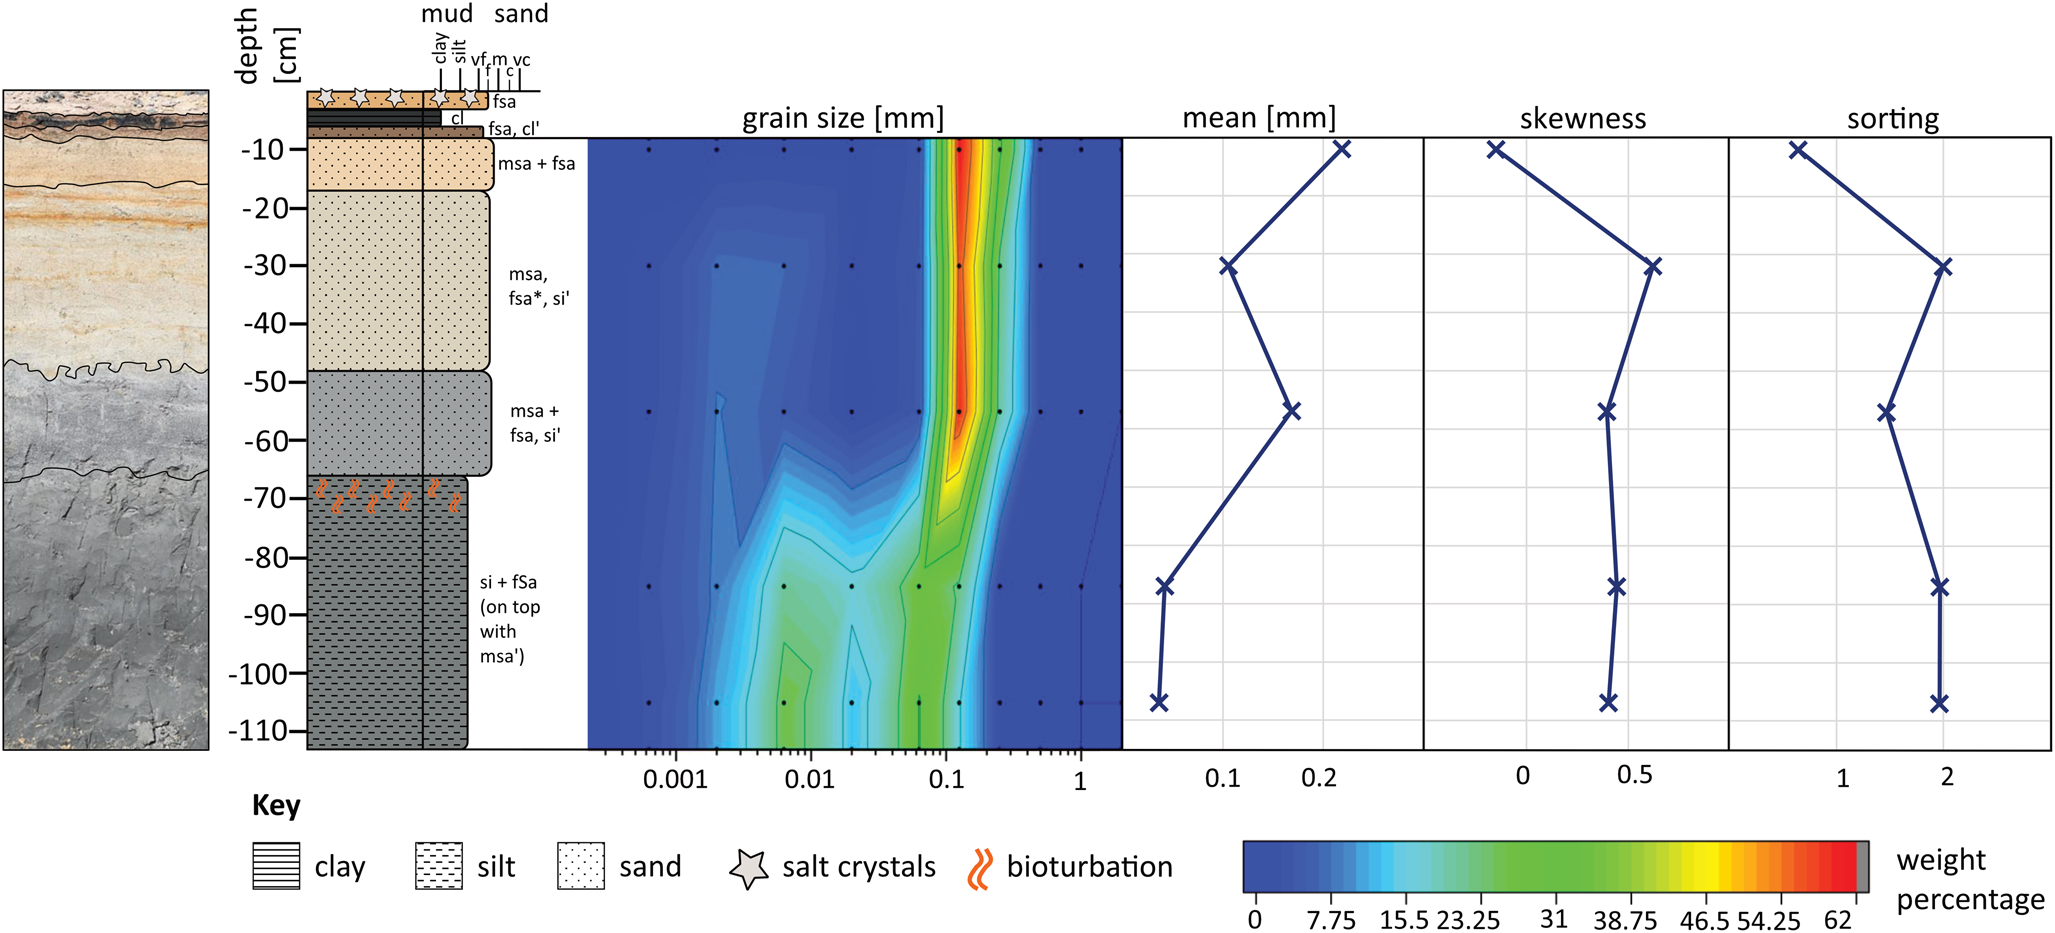
Trench A was sampled every 5 cm. Granulometric and geochemical analyses were conducted using five samples, at depths of 105 cm (L6), 85 cm (L6), 55 cm (L7), 30 cm (L8), and 10 cm (L9) below the surface. Figure 4 displays the results of the granulometric analyses. The two samples from L6 indicate a very positive skewness and a bimodal grain-size distribution, with two almost equal peaks at the medium silt and the fine sand fraction of 26% and 10% (>0.0063 mm) and 31% and 12% (>0.063 mm). This fine-grained layer is overlain by coarser sediments that deviate from the underlying layer mainly in terms of grain-size distribution. As Figure 4 shows, sediments of L7 and L8 are still very positively skewed. L7 is less well sorted and has a main peak of 48% in the fine sand (>0.125 mm), a smaller one of 16% in the medium sand (>0.25 mm), and a small one of 6% in the fine silt fraction (>0.002 mm). L8 also shows larger peaks of 49% in the fine sand (>0.125 mm) and 19% in the medium sand (>0.25 mm) fraction and displays an amount of 6% each in the fine and medium silt (>0.002–0.02 mm). L9 consists of >90% fine and medium sand (58% and 31%, respectively) and lacks a peak at finer particle sizes. These sediments are moderately sorted and show a negative skewness. Geochemical analyses (Supplementary Table 1) reveal a TC content of 2.5% and 2.3% for the silty layers and a 5.1%, 5.7%, and 5.5% for the upper fine sand layers. In these sequences, a significant difference is present in the amount of TOC and TIC content. The TOC content is the main component of the TC in the lower part (76% and 78%) and reaches 24% of TC content in L7 at a 55-cm depth, 19% in L8, and 7% in L9. Similar to the TC, TS content decreases from 0.62% at the base to 0.22% at the top (Fig. 5). All results for TN were below the detection limit of 0.04%. Creating carbon/nitrogen ratios was therefore impossible.
(color online) Sediment profile of Trench A in the sabkha south of Ras ar Ru'ays, and the granulometric results, including grain size distribution, mean, skewness, and sorting.
(color online) Geochemical results of Trench A in the sabkha south of Ras ar Ru'ays, including TOC and TIC cumulative content (left), TC (center), and TS content (right).

For our radiocarbon data we had to consider the reservoir effect. We calculated reservoir effects for the shell samples, which showed a significantly older age than the sediments. In some cases, the uncalibrated sediment ages were younger than the shells, which is not to be expected from marine organisms. Along the coast of Oman, we found strong upwelling conditions of old carbon to the surface; hence, the shells must be older than the terrestrial counterparts. We therefore used the reservoir effect determined for Marcia sp. (MAMS 37279, MAMS 37380) for the other bivalves as well as for the oyster samples. We are aware that the reservoir effect determined as ΔR = -185 ± 101 yr can differ from the true value, but it should account better for the local effects than literature values from other lagoons. We were also able to derive a reservoir effect as ΔR = 72 ± 90 yr for two gastropod samples. With respect to calibration, negative reservoir effects mean that the value must be subtracted from the general marine calibration curve that is shifted from the atmospheric curve by a mean value of 405 ± 20 yr. Positive values need to be added to the marine calibration curve data. This is automatically done by software such as Oxcal when assigning a reservoir effect value to the samples.
The 14C dating results of the sabkha sediments near Ras ar Ru'ays indicate the fine-grained basal layers as mid- to late Holocene depositions. The oldest sediments were found in the sabkha south of Ras ar Ru'ays and are dated to 6617–6497 cal yr BP (MAMS 37271) (Table 2). The dating material was bulk sediment at a depth of 140 cm below the surface. An articulated bivalve (Marcia sp.) collected at the same depth gave an uncalibrated age of 5710 ± 25 14C yr BP (MAMS 37281). The top of these silt layers is dated at a depth of 69 cm with bulk sediment to 5991–5835 cal yr BP (MAMS 37270). Unspecified bivalve shell fragments revealed uncalibrated ages of 5197 ± 24 (MAMS 37279) and 5180 ± 25 14C yr BP (MAMS 37280). The 14C dating of bulk sediment from a profile 1.5 km to the northeast (40Q 782922, 2453641) indicates the transition of gray fine-grained sediments to beige coarser-grained sediments at 5920–5815 cal yr BP (MAMS 37267). Dating of two gastropods (C. cingulata) shows uncalibrated ages of 5648 ± 25 (MAMS 37273) and 5663 ± 25 14C yr BP (MAMS 37274).
14C dating results showing uncalibrated and calibrated ages BP whenever applicable. It should be noted that isotope data from Delta13C measured with an AMS system cannot be used for interpretation in the same way as stable isotope measurements. They only serve the fractionation correction of the measurement. Coordinates are presented as meters in the UTM projection, Zone 40Q, using the WGS 1984 reference ellipsoid.

Shell midden south of Ras ar Ru'ays
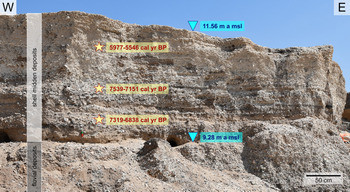
A shell midden is located adjacent to the investigated sabkha south of Ras ar Ru'ays (Fig. 6). It is situated on the sea side of the paleo-lagoon, on top of a ridge. The shell midden was partly removed by mining activities, exploiting an underlying fluvial gravel deposit. Graves were found in the deposits. The time of burial must have been during the shell accumulation, as indicated by the stratigraphy. Berger et al. (Reference Berger, Guilbert-Berger, Marrast, Munoz, Guy, Barra and López-Sáez2020) date the burials to the Middle Neolithic period. Mining activities were stopped, and the site was declared an archaeological heritage site by the Ministry of Heritage and Culture. According to Google Earth satellite images taken in 2003, the shell midden had an extension of 350 x 150 m.
The shell midden south of Ras ar Ru'ays showing the underlying fluvial deposits. The stars mark the 14C dates of molluscs; the blue triangle indicates the D-GPS measured height a msl. (For interpretation of the references to color in this figure legend, the reader is referred to the web version of this article.)
The profile accessible in the remaining deposits is 283 cm in height, and the top is at 11.56 m amsl (Table 1). The outcrop can be divided into two main layers consisting of a conglomerate overlain by shell midden deposits. The matrix-supported conglomerate (L1) is 55 cm thick and composed of semiconsolidated silt to coarse sand. Clasts are 1–10 cm in length and well rounded. The sorting is good, and layers show decimeter-scale cross stratification. Clast lithology differs, including granite and gabbro derived from the crystalline basement as well as various sedimentary rocks (e.g., Jurassic radiolarian chert). The top of L1 is at an elevation of 9.28 cm a msl. The layer is interpreted as a fluvial-deltaic deposit. Berger et al. (Reference Berger, Guilbert-Berger, Marrast, Munoz, Guy, Barra and López-Sáez2020) give an OSL age of >400 ka for this layer. Given the close relation to the recent shoreline, these deposits probably formed during a sea-level highstand (e.g., MIS 5e). The contact between the conglomerate (L1) and the shell midden deposits (L2) is erosive.
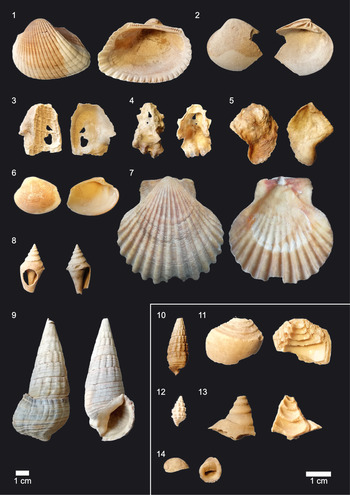
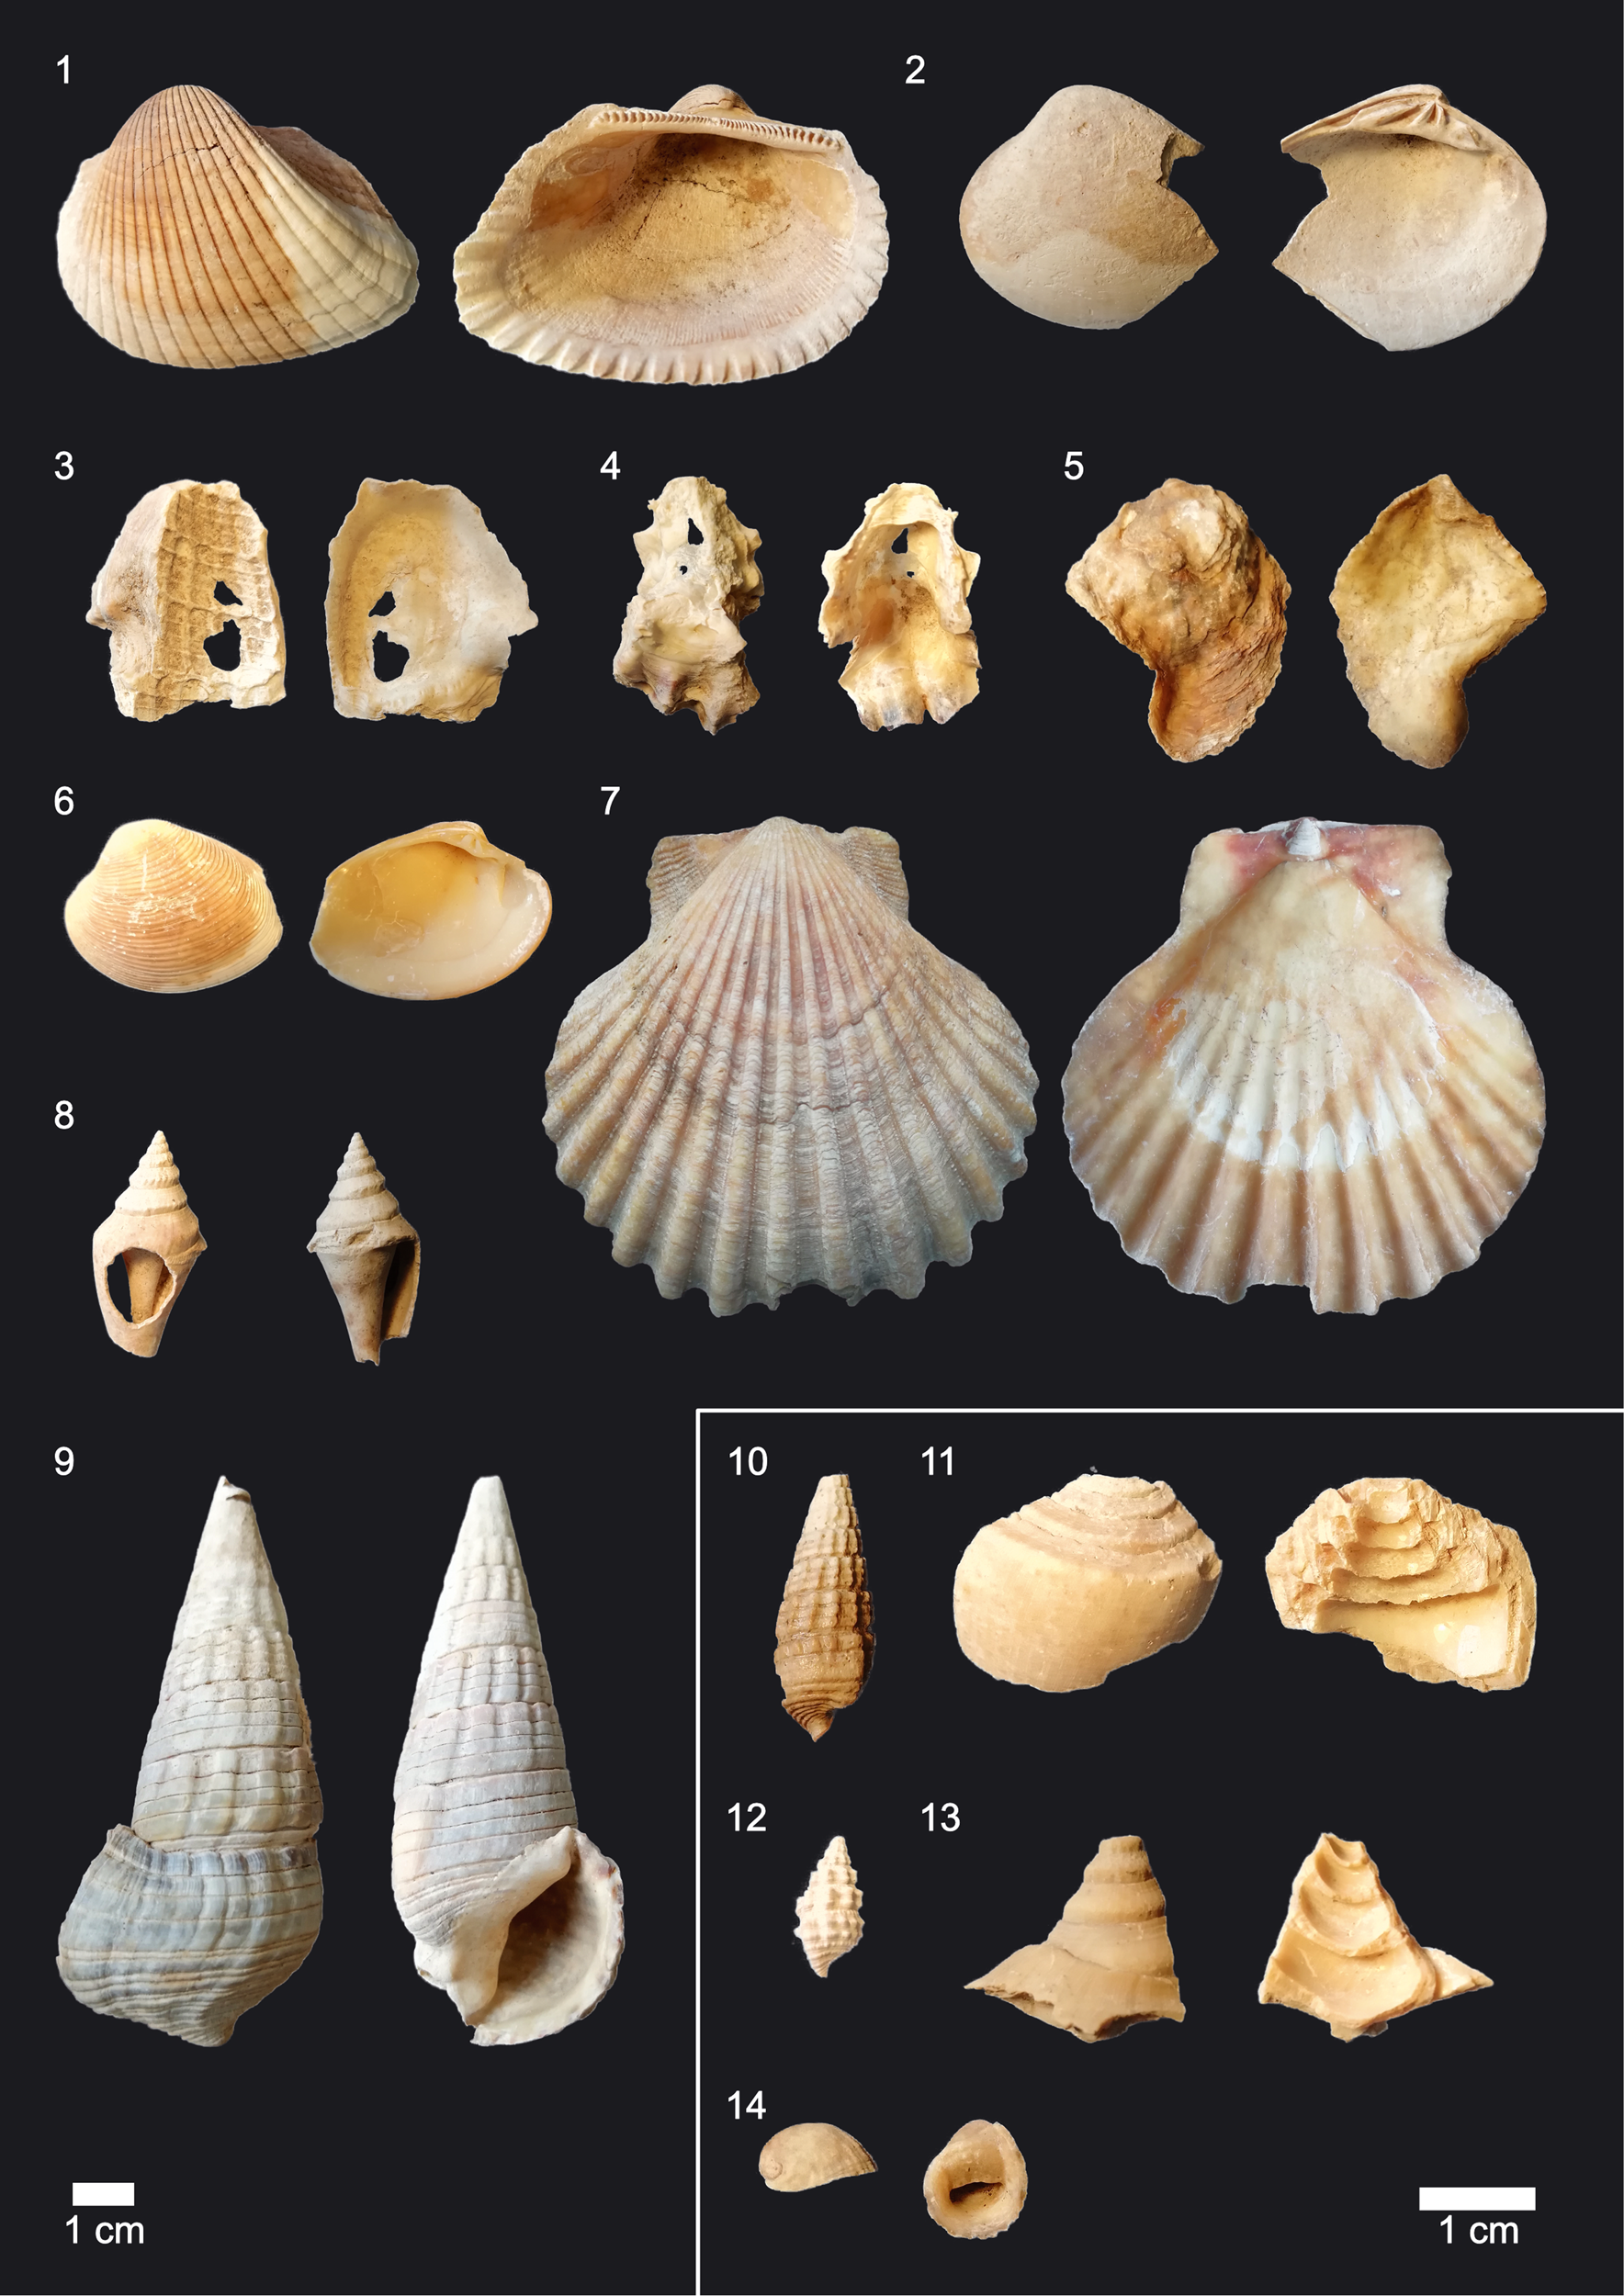
L2 consists of broken mollusc shells, in a silty to sandy matrix. The whole profile is layered and shows interbedded pure sand layers and ash lenses. The latter are often combined with millimeter-sized unspecified fish bones. Very few angular to subrounded pebbles and cobbles up to 15 cm in length are present in L2. The mollusc shells derive from edible organisms originating from marine and brackish environments. The species assemblage is similar throughout the profile. The most abundant species are oysters: Anadara sp., Marcia sp., and T. palustris among others, as depicted in Figure 7. Most important in the context of our research is the mangrove ecosystem indicating gastropod T. palustris. The 14C dating revealed ages of 7319–6838 cal yr BP (COL1172.1.1) at the bottom of L2, and 7539–7151 cal yr BP (COL1173.1.1) and 5977–5546 cal yr BP (COL1174.1.1) below the top (Fig. 6, Table 2). Berger et al. (Reference Berger, Guilbert-Berger, Marrast, Munoz, Guy, Barra and López-Sáez2020) detail a stratigraphic analysis of this shell midden.
(color online) Bivalve shells were the most abundant species found in the shell midden of Ras ar Ru'ays (exterior shown at left, interior shown at right): 1, Anadara cf. antiquata; 2, Marcia sp.; 3–5, oyster; 3, imprint of a Terebralia palustris shell in an oyster shell; 6, Marcia sp.; 7, Chlamys townsendi; 8, Strombus sp.; 9, Terebralia palustris; 10, Cerithidea cingulata; 11, broken Conus sp.; 12, Cerithidium sp.; 13, broken Strombus sp.; 14, Nerita sp.

Profiles near Al Haddah and As Sulayb
Along the east coast, marine deposits are present that clearly indicate a different RSL at some time. We include the results of these profile analyses because they play a part in contributing to the investigation of Oman's sea-level history.
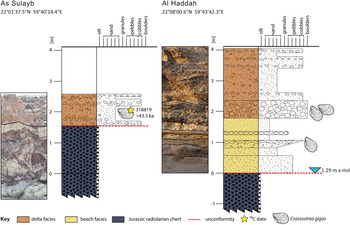
A 4-m-high coastal cliff of semiconsolidated marine sediments crops out close to the town of Al Haddah (Fig. 8). The sediments discordantly overlay radiolarian mudstones and pelagic limestones of the Triassic Sal Formation (Peters et al., Reference Peters, Al Battashy, Bläsi, Hauser, Immenhauser, Moser and Al Rajhi2001).The outcropping succession consists of conglomerates and sandstones that were deposited in a marine nearshore environment. A weak coarsening upward trend from the sand-dominated lower half of the profile to the matrix-supported conglomerates of the upper half is observed. The whole succession dips seaward at a 6° angle.
(color online) Coastal cliff outcrops near As Sulayb and Al Haddah showing a succession of radiolarian chert unconformly overlain by coastal deposits. The sediments indicate that the last sea-level highstand was before 43.5 ka.

Clasts in the lower part, below 1.5 m, consist almost exclusively of angular radiolarian cherts and shell debris. In the upper conglomeratic part, above 1.5 m, the number of well-rounded clasts increases significantly. This indicates a change from a locally supplied, wave-dominated depositional system to a deltaic coast fed by a feeder alluvial system that supplies sediment from the hinterland.
The beach facies of the lower part are variable, consisting of typical swash-dominated foreshore facies with steeply seaward dipping beds that vary in grain size between sand and granules but also of fine to medium sandstone that is intensely burrowed. The succession is interrupted by lenses of coarse-grained material, which indicates extreme wave events.
The deltaic facies, above 1.5 m in Al Haddah, shows large-scale cross-bedding as well as channel structures. Clast sizes range from pebbles to large cobbles. This facies also crops out in a 2-m-high coastal cliff near As Sulayb, where it discordantly overlays radiolarian chert as well. At both outcrops, the conglomerates contain a large number of oyster shells that were identified as Crassostrea gryphoides (Hoffmann et al., Reference Hoffmann, Meschede, Zacke and Al Kindi2016). The shells are up to 30 cm in length and are elongated and have a round diameter. They usually occur as single valves but are otherwise well preserved, which indicates transportation but not over a long distance. A shell from the profile in As Sulayb was dated using radiocarbon, but the result was inconclusive, as the age of the shell material exceeds the age limit of the 14C method, indicating an age of >43.5 ka (Beta-318819).
Ar Rumays site
The granulometric and geochemical investigations of a profile near Ar Rumays, on the northern coastline of Oman, reveal an alteration similar to the profiles near Ras ar Ru'ays and Suwayh. However, the transition is less sharp than that observed in the profiles on the east coast.
Near Ar Rumays, a 140-cm profile was investigated (40Q 603587, 2622641). It is located at a distance of 100 m from the open sea, in a small depression. This profile is divided into three main layers that vary in color and grain size: The mainly black layer (L1) at the base is made up of fine sand. On top, a reddish fining upward sequence (L2) from silty fine sand to clayey silt is present. This is overlain by brown fine sand, shifting to beige toward the top (L3). The 28-cm-thick basal layer that lies at a depth of 140–112 cm below the surface consists of black to reddish brown silt to fine sand and contains a few pieces of wooden remains and various mollusc shells. The latter includes the mangrove-adapted gastropod T. palustris and some remains of unspecified gastropods and fragile bivalves. This basal layer is poorly sorted and enriched in carbon. The TC content is 5.7%, of which 1.9% is TOC. L1 is covered by a reddish fining upward sequence from silty fine sand to clayey silt (L2: 112–71 cm). No fossils are preserved in the reddish section. The sediment of L2 is also poorly sorted. The TC content is verified in these sediments, with a value of 3.1%, of which 1.7% is TOC. L3, from a depth of 71 cm to the surface, is made up of fine sand; the sediment's color shifts from brown to light beige. At a depth of 18–24 cm, an interbedded layer is enriched in salt crystals. Sorting is moderate. The TC content varies from below detection limit (<0.23%) to 6.1%. The TOC is below 1% (0.6 and 0.9%, respectively).
A shell midden is located on Ar Rumays’ coastline, situated next to the profile (40Q 603562, 2622757), at a distance of 20 m. On top of this shell midden, we found remains of the mangrove indicator taxa T. palustris next to marine species like Anadara sp. and Ostrea sp. A small patch of recent A. marina shrubs was found (40Q 601127, 2622512) 2.5 km west of this site.
Rhizoliths at Sawadi
Besides the findings of T. palustris in Ar Rumays and the root structures in the sediment at Ras ar Ru'ays, other evidence of paleo-mangroves is noted in the form of root casts near Sawadi and organic root remains near Quriyat.
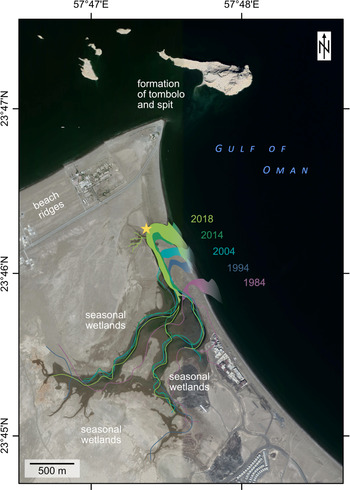
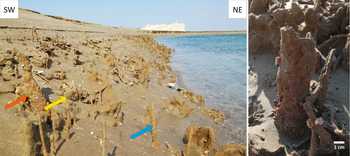
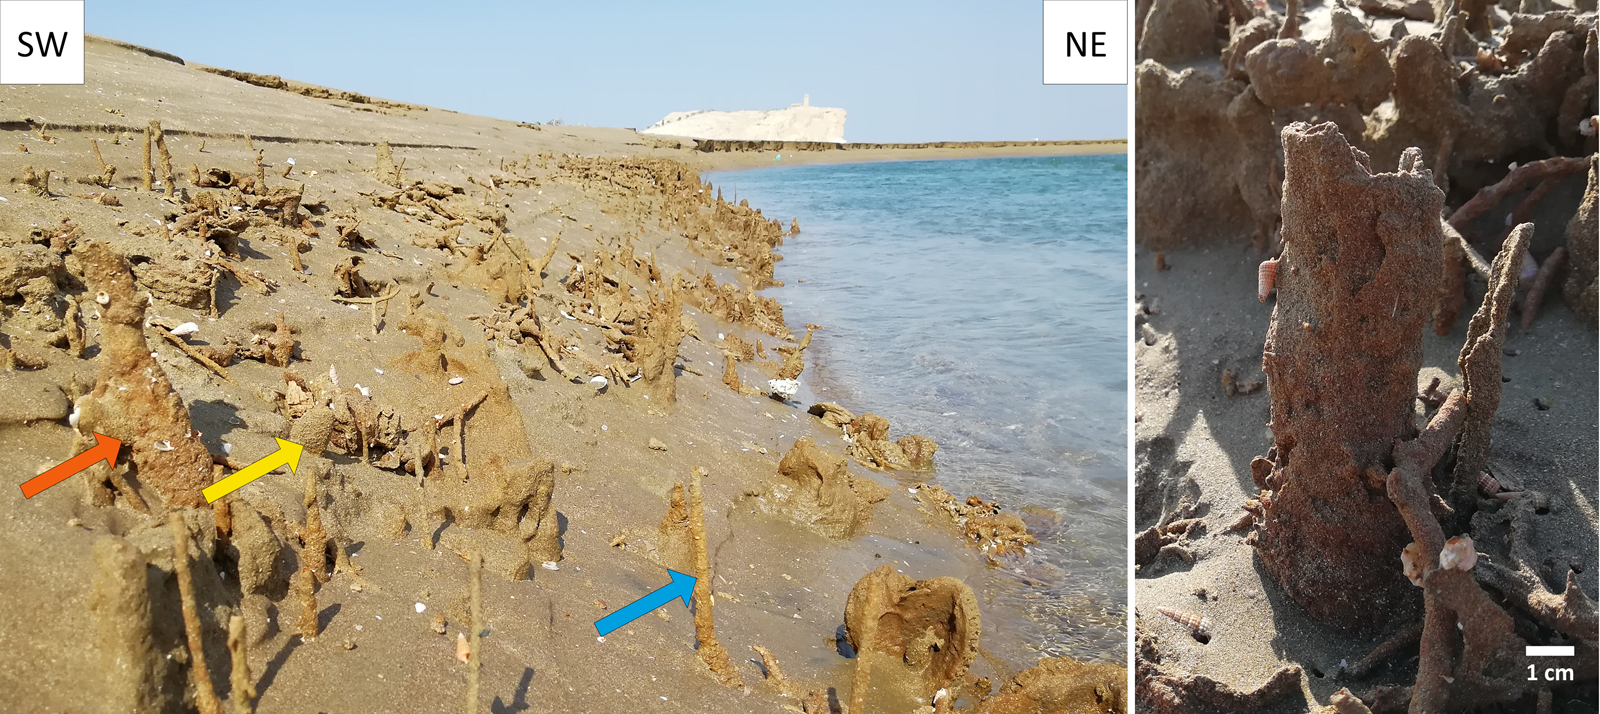
The morphological coastal setting in Sawadi, to the west of Muscat, is characterized by an estuary with a perennial creek that has a subsurface water supply. Satellite images show a 2-km2 subaerial drainage system forming a seasonal wetland. Owing to the short pathway of 3 km, the creek's sediment load is low. Coastal dynamics lead to a longshore sediment transport toward the northwest. A group of small islands less than 1 km off the coast interrupts the sediment flow, resulting in the formation of a spit and a tombolo. Beach ridges are observed along the western coast of the spit. The terminal course of the creek shifts and progrades in short periods due to the dynamic processes, as shown by satellite image analyses (Fig. 9). Evidence of paleo-mangroves were observed on the creek bank (40Q 580444, 2629084). The remnants are casts, of the outer structure of stems, roots, and pneumatophores that resemble those of A. marina. All structures are composed of cemented sediment and are void, with no organic macromaterial preserved. These kinds of structures are known as rhizoliths (Cramer and Hawkins, Reference Cramer and Hawkins2009). The casts in Sawadi consist of cemented silt to medium sand, and some have attached gastropod shells of C. cingulata. Some pneumatophore casts are irregularly shaped, with ball-like structures around them (Fig. 10). A 1-m-deep trench was dug through these structures toward the inland. At the level of the rhizoliths, orange to reddish brown redoximorphic features are present in a fine sand matrix, but no consolidated casts are preserved. We tracked this layer through coring, with orange sediment spots about 100 m inland. Two additional cores beside the lagoon bank (40Q 580435, 2628960 and 580552, 2628750) revealed orange discoloring at a depth of 50–60 cm below the surface.
(color online) The satellite image from March 2018 showing the area around Sawadi with its prograding creek. The different colors depict the progradation from 1984 to 2018. The star marks the location where rhizoliths were found in 2018 (map created using Google Earth).

Mangrove rhizolith structures in the intertidal zone at the creek shore near Sawadi. The arrows indicate the different parts of the plant: orange = trunk; blue = pneumatophore; yellow = ball structure attached to the pneumatophore. (For interpretation of the references to color in this figure legend, the reader is referred to the web version of this article.)
A recent mangrove forest of about 12 ha is located 500 m to the east (Japan International Cooperation Agency, 2014). Crabs were highly active, and living T. palustris were found. This forest originated from several afforestation campaigns that have taken place here since 2001, as part of the mangrove afforestation program of the MECA (Japan International Cooperation Agency, 2014).
Preserved root material at Quriyat
Salt-evaporation ponds of 2 x 3 m in size are located about 6 km southeast of Quriyat; these are dug in clayey sediments, which make the ponds watertight at the base and toward the sides. An unused, empty pond provided a profile of 75-cm depth (40Q 699707, 2569250). Overlying fluvial deposits of about 2 m were removed by the salt miners. The profile displays two layers. The basal layer consists of 40 cm of dark gray clay with redoximorphic features, which indicate root-penetration structures and organic plant material in the upper part. Millimeter-sized black plant fragments and compressed roots of 1–4 cm in diameter are preserved. This sequence is overlain by 35 cm of silty sediment that shifts in color from light grayish green to light brown and contains fragments of unspecified shells. Shell middens (Khor Milk I and II) located almost 1 km to the northeast include T. palustris shells.
Modern mangrove vertical distribution
The D-GPS investigation of living A. marina in recent lagoons in Sawadi, Sur Lagoon, and Ras al Hadd showed a vertical distribution of -0.31–1.1 m a msl. Sawadi shows a more seaward mangrove vegetation, which begins at -0.31 and ends at 0.4 m a msl; mangroves in Ras al Hadd grow at higher elevations, from about 0.3 to 1.1 m a msl (Table 3). In all sites, a clear zonation of mangroves was encountered in the intertidal area, which is a belt without—or with only sparse—vegetation and a succulent plant zone that includes Halopeplis perfoliata and Tetraena qatarensis.
The D-GPS measurements show the spatial distribution of recent Avicennia marina mangrove ecosystems in the intertidal zone along the northern coastline of Oman. The values are averages out of 3 to 16 measurements. In the creek of Sawadi, no distal single mangrove trees are present. In Sur Lagoon, only proximal extent was measurable owing to high tide. Coordinates are presented as meters in the UTM projection, Zone 40Q, using the WGS 1984 reference ellipsoid.

DISCUSSION
Rise and fall of mangrove ecosystems in Oman
The recent mangrove ecosystems along the coast of Oman are patchy and restricted to isolated, mostly lagoonal, sites. A. marina, which is known to be the most robust mangrove (Tomlinson, Reference Tomlinson2016), is the only living species. The spatial distribution of the recent mangroves apparently reflects the precipitation pattern and coastal geomorphology. The precipitation is comparatively high along the Batinah coastal plain owing to Mediterranean winter rains, but the coastline is straight. Thus, only mangroves in an estuarine setting are present near Sawadi, and isolated individual trees are present in similar settings to those near Ar Rumays. To the east, precipitation values are comparable, but there are more sheltered lagoons. Mountains are close to these lagoons, which lead to a direct freshwater input following rainfall. There are several mangrove-fringed lagoons (e.g., Qurum, Bandar Khayran, Sur, and Ras al Hadd). However, most of the larger current mangrove forests are the result of afforestation programs carried out by MECA. Toward the south, environmental conditions are not suitable for mangrove ecosystems today; precipitation values are low, and appropriate geomorphological settings like lagoons are missing.
The mid-Holocene mangrove distribution apparently was much larger. Paleo-mangrove ecosystems were identified in the subsurface of sabkhas along the east coast. These have already been described by Berger et al. (Reference Berger, Charpentier, Crassard, Martin, Davtian and López-Sáez2013) and Lézine et al. (Reference Lézine, Saliège, Mathieu, Tagliatela, Mery, Charpentier and Cleuziou2002), who also identify a second mangrove species, R. mucronata. Rhizophoraceae are known to be less tolerant toward saline soil and SST (Chen and Twilley, Reference Chen and Twilley1998).
Available archives of Holocene coastal records along the coastline of Oman cover the mid- and late Holocene. Early Holocene coastal deposits are not expected, as global sea level was well below present levels (Woodroffe and Horton, Reference Woodroffe and Horton2005). According to paleontological and palynological records, the oldest published 14C results related to mangrove ecosystems cluster ~7000 cal yr BP (Lézine et al., Reference Lézine, Saliège, Mathieu, Tagliatela, Mery, Charpentier and Cleuziou2002, Berger et al., Reference Berger, Guilbert-Berger, Marrast, Munoz, Guy, Barra and López-Sáez2020). Following the archaeological investigations by Charpentier et al. (Reference Charpentier, Angelluci, Méry and Saliège2000, Reference Charpentier, Marquis and Pellé2003), the existence of a lagoon near Suwayh is proven for 7500 cal yr BP, but a mangrove ecosystem did not develop before 7000 cal yr BP.
When, how fast, and why the mangrove ecosystems vanished is still under discussion (Berger et al., Reference Berger, Guilbert-Berger, Marrast, Munoz, Guy, Barra and López-Sáez2020). Our sediment profiles display a collapse in 6000 cal yr BP, as shown by an abrupt change that is detectable in all paleo-lagoons along the east coast. The lower layers represent paleo-lagoonal facies, as indicated by the bimodal grain-size distribution that reflects two different sediment sources. These are interpreted as a marine and a terrestrial input. Additionally, the TS content is rather high, which documents a strong marine influence. The TOC content visualizes a high bioproductivity in the paleo-lagoonal area. This is supported by the undetectability of nitrogen. The growth of mangrove trees is limited by nitrogen and phosphorus (Twilley et al., Reference Twilley, Rivera-Monroy, Rovai, Castañeda-Moya, Davis, Perillo, Wolanski, Cahoon and Hopkinson2019); as a consequence, mangrove soils are usually depleted in these (Reef et al., Reference Reef, Feller and Lovelock2010). Though performing a high net primary production, mangrove ecosystems are often oligotrophic. Values of nutrients like nitrogen and phosphorus can vary significantly between different geomorphological settings, types of mangroves, and in a single mangrove wetland. This is due to highly dynamic nitrification-denitrification processes. Reducing conditions inhibit nitrification and enhance denitrification (Twilley et al., Reference Twilley, Rivera-Monroy, Rovai, Castañeda-Moya, Davis, Perillo, Wolanski, Cahoon and Hopkinson2019). The overlying layers in the profile of Ras ar Ru'ays show a much lower TOC and TS content and a different granulometric pattern. The well-sorting of the sediment and its positive skewness at around 30 cm in depth reveals the sediment input to be aeolian (Das, Reference Das2015; Alharbi et al., Reference Alharbi, Williams, Phillips and Thomas2016). These upper layers display a sabkha environment, with sporadic floods after heavy rainfall in the mountain areas. There is no fluvial sediment input because there is no open Wadi system. Subsurface water flow and groundwater level rise after rainfall can cause an inundation of such sinks. The depression has no natural drainage, so the water enters and flattens the aeolian sediments. This is indicated by planar layered deposits and a lack of characteristic aeolian sedimentological structures like cross-bedding. The water is highly saline because of the lagoonal deposits underneath. It evaporates slowly, taking up to several weeks. During this process, salt and gypsum crystallize; this can be seen in the profile and on top of the sabkha surface. The shift from the lagoonal facies toward the sabkha facies is sharp in the investigated profiles. There is a lack of evidence for erosional surfaces; thus, we presume a continuation of the sedimentation and an ecosystem collapse on a decadal scale, as the facies shift is identical in all investigated paleo-lagoons.
Our interpretation is therefore a rapid change in environmental setting. Ecosystems show a sensitive threshold regarding the precipitation/evaporation balance. If a certain threshold is reached, it leads to an abrupt collapse of the whole system (Ratajczak et al., Reference Ratajczak, Carpenter, Ives, Kucharik, Ramiadantsoa, Stegner, Williams, Zhang and Turner2018). Lézine (Reference Lézine2009) emphasizes that in arid areas, thresholds rather than long-term shifts are more likely for vegetation communities. A pollen profile revealed a Rhizophora sp. population in the lagoon of Jaramah, in the northeast of Oman, which disappeared abruptly ~4500 cal yr BP. The limnic interdune lake ecosystems of the Wahiba (Radies et al., Reference Radies, Hasiotis, Preusser, Neubert and Matter2005) are good examples of a whole collapsing ecosystem in Oman. Sedimentological and paleontological analyses of these lake deposits indicate an abrupt change of the surrounding ecosystems due to aridification 9 ka ago. This collapse seems to be similar to what we see in the sedimentological record of the 6000-year-old paleo-lagoons we investigated on the east coast. Our interpretation is currently based on sedimentological evidence. Further research must focus on the dating of this facies shift.
Possible forcing factors
There are three main forcing factors that can lead to such environmental changes: sea-level variability, climate variation, and human impact. In the following section, we discuss each of these scenarios and their plausibility.
Relative sea-level fall and/or continental uplift
Mangrove vertical development is directly influenced by RSL variation, and effects depend on its rate (Saintilan et al., Reference Saintilan, Khan, Ashe, Kelleway, Rogers, Woodroffe and Horton2020). Most investigations focus on RSL rise due to recent climate change and inundation hazards. The rate of RSL rise is the limiting factor that decides whether the ecosystem keeps pace with the change or fails and declines (Lovelock et al., Reference Lovelock, Cahoon, Friess, Guntenspergen, Krauss, Reef and Rogers2015). Saintilan et al. (Reference Saintilan, Khan, Ashe, Kelleway, Rogers, Woodroffe and Horton2020) recently published an upper threshold of 6.1 mm RSL rise/yr, revealed by reviewing responses of mangrove ecosystems toward RSL rise after glacial ice melt between 10 and 7 cal ka BP. The threshold serves as a benchmark. Additionally, local environmental conditions have to be considered, such as geomorphological setting, tidal range, and sediment accumulation rate (Ellison and Stoddart, Reference Ellison and Stoddart1991; Saintilan et al., Reference Saintilan, Khan, Ashe, Kelleway, Rogers, Woodroffe and Horton2020). Mangrove ecosystems’ responses toward RSL rise and fall cannot be considered as analogous processes. Mangrove forests keep up with RSL rise mainly by vertical accretion of sediment, allochthonous as well as autochthonous (Krauss et al., Reference Krauss, McKee, Lovelock, Cahoon, Saintilan, Reef and Chen2014; Woodroffe et al., Reference Woodroffe, Rogers, McKee, Lovelock, Mendelssohn and Saintilan2016). As this natural accretion of organic and inorganic sediment positively influences the progradation landward, calculated mangrove survival rates during sea-level rise cannot be projected to those of sea-level fall (Ellison, Reference Ellison, Perillo, Wolanski, Cahoon and Hopkinson2019). Ellison and Farnsworth (Reference Ellison and Farnsworth1997) conducted a long-term laboratory experiment investigating physiological parameters of Rhizophoraceae seedlings until the reproduction phase during a simulated sea-level rise, stable sea level, and sea-level fall. Rise and fall were realized by a 16-cm higher or lower tide, respectively. The authors observed some differences. The best physiological values were represented by the stable sea-level group. Mangroves of the sea-level rise group were notably fast growing at the beginning. Those of the sea-level fall group showed a retarded growth and a compact canopy. This indicates that Rhizophoraceae are able to keep up with a sudden sea-level fall of 16 cm. The forming seedlings could then inhabit a more suitable zone. During continuous sea-level fall, these mangroves would still struggle or vanish. As far as we know, there is no threshold rate published specifically related to sea-level fall. Thus, with the data at our disposal, we are not able to accurately reconstruct a RSL fall rate in the paleo-lagoons we investigated.
In a situation where sea-level variation causes the decline of the mangrove ecosystem, a sea-level fall would provoke the silting up of the former intertidal lagoon with material brought in by fluvial or aeolian processes. According to Das (Reference Das2015) and Alharbi et al. (Reference Alharbi, Williams, Phillips and Thomas2016), sorting and skewness of the granulometric analyses of the paleo-lagoons reveal aeolian input. These sediments would have embedded intertidal-related facies above the present sea level, which is not the case in the investigated paleo-lagoons. Nevertheless, sea-level models predict a mid-Holocene highstand in mid-latitudes (Mitrovica and Milne, Reference Mitrovica and Milne2002) followed by a sea-level fall.
To our knowledge, only one study defines SLIPS along the coastline of Oman, following the guidelines of Hijma et al. (Reference Hijma, Engelhart, Törnqvist, Horton, Hu, Hill, Shennan, Long and Horton2015): Beuzen-Waller et al. (Reference Beuzen-Waller, Stéphan, Pavlopoulos, Desruelles, Marrast, Puaud, Giraud and Fouache2019), who investigated the Quriyat area. The mandatory data are a well-constrained age, the indicative meaning consisting of elevation a msl, a reference water level, and an indicative range as an error estimate. Individual local profiles are described that are in most cases only tentatively assigned to a potential mid-Holocene sea-level highstand. Preusser et al. (Reference Preusser, Radies, Driehorst and Matter2005) describe a profile near Kuwaymah (40Q 715569.98; 2355040.05), 115 km south of our sites, which they interpret as Holocene coastal sabkha deposits, IRSL dated to BC 1650 ± 400 but with an unclear relation to sea level. We reexamined the site and could not find sea level–related facies. The gastropod Melanoides tuberculata identified by Preusser et al. (Reference Preusser, Radies, Driehorst and Matter2005) is not tolerant of high salinities. Bolaji et al. (Reference Bolaji, Edokpayi, Samuel, Akinnigbagbe and Ajulo2011) suggest M. tuberculata does not tolerate a salinity level higher than 25‰. Salinity tolerance tests performed by Farani et al. (Reference Farani, Nogueira and Johnsson2015) support this, and reveal that 50% of adult gastropods survive 22.8‰ salinity, and juveniles are even less robust. All M. tuberculata in this tolerance test were motionless at 30‰. This species does survive in a sabkha environment. The deposits found near Kuwaymah likely originate from a freshwater lake near the coast, with limited marine influences like sea spray or flooding due to storm events. These deposits are not reliable sea-level indicators.
Berger et al. (Reference Berger, Charpentier, Crassard, Martin, Davtian and López-Sáez2013) assign to their models a mid-Holocene sea level up to 9 m above the recent mean sea level. Besides a global sea-level highstand of 2–3 m a msl and postsedimentary effects of 2–3 m, Berger et al. (Reference Berger, Charpentier, Crassard, Martin, Davtian and López-Sáez2013) take regional tectonic uplift into account. This is in contrast to Hoffmann et al. (Reference Hoffmann, Rupprechter and Mayrhofer2013), who show that the northern part of the east coast is tectonically stable, excluding any noneustatic sea-level change. The topic of neotectonic movements in northern Oman is currently being researched (Mattern et al., Reference Mattern, Scharf, Al-Sarmi, Pracejus, Al-Hinaai and Al-Mamari2018; Moraetis et al., Reference Moraetis, Mattern, Scharf, Frijia, Kusky, Yuan and El-Hussain2018, Reference Moraetis, Scharf, Mattern, Pavlopoulos and Forman2020; Ermertz et al., Reference Ermertz, Kázmér, Adolphs, Falkenroth and Hoffmann2019; Hoffmann et al., Reference Hoffmann, Schneider, Mechernich, Falkenroth, Dunai and Preusser2020).
In our study area, no evidence exists for vertical displacement since the mid-Holocene. According to our D-GPS measurements, the uppermost layer of the paleo-mangrove deposits in the sabkha south of Ras ar Ru'ays is located 71 cm below recent mean sea level. We refrain from a significant postdepositional lowering. This is not reasonable because root penetration and other bioturbation structures seem to be well preserved and undeformed. Additionally, the sediment predominantly consists of uncompactable siliciclastic material and not easily compactable organic mud or peat, which would have made it necessary to conduct a decompaction calculation (Schmedemann et al., Reference Schmedemann, Schafmeister and Hoffmann2008). Taking little postdepositional lowering into account, the paleo-mangrove layers found at a depth of 70 cm are within recent tidal range, where mangroves are still growing today. Based on our measurements, mangroves near Sawadi, Sur Lagoon, and Ras al Hadd grow between -30 and 100 cm a msl, depending on environmental conditions (Table 3). Our dataset does not allow us to quantify the sea-level development in detail, but our findings suggest that sea level never exceeded modern levels during the Holocene.
There is ongoing research on mangrove sediments for centimeter- to decimeter-scale RSL reconstructions (Sefton, Reference Sefton2020). This contributes to our attempt to calculate an indicative meaning that would help interpret our findings much better. However, Sefton (Reference Sefton2020) could not find a suitable approach that we could use in our investigations. The difficulty for Sefton (Reference Sefton2020) seemed to be finding indicative characteristics for vegetation and elevation zones in recent mangroves. We face the same problem: we cannot correlate the paleo-mangrove layers to a specific elevation within recent mangroves. There is a lack of information on granulometric patterns of mangrove sediments and root-system expansion of living A. marina in Oman. Thus, more data of recent mangroves in this region must be acquired for statistically valid and comparable analyses. Currently, the calculation of an indicative meaning is difficult with the material at hand (Lorscheid, T., personal communication, 2020), although it may be used as a starting point for further sea-level studies.
There is, however, evidence for Pleistocene sea-level highstands along the coastline under investigation. Three outcrops are important in this context: profiles in Ras ar Ru'ays, Al Haddah, and As Sulayb. All three profiles show gravel accumulations that are interpreted as alluvial fan deposits, with a transition into deltaic deposits where the fan reaches the coastline. The gravel deposits below the shell midden south of Ras ar Ru'ays represent the proximal part of the fan. These gravel deposits are found at an elevation of up to 9 m a msl. These sediments are interpreted as representing a fluvial environment, as they show no sign of wave reworking, bioerosion, or marine fossils. The boundary to the overlying shell midden is sharp and partly erosional, indicating a paleo-surface and a depositional hiatus. This is supported by an OSL date by Berger et al. (Reference Berger, Guilbert-Berger, Marrast, Munoz, Guy, Barra and López-Sáez2020), which indicates fluvial activity and deposition of the gravel during the mid-Pleistocene, while the shell midden is Holocene in age.
The profiles at Al Haddah and As Sulayb are both located on the recent coastline and show deltaic sediments deposited under marine influence, as beach and shoreface facies indicate a wave-dominated setting. At As Sulayb, the distal part of the alluvial system was dated using 14C (Beta-318819). The dating results indicate sediment deposition beyond the dating limit (e.g., >43.5 14C ka BP), precluding a Holocene formation of these sediments.
Evidence for last interglacial shorelines in the area is published by Falkenroth et al. (Reference Falkenroth, Adolphs, Cahnbley, Bagci, Kázmér, Mechernich and Hoffmann2020), where a coastal notch in Sur is described. This notch mapped at an elevation of 3.93 ± 0.12 m a msl correlates well with the deltaic sediments in Al Haddah that are found between 0 and 4 m a msl and those in As Sulayb that are mapped at approximately 1.8 m a msl. The initial formation of the alluvial fan predates the last interglacial, as evidenced by the age of the fluvial gravel in Ras ar Ru'ays. A higher RSL after this period is not indicated along the northern part of the east coast of Oman.
Forcing factor climate change
The climatically driven scenario would be caused by a decrease in precipitation owing to a shift of the ITCZ toward the south. This is followed by a transregional loss of vegetation or shift to a different vegetation community, as indicated by pollen analyses (Lézine, Reference Lézine2009). In arid areas, such a loss of vegetational cover leads to increasing deflation and aeolian sediment transport. The windblown sand is trapped in depressions such as lagoons, which soon become silted up. During wetter times a small river flow could have flushed the lagoon continuously and kept it open. We presume this river flow became too weak, and incoming sediment accumulated. Sporadic floods—both flash floods and marine inundations—blanket the sand in the former lagoon.
According to our dating, the paleo-mangroves on the east coast vanished ~6000 cal yr BP. This is in agreement with the results published by Berger et al. (Reference Berger, Guilbert-Berger, Marrast, Munoz, Guy, Barra and López-Sáez2020), who date some of the upper paleo-lagoonal layers of the same sabkha south of Ras ar Ru'ays 500 years younger. Lézine et al. (Reference Lézine, Ivory, Braconnot and Marti2017) outline two main aridification phases: after 4500–5000 cal yr BP and after 2700 cal yr BP. Dating and palynological analyses of a paleo-lagoon in Suwayh, 13 km south of Ras ar Ru'ays, show a decline of mangroves and replacement by a brackish to freshwater lagoon without mangroves ~5000 cal yr BP (Lézine et al., Reference Lézine, Saliège, Mathieu, Tagliatela, Mery, Charpentier and Cleuziou2002). Lézine et al. (Reference Lézine, Ivory, Braconnot and Marti2017) demonstrate that in some areas a continuous mangrove forest has existed from ~7000 cal yr BP until today. These areas are Jaramah (22°29′N, 59°43′E), west of Ras al Hadd, and Filim (20°61′N, 58°17′E), located in the southeast, in a bay next to the peninsula of Bar al Hikman. The mangrove species assemblage has changed over time. A. marina and R. mucronata were present first; the latter vanished in Jaramah ~4500 cal yr BP and in Filim ~2500 cal yr BP. Lézine et al. (Reference Lézine, Ivory, Braconnot and Marti2017) correlate the disappearance of the R. mucronata mangroves in Filim and Jaramah with the shift of the ITCZ. Beuzen-Waller et al. (Reference Beuzen-Waller, Stéphan, Pavlopoulos, Desruelles, Marrast, Puaud, Giraud and Fouache2019) show that mangroves in a lagoon near Quriyat, on the north coast, disappeared ~4000 cal yr BP. This fits with the 4.2 aridification event that mainly triggered the fall of the Akkadian Empire in Mesopotamia, as documented by Watanabe et al. (Reference Watanabe, Watanabe, Yamazaki and Pfeiffer2019), and the Harappan civilization in India (Giosan et al., Reference Giosan, Clift, Macklin, Fuller, Constantinescu, Durcan and Stevens2012).
We postulate an earlier onset of the ITCZ shift and change in precipitation patterns that led to a collapse of the mangrove ecosystems on the east coast of Oman 6 ka ago. Other studies support this. Lindauer et al. (Reference Lindauer, Santos, Steinhof, Yousif, Phillips, Jasim, Uerpmann and Hinderer2017) reveal a change in the reservoir effect between 7000 and 6500 cal yr BP and ~4000 cal yr BP. This indicates a shift in sea currents, which are mainly influenced by climate circulation patterns and may show an alteration of those. Studies from northwest India depict an alteration in monsoonal patterns beginning 7000–7500 cal yr BP (Singh et al., Reference Singh, Wasson and Agrawal1990). Singh et al. (Reference Singh, Wasson and Agrawal1990) investigated sediments of a mid-Holocene deep, permanent freshwater lake and revealed a significant lowering of the lake level ~6000 cal yr BP. In addition to the reduced precipitation, a cooling of the Indian Ocean due to vegetation-dust climate feedbacks from the Sahara (Griffiths et al., Reference Griffiths, Johnson, Pausata, White, Henderson, Wood, Yang, Ersek, Conrad and Sekhon2020) worsened the living conditions for the temperature-sensitive mangroves. Cooler SSTs can explain the final decline of Rhizophoraceae and the persistence of the more robust A. marina that inhabits Oman's coastline today.
The remaining mangroves in Jaramah and Filim are seen as relict areas, where Rhizophoraceae mangroves struggled with unfavorable conditions for a longer time compared to the mangroves on the east coast. Both Jaramah and Filim are very sheltered lagoons; Jaramah is protected from open sea currents by the tip of Ras al Hadd; Filim is protected by the peninsula to the east. Both sites are still suitable for mangroves and are inhabited with A. marina today. These places provided a kind of safe haven for mangroves in times of climate change 6 ka ago.
The east coast is more exposed, on the one hand to the open sea and is thus affected by currents. On the other hand, large sand dunes along the east coast were reactivated because of aridification and the resulting lack of vegetation. The sand of the dunes could easily provide material to silt up the lagoons in this location.
Human impact
According to the archaeological record, the human impact on mangrove ecosystems was not significant and thus negligible 6 ka ago. The ancient way of life during the EHHP is still under discussion. Cleuziou and Tosi (Reference Cleuziou, Tosi, Cleuziou and Tosi2007) postulate a sustainable nomadic lifestyle, with seasonal migration and campsites at the foot of the Hajar Mountains and along the coast. Berger et al. (Reference Berger, Guilbert-Berger, Marrast, Munoz, Guy, Barra and López-Sáez2020) hypothesize that the migration tracks were used only by hunters and pastoral communities and that there were settlements all year round along the coast. The shell midden near Ras ar Ru'ays was identified as a production site for drills and net sinkers as well as a place for the processing of beads (Berger et al., Reference Berger, Guilbert-Berger, Marrast, Munoz, Guy, Barra and López-Sáez2020). The workers lived there with their families and exploited the sea and the paleo-lagoon for the needs of daily living. Based on their way of life, these people are often called “Fish-eaters,” or Ichthyophagi, which relates to ancient texts as far back as Plinius (Charpentier, Reference Charpentier, Cleuziou, Tosi and Zarins2002). Their diet mainly consisted of small fish, like sardines and herring, as well as large fish such as tuna and shark. It also contained Chelonia mydas (the green turtle), its eggs, and crustaceans and molluscs (Biagi and Nisbet, Reference Biagi and Nisbet1999).
The mangrove ecosystems provided for all the needs of the people living there: fresh water, edible molluscs such as T. palustris and oysters, and wood for construction purposes and for making fires for cooking. According to charcoal analyses from fireplaces in the Ras ar Ru'ays shell midden strata (Berger et al., Reference Berger, Guilbert-Berger, Marrast, Munoz, Guy, Barra and López-Sáez2020), A. marina wood was one of the most popular firewoods during the Neolithic. Other archaeological sites show similar results. Several of them are located near Qurum. Ras al Hamra (RH)-5 was settled ~8450–7150 cal yr BP and is dated by various A. marina charcoals taken from fireplaces (Biagi, Reference Biagi1994). In RH-5 and RH-6 (7450–6150 cal yr BP) charcoal fragments from Ziziphus sp., Tamarix sp., and Acacia sp. were found. The most common firewood at both sites was A. marina (Biagi and Nisbet, Reference Biagi and Nisbet1999). It was popular because of its high calorific value (Maundu and Tengnäs, Reference Maundu and Tengnäs2005) and because it burns with neither smell nor smoke (Biagi and Nisbet, Reference Biagi and Nisbet1999). Determinations of calorific values of wood show variations between mangrove species (Sathe et al., Reference Sathe, Lavate and Bhosale2013). R. mucronata shows the highest calorific values, reaching 6739.95 cal/g. Subspecies of A. marina follow the Rhizophoraceae, with values around 5000 cal/g. These high calorific values made mangroves of Oman's coastline a popular charcoal wood for copper production. Evidence exists of long-distance transport of A. marina charcoal from 4850 to 4650 cal yr BP (Deckers et al., Reference Deckers, Döpper and Schmidt2019). Charcoal fragments of A. marina were found in a building near Al Khasbah, south of the Hajar Mountains, 100 km from the coast. This charcoal is ~1000 years younger than the silting up of the paleo-lagoon at Ras ar Ru'ays.
The A. marina charcoal near Al Khasbah correlates with the Great Transformation (Cleuziou and Tosi, Reference Cleuziou, Tosi, Cleuziou and Tosi2007) period. At the end of the fourth millennium, people left most of the coastal campsites and moved to the mountains, where they began sophisticated farming and metalworking (Cleuziou and Tosi, Reference Cleuziou, Tosi, Cleuziou and Tosi2007). The oldest evidence for large-scale copper production dates to 5250–5050 cal yr BP, which is the beginning of the Hafit period (Deckers et al., Reference Deckers, Döpper and Schmidt2019). Human interaction with the environment changed from this time. Approximately 4000 years ago, copper smelting was common, and humans exploited the environment to produce charcoal. There is evidence that high-calorific mangrove wood was used; in Al Khasbah, up to 60% of all charcoal fragments were identified as Rhizophora sp. and 10% as A. marina (Deckers et al., Reference Deckers, Döpper and Schmidt2019). We tentatively suggest that this is the reason why Rhizophora sp. disappeared in some places where A. marina survived (e.g., in Jaramah and Filim). Our interpretation is that variation in mangrove species assemblages is an anthropogenic signal, commencing with the beginning of charcoal production. We abstain from the hypothesis that the disappearance of the mangroves was due to charcoal production, as there is no evidence for this along the east coast as early as 6 ka ago. Nevertheless, human activities did assert additional pressure and inhibited natural recovery of the mangrove ecosystems, which suffered in times of aridification.
CONCLUSIONS
The Holocene sedimentological record along the coastline of Oman indicates that mangrove ecosystems were more widespread in the past. Based on radiocarbon dating, the oldest mangrove-related sediments are dated to ~7000 cal yr BP.
An abrupt facies change was observed in paleo-lagoons along the east coast, mainly in the Ja'alan area. This change was dated to 6000 cal yr BP, and it represents a rapid collapse of the mangrove ecosystem. We interpret this collapse to be the consequence of climate change rather than sea-level fall or anthropogenic influence. The climate change led to a decline in precipitation values. The most likely reason is a southward shift of the ITCZ. Further research efforts will concentrate on the quantification of paleo-precipitation.
ACKNOWLEDGMENTS
Decker would like to acknowledge with gratitude the Ph.D. scholarship received from the Studienstiftung des deutschen Volkes. Falkenroth acknowledges the valuable support by Graduiertenförderung, RWTH Aachen University. The project is funded by the German Research Foundation; without it, this work would not have been possible (DFG 2550/15-1, “Mangrove ecosystems as indicators for environmental change [Oman, Indian Ocean]”). This paper is a contribution to the IGCP project 639 “Sea-level change from minutes to millennia.” We would also like to thank the team of Golden Highlands in Oman for perfect field support, and Kim Hußmann for her help conducting the fieldwork. Eva Heumann-Lange is acknowledged for her organizational work that is essential to the smooth running of the project. We are grateful to Stefani Clark for the English review. The constructive feedback by Tara Beuzen-Waller and one anonymous reviewer helped improve the manuscript significantly.
SUPPLEMENTARY MATERIAL
The supplementary material for this article can be found at https://doi.org/10.1017/qua.2020.96