
I. INTRODUCTION
Nowadays high-manganese austenitic steels having a face centered cubic (FCC) single phase structure at an ambient temperature have attracted great attention as new structural materials because of their good balance of high strength and large elongation. The superior mechanical properties of high-manganese austenitic steels are due to deformation twinning behavior during plastic deformation, so they are also known as twinning induced plasticity (TWIP) steels. Reference Grassel and Frommeyer1–Reference Frommeyer, Brux and Neumann6
One of the biggest issues in high-strength steels is hydrogen embrittlement. It is well known that austenitic steels are less sensitive to hydrogen embrittlement compared with ferritic (or martensitic) steels. However, some researches Reference Koyama, Akiyama and Tsuzaki7–Reference Koyama, Akiyama, Tsuzaki and Raabe9 have reported that hydrogen embrittlement occurred in various TWIP steels, which could be a serious problem for practical usage of the TWIP steels. Koyama et al. Reference Koyama, Akiyama, Sawaguchi, Raabe and Tsuzaki10,Reference Koyama, Akiyama and Tsuzaki11 have done several works on hydrogen embrittlement behaviors of Mn–C high-manganese austenitic steels. For example, they investigated hydrogen embrittlement properties of an 18Mn–0.6C austenitic steel by a tensile test under hydrogen charging. Reference Koyama, Akiyama and Tsuzaki11 According to their results, the total elongation deteriorated significantly by hydrogen charging, and intergranular fracture occurred in the vicinity of the sample surface of the hydrogen-charged specimen. They also revealed that deformation twins assisted initiation and propagation of hydrogen-related intergranular cracks in an 18Mn–1.15C austenitic steel. Reference Koyama, Akiyama, Tsuzaki and Raabe9 The effect of Al in Mn–C austenitic steels on hydrogen embrittlement behaviors was also investigated. Reference Park, Jeong, Jung, Lee and Lee8,Reference Ryu, Kim, Lee, Suh and Bhadeshia12,Reference Chin, Kang, Shin, Hong, Lee, Kim, Kim and Kim13 The results showed that hydrogen embrittlement was suppressed by the addition of Al in the Mn–C austenitic steels.
Low yield strength is a shortcoming in practical application of TWIP steels with an FCC structure. Grain refinement is an effective way to increase the strength (especially yield strength) of polycrystalline metallic materials. However, susceptibility to hydrogen embrittlement generally increases with increasing the strength of steels. Reference Shibata, Takahashi and Tsuji14 To understand the hydrogen embrittlement in fine-grained steels, the effect of grain size on the hydrogen embrittlement behavior has been studied in several austenitic steels recently. Reference Park, Lee, Jeon and Lee15–Reference Chen, Zhao and Rong18 They revealed that grain refinement enhanced the resistance to hydrogen embrittlement. However, the minimum grain sizes of high-Mn TWIP steels used in the previous studies mentioned above were still 6.4 Reference Park, Lee, Jeon and Lee15 and 4 μm, Reference Zan, Ding, Guo, Tang and Bleck16 which were relatively fine grains but still in the coarse-grained range. On the other hand, we have recently studied the hydrogen embrittlement behaviors of 31Mn–3Al–3Si TWIP steel with fully recrystallized ultrafine-grained microstructures having various grain sizes ranging from 0.58 to 19 μm. Reference Saha, Ueji and Tsuji19,Reference Bai, Momotani, Chen, Shibata and Tsuji20 It was shown in Ref. Reference Saha, Ueji and Tsuji19 that ultra grain refinement down to sub-micrometer grain size greatly increased the strength (especially the yield strength) of the TWIP steel. Hydrogen embrittlement was suppressed by the grain refinement, although the yield and tensile strengths did not change and only the tensile elongation slightly decreased by hydrogen charging, Reference Bai, Momotani, Chen, Shibata and Tsuji20 which was possibly because the 31Mn–3Al–Si TWIP steel was very ductile and had relatively low strength.
A 22Mn–0.6C steel is a high-strength type TWIP steel having 800 MPa class tensile strength in coarse-grained microstructures. Recently, we have succeeded in producing a fully recrystallized ultrafine-grained 22Mn–0.6C TWIP steel having the mean grain size of 0.58 μm and found that the fully recrystallized ultrafine-grained 22Mn–0.6C steel exhibited a much higher strength at room temperature than that of the coarse-grained counterpart Reference Tian, Bai, Chen, Shibata, Terada and Tsuji21 and also than the several austenitic steels including the 31Mn–3Al–3Si TWIP steel we previously reported. Reference Saha, Ueji and Tsuji19 Therefore, the effect of the grain size on hydrogen embrittlement behaviors of the high strength 22Mn–0.6C TWIP steel was investigated in the present study from the viewpoints of the microstructure and hydrogen-related crack propagation.
II. EXPERIMENTS
The material used in the present study is 22Mn–0.6C TWIP steel [Mn: 22.0, C: 0.56, P: <0.004, S: 0.007, Al: <0.01, Cr: <0.01, Fe: bal. (mass%)]. It has been reported that this TWIP steel has a very low stacking fault energy SFE of about 23 mJ/m2. Reference Dumay, Chateau, Allain, Migot and Bouaziz22 The thermo-mechanical process for ultra grain refinement of the steel found by Tian et al. Reference Tian, Bai, Chen, Shibata, Terada and Tsuji21 was conducted. As the 22Mn–0.6C TWIP steel has higher strength and less deformability than that of the 31Mn–3Al–3Si TWIP steel, in which fully recrystallized submicrometer grain structures were obtained through one-step cold rolling (with a reduction of 92%) and annealing process, Reference Tian, Bai, Chen, Shibata, Terada and Tsuji21 heavy cold rolling could not be realized without fracture of the plates and sheets of 22Mn–0.6C TWIP steel, so intermediate annealing processes at 600 °C for 0.6 ks were inserted between 33.3 and 40% cold rolling, for recovering the deformability and gradually reducing the grain size of the material. After 3 cycles of the cold rolling (reduction in each cold rolling process: 33.3, 37.5, and 40%) and annealing processes, final cold rolling with a relatively high reduction in thickness (66.7%) was carried out, followed by annealing at 550 °C for 0.3 ks to achieve a fully recrystallized ultrafine-grained structure. Thickness of the as-received hot-forged plate was reduced from 12 to 1 mm by the four steps of multipass cold rolling (a total reduction of 92%). A two-high rolling mill with a roll diameter of 250 mm was used for cold rolling under a lubricated condition at room temperature.
Microstructures of the specimens were characterized by a field-emission scanning electron microscope (FE-SEM) equipped with a back scattered electron (BSE) detector and with an electron backscattering diffraction (EBSD) system. The samples for the SEM-BSE and SEM-EBSD observations were mechanically polished with emery papers and then electro-polished in a solution of 90 vol% ethanol + 10 vol% perchloric acid at room temperature with a voltage of 30 V for 30 s. All microstructural observations were carried out on the longitudinal sections perpendicular to the transverse direction (TD) of the sheet. Mean grain size was measured by using the line intercept method on grain boundary maps obtained by EBSD, where all high-angle grain boundaries and annealing twin boundaries were counted.
Hydrogen was introduced into the specimen by electrochemical charging in a 3% NaCl +3 g/L NH4SCN aqueous solution at a current density of 100 A/m2 for 48 h. The amount of hydrogen content was measured by thermal desorption spectroscopy (TDS). The specimen immediately after the hydrogen charging process was heated from room temperature to 800 °C at a heating rate of 100 °C/h, and the desorbed gas was analyzed at 5 min intervals using argon as a carrier gas. An argon gas mixed with hydrogen gas was used for the calibration. To estimate the distribution of hydrogen inside of the hydrogen-charged specimens, the surface layers of the hydrogen-charged specimens were removed by mechanical polishing with a thickness of 5 or 10 μm from both sides of the specimen immediately after hydrogen charging completed and then the TDS measurement was carried out. By comparing the TDS results, the amount of hydrogen involved in the removed layers was estimated.
Hydrogen embrittlement behaviors were evaluated by a uniaxial slow strain rate tensile test at room temperature. Smooth tensile specimens with a gauge length of 10 mm and width of 5 mm were cut from the annealed sheet with a thickness of 1 mm or the as-received plate by an electrical discharge machine and then are mechanically grounded using emery papers and diamond pastes to reduce the thickness to 0.6 mm. The crosshead speed in the slow strain rate tensile test was 0.005 mm/min, corresponding to an initial strain rate of 8.3 × 10⁻⁶ s−1. An extensometer was attached to the tensile specimens to measure the displacement precisely. Tensile tests were performed two times for each condition of the specimens to confirm reproducibility. The fracture surfaces of the tensile-tested specimens were examined by FE-SEM.
To clarify the relationship between crack propagation behaviors and the microstructure, an interrupted uniaxial slow strain rate tensile test was carried out at an initial strain rate of 8.3 × 10⁻⁶ s−1 at room temperature by the use of double-notch tensile test specimens. Round notches with a diameter of 2 mm and a depth of 1.25 mm were introduced at the center of the gauge part from the two sides of the smooth tensile specimens. Tensile test was interrupted immediately after the maximum stress (load). The surface cracks and microstructures were characterized by FE-SEM and EBSD. The cracks were observed from the normal direction (ND) of the sheet specimens.
A three-point bending test was also carried out to evaluate fracture toughness of the uncharged and hydrogen-charged specimens. The strain rate used was 8.3 × 10⁻⁶ s−1, which was the same as that in the slow strain rate tensile test. The length (L), width (W), and thickness (B) of the specimen were 20 mm, 3 mm, and 1 mm, respectively, and the distance of the supporting pins (S) was 12 mm. A notch with a length (a) of 1.5 mm and a tip radius of 0.2 mm was introduced in the specimens by a discharge wire cutting machine, and then the specimens were hydrogen-charged. To keep the same condition for all the hydrogen-charged specimens, TDS measurements, tensile tests, and three-point bending tests were started exactly 1.8 ks after the hydrogen charging process finished.
III. RESULTS
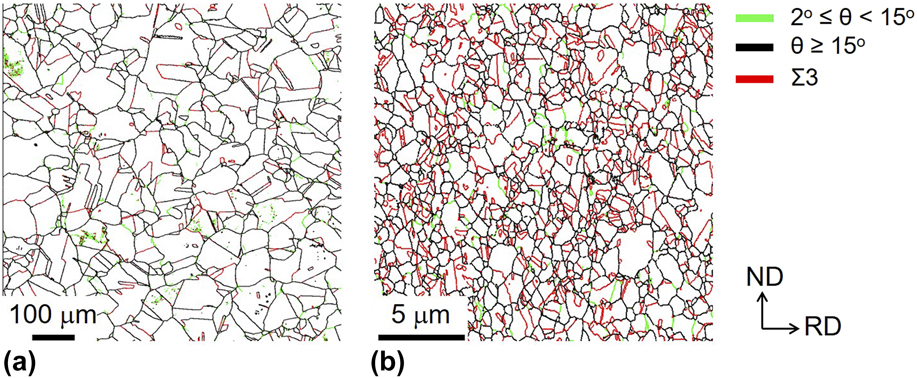
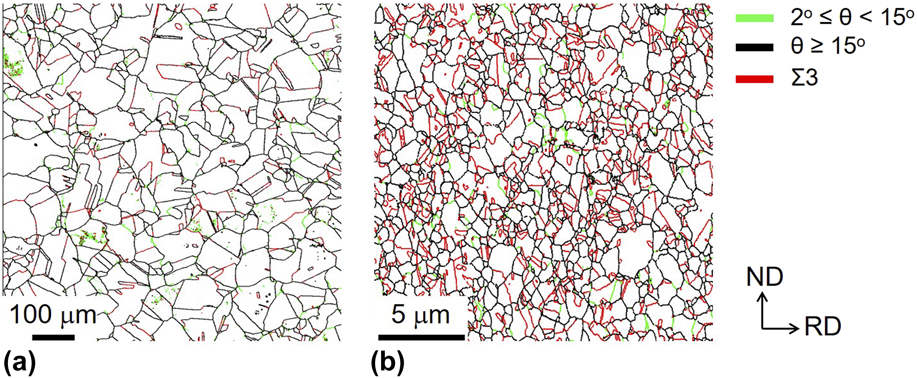
Figures 1(a) and 1(b) show grain boundary maps obtained from the EBSD analysis of the as-received hot-forged specimen and the cold-rolled and subsequently annealed specimen, respectively. Microstructures were observed from the TD of the sheets. The green, black, and red lines correspond to low-angle boundaries, high-angle boundaries, and Σ3 twin boundaries, respectively. The high-angle boundaries and low-angle boundaries were determined as boundaries with a misorientation larger than 15° and boundaries with a misorientation between 2° and 15°, respectively. As shown in Fig. 1(a), the as-received 22Mn–0.6C TWIP steel exhibited an almost fully recrystallized structure composed of equiaxed grains with a little number of low-angle boundaries inside grains. Hence, the as-received hot-forged TWIP steel was used as the coarse-grained material. The mean grain sizes counting and excluding annealing twin boundaries were 21 μm and 44 μm, respectively. Through the four-step cold rolling and subsequent annealing process, the specimen with a fully recrystallized structure having a mean grain size of 0.58/0.69 μm including/excluding annealing twins was obtained [Fig. 1(b)]. They are hereafter termed as the coarse-grained and the ultrafine-grained specimens, respectively.
EBSD grain boundary maps of the (a) as-received hot-forged specimen (coarse-grained specimen) and (b) cold-rolled and subsequently annealed specimen (ultrafine-grained specimen). Observed from the TD of the sheets. The green, black, and red lines correspond to low-angle boundaries, high-angle boundaries, and Σ3 twin boundaries, respectively. The high-angle boundaries and low-angle boundaries were determined as boundaries with a misorientation larger than 15°, and boundaries with a misorientation between 2° and 15°, respectively.
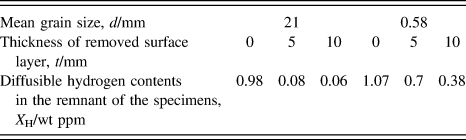
The hydrogen desorption rate curves of the uncharged and the hydrogen-charged specimens were obtained by the TDS measurement. Since any blisters and micro cracks were not observed on the specimen surfaces after hydrogen charging except for thin rust, any surface treatments were not conducted before the TDS measurement. At least two measurements were performed for the specimen with a certain grain size and the reproducibility was good. The result suggested that the surface condition did not affect the TDS measurement. The hydrogen released below 200 °C was defined as diffusible hydrogen in the present study. The diffusible hydrogen can easily diffuse in the materials, which have been considered to be tapped by dislocations Reference Nagumo, Takai and Okuda23 and grain boundaries. Reference Choo and Lee24 Nondiffusible hydrogen trapped by strong trapping sites such as twin boundaries and particular precipitates Reference Tsuchida, Hara and Tsuzaki25 corresponds to the second peak above 200 °C. It is known that only the diffusible hydrogen affects the hydrogen embrittlement of the material. Reference Takai and Watanuki26 In the uncharged specimens, diffusible hydrogen was scarcely detected. On the other hand, the diffusible hydrogen contents were 0.98 wt ppm and 1.07 wt ppm in the coarse-grained and ultrafine-grained specimens, respectively. There was almost no change in the diffusible hydrogen content in the specimens with different grain sizes. Although some differences between the coarse-grained and ultrafine-grained specimens and changes by removing surfaces were observed for the second peak corresponding to the nondiffusible hydrogen in the hydrogen desorption rate curves, the reasons were unclear and we thought that the nondiffusible hydrogen did not affect the hydrogen embrittlement behaviors as was believed. Reference Takai and Watanuki26
Hydrogen contents in the remnant of the hydrogen-charged specimens were measured by means of TDS after removing the surface layers by a thickness of 5 or 10 μm from both sides of the specimens. In the coarse-grained and ultrafine-grained specimens, the amount of diffusible hydrogen became small after removing 5 μm surface layers, compared with those in the layer unremoved counterparts. Furthermore, almost no hydrogen was detected after removing 10 μm surface layers in the coarse-grained specimen, whereas a small amount of diffusible hydrogen was still left in the ultrafine-grained specimen. The diffusible hydrogen contents in the remnant of the specimens after removing various thicknesses of surface layers are summarized in Table I. The distribution of diffusible hydrogen was not uniform but concentrated in the surface layers of the specimens, which was probably because of the slow diffusion rate of hydrogen in FCC austenite. The result suggested that diffusible hydrogen concentrated within the 10 μm thick surface layers in the coarse-grained specimen. In the ultrafine-grained specimen, hydrogen diffused deeper than in the coarse-grained specimen, but the depth is probably less than several tens of micro meters even in the ultrafine-grained specimen. There is no precisely measured diffusion coefficient of hydrogen reported in the 22Mn–0.6C austenitic TWIP steel used in this study. Thus, using the hydrogen diffusion coefficient at room temperature in a 316 austenitic stainless steel, D = 4 ×10⁻¹⁶ m2/s, Reference Chêne, Aucouturier, Arnould-Laurent, Tison, Fidelle, Bernstein and Thompson27 the hydrogen diffusion distance, d, under the condition of 48 h (corresponding to the hydrogen charging time) at room temperature was simply estimated as 12 μm, using d 2 = 2Dt. Although the chemical composition of the 316 stainless steel is significantly different from that of the present TWIP steel, the calculated result of the diffusion distance of hydrogen seems to correspond with the thickness of the subsurface region where hydrogen concentrated.
Summary of diffusible hydrogen content in the specimens after removing surface layers by thickness of 0, 5 or 10 μm, from both sides of the 22Mn–0.6C TWIP steel specimens.

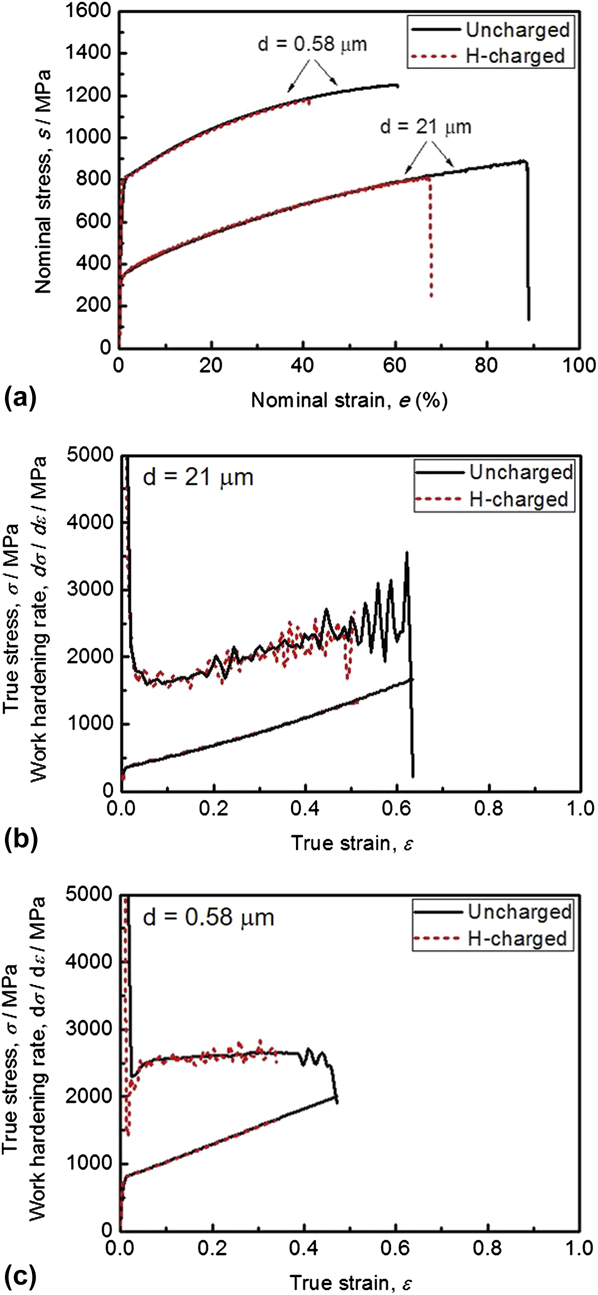
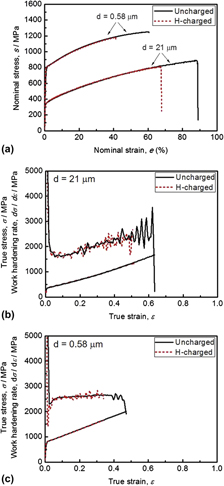
Figure 2(a) shows nominal stress–strain curves of the uncharged and hydrogen-charged specimens of the 22Mn–0.6C steel with different grain sizes. The yield strength and tensile strength increased significantly with decreasing the grain size from 21 to 0.58 μm. Serrations, which are commonly observed in high-manganese austenitic steels with carbon, Reference Ryu, Kim, Lee, Suh and Bhadeshia12,Reference Chun, Park and Lee28,Reference Ronevich, Kim, Speer and Matlock29 were recognized on the stress–strain curves. This would be related to the dynamic interaction between gliding dislocations and mobile solute atoms, namely dynamic strain aging. Reference Bouaziz, Allian, Scott, Cugy and Barbier3 Compared with the uncharged specimens, the hydrogen-charged specimens having the same grain size were fractured at lower strains and lower stresses. However, the hydrogen-charged specimens still exhibited a considerably large tensile elongation over 40%. The hydrogen charging led to the decrease of the ultimate tensile strength and total elongation, whereas the yield strength was not affected in the both coarse-grained and ultrafine-grained specimens. It should be noted that there were no blisters and micro cracks on the specimen surfaces after the hydrogen charging but only thin rust was confirmed. Although no surface treatments like polishing was conducted before the tensile test, it was considered that the thin rust did not affect the mechanical properties.
(a) Nominal stress–stain curves of the coarse-grained and ultrafine-grained specimens of 22Mn–0.6C steel. True stress–stain curves and work hardening rate curves of (b) the coarse-grained specimens and (c) ultrafine-grained specimens. Hydrogen-charged specimens are expressed in red broken lines, while those of the uncharged specimens in black solid lines.

Figures 2(b) and 2(c) shows true stress–strain curves of the uncharged and hydrogen-charged specimens with coarse grains and ultrafine grains under an assumption of uniform deformation, together with work hardening rate curves obtained from the slopes of the true stress–strain curves. The intersection of the true stress–strain curve and the work hardening rate curve corresponds to the initiation of necking, i.e., the plastic instability point in Considère criterion. Reference Tsuji, Ito, Sato and Miyamoto30 It was found from Fig. 2(c) that the uncharged ultrafine-grained specimen fractured after the two curves intersected, i.e., after the plastic instability (necking), whereas the uncharged coarse-grained specimens fractured before the two curves met (before the plastic instability or necking) [Fig. 2(b)], which indicated that the ultra grain refinement prevented early fracture of the uncharged specimen. When the specimens were hydrogen-charged, the fracture which happened before two curves met in both the coarse-grained and ultrafine-grained specimens. That is, early fracture happened in the hydrogen-charged specimens.
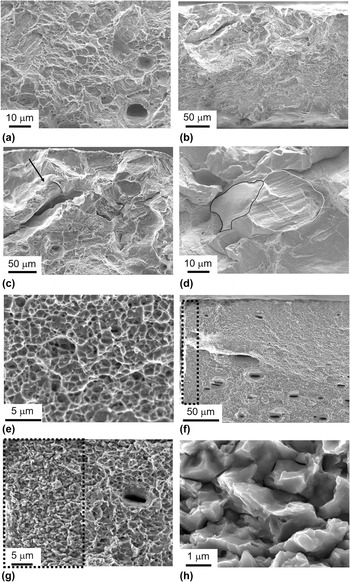
Figure 3 shows SEM images of fracture surfaces of the uncharged and hydrogen-charged specimens having different grain sizes after fracture in the slow strain rate tensile test. A large number of dimples were observed in the uncharged specimens [Figs. 3(a) and 3(e)], indicating that ductile fracture occurred. The dimples in the ultrafine-grained specimen [Fig. 3(e)] were much finer than those in the coarse-grained specimen [Fig. 3(a)]. On the other hand, most of the fracture surface of the hydrogen-charged coarse-grained specimen was still covered by dimples. Except the major ductile fracture surfaces, brittle fracture surfaces were partially observed near the surface of the specimens. Figure 3(b) shows a representative feature of the brittle fracture surfaces in a low magnification observed in the hydrogen-charged coarse-grained specimen. Figures 3(c) and 3(d) show higher magnification images of some areas in Fig. 3(b), revealing typical features of the brittle fracture surfaces. A relatively large secondary crack was observed as was pointed out by an arrow in Fig. 3(c). In addition, two types of different morphologies of brittle surfaces were confirmed, as outlined by black and white lines in Fig. 3(d): one brittle fracture morphology was a relatively smooth surface [surrounded by black lines in Fig. 3(d)], and the other was a surface including parallel striations [surrounded by white lines in Fig. 3(d)]. Considering the mean grain size excluding twin boundaries in the coarse-grained specimen (44 μm), those brittle surfaces seem to correspond with a grain boundary fracture. Concerning the latter morphology, similar fracture surfaces were also reported in a 23Mn–0.6C steel tested in a hydrogen gas atmosphere. Reference Michler, Marchi, Naumann, Weber and Martin31 The parallel traces might correspond to slip lines or deformation twins. The hydrogen-charged ultrafine-grained specimen mostly showed ductile fracture surfaces composed of dimple patterns as well as a small portion of brittle fracture surfaces near the edge of the specimen [the region surrounded by dotted lines in Figs. 3(f) and 3(g)]. The brittle fracture surface was more clearly observed in the SEM images with a higher magnification in Figs. 3(g) and 3(h). The brittle fracture surface was very smooth and the size of the fracture surface unit corresponded to the mean grain size excluding twin boundaries in the ultrafine-grained specimen (0.69 μm), which indicated that the brittle fracture surface was composed of intergranular fractures. The depth position of the brittle fracture surfaces was ranging from 50 to 150 μm from the surface in the coarse-grained specimen [Fig. 3(b)], which was much deeper than the hydrogen-concentrated surface layers shown in Table I, which can be understood in a following context. Even though the brittle fracture initiates from the surface of the specimens where hydrogen highly concentrates, it is considered that the transition of cracks from brittle mode to ductile mode does not necessarily occurs exactly at the position where the hydrogen concentration becomes very low. For example, when a crack becomes large, the stress concentration at the crack tip becomes naturally high, which may cause a continuous propagation of brittle fractures even beyond the position where the hydrogen concentration becomes very low. On the other hand, the depth position of the brittle fracture surfaces was within 10 μm from the specimen surface in the ultrafine-grained specimen [Fig. 3(g)], which coincided with the hydrogen-concentrated layers (Table I). It is noteworthy that the fraction of the brittle fracture surfaces was significantly different between the specimens having different grain sizes, i.e., 8.6% of the whole fracture surface in the coarse-grained specimen, while only 0.6% in the ultrafine-grained specimen.
SEM images of fracture surfaces of the 22Mn–0.6C steel specimens tested in the slow strain rate tensile test: (a) the uncharged coarse-grained specimen, (b–d) the hydrogen-charged coarse-grained specimen, (e) the uncharged ultrafine-grained specimen, and (f–h) the hydrogen-charged ultrafine-grained specimen. (c) and (d) Show different morphologies of fracture surfaces in the hydrogen-charged coarse-grained specimen. The arrow in (c) indicates the secondary crack. The black line and white line in (d) indicate different morphologies of brittle fracture surfaces in the hydrogen-charged coarse-grained specimen. The dotted lines in (f) and (g) indicate the areas showing brittle fracture surfaces in the hydrogen-charged ultrafine-grained specimen in different magnifications, and (h) shows a higher magnification image of the brittle fracture surfaces.

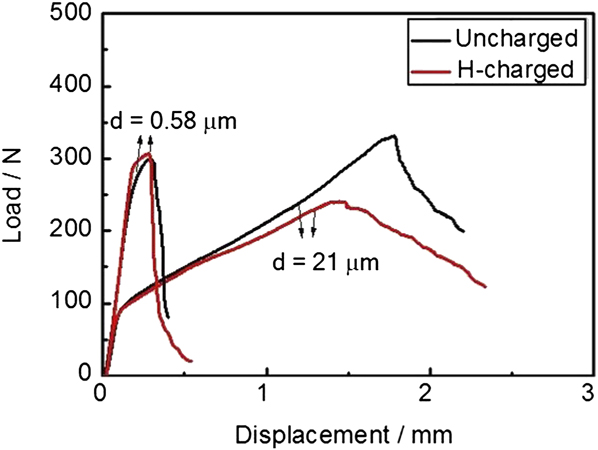
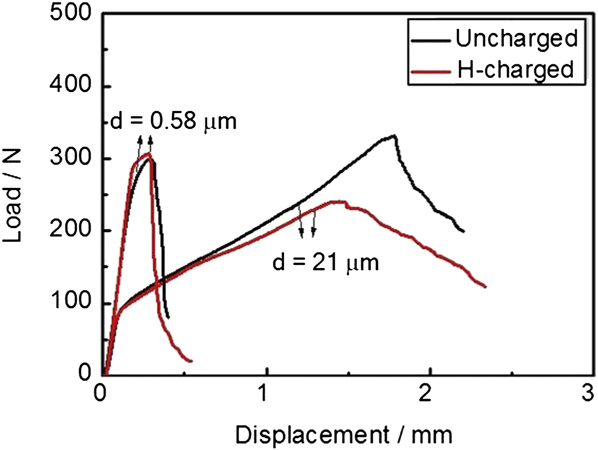
Figure 4 shows load–displacement curves obtained from the three-point bending tests of the coarse-grained and ultrafine-grained specimens with and without hydrogen charging. Black lines and red lines indicate the uncharged specimens and the hydrogen-charged specimens, respectively. Compared with the coarse-grained specimens, the ultrafine-grained specimens exhibited smaller plastic deformation. Note that all the specimens did not fracture after the three-point bending tests. This indicated that the 22Mn–0.6C steel is not a brittle material but is quite ductile even after the hydrogen charging process. In addition, the dimensions of the specimens used were smaller than the standard specimens. As a result, the small scale yielding condition for determining the fracture toughness (K ІC) exactly based on the fracture mechanics theory was not satisfied in the present three-point bending tests. Thus, assuming that the maximum load corresponded to the load at fracture initiation, the apparent fracture toughness, K A, was calculated using the value of the maximum load (P max) in the load–displacement curves, according to the equation shown below:
 $${K_{\rm{A}}} = {{{P_{\max }} f\left( {{a \over W}} \right)} \over {B\sqrt W }}\quad .$$
 $$f\left( {{a \over W}} \right) = {{{{3S} \over W}\sqrt {{a \over W}} } \over {2\left( {1 + 2{a \over W}} \right){{\left( {1 - {a \over W}} \right)}^{3/2}}}}\left[ {1.99 - {a \over W}\left( {1 - {a \over W}} \right)\left\{ {2.15 - 3.93{a \over W} + 2.7{{\left( {{a \over W}} \right)}^2}} \right\}} \right]\quad ,$$
Where a is the notch length, W is the specimen width, B is the specimen thickness, and S is the specimen span. It was found that the apparent fracture toughness decreased from 63.2 to 45.9 MPa m1/2 by hydrogen charging in the coarse-grained specimens. In the ultrafine-grained specimens, on the other hand, the apparent fracture toughness did not change by hydrogen charging. The result suggested a suppression of hydrogen embrittlement by the grain refinement.
Load-displacement curves obtained from the three-point bending test of the coarse-grained and ultrafine-grained 22Mn–0.6C steel specimens. The curves of the uncharged and hydrogen-charged specimens are drawn in black and red lines, respectively.
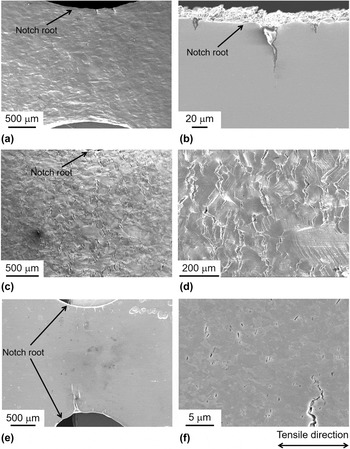
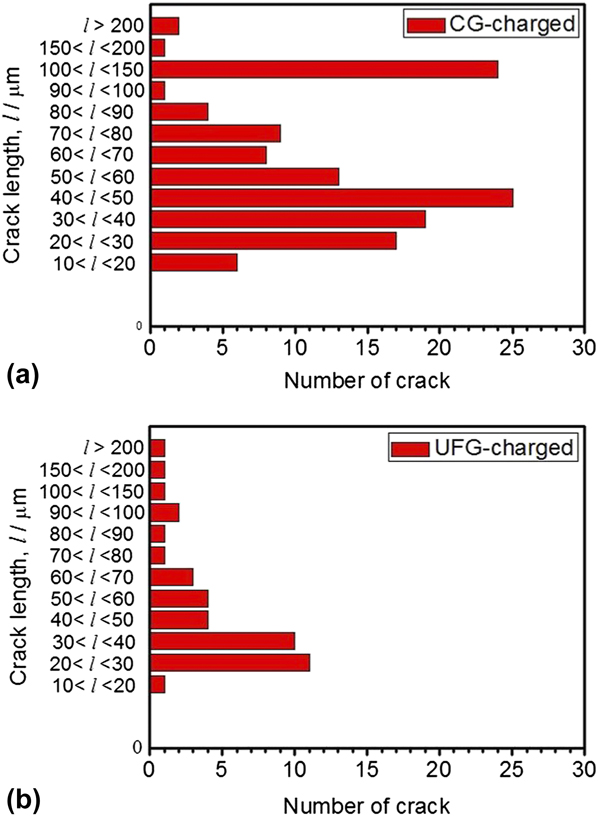
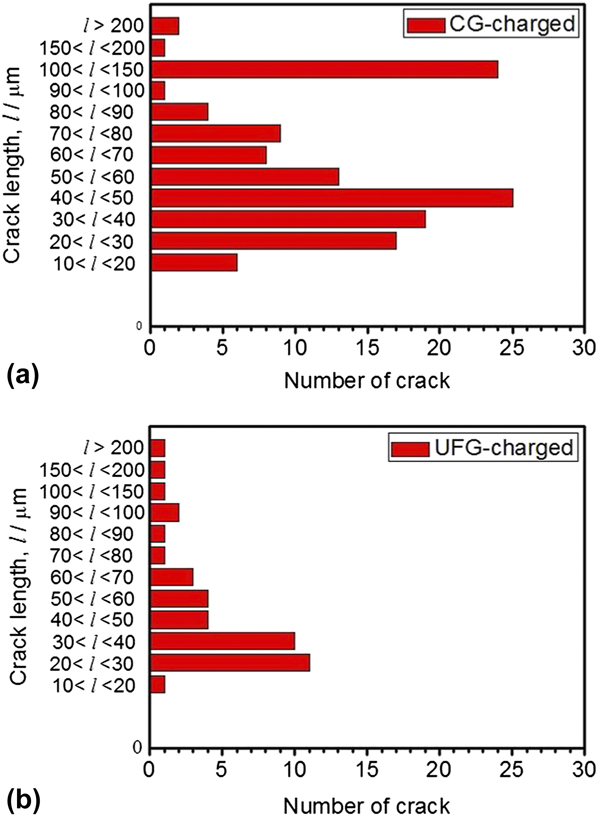
Interrupted slow strain rate tensile tests were carried out for both of the hydrogen-charged coarse-grained and ultrafine-grained specimens. The tensile tests were stopped immediately after reaching the maximum loads (stresses). The displacement and stress at the interrupted point were 1.58 mm and 800 MPa for the coarse-grained specimen and 0.59 mm and 1100 MPa for the ultrafine-grained specimen, respectively. Figure 5 shows SEM images around the notch roots of the 22Mn–0.6C steel specimens with different grain sizes after the interrupted tensile tests. Only a few cracks were observed around the notch roots in both of the uncharged coarse-grained and ultrafine-grained specimens [Figs. 5(a) and 5(b)]. It was found that the crack lengths were shorter than one hundred micro-meters. Compared with the uncharged coarse-grained specimen, a large number of cracks were observed on the surface of the hydrogen-charged coarse-grained specimen [Figs. 5(c) and 5(d)]. Figure 5(d) shows a magnified image of Fig. 5(c). It is noteworthy that the cracks in the hydrogen-charged specimens propagated approximately perpendicular to the tensile axis. In the hydrogen-charged ultrafine-grained specimen [Fig. 5(e)], several large cracks were observed at the notch root, but the length of the cracks was smaller than that in the hydrogen-charged coarse-grained specimen [Fig. 5(c)]. In the magnified image [Fig. 5(f)], numerous numbers of very small cracks with lengths smaller than one micro-meter were observed in the hydrogen-charged ultrafine-grained specimen. Lengths of the cracks observed around the notch roots of the hydrogen-charged specimens are summarized in Figs. 6(a) and 6(b), which represent the coarse-grained specimen and ultrafine-grained specimen, respectively. According to Fig. 6, the coarse-grained specimen exhibited more cracks than the ultrafine-grained specimen. In the coarse-grained specimen, the total number of cracks was much larger, and the number of large cracks was also larger than those in the ultrafine-grained specimen. Especially in the range of relatively large crack length from 100 to 200 μm, the number of cracks was 25 of 130 in the coarse-grained specimen, whereas only 2 of 40 in the ultrafine-grained specimen. This indicated that the size and the frequency of the hydrogen-related cracks decreased with decreasing the grain size.
SEM images around the notch root of the uncharged and the hydrogen-charged 22Mn–0.6C steel specimens after interrupting the slow strain rate tensile test at the maximum stress: (a) the uncharged coarse-grained specimen, (b) the uncharged ultrafine-grained specimen, (c, d) the hydrogen-charged coarse-grained specimen, and (e, f) the hydrogen-charged ultrafine-grained specimen.

Length distribution of micro cracks observed around the notch roots of the hydrogen-charged 22Mn–0.6C steel: (a) The coarse-grained specimen and (b) the ultrafine-grained specimen.
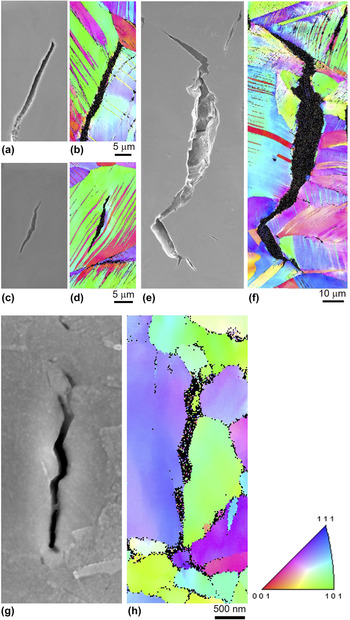
EBSD scanning was also conducted in the regions around hydrogen-related micro cracks to characterize the relationship between the microstructure and crack propagation behavior. Figures 7(a), 7(c), and 7(e) show SEM images, and Figs. 7(b), 7(d), and 7(f) show corresponding EBSD orientation maps of typical micro cracks formed around the notch root in the hydrogen-charged coarse-grained specimen. Figures 7(g) and 7(h) show an SEM image and a corresponding EBSD orientation map near a typical micro crack formed around the notch root in the hydrogen-charged ultrafine-grained specimen. The colors in the EBSD orientation maps express crystallographic orientation parallel to the ND of the observed surfaces, according to the key stereographic triangle shown in the figure. From Figs. 7(a) and 7(b), it was found that the crack formed along the grain boundaries at which deformation twins in neighboring grains impinged. On the other hand, the crack shown in Figs. 7(c) and 7(d) formed inside the grain in which there were many deformation twins. The large crack shown in Figs. 7(e) and 7(f) had a total length over 100 μm, which propagated along several grain boundaries. In all the cases when the cracks formed along the grain boundaries, deformation twins impinged at the grain boundaries. Figures 7(g) and 7(h) indicated that the hydrogen-related crack formed along the grain boundaries in the ultrafine-grained specimen. To analyze the feature of the hydrogen-related crack quantitatively, 139 individual cracks were observed by EBSD in the hydrogen-charged coarse-grained specimens, and 130 cracks among 139 propagated along grain boundaries. In case of the hydrogen-charged ultrafine-grained specimen, although there were a large number of cracks, the width of the cracks was much larger than grain sizes of the ultrafine grains, so it was difficult to distinguish whether the cracks were on the grain boundaries or within the grains. As a consequence, only 12 cracks were correlated with the microstructure, but 10 cracks propagated along grain boundaries, which corresponded with the brittle fracture surfaces similar to grain boundary fracture [Fig. 3(h)]. These results indicated that grain boundaries played an essential role in the hydrogen embrittlement of the present 22Mn–0.6C steel.
(a, c, e) SEM images and (b, d, f) EBSD orientation maps of typical micro cracks formed around the notch root in the hydrogen-charged coarse-grained 22Mn–0.6C steel specimen. (g) SEM image and (h) EBSD orientation map of a typical micro crack formed around the notch root in the hydrogen-charged ultrafine-grained 22Mn–0.6C TWIP steel specimen. The colors in the EBSD orientation maps express crystallographic orientation parallel to the ND of the observed surfaces, according to the key stereographic triangle shown in the figure.

IV. DISCUSSION
A. Hydrogen embrittlement in 22Mn–0.6C steel with different grain sizes
In the slow strain rate tensile tests, the total elongation and the tensile strength decreased significantly by hydrogen charging in both the coarse-grained specimen and the ultrafine-grained specimen [Fig. 2(a)]. The losses of total elongation by hydrogen charging were 31.8 and 23.8% to those of the uncharged case in the ultrafine-grained and coarse-grained specimens, respectively, from which the susceptibility to hydrogen embrittlement might seem increased with decreasing the grain size. However, the losses of the fracture stresses were 5.6 and 9.6% in the ultrafine-grained and coarse-grained specimen, respectively: i.e., the decrease of the fracture strength by hydrogen was suppressed in the ultrafine-grained specimen. In addition, the fracture surfaces of the hydrogen-charged specimens showed some differences in the different grain-sized specimens. The hydrogen-charged coarse-grained and ultrafine-grained specimens both showed mostly ductile fracture characteristics (dimples) on the fracture surfaces, which corresponded to their large tensile ductility. Besides the major ductile fracture surfaces, both specimens also partly showed brittle fracture morphologies like grain boundary fracture [Figs. 3(c), 3(d), and 3(g)] around the corner or at the surfaces of the specimens, which seemed to correspond to the concentrated existence of hydrogen in the surface regions of the specimens (Table I). However, the fractions of the brittle fracture surfaces in the coarse-grained specimen and the ultrafine-grained specimen were 8.6 and 0.6%, respectively, indicating that the fraction of the brittle fracture surfaces clearly decreased in the ultrafine-grained specimen. Furthermore, the apparent fracture toughness (K A) obtained by the three-point bending test of the coarse-grained specimen fairly decreased by hydrogen charging, but the apparent fracture toughness of the ultrafine-grained specimen did not change by the hydrogen addition (Fig. 4). Additionally, the number and the size of the micro cracks observed in the hydrogen-charged specimens after the interrupted tensile test decreased with decreasing the grain size (Figs. 5 and 6).
It is expected that hydrogen may desorb somehow from the specimens during the slow strain rate tensile tests and the three-point bending tests. However, we could find clear differences in the elongation, the fracture stress, the fracture surfaces, and the apparent fracture toughness between the hydrogen-charged specimens and the uncharged specimens with different grain sizes. All these clearly indicated that the charged hydrogen remained in the specimens and induced a kind of embrittlement during the slow strain rate tensile tests and the three-point bending tests.
The above mentioned results obtained in the present experiments indicated that hydrogen embrittlement was suppressed by decreasing the grain size down to ultrafine-grained scale in the 22Mn–0.6C TWIP steel. In addition, it should be noted that the brittle fracture surfaces obtained in the hydrogen-charged specimens resembled the grain boundary fracture (Fig. 3), and the SEM and EBSD observations (Fig. 7) confirmed that most of the cracks formed and propagated along grain boundaries of austenite. That is, grain boundaries played an important role in the hydrogen embrittlement of the 22Mn–0.6C austenitic TWIP steel.
B. Diffusible hydrogen content at per unit grain boundary area
In the hydrogen desorption rate curves, all the hydrogen-charged specimens exhibited only one peak around 110 °C for diffusible hydrogen, which suggested that diffusible hydrogen released from either dislocations or grain boundaries in the TDS measurement, according to the previous study about hydrogen trapping sites. Reference So, Kim, Chun, Park, Lee and Lee32 Since the specimens have fully recrystallized microstructures with coarse grains and ultrafine grains, the dislocation density must be low and equivalent in the coarse-grained and ultrafine-grained specimens. Hence, it is considered that grain boundaries are the main trapping sites for diffusible hydrogen in the present specimens.
Diffusible hydrogen is concentrated mostly in the subsurface regions with the depth of about 10 μm from the surface in the sheet specimens, as shown in Table I. Furthermore, the microstructural characterization of the hydrogen-related cracks (Fig. 7) indicated that most of the hydrogen-related micro cracks formed along grain boundaries in both of the coarse-grained and ultrafine-grained specimens, which emphasized an important role of the grain boundaries in the hydrogen embrittlement of the 22Mn–0.6C TWIP steel. Thus, we calculated the amount of hydrogen at grain boundaries under a simple assumption that all diffusible hydrogen distributed uniformly at grain boundaries existing within the 10 μm depth regions from the surface of the hydrogen-charged specimens. In reality, the hydrogen solubility and diffusivity in the lattice and on grain boundaries must be different. It means the above assumption is too simple and the the case is extreme. Note that no precise data of solubility and diffusivity of hydrogen in the lattice or on grain boundaries in the present 22Mn–0.6C steel (or even in any austenitic steels) is available at the present moment unfortunately. The grain boundary area per unit volume, S v [m2/m3 = m−1], can be expressed as a function of the mean interception length of grains (the mean grain size in the present study), d, as:
 $${S_{\rm{v}}} = {2 \mathord{\left/ {\vphantom {2 d}} \right. \kern-\nulldelimiterspace} d}\quad .$$
According to Eq. (3), the grain boundary areas per unit volume in the specimens having the mean grain size of 44 μm (coarse grains, without counting twin boundaries), and 0.69 μm (ultrafine grains) are 4.5 × 10⁴ m−1 and 2.9 × 10⁶ m−1, respectively. Diffusible hydrogen content (w H) in the surface regions with a thickness of 10 μm was calculated by the values shown in Table I, and it was 27.7 wt ppm in the coarse-grained specimen and 21.1 wt ppm in the ultrafine-grained specimen, respectively. The amount of diffusible hydrogen in the surface regions (with the same volume) is almost the same in the different grain-sized specimens. However, the corresponding local diffusible hydrogen contents in the unit surface area of the grain boundary (x H GB) are greatly different: 4.8 × 10⁻³ and 6.1 × 10⁻⁵ g/m2 for the coarse-grained specimen and ultrafine-grained specimen, respectively, which are obtained from the following formula:
 $${x_{\rm{H}}}^{{\rm{GB}}} = {{{w_{\rm{H}}}} \mathord{\left/ {\vphantom {{{w_{\rm{H}}}} {{S_{\rm{v}}}}}} \right. \kern-\nulldelimiterspace} {{S_{\rm{v}}}}}\quad .$$
The simple calculation result indicated that the hydrogen content per unit grain boundary area after hydrogen charging (and before tensile testing) decreased with decreasing the mean grain size.
C. Stress concentration at grain boundaries
Besides the static condition of hydrogen existence described in Sec. IV.B, the elastic and plastic deformation may also play an important role in hydrogen accumulation during the tensile test. It is known that diffusible hydrogen atoms tend to accumulate at high stress concentration sites. Reference Oriani, Hirth and Smialowski33 During plastic deformation, mobile dislocations can pile-up against grain boundaries and thus give rise to stress concentration. The degree of the stress concentration increases with increasing the number of dislocations pile-up at grain boundaries. When n dislocations are piled up at a grain boundary under an external shear stress of τ, the stress concentration at the pile-up front is nτ. Reference Weertman and Weertman34 The relationship between the external shear stress (τ), the number of piled-up dislocations (n), and the pile-up length (L) can be formulated as,
 $$L = {{n\mu b} \over {\left( {1 - \nu } \right)\pi \tau }}\quad ,$$
where μ is the shear modulus, b the magnitude of Burgers vector, and ν the Poisson’s ratio.
Strength of the material (τ) increases with decreasing the grain size, and the increase of the yield strength in the present material by grain refinement from 21 to 0.58 μm is 2.2 times. Since the maximum pile-up length (L) within a grain is about half of the grain size, d/2, the pile-up length becomes 0.0276 times smaller by the grain refinement from 21 to 0.58 μm. Considering both, therefore, the number of dislocations pile-up at grain boundaries (n) is considered to decrease with the decrease in the grain size from 21 to 0.58 μm (approximately 0.06 times smaller). That is to say, in the present study, the number of dislocations pile-up at grain boundaries in the ultrafine-grained specimen was smaller than that in the coarse-grained specimen, so the stress concentration by the dislocation pile-up would be lower in the ultrafine-grained specimen (roughly 10% even considering the increase of the flow stress by the grain refinement). The lower stress concentration at the grain boundary resulted in the smaller amount of local hydrogen accumulation at grain boundaries in the ultrafine-grained specimen than that in the coarse-grained specimens during deformation. The accumulation of hydrogen at grain boundaries may induce intergranular fracture.
Accordingly, we conclude that the smaller hydrogen content per unit grain boundary area after the hydrogen charging process and the smaller amount of hydrogen accumulation at grain boundaries in the deformation process due to the lower stress concentration by dislocations pile-up resulted in the suppression of hydrogen embrittlement in the present ultrafine-grained specimen.
V. CONCLUSIONS
In the present study, the 22 mass% Mn–0.6 mass% C TWIP steel specimens having fully recrystallized microstructures with two different mean grain sizes of 21 μm (coarse-grained) and 0.58 μm (ultrafine-grained) were used to investigate the effect of the grain size on the hydrogen embrittlement behaviors. The major results obtained are as follows:
-
(1) Under the present hydrogen charging condition, a similar amount of hydrogen was introduced to the both coarse-grained and ultrafine-grained specimens. Diffusible hydrogen concentrated in the surface regions with a thickness of around 10 μm due to the slow diffusion rate of hydrogen in FCC austenite.
-
(2) In the slow strain rate tensile tests, degradation of the total elongation and tensile strength occurred by hydrogen charging in both of the coarse-grained specimen and the ultrafine-grained specimen. The fracture surfaces of the both hydrogen-charged specimens were mainly composed of ductile fracture surfaces (dimples), but brittle fracture surfaces showing morphologies like grain boundary fracture were partly observed in the edge and surface regions. The fraction of the brittle fracture surfaces significantly decreased by the grain refinement. Furthermore, the apparent fracture measured by the three-point bending test fairly decreased by hydrogen charging in the coarse-grained specimen, while it did not decrease by hydrogen addition in the ultrafine-grained specimen. It could be concluded from these results that the ultra grain refinement suppressed hydrogen embrittlement in the 22Mn–0.6C TWIP steel.
-
(3) After the interrupted tensile test using notched specimens, a number of cracks were observed near notched regions in both of the coarse-grained and ultrafine-grained specimens. However, the number and the length of cracks in the coarse-grained specimen was much larger than those in the ultrafine-grained specimen. The microstructural characterization of the hydrogen-related cracks by SEM and EBSD confirmed that most of the hydrogen-related cracks formed and propagated along grain boundaries, which indicated an important role of grain boundaries in the hydrogen embrittlement of 22Mn–0.6C TWIP steel.
-
(4) A simple calculation showed that the diffusible hydrogen content per unit grain boundary area within the surface regions of the specimens decreased with decreasing the mean grain size. In addition, it was considered that the degree of local hydrogen accumulation at the grain boundary caused by stress concentration during deformation would be smaller in the ultrafine-grained specimen than that in the coarse-grained specimen because of the decrease in the number of piled-up dislocations in the fine grain size. The two above mentioned factors were considered as the reasons for the suppression of hydrogen embrittlement by grain refinement in the present 22Mn–0.6C steel.
ACKNOWLEDGMENTS
The present study was financially supported by the Elements Strategy Initiative for Structural Materials (ESISM), the Grant-in-Aid for Scientific Research (S) (No. 15H05767), and the Grant-in-Aid for Scientific Research on Innovative Area “Bulk Nanostructured Metals” (area No. 2201), all through the Ministry of Education, Culture, Sports, Science and Technology (MEXT), Japan. Yu Bai was supported by the Japanese Government Scholarship. All these supports are gratefully appreciated by the authors.