Introduction
In recent years, the network approach to psychopathology has been advanced as an alternative way of conceptualizing mental disorders. The central tenet of the network approach is that mental disorders arise from the causal interaction among symptoms in a network. To date, the network approach has been applied to a wide variety of psychiatric disorders, including depression, social anxiety disorder, personality disorder (Heeren & McNally, Reference Heeren and McNally2016; van Borkulo et al., Reference van Borkulo, Boschloo, Borsboom, Penninx, Waldorp and Schoevers2015; Wright & Simms, Reference Wright and Simms2016), and more recently, psychosis.
To date, in the psychosis literature, network analysis has been employed to investigate (a) psychotic experiences (Murphy, McBride, Fried, & Shevlin, Reference Murphy, McBride, Fried and Shevlin2018), potential pathways between psychotic symptoms and environmental risk factors or childhood trauma (Isvoranu, Borsboom, van Os, & Guloksuz, Reference Isvoranu, Borsboom, van Os and Guloksuz2016a), and transdiagnostic experiences surrounding auditory verbal hallucinations (Wigman, de Vos, Wichers, van Os, & Bartels-Velthuis, Reference Wigman, de Vos, Wichers, van Os and Bartels-Velthuis2017) in a general population sample; and (b) interactions among a wide array of psychotic symptoms (van Rooijen, Ploeger, & Kret, Reference van Rooijen, Ploeger and Kret2017) or among positive, negative, and depressive symptoms (van Rooijen et al., Reference van Rooijen, Isvoranu, Kruijt, van Borkulo, Meijer, Wigman and Cahn2018) predicting treatment response (Esfahlani, Sayama, Visser, & Strauss, Reference Esfahlani, Sayama, Visser and Strauss2017; Esfahlani, Visser, Strauss, & Sayama, Reference Esfahlani, Visser, Strauss and Sayama2018), negative symptom systems (Levine & Leucht, Reference Levine and Leucht2016), and pathways linking psychotic symptoms and childhood trauma (Isvoranu et al., Reference Isvoranu, van Borkulo, Boyette, Wigman, Vinkers, Borsboom and Investigators2016b) with psychosis or schizophrenia. Early treatment response or remission in first-episode psychosis (FEP) is of paramount importance given its association with long-term outcomes (Alvarez-Jimenez et al., Reference Alvarez-Jimenez, Gleeson, Henry, Harrigan, Harris, Amminger and Jackson2011; Emsley, Rabinowitz, Medori, & Group, Reference Emsley, Rabinowitz, Medori and Group2007; Friis et al., Reference Friis, Melle, Johannessen, Røssberg, Barder, Evensen and Langeveld2016). In this respect, network analysis of remitters with FEP would yield novel insights into the central symptoms related to remission and facilitate subsequent development of therapeutic interventions. Only one study has investigated the network structure of remission in patients with schizophrenia (van Rooijen et al., Reference van Rooijen, Isvoranu, Kruijt, van Borkulo, Meijer, Wigman and Cahn2018). They reported that remitted patients exhibited a similar network structure to that of non-remitters, but the networks differed significantly in terms of global strength. It is noteworthy that the study employed a cross-sectional design with only male patients. Investigating network structures of patients with FEP from first hospital presentation to short-term follow-up longitudinally is of paramount importance in that crucial global or local network metrics differentiating remitters-to-be from non-remitters-to-be at baseline or remitters from non-remitters at follow-up can be identified. Studies of changes in network structure in patients with FEP are surprisingly lacking.
To address these questions, the present study was undertaken to investigate network structures of remitters v. non-remitters in patients with FEP over time. The associations of rumination with positive symptoms (Hartley, Haddock, e Sa, Emsley, & Barrowclough, Reference Hartley, Haddock, e Sa, Emsley and Barrowclough2014), depression (Thomas, Ribaux, & Phillips, Reference Thomas, Ribaux and Phillips2014), and suicidality (Cui et al., Reference Cui, Kim, Lee, Kim, Yu, Lee and Kang2019) in schizophrenia have been reported. Negative beliefs/schemas following trauma are closely associated with psychotic experiences (Kilcommons & Morrison, Reference Kilcommons and Morrison2005) and people with chronic psychosis reported extreme negative evaluations of both self and others (Fowler et al., Reference Fowler, Freeman, Smith, Kuipers, Bebbington, Bashforth and Dunn2006). Therefore, we hypothesized that rumination and schemas would affect the outcome of FEP and that the network structure properties and centrality index would differ between remitters and non-remitters with FEP over time. Although ‘remitters-to-be’ and ‘non-remitters-to-be’ are the correct terms at baseline, ‘remitters’ and ‘non-remitters’ will be used hereafter for simplicity. The aims of the current study were to identify networks of 10 symptoms, including four clinical symptoms and six psychological symptoms of interest related to rumination and schemas, in patients with FEP at baseline and at the 6-month follow-up, when patients were divided into remitters and non-remitters; to identify the most central symptoms within these networks; and to examine group-level differences in network connectivity between the remitters and non-remitters at baseline (R-B and NR-B) and at 6 months (R-6 and NR-6) and within-group differences in the remitters and non-remitters over time.
Method
Study sample
Data were collected as part of the longitudinal multicenter Korean Early Psychosis Study (KEPS), described in detail elsewhere (Kim et al., Reference Kim, Lee, Kim, Yu, Lee, Won and Chung2017). The sample comprised 252 patients (184 remitters and 68 non-remitters) with FEP at baseline and at 6-month follow-up. At the 6-month follow-up, patients were classified as remitters or non-remitters using remission criteria consisting of scores ⩽3 on eight items of the Positive and Negative Syndrome Scale (PANSS), namely P1, P2, P3, N1, N4, N6, G5, and G9 (Andreasen et al., Reference Andreasen, Carpenter, Kane, Lasser, Marder and Weinberger2005). For the duration of remission, patients had to show signs of remission for at least 2 months instead of 6-month. Individuals who were being treated with antipsychotics for <2 years were considered FEP patients. The diagnoses of the 252 patients at baseline were schizophrenia (61.48%), schizophreniform disorder (18.68%), schizoaffective disorder (8.17%), psychotic disorder not otherwise specified (7.39%), delusional disorder (2.34%), and brief psychotic disorder (1.95%).
Measures
The severity of psychiatric symptoms was assessed using the PANSS (Kay, Fiszbein, & Opler, Reference Kay, Fiszbein and Opler1987; Yi et al., Reference Yi, Ahn, Shin, An, Joo, Kim and Lee2001), and depressive symptoms were evaluated using the Calgary Depression Scale for Schizophrenia (CDSS) (Addington, Addington, & Schissel, Reference Addington, Addington and Schissel1990; Kim et al., Reference Kim, Won, Lee, Choi, Jang, Lee and Han2005). Psychiatrists with more than 5 years of experience in conducting ratings evaluated the patients. For self-rating scales, the Brief Core Schema Scale (BCSS) (Fowler et al., Reference Fowler, Freeman, Smith, Kuipers, Bebbington, Bashforth and Dunn2006) and Brooding Scale (BS) were employed. The BCSS contains 24 items concerning beliefs about the self and others, which are assessed using a five-point rating scale (0–4). Four subscale scores were obtained: negative-self (six items), positive-self (six items), negative-others (six items), and positive-others (six items) scores. The BS was developed by the present author (Chung, YC) and has been standardized for use in patients with schizophrenia (Kim et al., Reference Kim, Piao, Kim, Park, Kang, Lee and Chung2019). The BS measures the degree of rumination about past negative events and has a Cronbach's α of 0.93. The scale consists of 11 items divided into cognitive (five items) and emotional subscales (six items). A higher score on the BS indicates a greater degree of rumination. Five patients (1.98%) at baseline and 20 patients (7.93%) at the 6-month follow-up had missing data for some of the self-rating scales (for the CDSS and PANSS, 0–2.33% were missing, and for the other remaining scales, 1.17–8.56%). We used the R-package ‘Amelia’ (Honaker, King, & Blackwell, Reference Honaker, King and Blackwell2011) with a bootstrapping algorithm to impute data to avoid bias in the results. As all scores for each parameter exhibited skewed distributions based on the Shapiro–Wilk test, they were normalized using non-paranormal transformation (Epskamp, Borsboom, & Fried, Reference Epskamp, Borsboom and Fried2018; Liu, Lafferty, & Wasserman, Reference Liu, Lafferty and Wasserman2009) by way of high-dimensional undirected graph estimation with the ‘Huge’ package (Zhang, Ou-Yang, & Yan, Reference Zhang, Ou-Yang and Yan2017).
Network construction
We fitted a Gaussian graphical model (GGM) to the data. A GGM is an undirected network, in which a missing edge indicates that two variables are independent after conditioning on the set of remaining variables (Lauritzen & Wermuth, Reference Lauritzen and Wermuth1989). Networks were constructed using the 10 symptom nodes [PANSS-positive symptoms (P), PANSS-negative symptoms (N), PANSS-general psychopathology (G), CDSS-depressive symptoms (CS), BCSS-negative self (NS), BCSS-positive self (PS), BCSS-negative others (NO), BCSS-positive other (PO), BS-emotional domain (Em), and BS-cognitive domain (Co)] at each time point. The edges were calculated by partial correlations. The GGM networks were regularized via the graphical lasso (GLASSO) algorithm (Friedman, Hastie, & Tibshirani, Reference Friedman, Hastie and Tibshirani2008) in combination with the extended Bayesian information criterion (EBIC) model to control for spurious correlations due to multiple testing. For the EBIC, a tuning hyperparameter (γ) was set to 0.5, which yields accurate network estimations (Boccaletti, Latora, Moreno, Chavez, & Hwang, Reference Boccaletti, Latora, Moreno, Chavez and Hwang2006; Van Borkulo et al., Reference Van Borkulo, Borsboom, Epskamp, Blanken, Boschloo, Schoevers and Waldorp2014), or 0.25. We used the R-packages ‘bootnet (estimateNetwork)’ and ‘qgraph’ to estimate and visualize all networks (Glück, Knefel, & Lueger-Schuster, Reference Glück, Knefel and Lueger-Schuster2017). The layout used when computing the networks was derived from the Fruchterman–Reingold algorithm, which computes the optimal layout so that nodes with stronger and/or more connections are placed closer to each other and more centrally (Fruchterman & Reingold, Reference Fruchterman and Reingold1991).
Network analysis
Global network metrics
Global network metrics consisting of network density, global strength, averaged clustering coefficient, modularity index (Q), and characteristic path length were calculated using the R packages ‘qgraph’ and ‘igraph.’ Network density was defined as the ratio of the number of edges to the number of all possible edges. Global strength was defined as the absolute sum of all edge weights in a given network (Opsahl, Agneessens, & Skvoretz, Reference Opsahl, Agneessens and Skvoretz2010). Higher values of network density and global strength indicate denser and stronger interconnections among the nodes constituting a network. The clustering coefficient, which quantifies the degree of clustering among neighboring nodes within a network, ranges from 0 (unconnected) to 1 (fully connected neighborhood). Accordingly, a higher clustering coefficient value suggests a more connected neighborhood around one particular node. The networks were divided into modules (also called communities); the strength of the network division into modules is termed modularity. Higher modularity of a network is an indication of dense connections within modules and sparse connections between nodes from different modules. The Q value was calculated as the difference between the edge strengths within the assigned communities of the original network. Modularity values >0.30 are considered a clear indication of communities (Newman & Girvan, Reference Newman and Girvan2004). The characteristic path length is the mean of the shortest path lengths between all pairs of nodes in the network. A longer characteristic path length suggests less efficient transmission of information within the network. Furthermore, given the differences in baseline severity between the remitters and non-remitters, the two groups were purposely matched in terms of the baseline PANSS total score and sample size. We calculated global connectivity measures and ran the Network Comparison Test (NCT) tool with these new samples.
Local network metrics
For the centrality index, only nodal strength was calculated using the R package ‘qgraph’ (Epskamp et al., Reference Epskamp, Costantini, Haslbeck, Cramer, Waldorp, Schmittmann and Borsboom2019) because betweenness and closeness centrality seemed unsuitable as measures of node importance for psychological networks (Bringmann et al., Reference Bringmann, Elmer, Epskamp, Krause, Schoch, Wichers and Snippe2018). Nodal strength is a measure of the sum of absolute edge weights (i.e. correlation magnitudes) attached to a node within a network. Higher nodal strength values indicate quicker and more direct influence on other nodes. Higher centrality index values are representative of greater importance within the network.
Network comparison
We investigated the network structures, global strength, and nodal strength among the networks using the NCT R package (Van Borkulo et al., Reference Van Borkulo, Boschloo, Kossakowski, Tio, Schoevers, Borsboom and Waldorp2017; van Borkulo, Epskamp, & Milner, Reference van Borkulo, Epskamp and Milner2016). The NCT is a permutation-based test that randomly regroups participants from each network repeatedly (1000 times) and then calculates the differences among networks (van Borkulo et al., Reference van Borkulo, Epskamp and Milner2016). When comparing the baseline network with the follow-up network, dependency between datasets is considered. The network structure invariance test explores differences in the structure of the network (i.e. deviation in absolute weighted sum scores of the connections) (Barrat, Barthelemy, Pastor-Satorras, & Vespignani, Reference Barrat, Barthelemy, Pastor-Satorras and Vespignani2004) as a whole. In situations where the network structure exhibited significant differences, we tested which specific edges differed significantly. For global network metrics [network density, averaged clustering coefficient, modularity index (Q), and characteristic path length], the ‘NetworkToolbox’ package (Christensen, Reference Christensen2018) was used to explore whether the overall level of network connectivity was equal across networks.
Network accuracy, stability, and significance testing
The accuracy and stability of the network were examined using the R package bootnet, version 1.4.2 (Epskamp et al., Reference Epskamp, Borsboom and Fried2018). First, we bootstrapped (1000 iterations) the 95% confidence intervals (CIs) around the edge weights to assess the accuracy of the edge weights. Smaller CIs indicate greater accuracy of edge weight values. Second, we used the case-dropping subset bootstrap (1000 iterations) to examine the stability of the order of the node centrality indices. The results indicate whether the order of the centrality indices remains the same when the network is re-estimated with fewer cases. If the correlation between the original order of centrality indices and the order of centrality indices after cases have been dropped remains high, the centrality indices are considered stable (Epskamp et al., Reference Epskamp, Borsboom and Fried2018). A correlation stability coefficient (CS-coefficient) has also been proposed as a measure for quantifying the stability of the node centrality indices. A recent simulation study showed that the CS-coefficient should be at least 0.25 and preferably above 0.5, for the centrality indices to be interpretable (Epskamp et al., Reference Epskamp, Borsboom and Fried2018). Finally, we tested for significant differences in edge weights and node centralities using the bootstrapped difference tests.
Results
Participants' demographic and clinical features
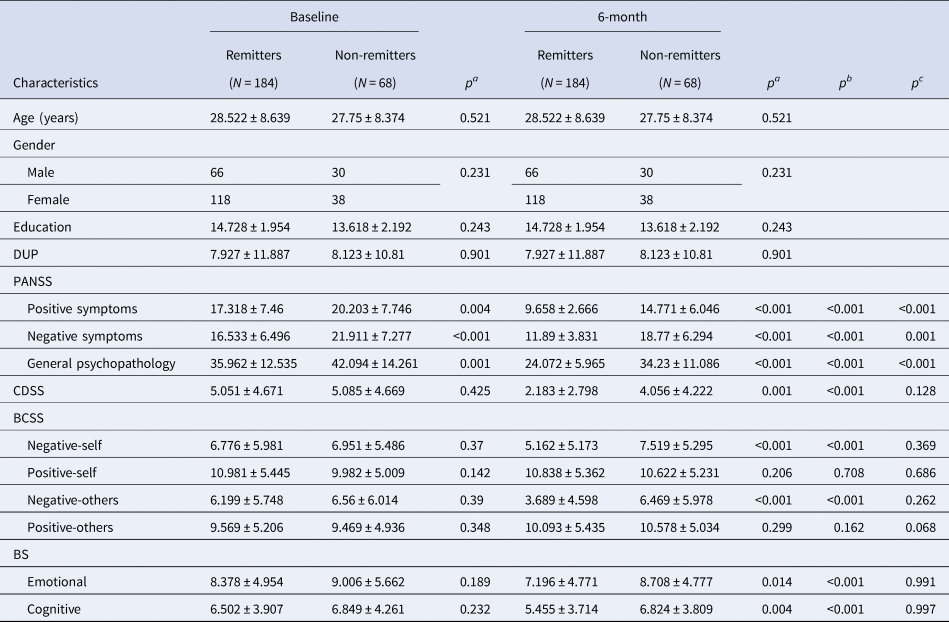
There were no significant differences between the R-B and NR-B groups for all variables except the PANSS scores, which were significantly higher for the non-remitters compared to the remitters. At 6 months, most of the scores were significantly lower for the remitters compared to the non-remitters, except for the positive-self and positive-other scores. When comparing remitters and non-remitters over time, most of the scores decreased significantly in the R-6 group, but only scores related to positive symptoms and general psychopathology were lower in the NR-6 group (Table 1).
Demographic and clinical characteristics of patients with remitters and non-remitters at baseline and 6-month follow-up
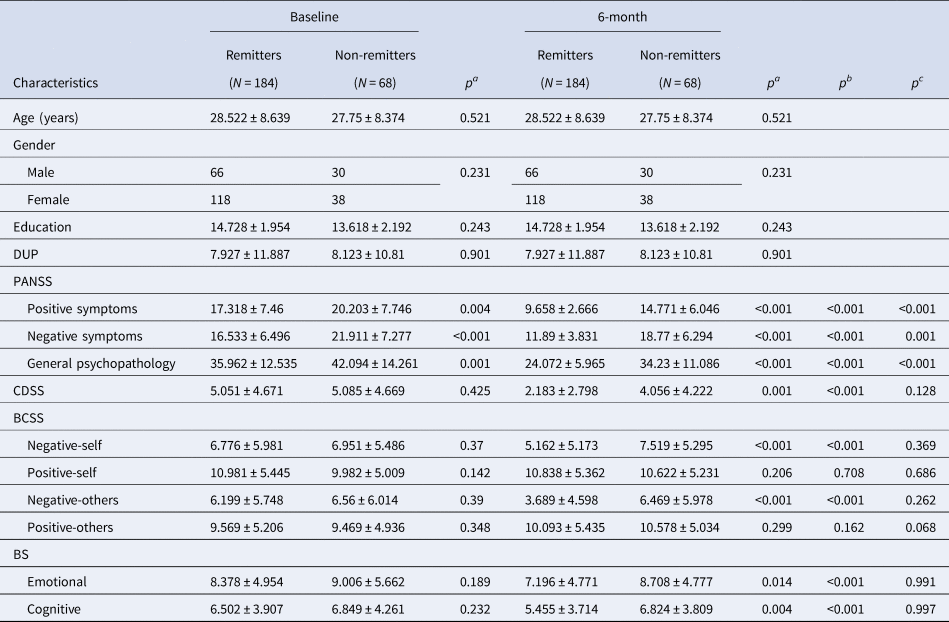
Data were expressed in mean ± s.d.; pa comparison between the remitters and non-remitters by Wilcoxon rank sum t test, except gender by χ2 test; pb comparison of the remitters at baseline and 6-month by Wilcoxon signed rank test, pc comparison of the non-remitters at baseline and 6-month by Wilcoxon signed rank test. Positive and Negative Syndrome Scale (PANSS), Calgary Depression Scale for Schizophrenia (CDSS), Brief Core Schema Scales (BCSS), Brooding Scale (BS), Duration of untreated psychosis (DUP).
Global network metrics
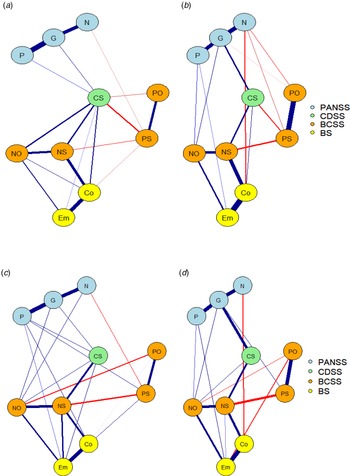
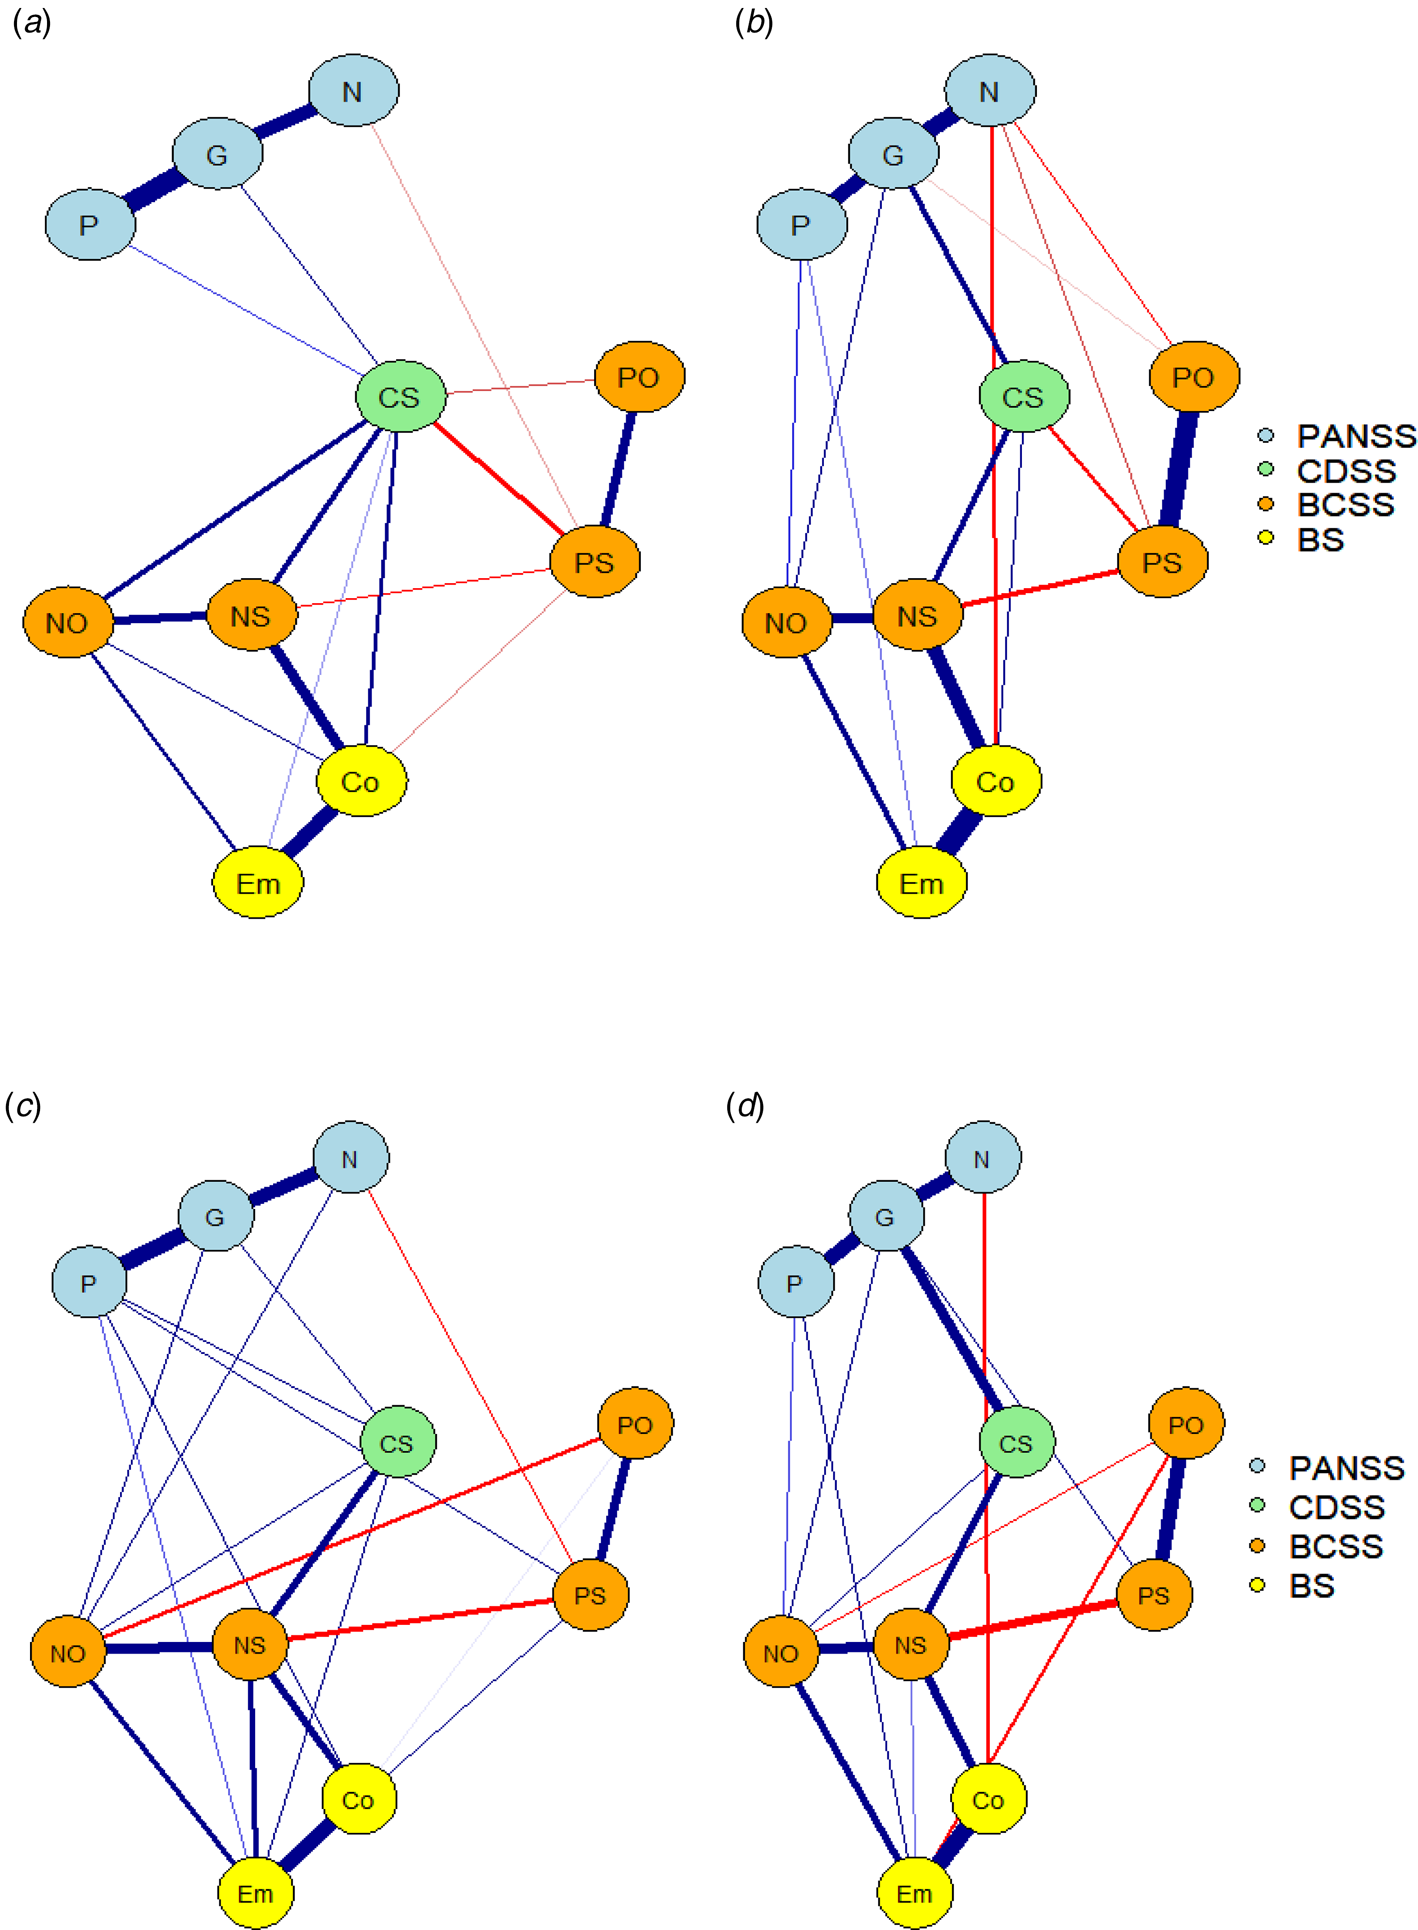
As there were no significant differences in the network metrics depending on the value of the tuning hyperparameter (γ), we describe the results with γ set to 0.5. The resulting network (Fig. 1) was well connected, with no isolated nodes. Comparisons between the R-B and NR-B groups and between the R-6 and NR-6 groups revealed no significant differences in all global network metrics (Table 2). However, using matched samples to control for baseline severity and sample size, significant differences in density were evident between the R-B and NR-B groups (p = 0.028) and between the R-B and R-6 groups (p = 0.005) (online Supplementary Table S1).
Estimated network structures of (a) remitters at baseline; (b) remitters at 6-month follow-up; (c) non-remitters at baseline; and (d) non-remitters at 6-month follow-up. Names of the nodes (‘P’, ‘N’, ‘G’, ‘CS’, ‘NS’, ‘PS’, ‘NO’, ‘PO’, ‘Em’, ‘Co’) were ‘Positive symptoms’, ‘Negative symptoms’, ‘General psychopathology’, ‘Depressive symptoms (in the CDSS)’, ‘Negative-self’, ‘Positive-self’, ‘Negative-others’, ‘Positive-other’, ‘Emotional domain’ and ‘Cognitive domain’ respectively.
Global connectivity of the networks in the remitters and non-remitters at baseline and 6-month

a is the results of permutation test (global strength from NCT and the others from NetworkToolbox).
Local network metrics
The top three positive edge weights for the R-B, NR-B, and NR-6 groups were the same, but ranked differently and comprised edges between items related to positive symptoms and general psychopathology in the PANSS, those between emotional and cognitive domains of the BS, and those between items related to negative symptoms and general psychopathology of the PANSS. However, for the R-6 group, the top three positive edge weights differed somewhat and included edges between the positive-self and positive-other responses on the BCSS, those between the emotional and cognitive domains of the BS, and those between items related to negative symptoms and general psychopathology in the PANSS (Fig. 1). The full list of all non-zero edges in the four groups can be found in online Tables S2–S5 of the Supplementary Materials.
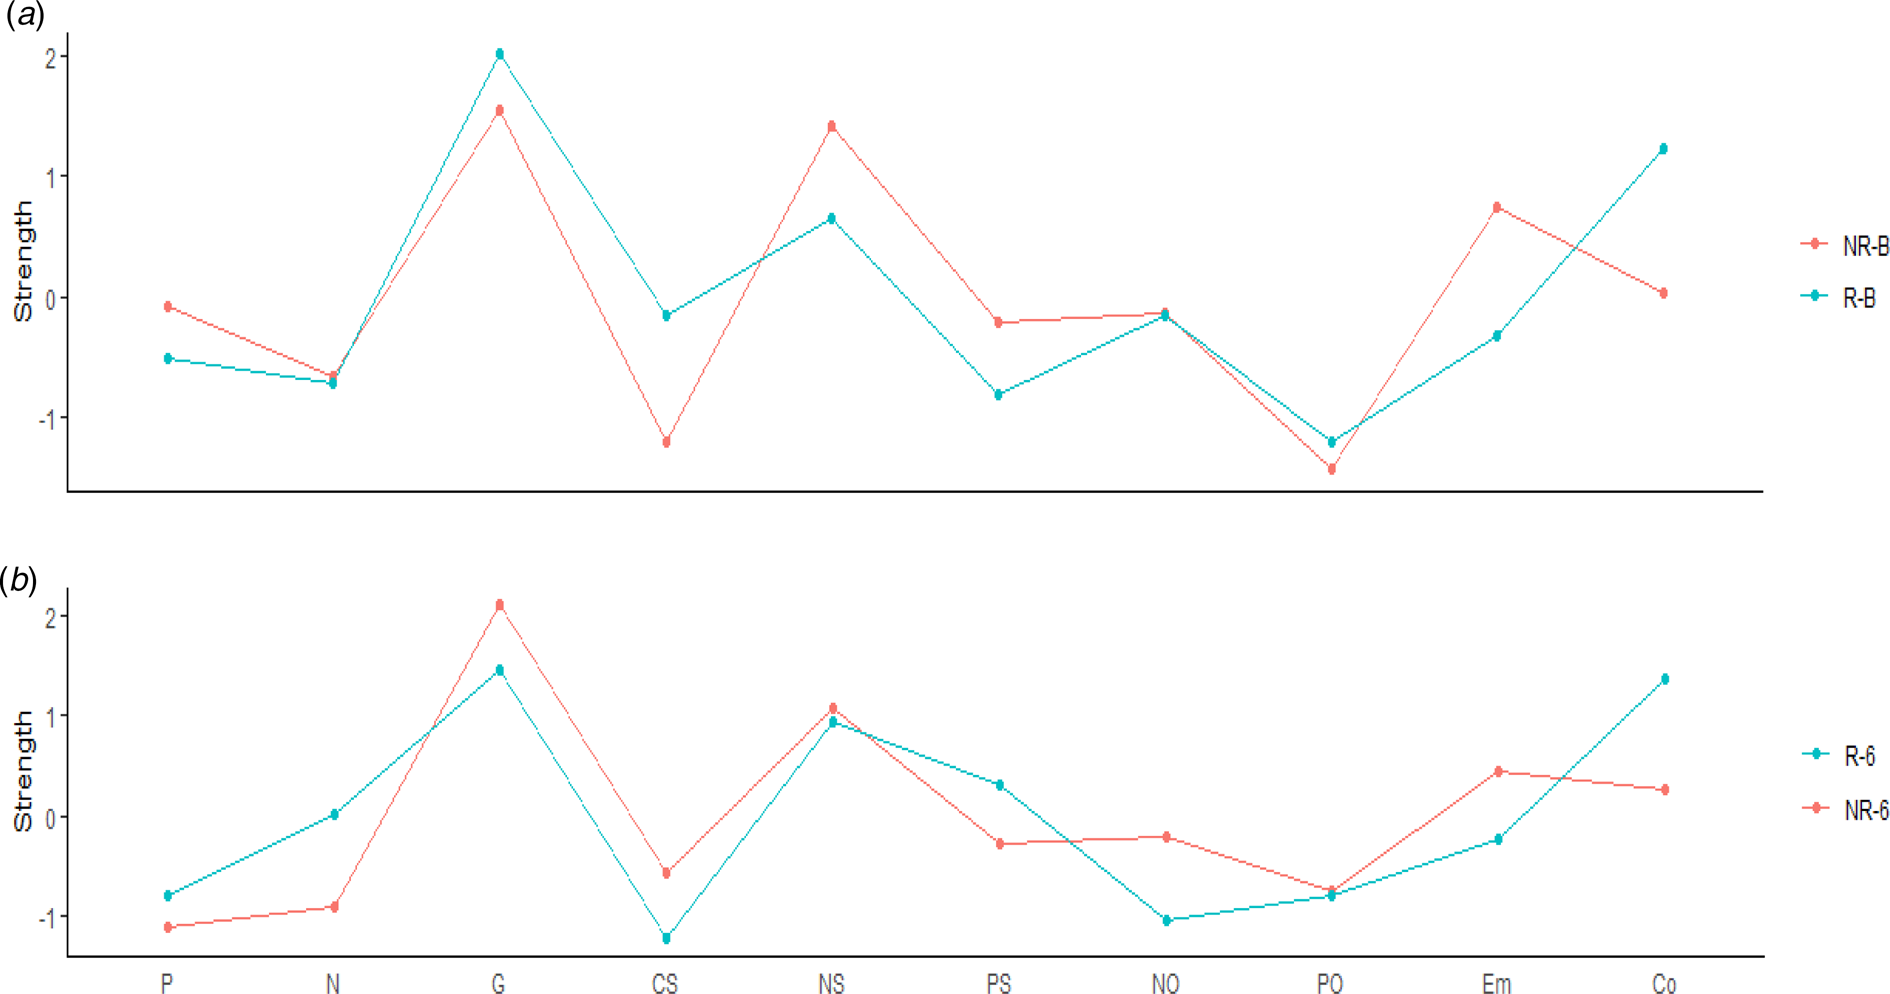
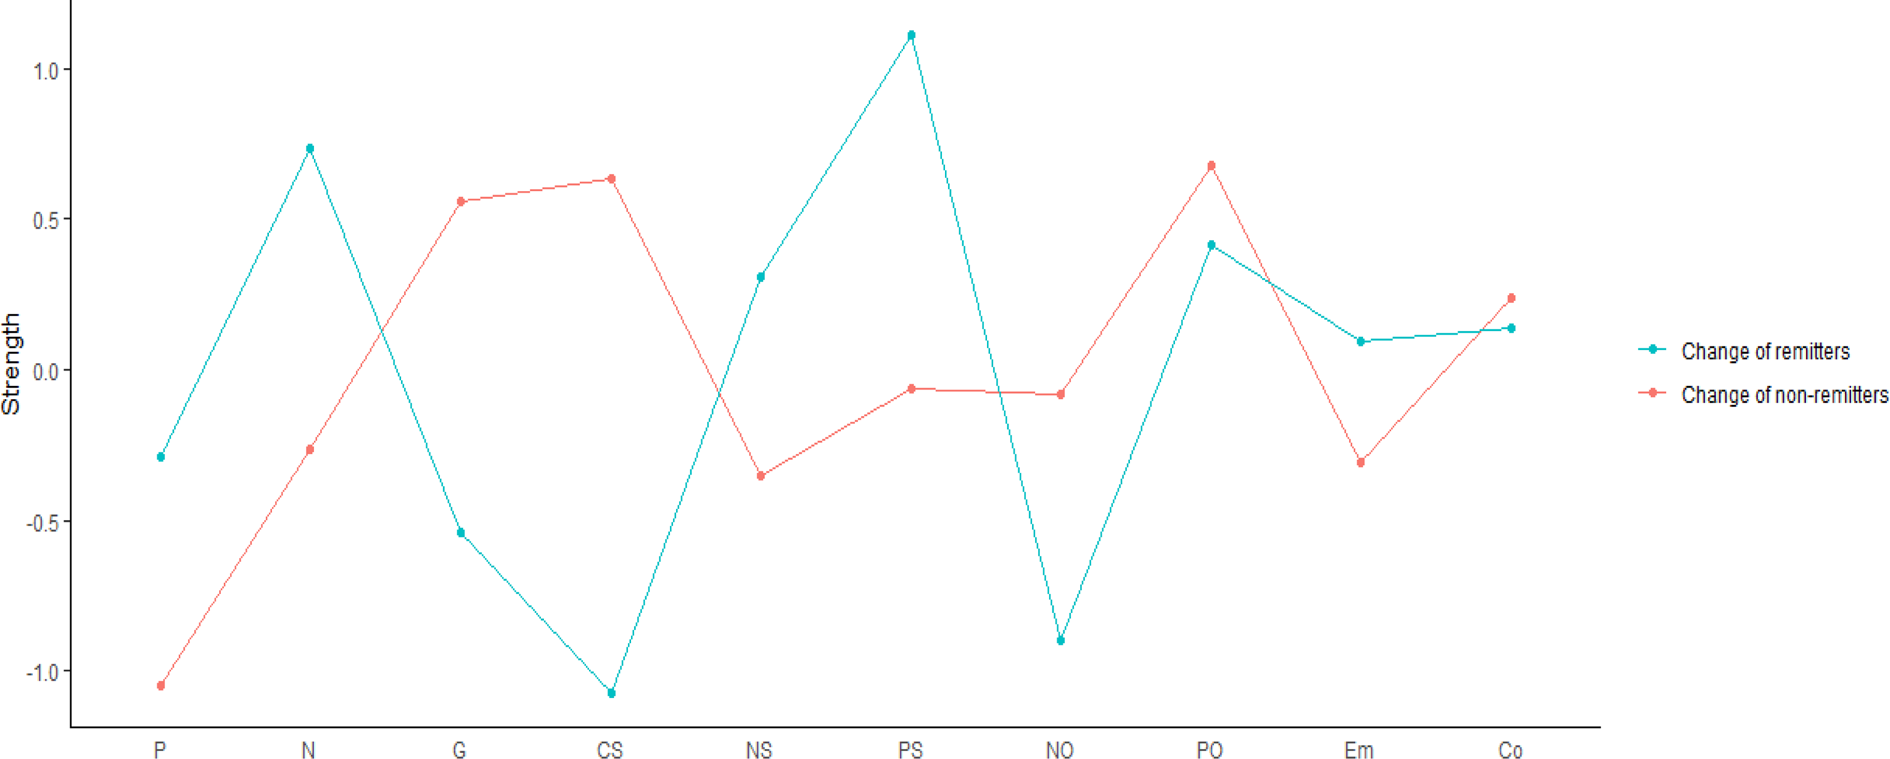
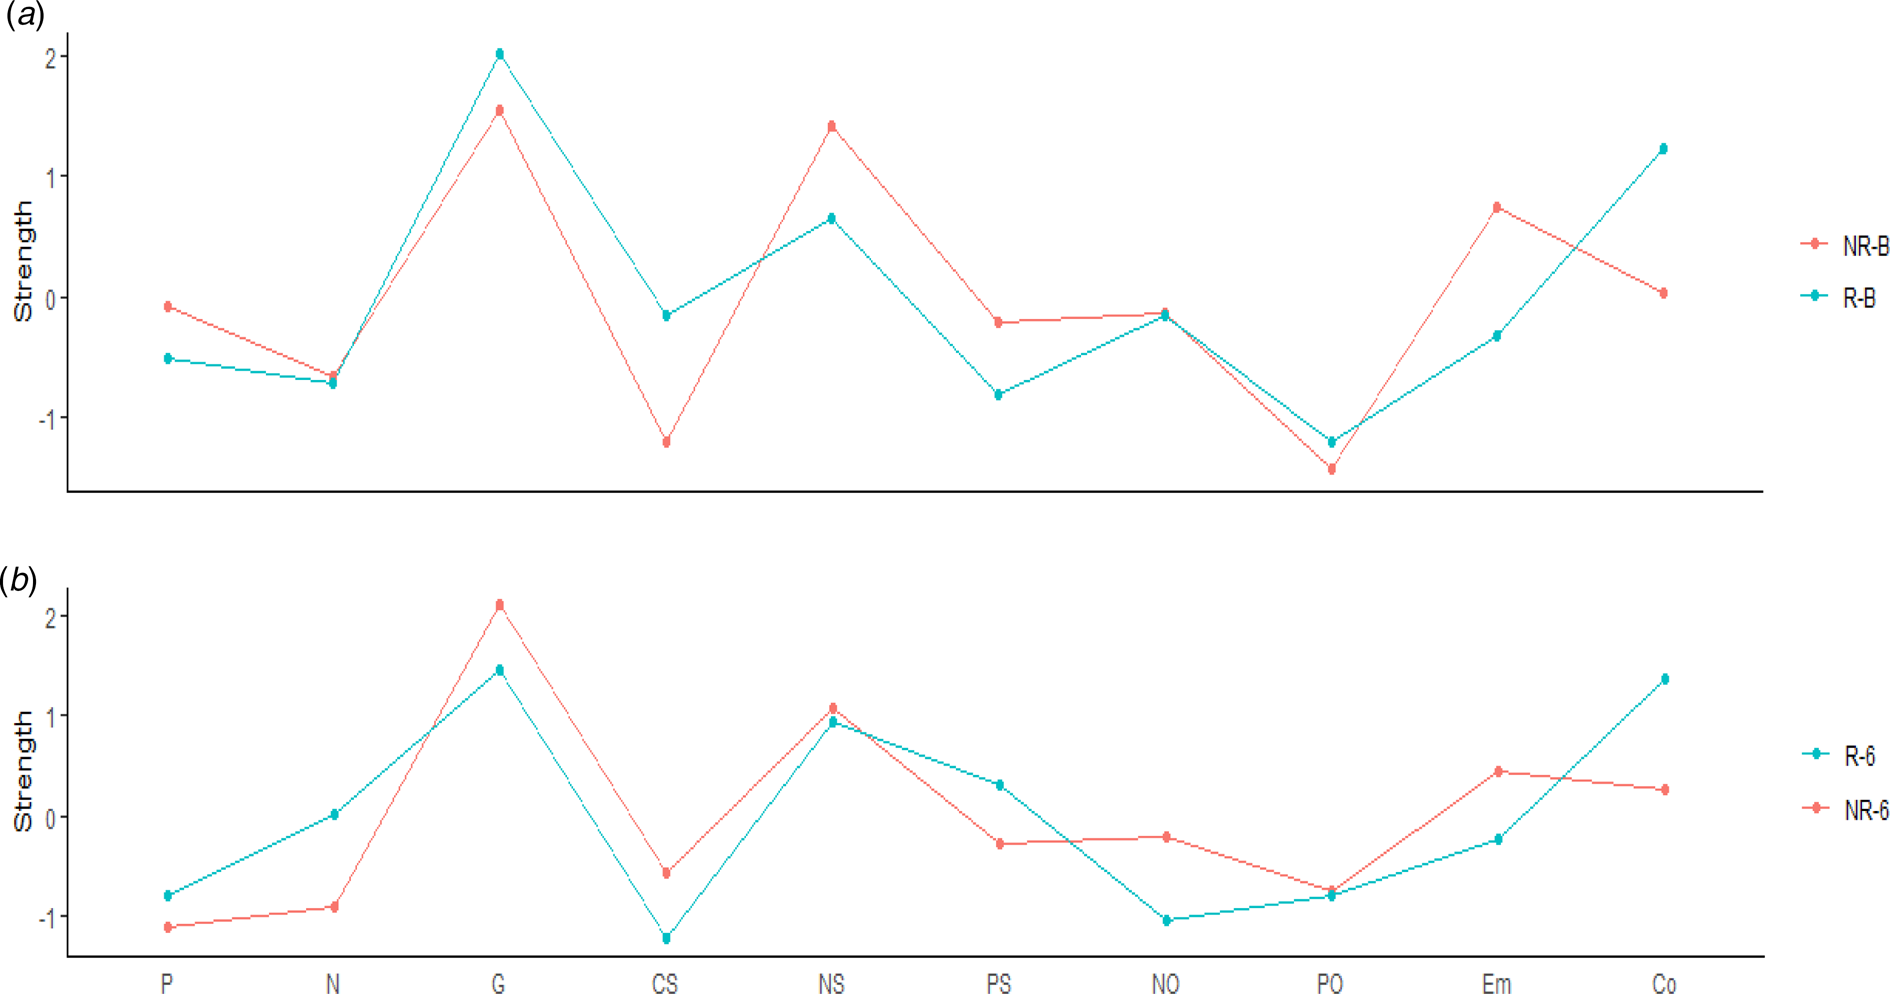
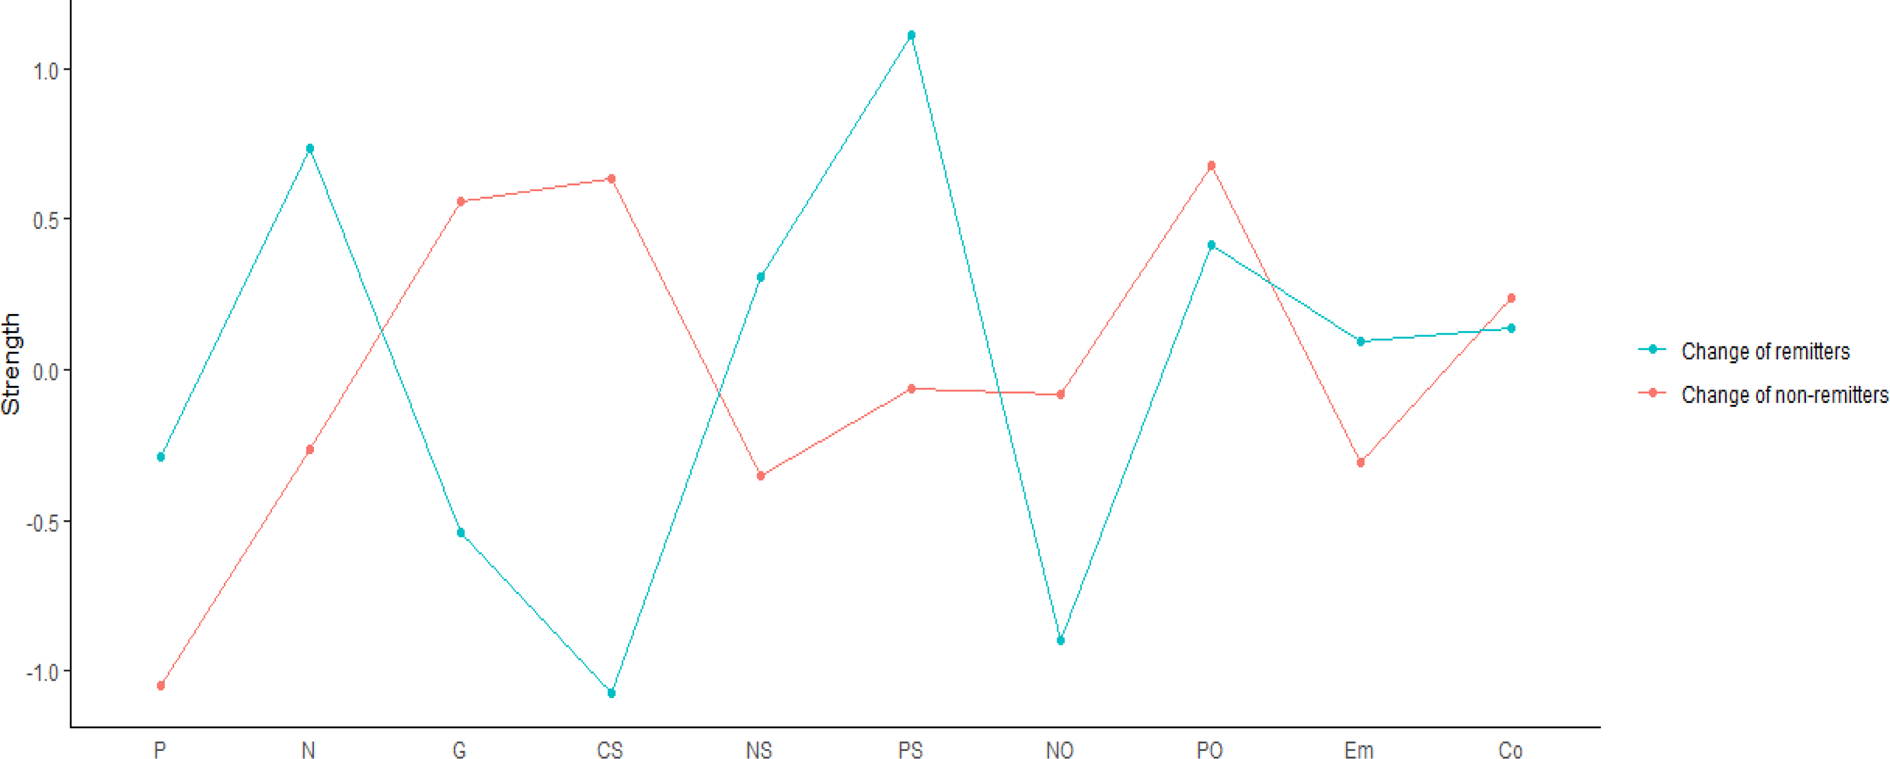
As for the centrality index, the symptom with the highest nodal strength for all four symptom networks was general psychopathology (Fig. 2). Changes in nodal strength were greatest for depressive and positive symptoms in the remitters and non-remitters, respectively (Fig. 3). The values of nodal strength in the four symptom networks and changes in nodal strength from baseline to 6 months are shown in online Supplementary Table S6.
Centrality index (nodal strength) for (a) the remitters and non-remitters at baseline (R-B and NR-B) and (b) the remitters and non-remitters at 6-month (R-6 and NR-6). Centrality index is shown as standardized z-scores. Names of the nodes (‘P’, ‘N’, ‘G’, ‘CS’, ‘NS’, ‘PS’, ‘NO’, ‘PO’, ‘Em’, ‘Co’) were ‘Positive symptoms’, ‘Negative symptoms’, ‘General psychopathology’, ‘Depressive symptoms (in the CDSS)’, ‘Negative-self’, ‘Positive-self’, ‘Negative-others’, ‘Positive-other’, ‘Emotional domain’ and ‘Cognitive domain’ respectively.
Changes of nodal strength from baseline to 6-month in (a) the remitters and (b) non-remitters. Centrality index is shown as standardized z-scores. Changes were obtained by subtracting nodal strength at baseline from those at 6-month. Names of the nodes (‘P’, ‘N’, ‘G’, ‘CS’, ‘NS’, ‘PS’, ‘NO’, ‘PO’, ‘Em’, ‘Co’) were ‘Positive symptoms’, ‘Negative symptoms’, ‘General psychopathology’, ‘Depressive symptoms (in the CDSS)’, ‘Negative-self’, ‘Positive-self’, ‘Negative-others’, ‘Positive-other’, ‘Emotional domain’ and ‘Cognitive domain’ respectively.
NCT
The NCT analysis revealed a significant difference in network structure (p = 0.016) between the R-B and R-6 groups. As a follow-up to this omnibus test, we investigated which particular edges differed across the two networks. The edge weights between positive symptoms and general psychopathology or depressive symptoms, between depressive symptoms and negative others, and between positive self and positive others were significantly different between the R-B and R-6 groups (results not shown). The results for global network metrics are described in the ‘Global network metrics’ section. The nodal strength for positive-self and positive-others scores were significantly different between the R-B and R-6 groups (Table 3).
Comparison of nodal strength between the remitters and/or non-remitters

Results of permutation test are presented in p value; R-B, remitters at baseline; R-6, remitters at 6-month; NR-B, non-remitters at baseline; NR-6, non-remitters at 6-month.
Names of the nodes (‘P’, ‘N’, ‘G’, ‘CS’, ‘NS’, ‘PS’, ‘NO’, ‘PO’, ‘Em’, ‘Co’) were ‘Positive symptoms’, ‘Negative symptoms’, ‘General psychopathology’, ‘Depressive symptoms (in the CDSS)’, ‘Negative-self’, ‘Positive-self’, ‘Negative-others’, ‘Positive-other’, ‘Emotional domain’ and ‘Cognitive domain’ respectively.
Network accuracy, stability, and significance testing
The results of the edge weight bootstrap analysis (online Supplementary Fig. S1) showed a substantial overlap among the 95% CIs of the edge weights. However, some of the strongest edges showed non-overlapping CI values. The CS coefficients for node strength were ⩾0.25 in all four groups, whereas the CS coefficient for closeness was 0.279 only for the NR-6 group (Table 4). The results of bootstrapped difference tests between edge weights and node centralities are presented in online Supplementary Figs S2–S4.
Correlation stability coefficient of centrality indices in the remitters and non-remitters

Discussion
Network analysis may provide new perspectives on intervention strategies by investigating how network structures differ and which symptoms are more strongly connected or more central than others to remission of FEP. In the present study, after four network structures were estimated, analyses of network properties and network comparison were performed. The main findings were that the strengths of certain nodes changed significantly over time only for the remitters and unique but different central symptoms were found for the remitters and non-remitters.
Global network metrics revealed no differences between the R-B and NR-B groups and between the R-6 and NR-6 groups. These findings are in contrast to those of a previous study, which reported that treatment-responsive patients with schizophrenia exhibited more densely connected symptom networks after antipsychotic treatment than at baseline (Esfahlani et al., Reference Esfahlani, Sayama, Visser and Strauss2017). Similarly, in major depressive disorder, persisters exhibited a more densely connected network at baseline than remitters (van Borkulo et al., Reference van Borkulo, Boschloo, Borsboom, Penninx, Waldorp and Schoevers2015). It should be noted that permutation tests to confirm statistical significance were not performed in these studies. Our results showed no unique characteristics differentiating the four networks, at least in terms of global network metrics. However, after controlling for baseline PANSS severity and sample size, the density of the R-B group was significantly higher than those of the NR-B and R-6 groups, suggesting that higher PANSS scores among the original non-remitters had offset the difference in density between the two matched networks. Nonetheless, it should be noted that the CS coefficient for nodal strength was low for the R-B (0.132) and R-6 (0.279) groups.
In general, positive edge weights ranged from 0.3 to 0.6, whereas negative edge weights were <0.2 across the four networks. The unique positive edge weight differentiating the R-6 group from the rest of the networks was between positive-self and positive-others scores, whereas the unique negative edge weight differentiating the R-B group from the rest of the networks was between positive-self score and depressive symptoms. The central symptom with the highest nodal strength was general psychopathology for all four networks. However, the second highest nodal strength was observed for the cognitive domain of the BS and the negative-self score for remitters (R-B and R-6) and non-remitters (NR-B and NR-6), respectively (online Supplementary Table S6). This suggests that the unique central symptoms were cognitive brooding and negative-self for remitters and non-remitters, respectively. More specifically, if we compare the overall profiles of nodal strength in the R-B and NR-B groups, the results show that the nodal strengths associated with negative-self score and cognitive brooding were modest and strong, respectively, for the R-B group, whereas the strengths of the same nodes for the NR-B group exhibited the opposite pattern. Especially, the greater strength associated with negative-self score in the NR-B group deserves attention, given that negative cognition is involved in the maintenance of paranoia (Fowler et al., Reference Fowler, Hodgekins, Garety, Freeman, Kuipers, Dunn and Bebbington2012) and that internalized stigma affects hope and self-esteem, leading to negative outcomes related to recovery (Yanos, Roe, Markus, & Lysaker, Reference Yanos, Roe, Markus and Lysaker2008). Regarding the differential profiles of nodal strength between the R-6 and NR-6 groups, in the R-6, cognitive brooding, the node with the second-highest strength, had no connections with positive and negative symptoms and general psychopathology, whereas it exhibited moderate positive correlations with the negative-self score and emotional brooding (online Supplementary Table S4). Given that the score of the cognitive domain of the BS in the R-6 group decreased significantly over time (Table 1), lower levels of cognitive brooding may be associated with lower levels of negative-self and emotional brooding, which, in turn, affect positive and negative symptoms and general psychopathology, potentially resulting in remission. In the NR-6 group, negative-self score, a node with the second-highest strength, also had no connections with positive and negative symptoms and general psychopathology but showed modest correlations with positive-self and negative-others scores (online Supplementary Table S5). Considering the higher negative-self score in the NR-6 group (though not significantly so) (Table 1), it may be that increased negative-self is associated with lower positive-self and greater negative-others, which may hinder remission. Taken together, our findings suggest that the strength of the negative-self node at baseline or 6 months can serve as a predictive marker for remission (at baseline) and as a state marker of non-remission (at 6 months). In this respect, negative-self should be a crucial target of therapeutic interventions to achieve remission.
Considering the changes in values of nodal strength (online Supplementary Table S6), different patterns emerged in the remitters and non-remitters. However, with the NCT, significant differences between the R-B and R-6 groups were only noted in the positive-self and positive-others scores. Specifically, the strengths of these two nodes increased from baseline to the 6-month follow-up. Therefore, large changes in the strength of the positive-self and positive-others nodes can serve as network markers explaining remission. Given that there were no significant results in comparisons of nodal strength between networks, other than between the R-B and R-6 groups, it seems that the network structure of remitters changes over time, suggesting some degree of flexibility. Alternatively, it may be that differences in connection strength over time in the remitters are due to differences in symptom severity or variations in symptoms (Bos & De Jonge, Reference Bos and De Jonge2014; Terluin, de Boer, & de Vet, Reference Terluin, de Boer and de Vet2016). The former is unlikely, given that symptom severity was rather mild in the remitters compared to the non-remitters. As for the latter, given that most of our symptom variables exhibited skewed distributions, this issue should be considered when designing future studies. The results of the associated case-dropping subset bootstrap indicate that node strength was the most stable centrality index in the current sample. Similarly, CS coefficients for strength were within the acceptable range, whereas CS coefficients for closeness and betweenness centralities were generally low, ranging from 0.049 to 0.279, indicating that the rank ordering of closeness and betweenness should also be interpreted with a degree of care.
Several limitations of the current study should be mentioned. First, results of the accuracy and stability checks indicated that the network generated here should be interpreted with caution due to the overlapping CIs. As a result, further studies with larger datasets are needed to replicate our findings. Second, for network estimation, we did not incorporate important clinical variables that affect remission such as the age of onset, premorbid or current socio-occupational functioning, and medication compliance. Anxiety symptomology has also been shown to be important when modeling psychosis from a network perspective. Incorporation of these clinical variables in future networks will be necessary to fully map and illustrate the interplay among the many symptoms affecting remission. Third, we cannot rule out any bias due to the proportion of subjects whose missing data were imputed. Because imputation strategies are presumed to rely on associations among symptoms, they may be considered inappropriate for network analysis. Despite these caveats, the current article is, to our knowledge, one of the first to examine and compare the network structures of patients with FEP at baseline and 6-month follow-up in a naturalistic prospective design.
In conclusion, our findings indicate that the network structure of remitters changed over time. The unique central symptoms were cognitive brooding and negative-self for remitters and non-remitters, respectively. Especially, negative-self may be an important target for therapeutic intervention. These findings on symptom levels may be informative for generating hypotheses regarding the development of psychopathology and implementation of treatment strategies in patients with FEP.
Supplementary material
The supplementary material for this article can be found at https://doi.org/10.1017/S0033291720005280
Acknowledgements
The corresponding author would like to thank all participants in the study, as well as his father for his kind heart and guidance. The authors report no biomedical financial interests or potential conflicts of interest. This study was supported by a grant from the Korean Mental Health Technology R&D Project, Ministry of Health & Welfare, Republic of Korea (HL19C0015) and a grant of the Korea Health Technology R&D Project through the Korea Health Industry Development Institute (KHIDI), funded by the Ministry of Health & Welfare, Republic of Korea (HI18C2383).
Conflict of interest
None.