Introduction
A major negative consequence of feeding high-concentrate diets to high-producing ruminants is the occurrence of subacute ruminal acidosis. Acidosis is usually defined as a decrease in rumen pH below a threshold value of 6.0, but its severity is related to the frequency and duration of alterations in rumen pH. Acute acidosis is defined by long bouts of rumen pH below 5.0 and subacute acidosis by mean rumen pH below 6.0 and short bouts of rumen pH between 5.5 and 5.0 (Nocek, Reference Nocek1997; Oetzel, 2000). For Sauvant et al. (Reference Sauvant, Meschy and Mertens1999), a mean rumen pH of 6.25 corresponds to around 4 h spent below 6.0 and could thus be used as a threshold to define the occurrence of subacute acidosis. Subacute ruminal acidosis is one of the major concerns of current ruminant nutrition because it is poorly detected in herds and it has many consequences, such as decreased milk production, decreased efficiency of milk production, premature culling and increased mortality (Krause and Oetzel, Reference Krause and Oetzel2005). Subacute acidosis is frequently studied from digestive or metabolic points of view (Braun et al., Reference Braun, Rihs and Schefer1992; Martin et al., Reference Martin, Brossard and Doreau2006; Peyraud and Apper-Bossard, Reference Peyraud and Apper-Bossard2006) but behavioural aspects are very seldom taken into account. On a daily basis, goats adapt their feeding behaviour depending on the composition of the diet offered, especially in terms of the number of meals and meal layout during the day, as shown by Abijaoudé et al. (Reference Abijaoudé, Morand-Fehr, Tessier, Schmidely and Sauvant2000a and Reference Abijaoudé, Morand-Fehr, Tessier, Schmidely and Sauvant2000b). Thus, goats might adapt their daily time-budget according to the percentage of concentrate in the diet.
The aim of this study was to determine adaptations in goat behaviour due to high-concentrate diets, by comparing, in the same animals, feed intake, milk production, rumen pH and time-budget with two diets differing in their concentrate percentage.
Material and methods
Diets, animals and experimental design
Eight fistulated dairy goats (Saanen and Alpine) in mid-lactation (79 ± 5.6 days in milk), averaging 60 ± 4.9 kg body weight (BW) and producing 3.1 ± 0.60 kg milk per day at the start of the experiment, were used. The experiment was conducted under the guidelines given by the French Agriculture Ministry. Animals were assigned to two groups, which were balanced according to goat parturition date, BW, milk production the previous year and breed. They were housed in 2 m × 1 m individual pens throughout the experimental period, with free access to water.
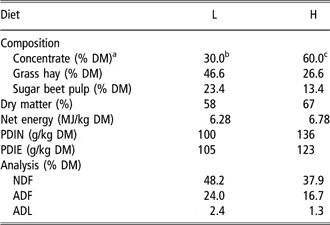
Diet composition is described in Table 1. Energy and nitrogen values of the feed and the diet were calculated according to the additive method from the INRA tables (Baumont et al., Reference Baumont, Dulphy, Sauvant, Tran, Meschy, Aufrère, Peyraud and Champciaux2007). Goats were given two total mixed rations: high-concentrate diet (H) containing 60% concentrate and low-concentrate diet (L) containing 30% concentrate. Diets were offered in a cross-over design of two 4-week periods separated by 3 days of transition diet. The concentrate part of the diets was composed of wheat (20%), barley (20%), oats (20%), soyabean meal (35%) and a vitamin and mineral mixture. Forage was a mixture of two-thirds chopped grass hay and one-third ensiled sugar beet pulp on a dry matter basis. Goats were fed ad libitum and quantities offered were adjusted weekly to ensure 10% refusals. Feed was offered individually twice a day after milking, in the proportion of two-thirds in the afternoon and one-third in the morning, according to the time interval between milkings.
Composition and analysis of two experimental diets containing either a low (L) or a high (H) percentage of concentrate

DM=dry matter.
a20% wheat, 20% barley, 20% oats, 35% soyabean meal, 3% mineral and vitamin premix and 2% molasses.
bComposition of the mineral and vitamin premix (per kg of premix): 702 g CaCO3, 119 g dicalcium phosphate, 88 g NaCl, 21.21 g ZnSO4, 7H2O, 1.04 g/kg MnSo4, H2O, 0.02 g CoSo4, 0.05 g KI, 0.02 g Na2SeO3, 400 000 IU Vitamin A, 100 000 IU Vitamin D, 2000 IU Vitamin E, 63.33 g corn starch.
cComposition of the mineral and vitamin premix (per kg of premix): 702 g CaCO3, 88 g/kg NaCl, 6.82 g ZnSO4, 7H2O, 1.04 g MnSo4, H2O, 0.01 g CoSo4, 0.03 g KI, 0.01 g Na2SeO3, 200 000 IU Vitamin A, 50 000 IU Vitamin D, 1000 IU Vitamin E, 199.72 g corn starch.
Experimental measurements
Experimental measurements were performed during all the weeks of the cross-over design. Animals were weighed weekly. Offered feed and refusals were individually weighed daily, which allowed the assessment of dry matter intake (DMI) using the theoretical dry matter percentage of the diet. Daily DMI per kg of BW was calculated using the BW of the previous week. Day-to-day variability in DMI (cvDMI) was assessed using the coefficient of variation calculated as the absolute value of the difference in DMI between two successive days divided by the mean value of these 2 days. Raw milk yield (RMY) was recorded daily and milk composition was analysed once a week on milk from two consecutive milkings. Fat-corrected milk (35 g/kg basis) (FCM) was calculated according to the formula of Sauvant et al. (Reference Sauvant, Giger-Reverdin and Meschy2007), and day-to-day variability in milk yield (cvRMY) was assessed using the coefficient of variation calculated as the absolute value of the difference in RMY between two successive days divided by the mean value of these 2 days. Energy and nitrogen balances were calculated according to the formula published by Sauvant et al. (Reference Sauvant, Giger-Reverdin and Meschy2007).
Rumen pH was continuously monitored by indwelling pH probes. Goats were accustomed, for 1 week before the start of the experiment, to wear a coat covering their back and maintained by individually adjusted elastic straps. Rumen pH was measured every minute by a self-cleaning pH probe (accuracy = 0.01 pH; Fisher Bioblock Scientific, France) placed in the rumen through the ruminal cannulae and linked to a portable device (Easy Log EL-2; Omega Engineering Inc.) (Brossard et al., 2003) placed in one of the coat pockets. A 300 g weight was attached to each probe to reduce its mobility in the rumen. Mean daily pH and percentage of time when the pH was below 6.0 were calculated.
Time-budget of the goats was analysed using four video cameras recording two goats at a time. They were fitted to the ceiling above the individual pens and linked to a quad splitter allowing cyclic sequences to be recorded with a time-lapse video recorder. Nycthemeral activity of the goats was recorded during the last two weekends of each period. Twenty-four hours, from the end of the afternoon milking to the start of the next afternoon milking, were analysed during each of these weekends by scan sampling of 5 s every 2 min using The Observer software (version 5.0, 2004; Noldus Information Technology, Wageningen, The Netherlands). The calculated variables were total time spent standing, lying, ruminating, eating and idling, latency for rumination after feeding and mean duration of bouts for all these behaviours. The variables were analysed throughout the day and by 2-h intervals (12 intervals). Posture and activities were recorded independently.
Statistical analyses
Data were analysed using a repeated measures analysis of variance (ANOVA) and statistical analyses were carried out by the mixed-model procedure of SAS (version 9.1, 2002; SAS Institute Inc., Cary, NC, USA), using the following model:

where αi is the random effect of the goat; βt, γj and δk are, respectively, the fixed effect of time (day or week number according to the parameter), diet (H or L) and experimental period, (γδ)jk is the interaction between diet and experimental period and eijkt is the residual error.
Milk production analysis used DMI as a covariable in the model.
Nycthemeral kinetics of rumen pH were analysed using a repeated measures ANOVA using the following model:

where αi is the random effect of the time after feeding (4-min intervals), βt is the fixed effect of the diet (H or L) and (αβ)ij is the interaction between diet and time after feeding.
When assumptions of homogeneity of variance and normal distribution of the residuals were not confirmed (cvDMI and cvRMY), a square root transformation was performed before carrying out the analysis. All data are presented as least square means (lsmean) ± standard errors (s.e.) except when otherwise stated.
Results
One of the four goats that started with H suffered from an acute bout of acidosis during the first experimental period. Its milk production decreased abruptly and did not increase thereafter, even while receiving the L diet. This goat was removed from all the calculations.
Body weight, intake and milk production
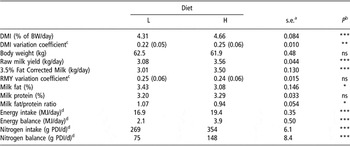
BW, intake and milk production results are presented in Table 2. BW was not influenced by the diet. Increasing the percentage of concentrate in the diet increased DMI, RMY, FCM and cvDMI. cvRMY was not influenced by the concentrate percentage. Milk protein percentage was not influenced by the diet but fat percentage decreased when the percentage of concentrate increased in the diet. Fat-to-protein ratio was lower for H than for L and inverted between the two diets. Energy and nitrogen balances were positive for the two diets but were almost doubled for H compared to L.
Effect of feeding a low- (L: 30%) or high- (H: 60%) concentrate diet in a cross-over design on intake and production parameters

DMI = dry matter intake; RMY = ram milk yield.
aStandard error of the difference of least square mean.
b†: 0.05 ⩽ P < 0.10, ns: P ⩾ 0.10.
cSquare root transformed data with backtransformed data in brackets.
dCalculated from the INRA Tables (Baumont et al., Reference Baumont, Dulphy, Sauvant, Tran, Meschy, Aufrère, Peyraud and Champciaux2007).
Rumen pH and acidosis
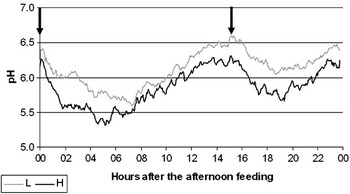
Mean daily pH was lower for H than for L (6.09 ± 0.071 v. 6.25 ± 0.072, respectively; P = 0.003). The percentage of time when the pH was below 6.0 increased with the concentrate percentage (23.4 ± 6.60% v. 39.9 ± 5.88% for L and H, respectively; P = 0.002).
Figure 1 represents the nycthemeral kinetics of rumen pH. The interaction between diet and time after feeding, when analysed by 4-min intervals, was not significant. This indicates that the pattern of averaged diurnal rumen pH was similar between treatments and the curve for H was below that of the curve for L by 0.23 pH units (P < 0.001).
Nycthemeral kinetics of rumen pH in seven mid-lactation dairy goats offered a low- (L: 30%) or high- (H: 60%) concentrate diet (arrows represent feeding).

Nycthemeral activity
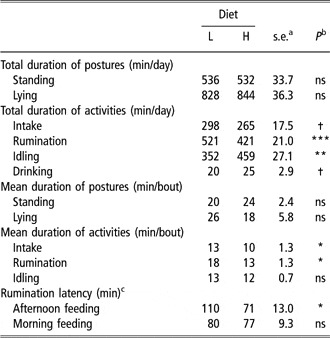
Daily total durations and behavioural bout mean durations are presented in Table 3. Increasing the percentage of concentrate in the diet tended to decrease the total duration of intake and decreased the mean duration of intake bouts. The total time spent drinking tended to increase with H compared to L. The total time spent idling was longer when goats received H than when they received L but the mean duration of idling bouts was not influenced by the diet. Increasing the percentage of concentrate in the diet decreased total time spent ruminating and mean duration of rumination bouts. The total time spent lying or standing and the mean duration of lying and standing bouts were not influenced by the diet. Latency before the start of the first rumination bout was shorter when the animals were offered H than when they were offered L after the afternoon, but not after the morning feeding (Table 3).
Behavioural parameters over 24 h in dairy goats offered a low- (L: 30%) or high- (H: 60%) concentrate diet

aStandard error of the difference of least square mean.
b†: 0.05 ⩽ P < 0.10; ns: P ⩾ 0.10.
cLatency of the first rumination bout after feeding.
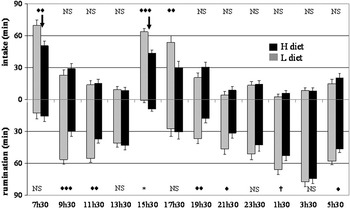
The time spent eating and ruminating during each of the 12 intervals is presented in Figure 2. Goats spent less time eating with H than with L only during the two intervals including feeding (0730 to 0930 h and 1530 to 1730 h) and during the first interval after the afternoon feeding (1730 to 1930 h). No differences were observed during the remaining intervals. When offered H, goats spent less time ruminating after the morning feeding (0930 to 1330 h), during the evening (1930 to 2330 h) and during the early morning (0530 to 0730 h), but spent more time ruminating during the interval including the afternoon feeding (1530 to 1730 h). No differences were observed during the remaining intervals.
Nycthemeral kinetics of eating and ruminating in mid-lactation dairy goats offered a low- (L: 30%) or high- (H: 60%) concentrate diet. Interval starting times are indicated below. Arrows represent feeding. †: 0.05 ⩽ P < 0.10; NS: P ⩾ 0.10.

The time spent drinking and idling during each of the 12 intervals is not presented as a figure. The time spent drinking was higher with H than with L during two intervals (1930 to 2130 h; 166 ± 43.7 v. 43 ± 44.3 s for H and L, respectively; P = 0.04 and 0130 to 0330 h; 28 ± 7.7 v. 0 ± 7.7 s for H and L, respectively; P = 0.019). No differences were found during all the other intervals.
The time spent idling tended to be increased by H compared to L during the first three intervals (0730 to 1330 h; 7 ± 3.0 v. 2 ± 3.1 min; P = 0.097; 37 ± 6.8 v. 22 ± 7.0 min; P = 0.076 and 51 ± 7.6 v. 39 ± 8.0 min, P = 0.095, for H and L, respectively), and was increased during the afternoon feeding and the following interval (1530 to 1930 h; 15 ± 3.1 v. 2 ± 3.1 min, P = 0.01 and 42 ± 7.5 v. 20 ± 7.9 min, P = 0.01, for H and L, respectively). No differences were found during the remaining intervals.
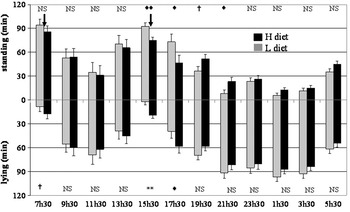
Figure 3 shows for each interval the time spent standing and lying. During the interval including the afternoon feeding (1530 to 1730 h) increasing the percentage of concentrate in the diet tended to decrease the time spent standing. During the next interval (1730 to 1930 h) goats spent less time standing and more time lying when offered H than when offered L, while the opposite was observed for the next two intervals (1930 to 2330 h). No differences were found during the other intervals.
Nycthemeral kinetics of standing and lying in mid-lactation dairy goats offered a low- (L: 30%) or high- (H: 60%) concentrate diet. Interval starting times are indicated below. Arrows represent feeding. †: 0.05 ⩽ P < 0.10; NS: P ⩾ 0.10.

Discussion
Feeding a high-concentrate diet increased DMI, which agrees with the low rumen fill effect of concentrate compared to roughage (Jarrige et al., Reference Jarrige, Dulphy, Faverdin, Baumont and Demarquilly1995). Feeding a high-concentrate diet also increased milk production, which agrees with other experiments performed in goats (Kawas et al., Reference Kawas, Lopes, Danelon and Lu1991) and cows (Manson and Leaver, Reference Manson and Leaver1988). This is also in accordance with the higher nitrogen and energy content of the H diet and the two-fold increases in nitrogen and energy balance in H compared to L. Changes in milk composition were in accordance with data from Kawas et al. (Reference Kawas, Lopes, Danelon and Lu1991) in goats, Manson and Leaver (Reference Manson and Leaver1988) in cows and Susin et al. (Reference Susin, Loerch and McClure1995) in ewes although another experiment did not show any changes in milk composition or DMI when high-concentrate diets based on barley silage were offered to dairy cows (Maekawa et al., Reference Maekawa, Beauchemin and Christensen2002).
Goats did not exhibit any clear symptoms of acidosis. Although the higher variability in day to day DMI observed with H could be a sign of subacute acidosis (Nocek, Reference Nocek1997; Owens et al., Reference Owens, Secrist, Hill and Gill1998; Martin et al., Reference Martin, Brossard and Doreau2006), DMI was increased for H compared to L, which is not in accordance with the literature, showing a decrease in DMI with acute acidosis (Owens et al., Reference Owens, Secrist, Hill and Gill1998; Oetzel, 2000). The difference in the percentage of time spent with a pH below 6.0 between the two diets was similar to that observed by Keunen et al. (Reference Keunen, Plaizier, Kyriazakis, Duffield, Widowski, Lindinger and McBride2002) after the induction of subacute acidosis in dairy cows, which confirms that the animals fed H were suffering from subacute acidosis. However, the daily mean pH obtained with both diets in the present experiment are very close to the threshold of 6.25 proposed by Sauvant et al. (Reference Sauvant, Meschy and Mertens1999) to characterize subacute acidosis and they both induced at least 4 h of rumen pH below 6.0. Thus, according to the definition of Sauvant et al. (Reference Sauvant, Meschy and Mertens1999) both diets induced some subacute acidosis but it is reasonable to suggest that H was more acidogenic than L. However, because the two diets not only differed in their acidogenic capacity but also in their fibre, energy and protein content, it was difficult to determine the consequences of acidosis compared to those due to diet composition.
Regardless of the diet offered, the goats spent more time ruminating than eating, which is in accordance with results obtained in lactating goats (Kawas et al., Reference Kawas, Lopes, Danelon and Lu1991) and cows (Deswysen et al., Reference Deswysen, Dutilleul, Godfrin and Ellis1993; Maekawa et al., Reference Maekawa, Beauchemin and Christensen2002), but not with the results of Rapetti et al. (Reference Rapetti, Bava, Tamburini and Crovetto2005) and Abijaoudé et al. (Reference Abijaoudé, Morand-Fehr, Tessier, Schmidely and Sauvant2000b) in lactating goats. The total time spent eating and ruminating was shorter when the goats were offered H than L, which is in accordance with the literature on goats and cows (Kawas et al., Reference Kawas, Lopes, Danelon and Lu1991; Abijaoudé et al., Reference Abijaoudé, Morand-Fehr, Tessier, Schmidely and Sauvant2000b; Maekawa et al., Reference Maekawa, Beauchemin and Christensen2002) and confirms that the total time spent chewing (intake and rumination) decreases when the proportion of NDF decreases in the diet (Maekawa et al., Reference Maekawa, Beauchemin and Christensen2002). When a physiological parameter changes too much, homoeostatic regulation mechanisms try to maintain it within physiological limits (Sauvant, Reference Sauvant1992). Thus, the higher concentrate percentage of the H diet probably induced a faster and more intense fermentation in the rumen, which is known to induce satiety due to the increase in rumen lactic acid (Buéno, Reference Buéno1975), propionic acid (Allen, Reference Allen2000), osmotic pressure (Rémond et al., Reference Rémond, Brugère, Poncet and Baumont1995) or volatile fatty acids (Forbes, Reference Forbes2007). The shorter total chewing time observed with H might have limited the total amount of saliva and buffers secreted (Sauvant et al., Reference Sauvant, Giger-Reverdin and Meschy2006), which could have increased the risk of acidosis for the animals offered H. Both the increase in the fermentation processes and the decrease in buffers from chewing could explain the lower rumen pH observed with H compared to L, but the difference was however lower than expected. Goats tended to spend more time drinking when offered H than when offered L. This might be due to the increase in osmolarity of the rumen content and also to the lower water content of the diet H compared to L. This result, however, has to be confirmed because scan sampling techniques are less precise for measuring behaviours of short duration, like drinking, than those of long duration, like feeding, standing or lying (Mitlöhner et al., Reference Mitlöhner, Morrow-Tesch, Wilson, Dailey and McGlone2001) and because the differences in drinking time observed during our experiment are of the same magnitude (2 min) as the scan sampling interval.
The mean durations of behavioural bouts (except standing) were shorter when the goats were offered H than when they were offered L, even if it was not always significant. No data were found for comparison in the literature. The shorter mean durations observed for intake and rumination bouts might be related to the shorter total intake and rumination duration observed during 24 h. Shorter intake bouts might have resulted from earlier satiety with H than with L as already discussed. With high-concentrate diets, the more relevant factor inducing satiety is the production of volatile fatty acids by ruminal fermentation, whereas in more fibrous diets, the main factor inducing satiety is the physical repletion of the rumen (see review by Forbes, Reference Forbes2007). The major satiety factor was probably VFA production for both L and H diets, but their production was probably faster and higher with H than with L, inducing earlier satiety signals and shorter mean durations of intake bouts. These shorter mean intake bouts allowed the daily repartition of chewing activities to increase during the day, which may have limited metabolic disorders, such as a decrease in pH. In turn, this might explain the small difference in rumen pH observed between the two diets. This increased daily repartition of intake has already been observed with a high-concentrate diet (Abijaoudé et al., Reference Abijaoudé, Morand-Fehr, Tessier, Schmidely and Sauvant2000b). These shorter activity bouts may also highlight a greater activity level of the goats offered H. Some goats were actually very nervous, searching for straw, salt or something else to eat, particularly during milking when they were outside their individual pens. Sawyer (Reference Sawyer1998) showed that excessive activity might be a sign of discomfort or pain, but more observations are needed to confirm that high-concentrate diets or subacute acidosis can cause discomfort or pain.
The majority of rumination occurred during the night and in the morning, which is in accordance with the review by Beauchemin et al. (Reference Beauchemin, Kachanosky, Schaalje and Buchanan-Smith1990). However, regardless of the diet offered, the goats spent at least a little time ruminating during all the intervals, which could also have minimized fluctuations in rumen pH (Beauchemin et al., Reference Beauchemin, Kachanosky, Schaalje and Buchanan-Smith1990). The decrease in the total time spent ruminating when goats received H was due to the decreased rumination time during the morning and the evening but not during the main night rumination period. The nycthemeral pattern of rumination was thus not really influenced by the diet. Goats offered H tended to spend more time resting during the morning while goats offered L spent more time ruminating, but the differences in resting time were of a lower magnitude than those for rumination.
During the early morning (0530 to 0730 h) intake increased for both diets compared to the night intervals even without any feeding occurring, which agrees with data from Dulphy and Faverdin (Reference Dulphy and Faverdin1987). The majority of intake occurred during the day (0530 to 2130 h) with two intake peaks after milking and feeding (0800 and 1600 h), as has already been described (Beauchemin et al., Reference Beauchemin, Kachanosky, Schaalje and Buchanan-Smith1990; DeVries et al., Reference DeVries, von Keyserlingk and Beauchemin2003). During the two intervals including feeding and during the first interval following the afternoon feeding, goats spent less time eating with H than with L. As it has already been discussed, this might be due to earlier satiety and thus a more rapid end to the meal due to higher fermentation rates with H than with L. These shorter main meals are in accordance with previous observations with high-concentrate diets (Abijaoudé et al., Reference Abijaoudé, Morand-Fehr, Tessier, Schmidely and Sauvant2000a).
The time spent idling can be interpreted as resting periods, even if it was recorded during both standing and lying, because secondary behaviours (self-grooming, interaction with the environment, observation of the environment, etc.) were recorded separately and therefore were not included in this idling time. Idling was longer when goats received H than when they received L during the intervals following feeding, which is in accordance with previous observations on intake and rumination. It also shows that there is a period without any activity between the end of a meal and the start of rumination, which agrees with results from Dulphy and Faverdin (Reference Dulphy and Faverdin1987). This idling bout seemed to be longer with H than with L, but as for meal determination we only assessed idling bouts and could not cluster them into a longer resting bout separating the end of the meal from the start of the first rumination bout.
Therefore, nycthemeral pattern was mainly influenced by the diet during the hours following feedings. When offered H, goats adapted their feeding behaviour, according to metabolic signals, which probably led to limited ruminal disturbances and which might explain why mean daily rumen pH of goats offered H remained above 6.0.
The time spent standing and lying was only influenced by the diet after the afternoon feeding (1730 to 2330 h). As it has already been suggested, it is certainly due to the two intake periods, separated by resting and ruminating, observed with H, while goats receiving L performed a longer main meal, followed by resting and rumination.
High individual variability was observed during this experiment and seems to be typical of experiments dealing with subacute acidosis. For example, goat susceptibility to acidosis is highly variable: some goats probably did not suffer from subacute acidosis with the H diet while others certainly did. Thus, to progress further in the analysis, results have to be interpreted individually, according to the detection of acidosis bouts and not only according to the percentage of concentrate in the diet.
Conclusion
Increasing the percentage of concentrate in the diet from 30% to 60% increased DMI and milk production and decreased milk fat content. Both diets led to short periods of time where rumen pH was below 6.0 but H induced lower mean rumen pH and was therefore more acidogenic than L. We can conclude from this experiment that goats fed a high-concentrate diet changed their nycthemeral activity patterns, particularly during the hours following feeding. They appeared to eat and ruminate more often but during shorter periods of time, which is probably due to satiety control. This adaptation could have limited the digestive disorders due to the rapid intake of a large amount of highly fermentable carbohydrates with the H diet. This adaptation might explain the small differences observed in rumen pH with the two diets.
Acknowledgements
We would like to thank J. Tessier, A. Aymard, M. Langot, G. Durandet, A. Severin and J. Kloster from the experimental farm at Grignon for the care of the goats and their technical assistance during the experiment. We thank C. Martin, L. Brossard and M. Fabre for their help in using pH probes. We also thank D. Sauvant, P. Morand-Fehr and A. Ponter for their advice and rereading the manuscript.