Introduction
Cystic echinococcosis (CE) has always been recognized as visceral fluid-filled sacs in humans and herbivores since antiquity (Eckert, Reference Eckert2007). This neglected parasitic disease is caused by the larval stage (metacestodes) of a well-known tapeworm, Echinococcus granulosus sensu lato (E. granulosus s.l.) (Romig et al., Reference Romig, Ebi and Wassermann2015; Dalimi et al., Reference Dalimi, Shamsi, Khosravi and Ghaffarifar2017), being endemic in Mediterranean countries, Eastern Africa, Central Asia, Western China and South America (Wen et al., Reference Wen, Vuitton, Tuxun, Li, Vuitton, Zhang and McManus2019). Canids play a pivotal role in transmission dynamics of the disease, since they may harbour prolific adult worms in their intestine (Shamsi et al., Reference Shamsi, Dalimi, Khosravi and Ghafarifar2015; Dalimi et al., Reference Dalimi, Shamsi, Khosravi and Ghaffarifar2017). Environmental contamination is the most significant step in the parasite life cycle, where eggs are destined to infect ungulates (intermediate hosts) and accidentally humans (dead-end hosts), causing a substantial rate of morbidity (Nourmohammadi et al., Reference Nourmohammadi, Javanmardi, Shams, Shamsinia, Nosrati, Yousefi, Nemati, Fatollahzadeh, Ghasemi and Kordi2020; Shams et al., Reference Shams, Javanmardi, Nosrati, Ghasemi, Shamsinia, Yousefi, Kordi, Majidiani and Nourmohammadi2021). Affected animals and humans suffer from a silent but chronic hydatid cyst infection (hydatidosis) due to the long incubation period and slowly growing larvae, particularly in liver and lungs (Kern et al., Reference Kern, Da Silva, Akhan, Müllhaupt, Vizcaychipi, Budke and Vuitton2017). The disease is associated with poor hygienic practices and poverty, rendering 184 000 (95% UI 88 100–1.59 million) disability-adjusted life years in humans (Torgerson et al., Reference Torgerson, Devleesschauwer, Praet, Speybroeck, Willingham, Kasuga, Rokni, Zhou, Fèvre and Sripa2015; Khademvatan et al., Reference Khademvatan, Majidiani, Foroutan, Tappeh, Aryamand and Khalkhali2019a) and huge economic losses in livestock industry, including poor milk production and organ condemnation (Ohiolei et al., Reference Ohiolei, Li, Ebhodaghe, Yan, Isaac, Bo, Fu and Jia2020).
Observation of physiological and morphological differences between parasites isolated from horse and sheep finally led to the recognition of taxonomic distinctness within the genus (Smyth and Davies, Reference Smyth and Davies1974; Smyth, Reference Smyth1982; Thompson and Lymbery, Reference Thompson and Lymbery2013; Thompson and Jenkins, Reference Thompson and Jenkins2014). Nowadays, polymerase chain reaction (PCR)-based techniques and sequencing of nuclear and mitochondrial genes (Bowles et al., Reference Bowles, Blair and McManus1994; Thompson et al., Reference Thompson, Lymbery and Constantine1995; Harandi et al., Reference Harandi, Hobbs, Adams, Mobedi, Morgan-Ryan and Thompson2002; Thompson and McManus, Reference Thompson and McManus2002; Jenkins et al., Reference Jenkins, Romig and Thompson2005; Romig et al., Reference Romig, Dinkel and Mackenstedt2006; Cruz-Reyes et al., Reference Cruz-Reyes, Constantine, Boxell, Hobbs and Thompson2007; Hüttner et al., Reference Hüttner, Siefert, Mackenstedt and Romig2009; Pednekar et al., Reference Pednekar, Gatne, Thompson and Traub2009; Tigre et al., Reference Tigre, Deresa, Haile, Gabriël, Victor, Van Pelt, Devleesschauwer, Vercruysse and Dorny2016) have confirmed that E. granulosus s.l. devotes to 1 species cluster that encompasses several genotypes, as follows (Vuitton et al., Reference Vuitton, McManus, Rogan, Romig, Gottstein, Naidich, Tuxun, Wen and da Silva2020): (i) G1 and G3 genotypes individualized within E. granulosus sensu stricto; (ii) E. equinus previously known as G4 genotype; (iii) E. ortleppi previously known as G5 genotype; (iv) G6/7 genotypic cluster, G8 and G10 individualized within E. canadensis; and (v) E. felidis. In the meanwhile, latest international consensus by ‘World Association of Echinococcosis’ determined that G2 and G9 are considered as microvariants of G3 and G7, respectively (Kinkar et al., Reference Kinkar, Laurimäe, Sharbatkhori, Mirhendi, Kia, Ponce-Gordo, Andresiuk, Simsek, Lavikainen and Irshadullah2017; Vuitton et al., Reference Vuitton, McManus, Rogan, Romig, Gottstein, Naidich, Tuxun, Wen and da Silva2020). Overall, these genotypes vary regarding antigenic and biochemical features, infectivity, cyst fertility and host specificity with significant implications in treatment outcome, diagnostic aspects and vaccine development (Carmena and Cardona, Reference Carmena and Cardona2014; Agudelo Higuita et al., Reference Agudelo Higuita, Brunetti and McCloskey2016). The domestic dog (Canis familiaris) is the most common definitive host which contributes to the cosmopolitan domestic life cycle of E. granulosus s.l. along with livestock (Tamarozzi et al., Reference Tamarozzi, Legnardi, Fittipaldo, Drigo and Cassini2020). In this sense, several influential factors have been determined regarding canine echinococcosis, including feeding on raw/contaminated offal, being a young dog and lack of deworming treatment by dog owners (Otero-Abad and Torgerson, Reference Otero-Abad and Torgerson2013). There, also, exist sylvatic life cycles involving wild canids, mainly wolves (Canis lupus) and jackals (Canis aureus), and wild ungulates as intermediate hosts (Romig et al., Reference Romig, Deplazes, Jenkins, Giraudoux, Massolo, Craig, Wassermann, Takahashi and De La Rue2017; Karamon et al., Reference Karamon, Samorek-Pieróg, Sroka, Bilska-Zając, Dąbrowska, Kochanowski, Różycki, Zdybel and Cencek2021).
Until now, a great deal of research studies has been conducted to elucidate the genotypic diversity and distribution of E. granulosus s.l. in domestic and wild canids worldwide (Carmena and Cardona, Reference Carmena and Cardona2014), while a comprehensive study is lacking. The present systematic review and meta-analysis provide insights into the genotypic diversity of E. granulosus s.l. in various canine hosts at a global perspective.
Methods
The review was conducted according to the Preferred Reporting Items for Systematic Reviews and Meta-analyses (PRISMA) guideline (online Supplementary File) (Moher et al., Reference Moher, Liberati, Tetzlaff, Altman and Group2009).
Literature search strategy
Four major English databases including PubMed, Scopus, Web of Science and ProQuest were systematically searched for articles evaluating the genotypic status of E. granulosus infection in domestic and wild canids worldwide, without time limitation until 21 May 2021. This procedure was conducted using the following keywords alone or in combination, using advanced search option in most databases and Medical Subject Heading (MeSH) option in PubMed databases: (‘Echinococcus granulosus’) AND (‘Dog’ OR ‘Domestic canid’ OR ‘Wild canid’) AND (‘Genotype’ OR ‘Phylogeny’). Hand-searching of the bibliographic list of related papers was an additional task to cover more papers not found via database exploration. Briefly, title and abstract of the literature were accurately reviewed, relevant papers were included, and upon duplicate removal, full-texts of eligible papers were retrieved. Any disagreements were obviated by discussion and consensus with the leading researchers.
Inclusion/exclusion criteria and data extraction
Inclusion criteria were included in the present systematic review and meta-analysis in order to precisely gather relevant peer-reviewed studies limited to E. granulosus genotypic diversity in domestic and/or wild canids worldwide. Only those studies that utilized molecular techniques and a specific gene marker for the accurate identification of isolated genotypes were qualified to be included in the present systematic review. Other study types (letters, reviews, conference papers, dissertations), studies only evaluating the prevalence of the E. granulosus among canids without genotypic discrimination, studies without molecular confirmation of the isolated genotypes and those records without full-text accessibility were all excluded from the present systematic review and meta-analysis. Finally, a pre-designed Microsoft Excel Spreadsheet® was used to extract the required information, as follows: first author's name, publication year, continent, country, sample type, hosts, binomial nomenclature, total sample, molecular prevalence, isolated genotype, complex, gene marker and molecular test.
Meta-analysis
Meta-analytical approach was done according to previous studies using a random-effect model (Khalkhali et al., Reference Khalkhali, Foroutan, Khademvatan, Majidiani, Aryamand, Khezri and Aminpour2018; Khademvatan et al., Reference Khademvatan, Majidiani, Khalkhali, Taghipour, Asadi and Yousefi2019b; Ghasemi et al., Reference Ghasemi, Shamsinia, Taghipour, Anvari, Bahadory, Shariatzadeh, Kordi, Majidiani, Borji, Chaechi Nosrati, Yousefi and Shams2020). For all included studies, point estimates and their respective 95% confidence intervals (CIs) of weighted molecular prevalence were calculated. Heterogeneity among these studies or variation in study outcomes was visualized by drawing forest plots, calculated by I 2 and Cochrane's Q tests. The subgroup analysis was performed based on year, continent, country, sample type, host and molecular methods. The presence of publication bias was estimated by using Egger's regression test. This kind of bias, if present, skews the results and published reports are not a representative sample of the available evidence anymore. P value less than 0.05 was considered statistically significant. All analytical functions were applied by STATA/S.E. software version 12.0 (StataCorp, College Station, TX 77845, USA).
Phylogenetic analysis
The phylogenetic analysis and dendrogram illustration of the E. granulosus s.l. isolates, identified based on the mitochondrial cytochrome C oxidase I (COX1) gene, were conducted using the ClustalX and molecular evolutionary genetics analysis (MEGA) software (7.0). The evolutionary history was inferred by using the Maximum Likelihood (ML) method based on the Hasegawa–Kishino–Yano (HKY) model and bootstrap value of 500. Reference Echinococcus sequences deposited in GenBank were used to draw the phylogenetic tree better. As well, Taenia saginata (Accession No.: NC_009938) was assigned as an outgroup.
Results
Qualified studies
Initial systematic search in 4 databases (PubMed, Scopus, Web of Science and ProQuest) yielded a total number of 1942 articles, among which 335 papers were found to be related to the search subject. Upon duplicate removal (109 records), the remaining papers were scrutinized based on the inclusion criteria and finally a total of 44 qualified articles were considered for meta-analysis. A flow chart showing the study evaluation and selection procedure is provided as Fig. 1. Moreover, detailed characteristics of the qualified studies are represented in online Supplementary Table S1.
PRISMA flow diagram describing included/excluded studies explored until 21 May 2021.

Distribution of E. granulosus genotypes isolated from canine hosts
Several genotypes were identified among examined canid populations worldwide using molecular techniques. In details, a huge number of genotypes was identified in domestic dogs from Asia (G1, G2, G3, G1–G3 complex, G6, G7), Europe (G1, G1–G3 complex, G4, G6/7), Africa (G1, G1–G3 complex, G5, G6/7, G6), South America (G1, G3, G5, G6), North America (only G7) and Oceania (G1). Additionally, jackal genotypes were determined as G1 in Asia, Europe and Africa as well as G1–G3 complex in Africa. Asian wolves were shown to harbour G1, G6/7 and G10, while G1 and G7 genotypes were isolated from European wolves. Notably, G8, G10 and G8/G10 genotypes were found in North American wolves. G1 was the only isolated genotype from examined foxes (Asia and Africa) and Pump foxes (South America).
Based on our results, G1 (n = 39) was the most common isolated genotype worldwide, followed by E. granulosus sensu stricto (s.s.) complex (n = 6), G3 (n = 6), G6/7 (n = 5), G2 (n = 3), G6 (n = 3), G7 (n = 3), G5 (n = 2), G8/10 (n = 2), G10 (n = 2), as well as G4 (n = 1) and G8 (n = 1). Asia had the highest number of reports (17 datasets) for E. granulosus s.l. genotypes among canids, followed by Europe (15 datasets) and Africa (10 datasets). Based on countries, the highest number of studies were done in Iran (10 records), Tunisia (5 records), Argentina and USA (3 records per country), followed by double records from Bulgaria, Turkey, UK, Portugal, Italy (Europe), China (Asia), Kenya (Africa) and Brazil (South America). Table 1 completely demonstrates E. granulosus s.l. genotypes identified in domestic/wild canids worldwide.
Genotypes of Echinococcus granulosus sensu lato identified in domestic/wild canids worldwide through systematic exploration until 21 May 2021

Meta-analysis output
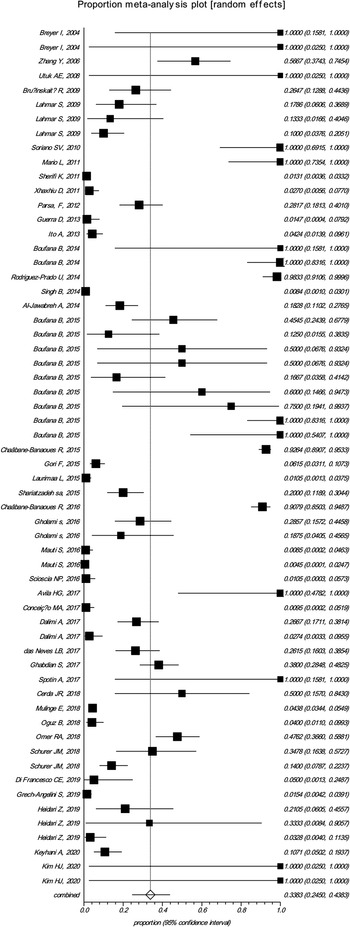
In total, 6166 canine species were examined regarding E. granulosus s.l. infection, among which 896 were found to be infected using molecular methods. Random-effects model meta-analytical approach demonstrated that the pooled prevalence of echinococcosis in canines was 33.82% (95% CI 24.50–43.83) globally. The included studies demonstrated a strong heterogeneity (Q = 3045.3, d.f. = 59, I 2 = 98.1%, P < 0.0001) (Fig. 2). Publication bias was checked by Egger's regression test, and showed that it may have a substantial impact on the total prevalence estimate (Egger; bias: 6.2, P < 0.001) (Fig. 3).
Forest plot of the pooled prevalence of canine echinococcosis worldwide until 21 May 2021.

A bias assessment plot from Egger for the prevalence of canine echinococcosis in examined domestic/wild canids worldwide, until 21 May 2021.

Subgroup analysis was done in order to overcome high heterogeneity among studies (Table 2). Noticeably, dogs showed the highest prevalence of 38.59% (95% CI 26.50–51.45%), followed by jackal of 27.11% (95% CI 10.14–48.59%) and wolf of 14.20% (95% CI 6.07–25.01%). The highest and lowest prevalence rates were calculated for South American (66.03%; 95% CI 25.67–95.85%) and European territories (19.01%; 95% CI 9.95–30.16%), respectively. By country, Bulgaria showed the leading prevalence with 88.77% (95% CI 50.54–99.07%), followed by Uzbekistan (85.35%; 95% CI 40.33–99.05%) and UK (78.49%; 95% CI 13.67–94.90%), whereas the lowest prevalence was calculated to be 0.82% (95% CI 0.14–2.06%) in Mali and 1.64% (95% CI 0.29–4.05%) in Portugal. Considerably, highest prevalence rates were obtained by adult worm samples (41.07%; 95% CI 30.58–51.99%) in comparison with fecal samples (23.76%; 95% CI 10.43–40.47%). With respect to the molecular methods, a very high prevalence of 77.28% (95% CI 43.96–97.83%) was yielded using PCR restriction fragment-length polymorphism (RFLP) method, while the lowest prevalence was calculated using multiplex PCR method with 11.27% (95% CI 0.26–45.10%). Our result showed a relatively decreasing trend in the prevalence of E. granulosus infection among canids, from 48.49% (95% CI 25.69–71.63%) in studies published 2010 and before, to 22.06% (95% CI 12.88–32.91%) in studies published between 2016 and 2020.
Total subgroup analysis of canine echinococcosis based on the year, continent, country, sample type, host and molecular test

Overall, subgroup analysis revealed that there were statistically significant differences between the global prevalence of echinococcosis in canines and publication year (X 2 = 22.7, P < 0.001), continent (X 2 = 104.4, P < 0.001), country (X 2 = 2.9, P < 0.001), sample type (X 2 = 235.7, P < 0.001), host (X 2 = 345.0, P < 0.001) and molecular test (X 2 = 72.3, P < 0.001).
Phylogenetic analysis
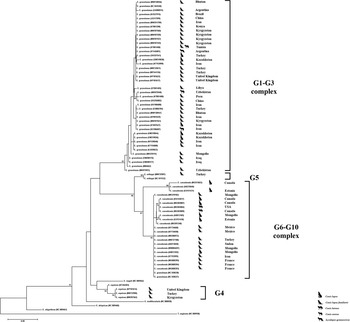
Due to the lack of submission of some of the sequences reported in the articles under review, we had to delete them in the phylogenetic analysis. Based on the phylogenetic analysis of COX1 gene of E. granulosus s.l. isolates, the reported genotypes 1–3 of dogs, jackals, wolves and fox were clustered with the reference sequences of these genotypes. These isolates have been reported from various countries in Asia, Africa, Europe and South America. Genotypes 4 and 5 form separate branches, and based on previous studies, these genotypes have been reported only from dogs. Also, genotypes 6–10 reported from domestic and wild canids (such as dogs, wolves and coyotes) clustered with reference sequences, although G8 and G10 have created subclusters in G6–G10 complex (Fig. 4).
Phylogenetic tree of E. granulosus s.l. sequences isolated from canine species, based on COX1 gene analysis, until 21 May 2021. The percentage of trees in which the associated taxa clustered together is shown next to the branches. Those illustrated with animal icons are derived from included papers in our study. The percentage of trees in which the associated taxa clustered together is shown next to the branches. The tree is drawn to scale, with branch lengths measured in the number of substitutions per site.

Discussion
CE is a widespread, but still neglected, parasitic infection of medical and veterinary significance, which causes a substantial health and financial burden to humans as well as livestock industry (Galeh et al., Reference Galeh, Spotin, Mahami-Oskouei, Carmena, Rahimi, Barac, Ghoyounchi, Berahmat and Ahmadpour2018). During last decades, an exclusively high rate of intraspecific variability has been recognized for E. granulosus s.l. isolated from humans and a wide range of animal hosts (Nakao et al., Reference Nakao, McManus, Schantz, Craig and Ito2006). Such genetic diversity has been known to be associated with morphological differences, susceptibility to common therapeutics, life-cycle patterns and pathogenicity (Thompson, Reference Thompson2008; Anvari et al., Reference Anvari, Pourmalek, Rezaei, Fotovati, Hosseini, Daryani, Spotin, Sarvi, Hosseini and Narouei2021). In order to determine the genotypic diversity and various transmission cycles of CE between domestic/wild definitive and intermediate hosts and to accurately realize and accommodate possible sources of infection to humans, genotyping studies on E. granulosus s.l. seem absolutely essential. Overall, these valuable data could be further applied to make constructive preventive measures for CE (Manterola et al., Reference Manterola, Totomoch-Serra, Rojas, Riffo-Campos and García-Méndez2021). The present systematic review and meta-analysis provide insights into the prevalence of E. granulosus s.l. infection among canine definitive hosts with special emphasis on the global status of the isolated genotypes.
As anticipated, G1 (39 records) was the most prevalent genotype worldwide, which was isolated from various canine hosts, including dogs, jackal, wolf, fox and pump fox. This genotype has a seeming predilection to dogs, since 30 records of G1 were exclusively isolated from these animals. Sheep and goat and, to a lesser extent, other herbivores (donkey, cattle, camel, macropods) are infected with this genotype (Jenkins, Reference Jenkins2006; Boufana et al., Reference Boufana, Lahmar, Rebaï, Ben Safta, Jebabli, Ammar, Kachti, Aouadi and Craig2014). Fertile hydatid cysts are mostly produced in affected animals, with the exception of cattle (Pezeshki et al., Reference Pezeshki, Akhlaghi, Sharbatkhori, Razmjou, Oormazdi, Mohebali and Meamar2013). This genotype, also, contributes to the great majority of human CE cases, globally (Rojas et al., Reference Rojas, Romig and Lightowlers2014). Other less common genotypes isolated from canids included the highly zoonotic E. granulosus s.s. complex (G1–G3) (6 records), G3 (6 records) and G6/7 (5 records), followed by G6, G7 and G2 (3 records per genotype) reported as separate genotypes. The G3 genotype, initially found in water buffalo, has been commonly isolated from different intermediate hosts as well as humans (Cardona and Carmena, Reference Cardona and Carmena2013). Because of the not yet fully clarified variations within G1–G3 cluster, it is recommended to employ the term E. granulosus s.s. complex, instead of genotype nomenclature. However, some papers only reported separate genotypes (G1 or G3). It is speculated that this species cluster may have originated from the Middle East (Yanagida et al., Reference Yanagida, Mohammadzadeh, Kamhawi, Nakao, Sadjjadi, Hijjawi, Abdel-Hafez, Sako, Okamoto and Ito2012), where dogs were initially domesticated by our ancestors (Lear, Reference Lear2012); this issue may entail the possible co-evolution of the parasite with dogs and their subsequent spread to other parts of the world. Currently, it is known that G2 (previously Tasmanian sheep strain) is a microvariant of G3 (Kinkar et al., Reference Kinkar, Laurimäe, Sharbatkhori, Mirhendi, Kia, Ponce-Gordo, Andresiuk, Simsek, Lavikainen and Irshadullah2017) and was only identified in Iranian dogs (3 records), while information was lacking in other areas.
Genotypic cluster G6/7 is a member of E. canadensis and the second most significant cause of human CE cases in the world (Lymbery et al., Reference Lymbery, Jenkins, Schurer and Thompson2015; Laurimäe et al., Reference Laurimäe, Kinkar, Romig, Omer, Casulli, Umhang, Gasser, Jabbar, Sharbatkhori and Mirhendi2018). Until recently, G6 and G7 were allocated to camel and pig strains; however, their distribution in intermediate hosts remains to be elucidated (Cardona and Carmena, Reference Cardona and Carmena2013). Based on our results, this cluster was prevalent in examined dogs from Africa (Kenya, Sudan, Mali), Europe (Lithuania, France), South America (Argentina), North America (Mexico) and Asia (Iran). Also, wolves from Portugal and Mongolia were shown to be infected with G7 and G6/7 cluster, respectively. Of note, human cases due to G6 have been documented from South American countries to the Middle East, North Africa and Eastern Asia. Exceptionally, an interesting observation showed that parasites of G6 genotype may have a particular propensity to infect human brain, which deserves further investigation (Sadjjadi et al., Reference Sadjjadi, Mikaeili, Karamian, Maraghi, Sadjjadi, Shariat-Torbaghan and Kia2013) mostly in Sudan and Argentina, where human cases are relatively common (Rojas et al., Reference Rojas, Romig and Lightowlers2014). Moreover, Central and Eastern Europe appear to be the main transmission area for G7 genotype, where pig is the preferred intermediate host (Rojas et al., Reference Rojas, Romig and Lightowlers2014), while the current review showed that canine G7 genotypes were isolated from Iran, Portugal and Mexico. This finding adds more to the complicated epidemiology of this genotype worldwide. Based on this information, there is lack of genotyping studies in canine hosts in those areas where human cases have been reported and vice versa, in order to determine possible domestic and/or sylvatic patterns of transmission.
Another member of E. canadensis is the previous cervid strain (G8/G10), being mostly found in the northern Eurasia and northern North America (Thompson et al., Reference Thompson, Boxell, Ralston, Constantine, Hobbs, Shury and Olson2006; Moks et al., Reference Moks, Jõgisalu, Valdmann and Saarma2008; Nakao et al., Reference Nakao, Yanagida, Konyaev, Lavikainen, Odnokurtsev, Zaikov and Ito2013). Consistent with this finding, in the present study, G8/10 genotypes have been isolated from wildlife definitive hosts (wolf and coyote) in the USA and Mongolia. The key intermediate hosts for this genotype cluster are cervid species, including moose and reindeer. Also, convincing epidemiological evidences suggest that this cervid-adapted cluster is infective to humans (Rojas et al., Reference Rojas, Romig and Lightowlers2014); this finding is substantiated by sporadic cases from Alaska (G8 genotype) (Castrodale et al., Reference Castrodale, Beller, Wilson, Schantz, McManus, Zhang, Fallico and Sacco2002; McManus et al., Reference McManus, Zhang, Castrodale, Le, Pearson and Blair2002), Siberia (Nakao et al., Reference Nakao, Yanagida, Konyaev, Lavikainen, Odnokurtsev, Zaikov and Ito2013) and Mongolia (G10 genotype) (Jabbar et al., Reference Jabbar, Narankhajid, Nolan, Jex, Campbell and Gasser2011). Our study indicated that the other remaining genotypes were isolated from dogs in the UK (G4), Kenya and Brazil (G5). Curiously, in a recently published paper, G5 was isolated for the first time from grey wolves in Poland (Karamon et al., Reference Karamon, Samorek-Pieróg, Sroka, Bilska-Zając, Dąbrowska, Kochanowski, Różycki, Zdybel and Cencek2021); however, this study was published after the time period of the systematic search for the current study, hence it could not be included. Today, G4 is known as an independent species, E. equinus, which appears to be exclusive for the family Equidae as intermediate hosts (donkeys, horses and zebras) without infectivity traits for humans (Smyth, Reference Smyth1977; Nakao et al., Reference Nakao, Yanagida, Konyaev, Lavikainen, Odnokurtsev, Zaikov and Ito2013; Rojas et al., Reference Rojas, Romig and Lightowlers2014). Intermediate hosts from the Great Britain, central and some eastern Europe have been shown to be infected with this genotype (Mitrea et al., Reference Mitrea, Ionita, Costin, Ciopasiu, Constantinescu and Tudor2010). Echinococcus ortleppi, previously known as G5, has a prominent predilection to infect cattle with typically fertile hydatid cysts (Ortlepp, Reference Ortlepp1934; Rojas et al., Reference Rojas, Romig and Lightowlers2014). However, this species has also been found in other intermediate hosts, including small ruminants (Gholami et al., Reference Gholami, Behrestaghi, Sarvi, Alizadeh and Spotin2021), camel (Ebrahimipour et al., Reference Ebrahimipour, Sadjjadi, Darani and Najjari2017), buffalo (Casulli et al., Reference Casulli, Manfredi, La Rosa, Di Cerbo, Genchi and Pozio2008), Philippine spotted deer (Boufana et al., Reference Boufana, Stidworthy, Bell, Chantrey, Masters, Unwin, Wood, Lawrence, Potter and McGarry2012) and porcupines (Hodžić et al., Reference Hodžić, Alić, Šupić, Škapur and Duscher2018). Human infections due to E. ortleppi have only been sporadically reported from the Americas (Kamenetzky et al., Reference Kamenetzky, Gutierrez, Canova, Haag, Guarnera, Parra, García and Rosenzvit2002; Guarnera et al., Reference Guarnera, Parra, Kamenetzky, García and Gutiérrez2004; Maravilla et al., Reference Maravilla, Thompson, Palacios-Ruiz, Estcourt, Ramirez-Solis, Mondragon-de-la-Peña, Moreno-Moller, Cardenas-Mejia, Mata-Miranda and Aguirre-Alcantara2004; de la Rue et al., Reference de la Rue, Takano, Brochado, Costa, Soares, Yamano, Yagi, Katoh and Takahashi2011), South Africa (Mogoye et al., Reference Mogoye, Menezes, Wong, Stacey, von Delft, Wahlers, Wassermann, Romig, Kern and Grobusch2013) and India (Sharma et al., Reference Sharma, Sehgal, Fomda, Malhotra and Malla2013).
Studies conducted in Asia, mainly Iranian reports on canine hosts (10 records), had the highest contributions to the field of E. granulosus s.l. genotypes worldwide. Nevertheless, still our knowledge on this subject is in its infancy and much more investigations are required, especially in the areas of endemicity in South America, Africa, Middle East and Central Asia, to accurately illustrate the domestic and/or sylvatic transmission patterns. In total, improving our knowledge on the global distribution of the zoonotic E. granulosus s.l. cestodes is highly essential, since they involve a wide range of intermediate and definitive hosts with serious medical implications in humans worldwide. Such a diversity in particular genotypes is highly influenced by the relative frequency and tendency of various genotypes in animal intermediate hosts, the potential contact between humans and canine definitive hosts and difference in social behaviours such as handling/rearing dogs as well as slaughtering different livestock species affecting exposure to dogs (Rojas et al., Reference Rojas, Romig and Lightowlers2014).
Pertinent to the results of the meta-analysis, the global prevalence of canine echinococcosis based on molecular methods was 33.82% (95% CI 24.50–43.83%), which was derived from published articles until 21 May 2021. Additionally, a remarkable association was demonstrated between the weighted prevalence of canine echinococcosis and canine host, sample type, publication year, country, continent and molecular diagnostics.
The results of the sub-analysis showed a significant decrease in the global molecular prevalence of canine echinococcosis in the last 5 years [(2016–2020; 22.06% (95% CI 12.88–32.91%)], in comparison with those papers published between 2011 and 2015 [42.04% (95% CI 22.92–62.5%)] or before 2010 [48.94% (95% CI 25.69–71.63%)]. Inevitably, much of the attempts on the molecular prevalence of CE have been done on dogs, as the most significant and widespread definitive host for E. granulosus s.l.; besides, improvement in handling owned dogs, management of stray/feral dog populations, surveillance programmes in definitive hosts as well as sanitary slaughtering conditions has substantially influenced the distribution and prevalence of zoonotic infections such as CE in definitive canine hosts (Otero-Abad and Torgerson, Reference Otero-Abad and Torgerson2013).
Another finding of the present meta-analysis was that the highest prevalence of canine echinococcosis belonged to South America (66.03%; 95% CI 25.67–95.85%), while the lowest frequency was computed for Europe (19.01%; 95% CI 9.95–30.16%). In the meanwhile, the highest number of studies were conducted in canine hosts from Asia (17 datasets) and Europe (15 datasets). The E. granulosus s.l. infection is extremely endemic in South American territories (Cardona and Carmena, Reference Cardona and Carmena2013). Previously, Cucher et al. (Reference Cucher, Macchiaroli, Baldi, Camicia, Prada, Maldonado, Avila, Fox, Gutiérrez and Negro2016) reviewed the diversity of the CE in domestic intermediate hosts and human cases from South America and showed that E. granulosus s.s., E. ortleppi and G6/7 cluster of E. canadensis are prevailed among examined livestock, particularly from Argentina, Brazil, Uruguay and Peru (Cucher et al., Reference Cucher, Macchiaroli, Baldi, Camicia, Prada, Maldonado, Avila, Fox, Gutiérrez and Negro2016). Likewise, studies from Bolivia have reported considerable prevalence in slaughtered livestock (Ali et al., Reference Ali, Martinez, Duran, Villena, Deplazes and Alvarez Rojas2021). Due to such a great diversity of CE among livestock in South America, it is assumed that unchallenging access to the offal of slaughtered animals containing fertile cysts (e.g. cattle, sheep, llama) by domestic and/or wildlife definitive hosts is the possible explanation for the higher prevalence of CE in the continent (Carmena and Cardona, Reference Carmena and Cardona2014). In Europe, CE is considered as a significant zoonotic helminthiasis, particularly in the Southeastern countries (Bulgaria, Lithuania, Romania, etc.) and the Mediterranean littoral (Turkey, Greece, Spain, Italy) (Romig et al., Reference Romig, Dinkel and Mackenstedt2006; Dakkak, Reference Dakkak2010). Nevertheless, the lowest molecular prevalence of canine echinococcosis in European countries, in spite of the high number of studies, may be due to the mandatory post-mortem examinations in many European slaughterhouses as well as strict surveillance and reporting activities to the European Food Safety Authority (Cardona and Carmena, Reference Cardona and Carmena2013).
The disease appears to be less frequent in northern European countries such as the UK (Carmena and Cardona, Reference Carmena and Cardona2014). On the contrary, an extremely high prevalence was calculated for the canine echinococcosis in the UK (78.49%; 95% CI 13.67–94.90%), derived from 2 records on dogs, which merit further investigation. Moreover, our meta-analysis demonstrated high prevalences in Uzbekistan (central Asia) (85.35%; 95% CI 40.33−99.05%) and Bulgaria (eastern Europe) (88.77%; 95% CI 50.54–99.07%); although such inferences must be accompanied with caution, due to the lack of adequate number of studies.
Another prominent finding of this meta-analysis was that over 1.5-fold prevalence rate was yielded when utilizing adult worms as specimens (41.07%; 95% CI 30.58–51.99%) (25 records) in comparison with fecal samples (23.76%; 95% CI 10.43–40.47%) (20 records). For canine echinococcosis, necropsy of the whole small intestine for the presence of small adult worms is the gold standard method (Eckert et al., Reference Eckert, Deplazes, Craig, Gemmell, Gottstein, Heath, Jenkins, Kamiya and Lightowlers2001a). Based on our results, this method was used to collect the intestinal tapeworms mostly from dogs (13 records) and, to a lower extent, from jackals (6 records) and wolves (5 records). This method is extremely specific in those areas not sympatric regarding E. multilocularis; otherwise, the isolated worms should be differentiated, at least morphologically (Eckert et al., Reference Eckert, Gemmell, Meslin and Pawlowski2001b). Of note, the sensitivity of post-mortem examination seems to be high (>97%), but in case of very low worm burden (<6 worms), false-negative results are a significant concern, mainly when sedimentation and counting technique is not done (Craig et al., Reference Craig, Mastin, van Kesteren and Boufana2015).
Obviously, most of the CE studies in the world are being conducted on dogs as the most prevalent, widespread definitive hosts for E. granulosus s.l. These animals are, also, in direct contact with human populations in urban areas, rural territories and the nomads, hence they are of great significance in the epidemiology of CE worldwide (Craig et al., Reference Craig, McManus, Lightowlers, Chabalgoity, Garcia, Gavidia, Gilman, Gonzalez, Lorca and Naquira2007). Our results demonstrated a relatively high prevalence rate in examined dogs (38.59%; 95% CI 26.5–51.45%), comparable to the jackal (27.11%; 95% CI 10.14–48.59%) and wolf (14.20%; 95% CI 6.07–25.01%) populations. This finding shows the higher importance of dogs regarding CE epidemiology; however, the significant role of sylvatic life cycles should not be overlooked, especially in North America, Eastern Europe and Western Asia.
As the current review demonstrated, higher prevalence was obtained using PCR-RFLP as a molecular diagnostic (77.28%; 95% CI 43.96–97.83%), followed by conventional PCR (30.79%; 95% CI 23.54–38.55%) and multiplex PCR (11.27%; 95% CI 0.26–45.10%). It seems that the prevalence estimated by conventional PCR is more reliable than others, since most studies preferred to employ this method coupled with sequencing for identification of E. granulosus s.l. genotypes isolated from canids worldwide. The PCR-RFLP method has been used to detect infection in livestock around the world (Dousti et al., Reference Dousti, Abdi, Bakhtiyari, Mohebali, Mirhendi and Rokni2013; Haniloo et al., Reference Haniloo, Farhadi, Fazaeli and Nourian2013; Onac et al., Reference Onac, Győrke, Oltean, Gavrea and Cozma2013; Fallahizadeh et al., Reference Fallahizadeh, Arjmand, Jelowdar, Rafiei and Kazemi2019), and only 3 records reported here employed this modality to detect canine echinococcosis and subsequent genotyping. Multiplex PCR assay is a more complex PCR-based method, which may detect parasitic DNA simultaneously and more accurately, however, only 3 records utilized such a complicated technique. Accordingly, the calculated results must be inferred with caution.
Phylogenetic analysis of COX1 gene of E. granulosus isolates of domestic and wild canids was completely consistent with the reported genotypes. The genotypic diversity reported by canines from different countries indicates the diversity of life cycles (domestic and wild cycles) of this parasite between the domestic and/or wild canine final hosts and the intermediate hosts.
The major limitations of the present systematic review and meta-analysis included (i) utilization of different molecular diagnostic methods without similar sensitivity and specificity, (ii) low number of prevalence and/or genotyping studies in wildlife definitive hosts such as wolves, jackals, foxes, etc. and (iii) inadequate data from several areas around the globe regarding canine echinococcosis.
Concluding remarks
The findings presented here are inferred from the extracted information within the accurately reviewed literature on canine echinococcosis genotypes published without time limitation until 21 May 2021. Several genotypes were found in domestic and/or wild definitive hosts worldwide, among which E. granulosus s.s. and G6/7 cluster of E. canadensis were the most common genotypes. Both of them are the causative agents of the most human cases worldwide, respectively. Although most studies were conducted in Asian and European countries, the highest molecular prevalence of canine echinococcosis was recorded for South America. Still, definitive hosts in many areas of the world should be surveyed regarding CE to get a true picture of the epidemiology of this zoonotic threat. The information provided here would be useful for future directions against CE regarding molecular prevalence, genotypic distribution, diagnosis and preventive measures.
Supplementary material
The supplementary material for this article can be found at https://doi.org/10.1017/S0031182022000658.
Acknowledgements
The authors thank all collaborators who contributed honestly to this review in the Ilam University of Medical Sciences, Ilam, Iran.
Author contributions
M. S. and H. M. conceived the study protocol; R. S. and S. A. S. systematically searched the literature; F. M. extracted the required data; D. A. performed the meta-analysis; M. P. performed the phylogenetic analysis; M. S., S. K. and H. M. wrote the manuscript.
Conflict of interest
None.