Implications
This study demonstrated that milk intake and animals’ age have great influence on starter feed intake (SFI). The findings of this work are interesting to the scientific community because it demonstrated that calf solid feed intake is driven by milk intake and age, and has an exponential pattern. In addition, our findings increase general knowledge about SFI of calves and may be used as a feasible tool for practical use to formulate diets.
Introduction
Feed intake is the most critical variable influencing animal performance because it determines the amount of nutrients ingested and their availability for maintenance and production (Nutrients Requirements Council, 2001). Thus, an accurate prediction of feed intake is necessary to develop balanced diets, avoiding under- or over-feeding, and to improve nutrients use and animal performance (Roseler et al., Reference Roseler, Fox, Chase, Pell and Stone1997; NRC, 2001).
Mathematical models (Tedeschi and Fox, Reference Tedeschi and Fox2009 and Reference Tedeschi and Fox2018; Tedeschi et al., Reference Tedeschi, Fox and Kononoff2013) and empirical equations (NRC, 2001; Hoffman et al., Reference Hoffman, Weigel and Wernberg2008) have been developed to predict dry matter intake for animals of all categories, such as lactating cows and growing heifers. Further, a series of management and environmental conditions influencing those intake models have also been evaluated (Hayirli et al., Reference Hayirli, Grummer, Nordheim and Crump2003; Krizsan et al., Reference Krizsan, Sairanen, Höjer and Huhtanen2014; Souza et al., Reference Souza, Oliveira, Araújo, Brito, Teixeira, Moares and Moura2014). However, no models or equations have been developed to estimate dry matter intake, or more appropriately, SFI of preweaned dairy calves. This is due to a considerable variability presented by SFI, which causes obstacles for developing models or equations.
Solid feed intake is important for promoting ruminal development and adaptation to future solid diets, and it is also used as a criterion for weaning in dairy calves (Silper et al., Reference Silper, Lana, Carvalho, Ferreira, Franzoni, Lima, Saturnino, Reis and Coelho2014). It also influences body composition and, consequently, nutrient requirements (Silva et al., Reference Silva2015 and Reference Silva, Marcondes, Detmann, Machado, Valadares Filho, Trece and Dijkstra2017). Thus, an accurate prediction of SFI is important for farm management, to determine weaning age, and to determine the composition of the starter feed that allows for meeting calf’s energy and nutrient requirements.
The SFI may be influenced by several factors, such as form, quality and composition of starter feed, level of liquid feed intake, type of liquid feed (milk or milk replacer), composition of liquid feed (mainly protein and fat content), rate of growth, availability and cleanliness of water and animal age (Kuehn et al., Reference Kuehn, Otterby, Linn, Olson, Chester-Jones, Marx and Barmore1994; Khan et al., Reference Khan, Weary and von Keyserlingk2011; Stamey et al., Reference Stamey, Janovick, Kertz and Drackley2012; Kertz and Loften, Reference Kertz, Prewitt and Everett2013). Among these variables, the level of liquid feed intake and animal age seem to have the most significant influence on SFI. Liquid feed intake is negatively associated with SFI, and decreases in SFI have been observed when liquid feed intake is increased (Jasper and Weary, Reference Jasper and Weary2002; Khan et al., Reference Khan, Lee, Lee, Kim, Kim, Ki, Ha, Lee and Choi2007; Sweeney et al., Reference Sweeney, Rushen, Weary and de Passillé2010). Conversely, SFI is positively associated with age, which demonstrates that capacity of intake is linked to growth and gastrointestinal tract development (Kertz et al., Reference Kertz and Loften1979; Silva et al., Reference Silva2015).
Therefore, we hypothesized that SFI is primarily influenced by liquid feed intake and it presents a different pattern for milk or milk replacer. In addition, we hypothesized that SFI demonstrates an increasing trend over time, according to animal age. Therefore, the objective of this study was to identify variables that influence SFI, and to develop predictive equations for SFI of preweaned dairy calves up to 64 days of age.
Material and methods
Our study compiled data from studies previously carried out. Thus, no animal care and use protocol was needed; however, all individual studies followed local guidelines for animal care and use. This study is part of the PhD thesis of Silva (Reference Silva, Marcondes, Detmann, Campos, Machado, Valadares Filho, Castro and Dijkstra2017).
Development of database
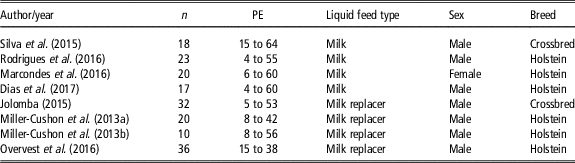
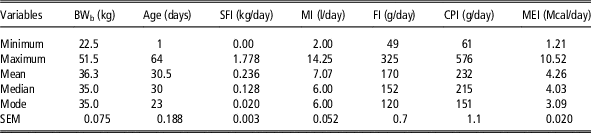
Data used were obtained from individual preweaned dairy calves (n=176) from eight experiments, totaling 6426 daily observations of intake. Among these experiments, five studies were carried out at the Universidade Federal de Viçosa (Viçosa, Minas Gerais, Brazil) and three at the University of Guelph (Kemptville, Ontario, Canada) (Table 1). Information that was collected from the studies included: birth BW (kg), SFI (kg/day), milk or milk replacer intake (MI; l/day), sex (male or female), breed (Holstein or Holstein×Gyr crossbred) and age (days) (Tables 1 and 2).
Summary of the database used to develop and evaluate models to predict starter feed intake of preweaned dairy calves

n=Number of calves; PE=period, in days of life, under evaluation (not all calves had the intake evaluated during all period).
Descriptive statistics of the data used to develop and evaluate models to predict starter feed intake of preweaned dairy calves

BWb=birth BW; SFI=starter feed intake; MI=milk or milk replacer intake; FI=fat intake; CPI=CP intake; MEI=metabolizable energy intake.
Information about the feedstuffs used in each experiment is available in Supplementary Material Table S1. Because milk replacer contained more DM than raw milk, the consumed milk replacer amount was corrected to the average DM content of milk, being 120 g/kg.
Among the studies in this analysis, Miller-Cushon et al. (Reference Miller-Cushon, Bergeron, Leslie and DeVries2013a and Reference Miller-Cushon, Montoro, Bach and DeVries2013b) and Overvest et al. (Reference Overvest, Bergeron, Haley and DeVries2016) used a textured starter feed. Conversely, Jolomba (Reference Jolomba2015), Silva et al. (Reference Silva2015), Marcondes et al. (Reference Marcondes, Tedeschi, Valadares Filho and Chizzotti2016), Rodrigues et al. (Reference Rodrigues, Lima, Castro, Valadares Filho, Campos, Chizzotti and Marcondes2016) and Dias et al. (Reference Dias, Marcondes, Noronha, Resende, Machado, Mantovani, Dill-McFarland and Suen2017) used ground (as meal form) starter feed. Forage was not provided to calves, during the liquid feeding phase, in the studies of Miller-Cushon et al. (Reference Miller-Cushon, Bergeron, Leslie and DeVries2013a), Jolomba (Reference Jolomba2015), Silva et al. (Reference Silva2015), Marcondes et al. (Reference Marcondes, Tedeschi, Valadares Filho and Chizzotti2016), Rodrigues et al. (Reference Rodrigues, Lima, Castro, Valadares Filho, Campos, Chizzotti and Marcondes2016) and Dias et al. (Reference Dias, Marcondes, Noronha, Resende, Machado, Mantovani, Dill-McFarland and Suen2017). On the other hand, the studies of Miller-Cushon et al. (Reference Miller-Cushon, Montoro, Bach and DeVries2013b) and Overvest et al. (Reference Overvest, Bergeron, Haley and DeVries2016) had treatments which included forage. However, because of the low number of animals that had access to forage, it was not possible to include this effect in our analysis; therefore, we removed these animals from our database.
Statistical analysis
Pearson’s coefficients of correlation were determined between SFI and relevant quantitative variables (e.g. MI, birth BW, metabolic birth BW (BWb 0.75, fat intake, CP intake, metabolizable energy intake and age). Subsequently, a preliminary graphical appraisal was carried out to identify the pattern of the data. As a result, an exponential function was chosen, as exposed by the general model below, which is in agreement with previous studies (Kertz et al., Reference Kertz and Loften1979; Stamey et al., Reference Stamey, Janovick, Kertz and Drackley2012).
 $\quad\quad\quad\quad\quad\quad\ Y\,{\equals}\,\beta _{0} {\times}{\rm exp}^{{(\beta _{{{\rm 1 }}} (A{\rm }{\minus}\beta _{2} ))}} $
where Y=SFI (kg/day); β 0=intercept; β 1=intake increment rate (per day); A=age (days) and β 2=adjustment parameter.
Because the data set was comprised observations from different studies, it was necessary to quantify this variance associated with the studies. Therefore, each experiment was considered as a random sample of a large population (St-Pierre, Reference St-Pierre2001) and the inclusion of experimental effects in the exponential model required the estimation of fixed effects, as well as random effects associated with the experiments, as described by Vyas and Erdman (Reference Vyas and Erdman2009).
Given the high influence of MI on SFI (Hill et al., Reference Hill, Bateman, Aldrich and Schlotterbeck2013; Miller-Cushon et al., Reference Miller-Cushon, Bergeron, Leslie and DeVries2013a), each parameter of the general equation was replaced by a linear regression as a function of MI. In addition, an adjustment factor was added to convert DMI in SFI, generating the following exponential function:
 $$\eqalign{ Y_{{ij}} \,{\equals}\,\left( {\beta _{0} {\plus}\beta _{1} {\times}{\rm MI}} \right){\times}{\rm exp}^{{\left( {\left( {\beta _{2} {\plus}\beta _{3} {\times}{\rm MI}} \right){\times}\left( {A{\minus}\left( {\beta _{4} {\plus}\beta _{5} {\times}{\rm MI}} \right)} \right)} \right)}} \cr& \,\,\,\,\,\,{{\minus} \left( {0.12{\times}{\rm MI}} \right){\plus}u_{j} {\plus}e_{{ij}} $$
where Y ij =SFI (kg/day) for the i individual observations (ranging from 1 to 6426) and j experiments (ranging from 1 to 8); MI the milk or milk replacer intake (l/day); A the age (days); 0.12×MI the adjustment factor to convert DMI in SFI (based in the milk DM content, which averaged 120 g/kg); u j the random effect of study; e ij the random error associated with each observation, and β 1, β 2, β 3, β 4 and β 5 are equations’ parameters.
The PROC NLMIXED of SAS (SAS Institute Inc., 2008) was used to fit the parameters of the equation (Supplementary Material S1). The effects of the type of liquid feed (milk or milk replacer) as well as MI were tested using the ‘ESTIMATE’ statement in PROC NLMIXED, and parameter coefficients were considered different when P<0.05. The effects of sex, forage intake and breed were not tested because of the low number of female and crossbred calves. Observations with studentized residuals greater than |2.5| were considered ‘outliers’ (Pell, Reference Pell2000; Tedeschi, Reference Tedeschi2006) and excluded from the database.
Sensitivity analysis
First, the goodness of fit of the equations was evaluated using the dispersion of standardized residual of SFI (Souza, Reference Souza1998). The standardized residual was obtained by the following relation:
 $${\rm SR}_{i} {\equals}{{y_{i} {\minus}\hat{y}_{i} } \over {{\rm ASD}}}$$
where SR
i
is the standardized residual; y
i
the observed value;
 $\hat{y}_{i} $
the estimated value and ASD the asymptotic standard deviation.
The values of the asymptotic standard deviation were estimated by the maximum-likelihood method, as follows:
 $${\rm ASD}{\equals}\sqrt {{{\sum_i^1 \left( {y_{i} {\minus}\hat{y}_{i} } \right)^{2} } \over n}} $$
where ASD is the asymptotic standard deviation; y
i
the observed value;
 $\hat{y}_{i} $
the estimated value and n the number of observations.
In addition, to evaluate the adequacy of the chosen variables, a cross-validation (Efron and Tibshirani, Reference Efron and Tibshirani1998) was performed with 2000 simulations using the nonlinear least squares function of R (R Development Core Team, 2015) and the packages ‘boot’ and ‘mass’. For each simulation, the original database was randomly divided into two new subsets, that were approximately of the same size. The first subset (training subset) was used to obtain the equations and the second subset (testing subset) was used to test the equations to obtain the adequacy statistics. After each simulation, the data set was reorganized, and the processes repeated 2000 times to take the average of the adequacy statistics.
These results were used to estimate the accuracy and precision of the developed equations through the mean square error of prediction (MSEP), concordance correlation coefficient (CCC), and R 2. The MSEP was decomposed in three main sources of variation: (1) mean bias, that represents a central tendency of deviation; (2) systematic bias, that represents the deviation of the slope from 1; and (3) random error, that represents the variation that is not explained by the regression (Tedeschi, Reference Tedeschi2006). The CCC was used to access, simultaneously, model accuracy and precision and was decomposed into correlation coefficient estimate (ρ) that estimates model precision and bias correction factor (C b ) that indicates accuracy. In addition, the location shift, scale shift, standard deviation of estimated CCC were calculated according to Lin (Reference Lin1989). Values of CCC, ρ and C b ranging from 0 to 1, where values close to 1 indicate precise and/or accurate models (Lin, Reference Lin1989; Tedeschi, Reference Tedeschi2006).
In addition, a bootstrap analysis was carried out to estimate the bias associated with each parameter estimate. The bootstrap analysis consisted of building a pseudo-database by replicating and resampling the original database n times and summarizing the outcome (Davison et al., Reference Davison, Hinkley and Young2003). We performed 2000 simulations to estimate the bias based on independent observations. The bootstrap analysis was also carried out using the software R (R Development Core Team, 2015) and the package ‘boot’ (Davison and Hinkley, Reference Davison and Hinkley1997).
Results and discussion
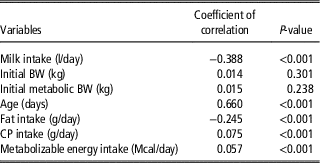
The Pearson correlation coefficients of the different parameters associated with SFI are presented in Table 3. There was no correlation between SFI and birth BW or BWb 0.75. The SFI was negatively correlated with MI, suggesting that SFI is lower when greater amounts of milk are offered, even after the first weeks of life (Hill et al., Reference Hill, Bateman, Aldrich, Quigley and Schlotterbeck2010 and Reference Hill, Bateman, Aldrich and Schlotterbeck2013; Miller-Cushon et al., Reference Miller-Cushon, Bergeron, Leslie and DeVries2013a). In contrary, age was highly positively correlated with SFI, which is mainly due to gastrointestinal tract development, which increases SFI capacity with age and size (Silva et al., Reference Silva2015). Gelsinger et al. (Reference Gelsinger, Heinrichs and Jones2016), in a meta-analysis with treatment means of nine studies, reported a correlation of −0.82 between SFI and MI. According to the linear relationship those authors reported that an increase of 100 g in liquid feed DMI corresponded to a 66 g reduction in solid feed DMI. However, according to our results, an exponential relationship between SFI and MI was observed, which is also affected by animal age. In our case, an increase of 100 g in liquid feed DMI corresponds to a 13 g/day decrease in SFI for a calf 30 days old, and close to 93 g/day for a calf 60 days old.
Pearson’s correlation coefficients between several factors and starter feed intake of preweaned dairy calves

Besides MI and age, several other variables have been reported as potential influencers of SFI, such as performance (ADG), which has been associated with intake of growing heifers and finishing rams (Vieira et al., Reference Vieira, Pereira, Azevêdo, Neves, Chizzotti, Santos, Araújo, Mistura and Chaves2013; Oliveira and Ferreira, Reference Oliveira and Ferreira2016), the composition of starter feed (Kuehn et al., Reference Kuehn, Otterby, Linn, Olson, Chester-Jones, Marx and Barmore1994; Yavuz et al., Reference Yavuz, Todorov, Ganchev and Nedelkov2015) and the composition of liquid feed (primarily protein and fat content) (Hill et al., Reference Hill, Knowlton, Daniels, James, Pearson, Capuco and Akers2008; Stamey et al., Reference Stamey, Janovick, Kertz and Drackley2012). The adverse effects of protein and fat intake on SFI are, primarily, due to changes in daily metabolizable energy intake (Hill et al., Reference Hill, Knowlton, Daniels, James, Pearson, Capuco and Akers2008; Kertz and Loften, Reference Kertz, Prewitt and Everett2013). However, although statistically highly significant (P<0.001), total daily protein and metabolizable energy intakes showed a very low positive association with SFI (Table 3), while daily fat intake presented a low negative correlation with SFI (r=−0.24; Table 3).
Nevertheless, it was not possible to include any of these variables in our model of SFI, because of the high correlation between them and MI. Because of the high correlation between MI and ADG (0.96), fat intake (0.84), protein intake (0.87) and metabolizable energy intake (0.89), only MI was retained in our model.
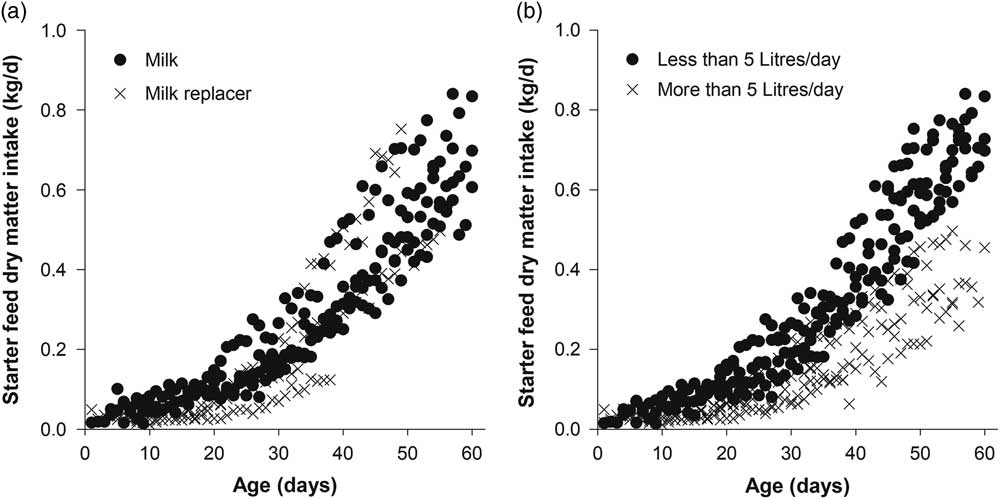
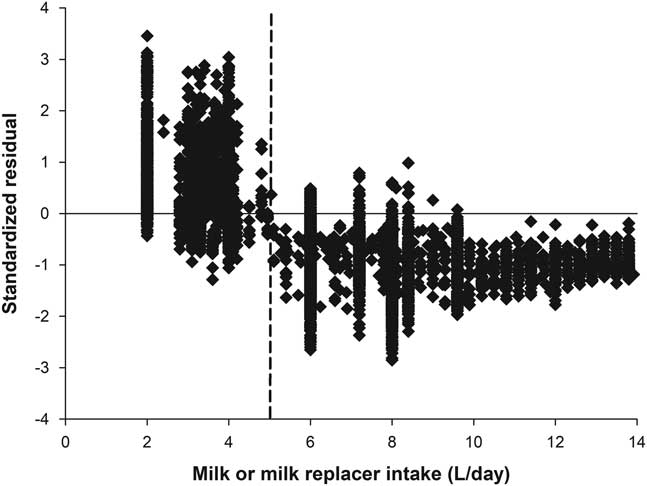
Effects of liquid feed source (milk or milk replacer) were not observed (P>0.05) for any of the equation parameters (Figure 1a). The graphical dispersion of the standardized residual of SFI indicated the impossibility to use a single equation to predict SFI for all scenarios, as the single model under-predicted SFI for calves feeding <5 l/day of milk or milk replacer, and over-predicted SFI for calves feeding more than this amount of liquid feed (Figure 2). The distribution of the standardized residual SFI showed high variability for calves consuming <5 l/day of milk/milk replacer (Figure 2). A similar pattern was observed by Gelsinger et al. (Reference Gelsinger, Heinrichs and Jones2016), reporting greater variability in SFI for calves consuming <0.8 kg/day DM from liquid feed (around 6 l/day of fluid milk/milk replacer). Moreover, the different course of SFI over time between calves consuming less or more than 5 l/day of milk/milk replacer (Figure 1b) contributed to the impossibility to use a single model to predict SFI.
Average daily starter feed intake by experiments for preweaned dairy calves that received milk or milk replacer as liquid feed (a) and consuming less or more than 5 l/day of milk or milk replacer (b).

Graphical dispersion of standardized residual according to milk or milk replacer intake for a single model to predict starter feed intake for preweaned dairy calves.

Therefore, two equations were developed to predict SFI for calves that receive <5 l/day (SFI<5) or >5 l/day (SFI>5) of milk/milk replacer, as follows (Parameter±SEM):
 $$\eqalign{{\rm SFI}_{{\,\lt5}} \,{\equals}\,0.1839_{{\,\pm 0.0581}} {\times}{\rm MI} \cr \,\,\,\,\,{\times}{\rm exp}^ {\left(\big( {^{{0.0333}} _{{\,\,\,\,\,\,\,\,\,\,\,\,\,\,\,\,\pm0.0021}} {^{\minus}\,^{\!\!0.0040}}} _{{\,\pm0.0011}} {}^{{{\times}\,{\rm MI}}}} \right){{\times}} \big ( {^{{A{\minus}}} \big( {^{{0.8302\,\pm\,}} _{\,\,\,\,\,\,\,\,\,\,\,\,\,\,\,\,\,\,\,\,\,\,{0.5092}} {^{{\plus}6.0332}} _{{\,\pm0.3583}} ^{{{}^{\,\,\,\,\,\,\,\,\,\,\,\,\,\,\,\,\,\,\,\,\,\,\,\,{{\times}\,{\rm MI}}}}} } \big )} \big)\big)} \cr \,\,\,\,\,{\minus}(0.12{\times}{\rm MI});\,$$
 $$\eqalign{{\rm SFI}_{{\,\gt5}} \,{\equals}\,0.1225_{{\,\pm0.0005}} {\times}{\rm MI} \cr \,\,\,\,\,{\times}{\rm exp}^ {\left(\big( {^{{0.0217}} _{{\,\,\,\,\,\,\,\,\,\,\,\,\,\,\,\,\pm0.0006}} {^{{{\minus}0.0015}}} _{{\,\pm0.0001}} {}^{{{\times}\,{\rm MI}}}} \right){{\times}} \big ( {^{{A{\minus}}} \big ( {^{{3.5382\,\pm\,}} _{\,\,\,\,\,\,\,\,\,\,\,\,\,\,\,\,\,\,\,\,\,\,\,{1.3140}} {^{{{\plus}1.9508}}} _{{\,\pm0.1710}} ^{{{}^{{\,\,\,\,\,\,\,\,\,\,\,\,\,\,\,\,\,\,\,\,\,\,\,\,{\times}\,{\rm MI}}}}} } \big)} \big ) \big )} \cr \,\,\,\,\,{\minus}(0.12{\times}{\rm MI});$$
where MI is the milk or milk replacer intake (l/day) and A the age (days).
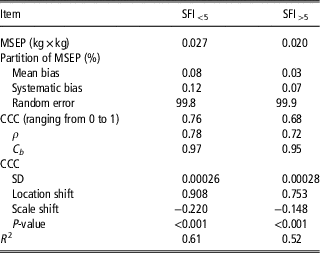
The cross-validation analysis indicated a very high accuracy for both equations through the C b values of 0.97 and 0.95 for SFI<5 and SFI>5, respectively (Table 4). In addition, the partition of MSEP indicated a low error of prediction directly associated with the fixed variables because the most of the error of prediction was associated with random errors (99.8% and 99.9% for SFI<5 and SFI>5, respectively).
Adequacy parameters of the equations to predict starter feed intake (SFI) as obtained with the cross-validation technique

MSEP=mean square error of prediction; CCC=concordance correlation coefficient; ρ=correlation coefficient estimate; C b =bias correction factor; SFI<5 and SFI>5=starter feed intake prediction for calves that receive <5 and >5 l/day of milk or milk replacer, respectively.
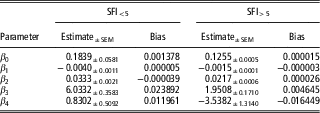
In agreement with the cross-validation, small biases were observed with the bootstrap analyses (Table 5), indicating that variables were consistent and sufficient to predict SFI for both equations (Marcondes et al., Reference Marcondes, Pereira, Chagas, Filgueiras, Castro, Costa, Sguizzato and Sainz2012). The equations presented a moderate precision with R 2 values of 0.61 and 0.52, and ρ values of 0.78 and 0.72, for SFI<5 and SFI>5, respectively, that yielded moderate to high CCC values (Table 4). The high accuracy demonstrated by the equations demonstrates their adequacy, as that is the most important measure of goodness of fit, and represents the model’s ability to predict actual values (Tedeschi, Reference Tedeschi2006).
Parameters of the equations to predict starter feed intake (SFI) and their biases as estimated by bootstrap analysis

β 0, β 1, β 2, β 3 and β 4=estimated parameters of the predictive equations; SFI<5 and SFI>5=starter feed intake prediction for calves that receive <5 and >5 l/day of milk or milk replacer, respectively.
In conclusion, the SFI of dairy calves up to 64 days of age increases exponentially with age. The rate of increase is greater for calves consuming <5 l milk/day than for calves consuming more than 5 l milk/day, but is independent of the source of liquid feed. Overall, the results of the models’ adequacy indicate that both models have great potential to predict SFI for suckling dairy calves, presenting moderate precision and very high accuracy. In addition, as diets and management of these animals are very similar across the world, the use of these models may be applied to most common rearing conditions. However, we highlight the necessity to conduct studies using a greater number of animals and studies, which may allow to evaluate other variables like sex and breed that were limited in our study.
Acknowledgments
The authors are grateful to those who originated the studies that were used in the database and for sharing data. Research conducted at the Universidade Federal de Viçosa were funded by Coordenação de Aperfeiçoamento de Pessoal de Nível Superior (CAPES), Conselho Nacional de Desenvolvimento Científico e Tecnológico (CNPq), Fundação de Amparo à Pesquisa do Estado de Minas Gerais (FAPEMIG) Instituto de Ciência e Tecnologia de Ciência Animal (INCT-CA). Research conducted at the University of Guelph was funded through a Natural Sciences and Engineering Research Council of Canada (NSERC, Ottawa, ON, Canada) Discovery Grant (T. J. DeVries).
Declaration of interest
None.
Ethics statement
None.
Software and data repository resources
None.
Supplementary material
To view supplementary material for this article, please visit https://doi.org/10.1017/S1751731118000666