I. INTRODUCTION
Development of new metallic biomaterials has traditionally focused on improving their longevity. Recent trends observed a paradigm shift, with absorbable metallic alloys intentionally designed to degrade inside the human body over time. Reference Staiger, Pietak, Huadmai and Dias1–Reference Kraus, Fischerauer, Hänzi, Uggowitzer, Löffler and Weinberg4 Notable research on the Mg–Zn–Ca ternary system Reference Zberg, Uggowitzer and Löffler5–Reference Xie, Wang, Wang, Zhang, He, Zheng and Qin12 showed promise for this system's deployment as temporary implant material and has attracted the attention of both the research community and industry. One of the challenges in this context is to simultaneously achieve high strength and high ductility in these absorbable alloys. Here fine-grained microstructures with grain sizes in the micron range were shown to be ideal for magnesium-based alloys, Reference Hänzi, Sologubenko, Gunde, Schinhammer and Uggowitzer13–Reference Hofstetter, Rüedi, Baumgartner, Kilian, Mingler, Povoden-Karadeniz, Pogatscher, Uggowitzer and Löffler15 as this enables Hall–Petch strengthening while allowing for nonbasal slip and grain-boundary sliding. Fine-grained Mg alloys have also been reported to degrade slower in biocorrosion environments. Reference Lu, Bradshaw, Chiu and Jones16,Reference Ralston and Birbilis17 As such, a strategy to engineer second-phase particles to pin the grain boundaries during thermomechanical processing has exhibited up to 27% elongation to fracture and up to 240 MPa yield strength. Reference Hofstetter, Becker, Martinelli, Weinberg, Mingler, Kilian, Pogatscher, Uggowitzer and Löffler6 For any alloy design strategy based on intermetallic phases, a reliable phase diagram in the parent system is critical because it would underpin alloy design and processing optimization to achieve the desired properties.
Interestingly, for the Mg–Zn–Ca alloy system there appears to be a lack of understanding with regard to the existence and confirmation of the ternary intermetallic phase/s. The earliest work on the Mg–Zn–Ca system was performed in 1934 by Paris, Reference Paris18 who produced 215 alloys within this system, 187 of which were ternary alloys. A “large polygonal” ternary phase with a composition of Ca2Mg5Zn5 was reported. In 1961 Clark Reference Clark19 prepared 76 key alloys in the Mg–Zn–Ca system through casting and subsequent heat treatment at 335 °C. Clark did not observe the Ca2Mg5Zn5 phase, but instead reported two new ternary phases: (β) Ca2Mg6Zn3 and (ω) Ca2Mg5Zn13. The diffraction data accompanying these two new ternary phases were filed with the Joint Committee on Powder Diffraction Standards [12-0266 (Ref. Reference Clark20) and 12-569 (Ref. Reference Clark21)], but no structural data were reported.
Recent efforts by Larionova et al. Reference Larionova, Park and You22 in 2001 and Jardim et al. Reference Jardim, Solórzano and Sande23,Reference Jardim, Solórzano and Sande24 in 2002 claimed to have confirmed the existence of this β Ca2Mg6Zn3 phase. Larionova Reference Larionova, Park and You22 aimed to develop magnesium alloys for high-temperature structural applications, where melt-spun ribbons of Mg–Zn–Ca alloys with up to 4.25 at.% of Zn and up to 3.19 at.% of Ca were produced. The identification of the ternary intermetallic phase was based on x-ray diffraction (XRD) peaks which were found to closely match the peak positions of the reference data for the Ca2Mg6Zn3 phase reported by Clark. Reference Clark20 Jardim et al. Reference Jardim, Solórzano and Sande23,Reference Jardim, Solórzano and Sande24 intended to characterize the crystallographic structure of the ternary phase in question. Because it became evident that XRD did not provide sufficient signal to reliably identify the phases in their melt-spun ribbon (Mg–1.5Ca–6Zn), transmission electron microscopy (TEM)-based techniques were subsequently applied. This approach was undermined by a critical assumption: TEM energy-dispersive x-ray spectroscopy (EDX) analysis observed a ternary phase with a composition of Ca23.2±1Mg43.8±3.3Zn33±2.4, which is roughly equivalent to Ca2Mg4Zn3. However, this ternary phase was identified as Ca2Mg6Zn3, based on the assumption that “the closest compound found in the literature was Ca2Mg6Zn3”. Reference Jardim, Solórzano and Sande23 Numerous researchers have since come to similar conclusions based on the same assumption that Ca2Mg6Zn3 is the most common ternary phase. Reference Bakhsheshi-Rad, Abdul-Kadir, Idris and Farahany8,Reference Lu, Bradshaw, Chiu and Jones16,Reference Oh-ishi, Watanabe, Mendis and Hono25,Reference Naghdi and Mahmudi26 Critical analysis of these publications revealed that the work by Clark Reference Clark19 had an immense influence on the outcomes of later research concerning identification of the ternary phase as Ca2Mg6Zn3.
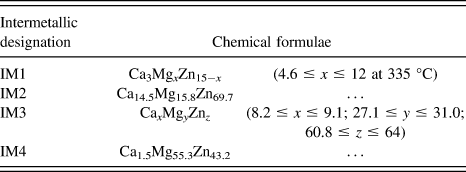
Most recently, work of Zhang et al. Reference Zhang, Kevorkov, Bridier and Medraj27–Reference Zhang, Kevorkov, Liu, Bridier, Chartrand and Medraj29 suggested the existence of four intermetallics, IM1-4 (Table I). These were derived through a series of experiments involving 9 diffusion couples and 32 key samples in the Mg–Zn–Ca ternary system. Analysis of 6 key alloys [green triangles in Fig. 1(b)] observed extended solid solubility ranges in IM1. The impact of Zhang's work is significant, because the composition range of the proclaimed IM1 encompasses both that of Ca2Mg5Zn5 and Ca2Mg6Zn3.
Intermetallic phases IM1-4, reported by Zhang et al. Reference Zhang, Kevorkov, Li, Essadiqi and Medraj28

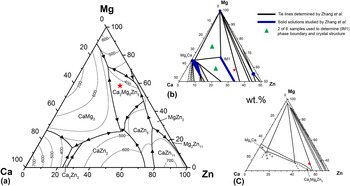
The key alloy composition (12.40 at.% Ca, 58.15 at.% Mg, and 29.45 at.% Zn), red star, marked in the Mg–Zn–Ca ternary phase diagram published by (a) Villars (based on the data of Paris Reference Paris18 ); (b) Zhang (335 °C isothermal sections) Reference Zhang30 ; and (c) Clark Reference Clark19 (in wt%). According to these reports, the selected key alloy composition (red star) would be located within three different phase fields.
The works of Clark Reference Clark19 and Zhang Reference Zhang30 set out specifically to investigate the thermodynamic phase equilibria in the Ca–Mg–Zn ternary system, and are essential to our current understanding of this system. It is worth noting, however, that their analyses were based on experimental data collected from samples at 335 °C only. Samples from Clark Reference Clark19 were cast, then heat-treated at 335 °C for 500 h, and Zhang Reference Zhang30 prepared numerous diffusion couples by heat treatment at 335 °C for 4 wk. Nevertheless, no consensus has been reached regarding the composition of the ternary equilibrium Mg–Zn–Ca intermetallic phase.
In the present work we produced a ternary alloy of composition Mg58.15Zn29.45Ca12.40, by controlled cooling of the melt using a gradient Bridgman setup. The very slow cooling rate achieved by this method, coupled with stable temperature control, can approximate equilibrium cooling conditions. Thus, this method produced an equilibrium microstructure consisting of large polygonal grains, which were analyzed using electron microscopy, EDX, and both single-crystal and powder XRD. Below we report on the crystal structure, composition, and diffraction pattern of the resulting ternary Mg–Zn–Ca intermetallic phase.
II. EXPERIMENTAL METHODS
To allow sufficient time for grain growth, slow and controlled cooling was achieved using a gradient Bridgman induction furnace. The alloy with a nominal composition of 12.40 at.% Ca, 58.15 at.% Mg, and 29.45 at.% Zn (marked as a red star in Fig. 1) was produced first by melting the constituent elements, Mg (99.99 wt% purity, ChemCo GmbH, Bad Soden-Salmünster, Germany), Zn (99.99 wt%, Alfa Aesar GmbH, Karlsruhe, Germany), and Ca (97 wt%, Alfa Aesar GmbH), within a graphite crucible in an induction oven, followed by gravity copper mold casting. All steps were performed under inert argon atmosphere (6 N purity). Specimens of the as-cast sample were analyzed via differential scanning calorimetry (DSC 220C, Seiko Instruments GmbH, Neuisenburg, Germany), using heating and cooling rates of 10 K/min, to detect the associated phase transitions. The remaining as-cast rod was then placed into another graphite crucible, with an iron initiator located at the bottom. The combined vessel was sealed in a quartz tube under argon, and the sample was allowed to grow vertically in the gradient Bridgman setup. The upper and lower ends of the temperature gradient were selected as 600 °C and 335 °C, respectively, and a growth speed of 1 mm/h was chosen. This produced the first phases to precipitate from the melt in sufficiently large grain sizes. Phase compositions were determined using EDX elemental analyses via both scanning electron microscopy (SEM; Hitachi SU-70, Hitachi Corp., Tokyo, Japan), sampling multiple grains, and transmission electron microscopy (TEM; FEI Tecnai F30, FEI Company, Hillsboro, Oregon). XRD experiments were carried out on powder samples (STADI diffractometer, Stoe GmbH, Darmstadt, Germany; Debye-Scherrer geometry; position-sensitive detector; Cu-Kα1 radiation) and on large single grains (Xcalibur, Oxford Diffraction, Oxford, United Kingdom; Onyx charge-coupled device detector; MoKα radiation) to characterize the ternary intermetallic crystal structure. Selected area diffraction patterns (SADPs) were obtained using an FEI Talos F200A (FEI Company) operated at 80 kV to minimize beam damage. The SADPs were matched against those simulated by jEMS software, Reference Stadelmann31,32 based on the proposed crystal unit cell.
III. RESULTS AND DISCUSSION
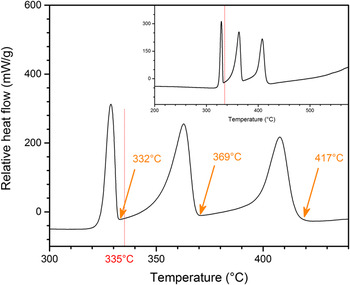
Figure 1 shows the nominal composition of the alloy studied relative to the phase fields determined in the literature; based on this, the key alloy composition chosen in this study falls within the Ca2Mg5Zn5, Ca2Mg6Zn3, and IM1 phase fields according to the respective Mg–Zn–Ca phase diagrams published by Paris, Reference Paris18 Clark, Reference Clark19 and Zhang. Reference Zhang30 Newer Mg–Zn–Ca phase diagrams do exist, Reference Brubaker and Liu33–Reference Wasiur-Rahman and Medraj35 but these were derived via computational optimizations based on the experimental data of Paris, Clark, and Zhang. Thus only those experimental phase diagrams are shown in Fig. 1. DSC analysis from 150 to 650 °C (Fig. 2) revealed three distinct exothermic peaks, which were expected to be, in decreasing order, the liquidus temperature, the eutectic temperature where the ternary phase–Mg lamellae begin to form, and the eutectoid transformation temperature of Mg7Zn3 → MgZn + Mg. Reference Clark19,Reference Thaddeus, Massalski, Subramanian and Kacprzak36 The determined liquidus temperature of 417 °C is in line with the value compiled by Villars, Reference Villars, Prince and Okamoto37 which is largely based on the work of Paris, Reference Paris18 and is also similar to the 400 °C determined through thermal analysis during solidification of Mg–0.5Ca–xZn (x = 0.5, 1 and 3). Reference Bakhsheshi-Rad, Abdul-Kadir, Idris and Farahany8 Most critically, the DSC analysis reveals that obvious phase transitions occur at temperatures above 335 °C. This observation supports past studies by Zhang Reference Zhang, Kevorkov, Li, Essadiqi and Medraj28,Reference Zhang, Kevorkov, Bridier and Medraj38 and Clark, Reference Clark19 which used diffusion couples annealed at 335 °C to explore the ternary Mg–Zn–Ca equilibrium phase diagram. At higher annealing temperatures, a liquid phase may exist (see eutectic temperature determined in Fig. 2) which would complicate the interpretation of the diffusion couple experiments. Reference Kodentsov, Bastin and van Loo39
Representative DSC cooling curve at a rate of 10 K/min for Mg58.15Zn29.45Ca12.40, showing distinct exothermic peaks with onsets at 417, 369, and 332 °C. The inset illustrates that the peaks shown were the only exothermic events throughout the temperature range.

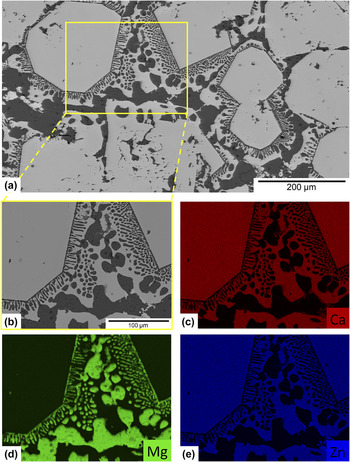
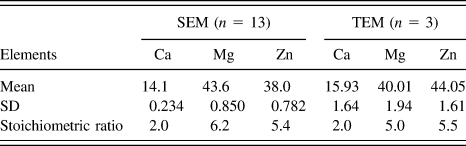
Microstructural analysis identified the phase transitions associated with each exothermic peak in the DSC trace. Using upper and lower temperatures of 600 °C and 335 °C, respectively, the gradient Bridgman method produced a rod sample with large polygonal crystals of between ∼100 and 500 µm in size that formed a quasibinary with the α-Mg matrix (Fig. 3). Thus the two high-temperature exothermic peaks in Fig. 2 were determined as the liquidus and eutectic temperatures. A selected area was subsequently mapped using EDX [Figs. 3(c)–3(e)], which confirmed that the large polygonal grains (bright phase) in the backscattered electron (BSE) image is the ternary intermetallic, and the dark phase in the BSE image is Mg (with Zn in solid solution). A number of additional grains were selected throughout the sample and analyzed by both SEM and TEM EDX to determine their compositions. All of these readings were consistent throughout the sample, and are tabulated including statistics in Table II. Despite the slightly higher Mg value in SEM EDX and the slightly higher Zn value in TEM EDX, these data show similar atomic concentrations of Mg and Zn, resulting in stoichiometric ratios of ∼Ca2Mg5Zn5. We therefore refer to this phase as Ca2Mg5Zn5. The Zn content in α-Mg is approximately 2.42 at.% (averaged from 5 SEM EDX readings), which is very close to the 2.4 at.% reported as the maximum solid solubility of Zn in Mg at 340 °C. Reference Villars, Prince and Okamoto37
(a) BSE image obtained from SEM. (b) Magnified area of image (a), on which elemental mapping was performed to investigate (c) Ca, (d) Mg, and (e) Zn.

EDX SEM and EDX TEM elemental analysis of the grains within the Mg58.15Zn29.45Ca12.40 sample prepared; n gives the number of measurements that generated a mean value with standard deviation (SD). All values are given in at.%.

It is worth emphasizing that no significant composition difference was observed across the individual grains. Although this work did not establish the solubility limits of Ca2Mg5Zn5, work by Zhang Reference Zhang, Kevorkov, Li, Essadiqi and Medraj28,Reference Zhang30,Reference Zhang, Kevorkov, Bridier and Medraj38 suggested that the Zn and Mg contents in IM1 Ca3Mg x Zn15−x (4.6 ≤ x ≤ 12 at 335 °C) could each vary by up to 41.1 at.%, thus making Ca2Mg5Zn5 a possible variation of IM1 (when x = 7.5, IM1 = Ca3Mg7.5Zn7.5 or Ca2Mg5Zn5). This observed difference was attributed to sample preparation methods, whereby the current method produced the equilibrium microstructure at 335 °C by controlled cooling of the alloy from its liquid state. The failure to obtain Ca2Mg5Zn5 using diffusion couple experiments reaffirmed the known limitations of such methods, where the absence of certain phases may be due to difficulties in nucleation, or quasiequilibrated diffusion zones may have formed instead of the real equilibrium phase. Reference Kodentsov, Bastin and van Loo39
Microstructural analysis of the current study revealed large polygonal grains of Ca2Mg5Zn5 and eutectic (Ca2Mg5Zn5 + Mg) lamellae. According to Zhang, Reference Zhang, Kevorkov, Li, Essadiqi and Medraj28 the same alloy composition would also generate a microstructure consisting of IM1 (encompassing Ca2Mg5Zn5) + Mg. Distinctions must be made between these claims, and we therefore utilize the refined crystal structure parameters. Rietveld refinement of the XRD patterns for IM1 Reference Zhang, Kevorkov, Li, Essadiqi and Medraj28 showed that this solid solution crystallizes in a hexagonal structure having a P63/mmc (194) space group with Sc3Ni11Si4 prototype. These data should, however, be viewed with caution, as the suggested structure model had an increasingly worsening reliability factor, starting with R wp = 15.8% (for IM1 = Ca3Mg12Zn3) and reaching 20.5% (for IM1 = Ca3Mg7.8Zn7.2) and 19.6% (for IM1 = Ca3Mg7.6Zn7.4) Reference Zhang, Kevorkov, Li, Essadiqi and Medraj28 ; the latter two IM1 compositions are very close to ∼Ca2Mg5Zn5. Due to the poor structural fit, we thus carried out our own structure determination plus refinement work.
The crystal structure of Ca2Mg5Zn5 was determined using single-crystal XRD methods. Six large grains of ∼100 µm in size were mechanically removed from the bulk sample and measured, and only the data from the highest quality grain was used in the later refinement steps. Ca2Mg5Zn5 was found to be hexagonal with lattice parameters of a = 9.5949(3) Å, c = 10.0344(3) Å, and space group P63/mmc. Structure solution and refinement were solved from scratch with direct methods using the SHELX97 software package.
Reference Sheldrick40
Results are shown in Table III [further details of the crystal structure investigation(s) may be obtained from FIZ Karlsruhe, 76344 Eggenstein-Leopoldshafen, Germany (fax: (+49) 7247-808-666; e-mail: crysdata@fiz-karlsruhe.de, on quoting the deposition number CSD-429847)]. The solved structure can be described as an Sc3Ni11Si4 type, as already reported in the literature,
Reference Zhang, Kevorkov, Li, Essadiqi and Medraj28
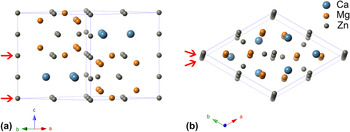
but with additional Zn atoms, Zn(5) (see Fig. 4), at the symmetry-related sites (0,0,0) and (0,0,0.5). While the past investigation used powder XRD
Reference Zhang, Kevorkov, Li, Essadiqi and Medraj28
with the assumption of a Sc3Ni11Si4 prototype, the structure in this study was solved from single crystals with no prior assumptions. The initially ordered model showed unsatisfactory R-values and unusual large atomic displacement parameters (ADPs) for the Zn atoms, which indicated the presence of disorder. Because Mg and Zn may replace each other due to their similar bond distances,
Reference Senkov, Miracle, Barney, Hannon, Cheng and Ma41
the possibility of mixed Mg/Zn sites was considered for all Zn and Mg positions. The refinement results, however, clearly indicated the absence of any substitutional or occupational disorder for Zn(1) and Mg(6). For Zn(4) and Zn(5) the possibility of mixed occupied Mg/Zn sites was deemed unreasonable because their interatomic distance is only 2.51 Å, which is very short even for Zn–Zn pairs. Substitution of Zn by larger Mg atoms was therefore ruled out and only under-occupied Zn was examined for these sites. For Zn(2)/Mg(2) and Zn(3)/Mg(3) mixed parameters could be successfully modeled. The final disorder model clearly improved the fit: the SHELXL program specific R-values
Reference Sheldrick40
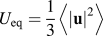
dropped from R1 = 9.0%, wR2 = 28.3% for the initial ordered model to R1 = 4.8%, wR2 = 9.7%. The ADPs of the Zn atoms are still relatively large, but this can be easily explained by size-effect distortions caused by substitutional or occupational disorder. The refined composition of the structure is Ca16.0Mg42.0Zn42.0, which is very close to the findings obtained by EDX (Table II). List of (a) atomic coordinates and occupancies; and (b) ADPs from the single-crystal refinement of Ca2Mg5Zn5, where
 ${U_{{\rm{eq}}}} = {1 \over 3}\left\langle {\mathop {\left| {\bf{u}} \right|}\nolimits^2 } \right\rangle$
is the equivalent isotropic displacement parameter, u describes the instantaneous displacement, and U
ij
are the respective elements of the mean-square displacement tensor.

The crystal structure of Ca2Mg5Zn5 as viewed (approximately) along the (a) [110] and (b) [001] directions. Zn atoms not belonging to the Sc3Ni11Si4 structure type are marked by red arrows.

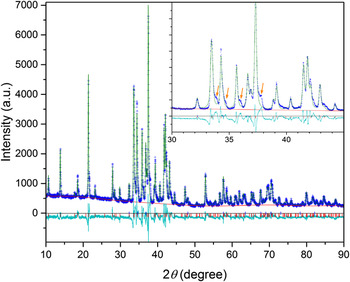
Powder XRD was carried out to test whether the selected grain for the single-crystal structure refinement was representative of the bulk sample. Approximately 5 g of the sample was ground into fine powder, and underwent XRD scanning from 10 to 90°. Peaks from Ca2Mg5Zn5, matched by the lattice parameters determined by the single-crystal x-ray experiment, were found to dominate the diffraction pattern. Reflections from elemental Mg were also identified. Rietveld refinement with a starting model taken from the single-crystal investigation gave a reasonable fit (see Fig. 5) and essentially confirmed the single-crystal results. Furthermore, the lattice parameters and atomic coordinates of Ca2Mg5Zn5 from single-crystal and powder refinements differed only by a few 0.01 Å, the site occupation factors agreed within 5%, and the total composition could be reproduced with deviations of less than 1% for each element. The Zn content in the Mg phase was found to be 3.4 at.%, which is also in good agreement with the EDX measurements mentioned above. However, it should be noted that the four shoulders (indicated by arrows in Fig. 5) could not be identified. This may be the result of unidentified phase(s), but considering that these shoulders were only observed near the strongest reflections, and that there were no other unidentified peaks, it is likely that they were caused by strain effects, particle size effects, oxidation of the powder, or a combination of these. The affected volume fraction is estimated to be a few percent. The Rwp value of the Rietveld full pattern fit was 11.3%. It is well-known that powder XRD refinements are less reliable than single-crystal investigations, and that this is particularly true in the presence of disorder and unidentified phases. Therefore we only report single-crystal refinement results here.
Results from the Rietveld refinement of the powder sample. Blue symbols: observed (experimental) intensities; green line: calculated intensities; turquoise line: I obs − I calc; red line: estimated background. Blue and red markers indicate reflection positions of the two refined phases. Arrows in the inset show some unidentified shoulders which may have resulted from variations in strain and particle size, or minor oxidation of the powder.

Because the structural information on Ca2Mg5Zn5 was determined from scratch using single-crystal XRD and reported here for the first time, TEM SADP analysis was performed to match the experimental patterns obtained from the key alloy (Ca12.40Mg58.15Zn29.45) with those simulated by jEMS, using the structural information from Table III. Visual comparisons between the experimental and simulated SADPs are presented in Fig. 6, for the zone axes (a)
 $\left[ {0001} \right]$
, (b)
 $\left[ {2\bar 1\bar 16} \right]$
, (c)
 $\left[ {10\bar 12} \right]$
, and (d)
 $\left[ {2\bar 1\bar 13} \right]$
. Note that images are presented in inverted contrast for better readability and that the size of the diffraction spots in the simulated patterns is proportional to their intensity. There appears to be an excellent match between the experimental and simulated patterns for all zone axes considered, confirming the identification of the new phase obtained from XRD. In Fig. 6(d), double diffraction from the Mg matrix and Ca2Mg5Zn5 was considered, where the red diffraction spots in the simulated pattern resulted from the Mg matrix. When viewed together with the diffraction pattern of Ca2Mg5Zn5, there was also good agreement between the experimental and simulated patterns thus confirming the derived structure for Ca2Mg5Zn5.
SADPs, in inverted contrast, of Ca2Mg5Zn5 crystals observed in the key alloy Ca12.40Mg58.15Zn29.45. Four different crystallographic directions are shown: (a)
 $\left[ {0001} \right]$
, (b)
 $\left[ {2\bar 1\bar 16} \right]$
, (c)
 $\left[ {10\bar 12} \right]$
, and (d)
 $\left[ {2\bar 1\bar 13} \right]$
. The experimental SADPs are shown next to their corresponding simulated patterns using jEMS (displayed in blue frames).

The experimentally obtained ternary phase from equilibrium cooling, Ca2Mg5Zn5, and the subsequent refinement of its structure may have a profound impact on our understanding of the Mg–Zn–Ca system, which has largely been based on thermodynamic calculations. For example, the computational thermodynamic model developed by Brubaker and Liu Reference Brubaker and Liu33 abandoned Ca2Mg5Zn5 and assumed Ca2Mg6Zn3 to be the only ternary intermetallic phase in the system. Alternative CALPHAD models Reference Mezbahul-Islam, Zhang, Shekhar and Medraj34,Reference Wasiur-Rahman and Medraj35 considered up to four different ternary phases. In light of the new experimental data reported here, further CALPHAD optimization studies are suggested to determine the potential impact of the Ca2Mg5Zn5 ternary intermetallic phase on the calculated Mg–Zn–Ca ternary system. This may also have important consequences for the development of new high strength, highly ductile, and biodegradable MgZnCa alloys. Reference Hofstetter, Becker, Martinelli, Weinberg, Mingler, Kilian, Pogatscher, Uggowitzer and Löffler6
IV. SUMMARY
A ternary Mg–Zn–Ca alloy with 12.40 at.% Ca, 58.15 at.% Mg, and 29.45 at.% Zn was successfully synthesized by controlled cooling of the melt, with its composition deliberately chosen to lie within various disputed phase fields. Microstructural analysis revealed large polygonal grains determined by EDX to be Ca2Mg5Zn5, which appears to exist as a quasibinary with α-Mg. DSC suggests that this ternary phase forms at ∼417 °C, and XRD determined the Ca2Mg5Zn5 phase to be of hexagonal structure, space group P63/mmc, with lattice parameters of a = 9.5949(3) Å and c = 10.0344(3) Å. Parametric refinement clearly improved the data fit, resulting in a composition of Ca16.0Mg42.0Zn42.0, very close to the Ca2Mg5Zn5 reported. TEM (SADP) also confirmed the derived structure for Ca2Mg5Zn5.
ACKNOWLEDGMENTS
The authors thank Erwin Fischer (LMPT, ETH Zurich) for help with the sample preparation, Peter Uggowitzer (LMPT, ETH Zurich) for fruitful discussions, and Fiodar Kurdzesau (Laboratory of Crystallography, ETH Zurich) for performing the single-crystal x-ray measurements. This work was funded by the Laura Bassi Center of Expertise (BRIC, Bioresorbable Implants for Children), FFG, Austria, and by an ETH Research Grant (ETH-41 13-2).