Introduction
Parkinson’s disease (PD) is the second most common neurodegenerative disorder, affecting 1% of the population above 60 years of age. PD is characterized by bradykinesia, rigidity, tremor, and postural instability.Reference Gelb, Oliver and Gilman 1 The cardinal pathological features of PD are loss of dopaminergic fibers of the basal ganglia and the presence of Lewy bodies.
PD patients do not respond optimally to pharmacological treatment. In advanced PD, patients experience severe motor fluctuations and dyskinesia despite optimal pharmacological treatment. These complications limit the efficacy of pharmacological treatment and affect the quality of life of PD patients. Deep brain stimulation (DBS), an effective surgical treatment for PD, can improve the cardinal symptoms of PD with fewer complications. The subthalamic nucleus and globus pallidus internus are two common targets for DBS in PD.Reference Limousin, Krack and Pollak 2 , Reference Iacono, Lonser and Maeda 3
The motor effects of DBS mimic those of dopaminergic therapies, which suggests that DBS may act similarly in terms of neuropsychological effects. However, controversy remains about neuropsychological performance changes after DBS and the relative advantages of treatment at the GPi and STN targets. STN DBS is presumed to directly affect cognitive function due to its effect on anatomical data, which play an important role in cognitive and limbic functions,Reference Baunez and Robbins 4 , Reference Temel, Blokland, Steinbusch and Visser-Vandewalle 5 and suboptimal lead placement might be associated with irritation of nearby circuits responsible for neuropsychological functions.Reference Pillon, Ardouin and Damier 6 Other factors that have been considered to contribute to neuropsychological performance changes include the reduction in doses of dopaminergic medications that frequently occurs after surgery,Reference Funkiewiez, Ardouin and Caputo 7 advanced age, and impaired cognitive function at baseline.Reference Rothlind, Cockshott, Starr and Marks 8 Aside from motor functions and quality of life, the neuropsychological performance of PD patients should be assessed as an important outcome of DBS surgery because mood and cognitive functions impact quality of life. Therefore, it is important to predict cognitive deterioration after DBS in order to help choose a suitable DBS target in PD patients.
Multiple reports have shown that DBS is associated with mild improvements in mood and mild cognitive declines in verbal associative fluency, working memory, and learning and recall efficiency.Reference Lang and Obeso 9 , Reference Lang and Obeso 10 In the study by Troster et al.,Reference Troster, Fields and Wilkinson 11 unilateral GPi DBS in nine patients caused a decline in verbal fluency and in visuoconstructional test scores. Studies have reported more cognitive problems after STN compared to GPi DBS and PD controls.Reference Smeding, Speelman, Huizenga, Schuurman and Schmand 12 In the study by Ardouin et al.,Reference Ardouin, Pillon and Peiffer 13 there was no significant change in memory or executive functions 3–6 months after DBS in a series of 62 patients with PD treated with bilateral STN or GPi stimulation. The study by Odekerken et al.Reference Odekerken, van Laar and Staal 14 showed no difference between STN DBS and GPi DBS in composite cognition, mood, and behavior scores. Due to the heterogeneous results of the abovementioned studies and the previously published clinical trials comparing STN DBS and GPI DBS, we performed a systematic review and metaanalysis to precisely compare the two targets in terms of neuropsychological performance.
Methods
We followed the PRISMA statement guidelines during preparation of this review and metaanalysis.
Criteria for considering studies for this review
We used the following inclusion criteria: (1) studies that were randomized controlled trials (RCTs) or quasiexperimental studies; (2) studies where the intervention was either unilateral or bilateral subthalamic deep brain stimulation (STN DBS) compared to unilateral or bilateral globus pallidus deep brain stimulation (GPi DBS); (3) studies reporting on patients with idiopathic Parkinson’s disease suffering from motor fluctuations and not showing an optimal response to pharmacological PD treatments; and (4) studies reporting on such neuropsychological functions as attention, working memory, executive functions, language, and verbal fluency. Studies were excluded if they were not written in the English language or were theses or conference abstracts. In the case of multiple reports, we analyzed data from the most complete dataset. For the quantitative evidence synthesis, only RCTs were pooled in the metaanalysis models to get a more precise effect estimate.
Search strategy
We searched the following medical electronic databases: PubMed, Cochrane CENTRAL Register of Controlled Trials, and the Web of Science, all through October 2015. We employed the following keywords: (“Deep brain stimulation” AND “Parkinson’s disease”).
Selection of studies
Three authors screened the titles and abstracts of retrieved records for eligibility. We then retrieved the full texts of the eligible abstracts, and they were screened for eligibility for our systematic review and metaanalysis.
Data extraction
Three authors extracted the raw data (mean and standard deviation [SD] for each group) independently using a standardized online data extraction form. The extracted data included the following: (1) study design characteristics, (2) characteristics of the study population, (3) risk of bias domains, and (4) study outcomes, including changes in attention and working memory, executive functions, language, verbal function, and depression. Another author (AN) resolved disagreements.
Assessment of risk of bias in included studies
Two authors (AE and AN) independently assessed the quality of each included study in strict accordance with the Cochrane Handbook for Systematic Reviews of Interventions (v. 5.1.0, updated March 2011). We utilized the quality assessment table provided in Chapter 8.5, Part 2, of the Handbook.
Outcome measurement
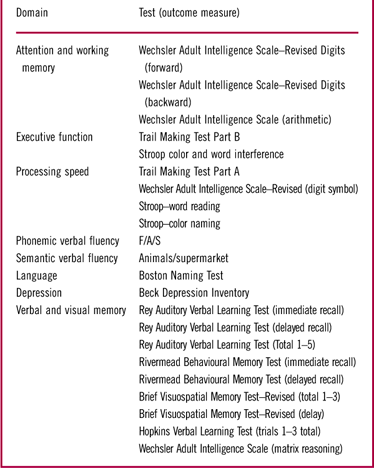
Multiple tests were employed to assess neuropsychological performance in PD patients. These tests are grouped into the relevant domains in Table 1.
Outcome measures of different neuropsychological domains

Dealing with missing data
When the SD of change in outcomes was not provided, we calculated it from the standard error (SE) or 95% confidence interval (CI 95%) according to Altman.Reference Altman and Bland 15
Data synthesis
We used Review Manager (RevMan, v 5.3 for Windows). Mean changes from baseline in neuropsychological test scores were pooled as standardized mean differences (SMDs) between the two groups from baseline to the endpoint in the metaanalysis models using the inverse variance method. Because the results in the previous literature are not consistent, we assumed a random-effect model of the SMD as the main analysis model. Additional confirmatory analysis was conducted in two other scenarios. In the first scenario, we shifted from a random-effect model to a fixed-effect model, and in the second scenario, we shifted from SMD to crude mean difference. Only data from the main analysis are provided in this manuscript.
For all outcomes, a value of Cronbach’s alpha (α) below 0.05 was considered statistically significant. Given the small effect size of neuropsychological decrements reported in previous studies, we considered an α level below 0.1 to indicate a trend toward one of the two groups.
Assessment of heterogeneity
Heterogeneity was assessed by visual inspection of the forest plots and measured by the I 2 and chi-square (χ2) tests. The χ2 test was used to test the existence of significant heterogeneity, while the I 2 test was utilized to quantify the present heterogeneity, if present. The I 2 test was interpreted according to recommendations of the Cochrane Handbook with regard to metaanalysis (0–40%=might not be important, 30–60%=may represent moderate heterogeneity, 50–90%=may represent substantial heterogeneity, and 75–100%=considerable heterogeneity). For testing statistical heterogeneity, a value of α (for the χ2 test) below 0.1 was considered to represent significant heterogeneity, as recommended by the Cochrane Handbook (Part 2, Chapter 9).
Subgroup analysis
Because some studies reported on unilateral DBS and others reported on bilateral DBS, we conducted subgroup analysis whenever possible. The difference in effect size between unilateral and bilateral DBS was tested by the χ2 test (test for subgroup difference). A value of α below 0.05 for this test was considered to represent a significant difference.
Publication bias
According to Egger and colleagues,Reference Egger, Davey Smith, Schneider and Minder 16 , Reference Terrin, Schmid, Lau and Olkin 17 publication bias assessment is not reliable for less than 10 pooled studies. Therefore, in the present study, we could not assess the existence of publication bias by Egger’s test for funnel plot asymmetry.
Results
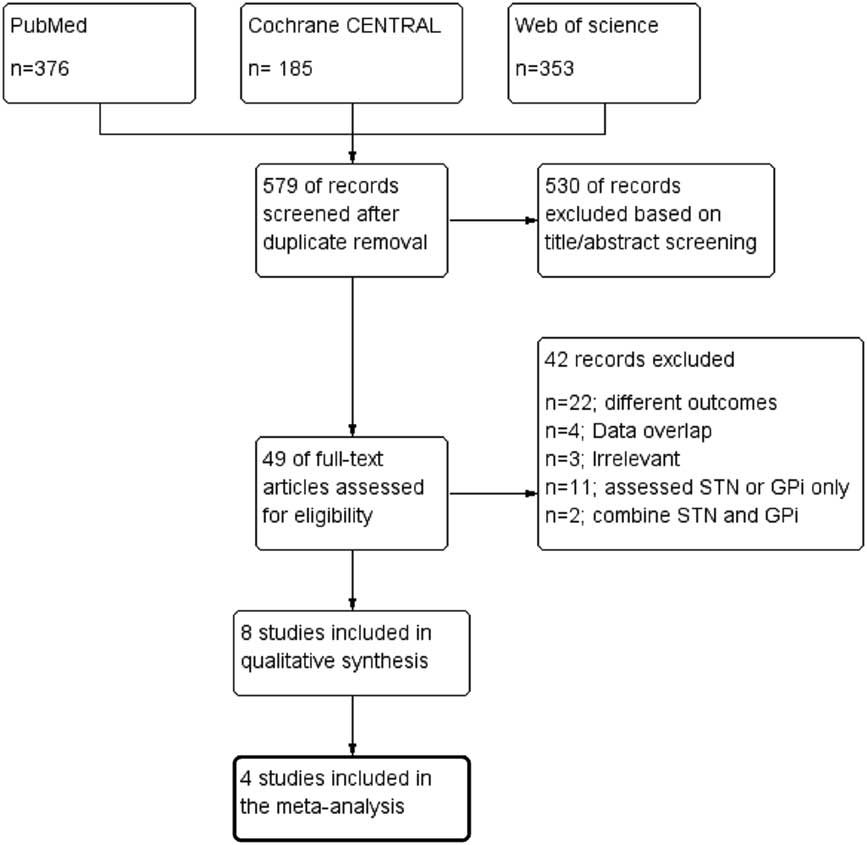
Our search retrieved 579 unique citations. Of these, 49 full-text articles were retrieved and screened for eligibility. Finally, 42 articles were excluded and 7 unique studies (n=555 patients) were included in our study.Reference Pillon, Ardouin and Damier 6 , Reference Rothlind, Cockshott, Starr and Marks 8 , Reference Ardouin, Pillon and Peiffer 13 , Reference Trépanier, Kumar, Lozano, Lang and Saint-Cyr 18 – Reference Okun, Fernandez and Wu 21 Of the seven studies included in our systematic review, fourReference Rothlind, Cockshott, Starr and Marks 8 , Reference Rothlind, York and Carlson 19 – Reference Okun, Fernandez and Wu 21 were RCTs and were therefore pooled in the metaanalysis (see the PRISMA flow diagram in Figure 1). The reasons for study exclusion are shown in supplementary file 1 (“Reasons for Excluded Studies”).
PRISMA flow diagram of studies’ screening and selection.

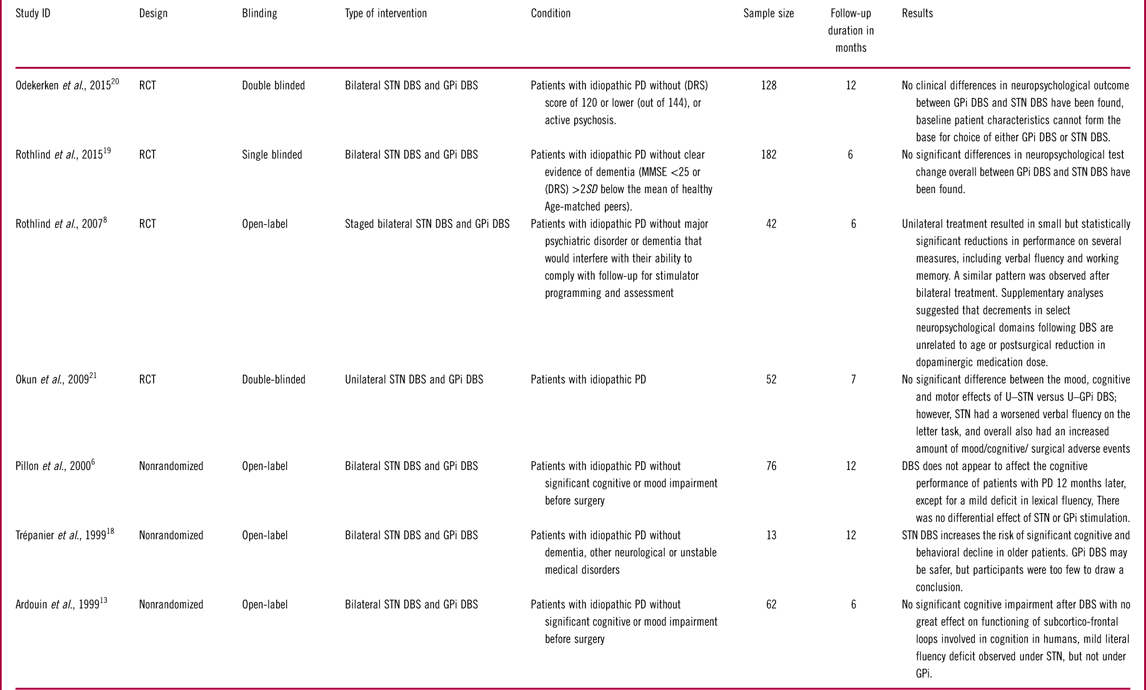
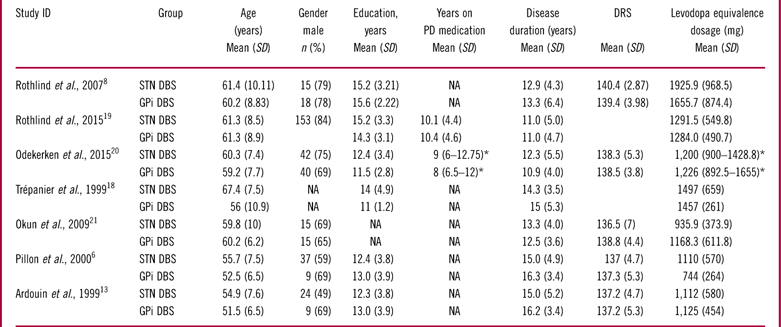
Out of the seven included studies, four were described as RCTs,Reference Rothlind, Cockshott, Starr and Marks 8 , Reference Rothlind, York and Carlson 19 – Reference Okun, Fernandez and Wu 21 and three were quasiexperimental studies.Reference Pillon, Ardouin and Damier 6 , Reference Ardouin, Pillon and Peiffer 13 , Reference Trépanier, Kumar, Lozano, Lang and Saint-Cyr 18 A summary of included studies, their design, and their main results is given in Table 2, and the baseline characteristics of their populations are presented in Table 3.
Summary of included studies

DRS=Disease Rating Scale; GPi DBS=unilateral globus pallidus deep brain stimulation; MMSE=Mini–Mental State Examination; PD=Parkinson’s disease; RCT=randomized controlled trial; STN DBS=subthalamic deep brain stimulation.
Baseline characteristics of the population

* Data presented in median and interquartile range.
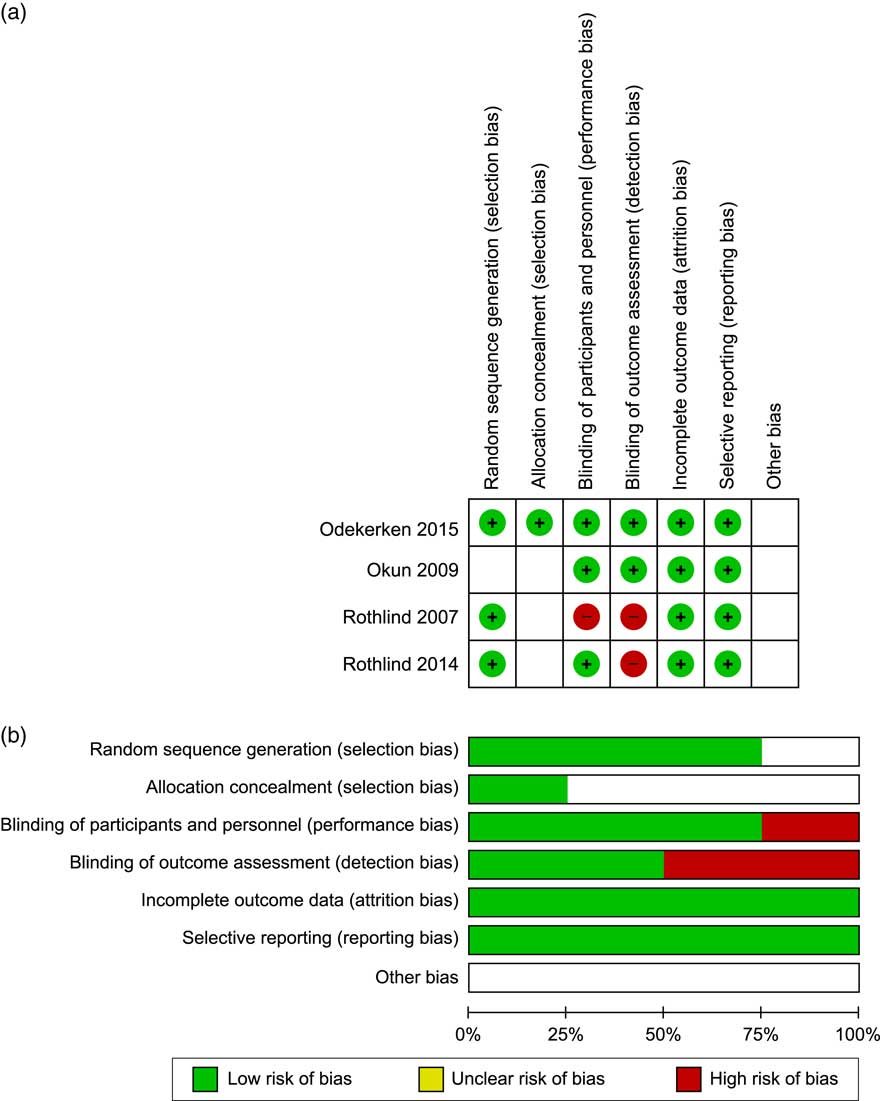
The quality of the included studies was rated as from moderate to high quality according to the Cochrane Risk of Bias tool. A summary of the quality assessment domains of the four RCTs is depicted in Figure 2. The authors’ judgment with justifications are presented in supplementary files 2 and 3. Quasi-randomized studies were deemed as being at high risk of bias due to a lack of the items described in the assessment tool.
The risk of bias summary and risk of bias graph according to Cochrane Risk of Bias assessment tool.

Trépanier et al.Reference Trépanier, Kumar, Lozano, Lang and Saint-Cyr 18 reported an increase in the risk of cognitive decline following STN DBS in comparison with GPi DBS. However, the low sample size (n=13), the lack of randomization, and the lack of blinding all limit the credibility of these results.
Rothlind et al.Reference Rothlind, Cockshott, Starr and Marks 8 reported a statistically significant reduction in many cognitive domains following unilateral and bilateral DBS, but no significant difference was noted between the STN DBS and GPi DBS groups.Reference Rothlind, Cockshott, Starr and Marks 8
None of the other included studiesReference Pillon, Ardouin and Damier 6 , Reference Ardouin, Pillon and Peiffer 13 , Reference Rothlind, York and Carlson 19 – Reference Okun, Fernandez and Wu 21 reported a significant difference in cognitive function following STN DBS or GPi DBS.
Attention and working memory
In terms of attention, the following outcomes did not favor either of the two groups: the Wechsler Adult Intelligence Scale (WAIS) digits forward (SMD = 0.08, CI 95% = [‒0.14, 0.31], p = 0.47); the WAIS digits back-ward (SMD = 0.31, CI 95% = [‒0.25, 0.87], p = 0.28); and the WAIS arithmetic (SMD = ‒0.06, CI 95% = [‒0.55, 0.42], p = 0.79, Figure 3).
Forest plots of standardized mean difference in WAIS digits forward, WAIS digits backward, and WAIS arithmetic. CI=confidence interval; IV=inverse variance; SMD=standardized mean difference.

Psychomotor speed
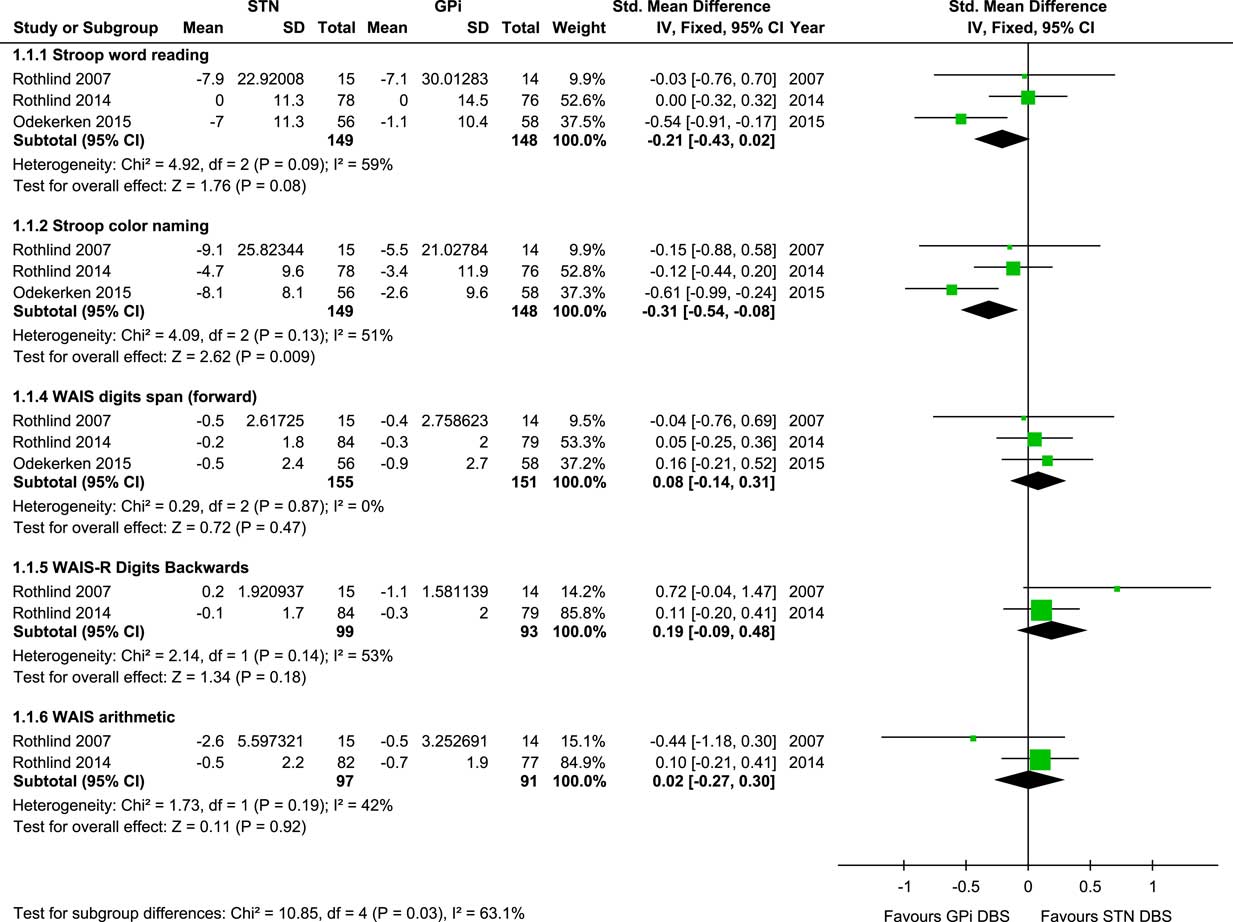
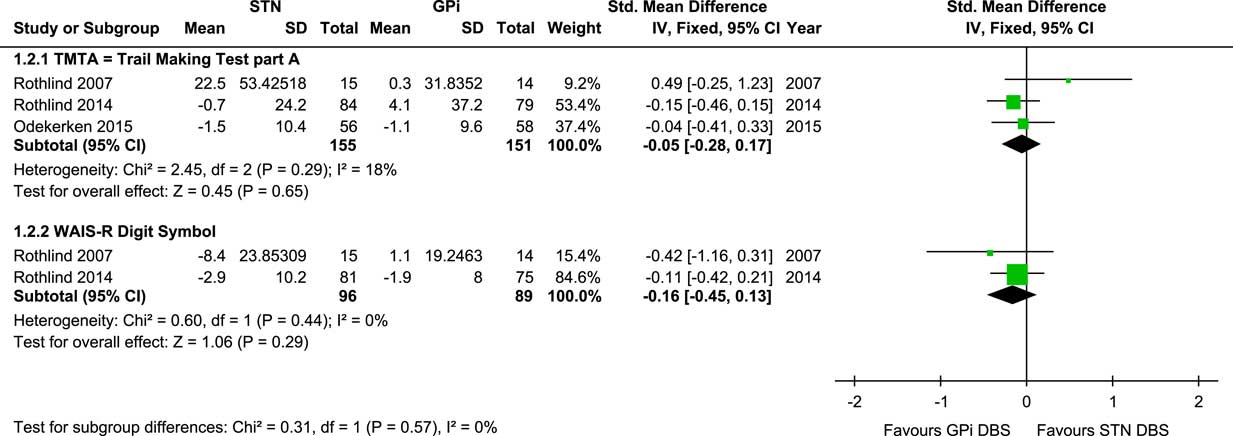
The pooled effect size did not favor either of the two groups as the Trail Making Test Part A (TMTA), the WAIS–R digit symbol, Stroop word-reading, and Stroop color-naming tests did not favor either of the two groups (SMD=–0.04, CI 95%=[–0.30, 0.22], p=0.78; SMD=–0.16, CI 95%=[–0.45, 0.13], p=0.29; SMD=–0.21, CI 95%=[–0.61, 0.18], p=0.29; SMD= –0.31, CI 95%=[–0.67, 0.04], p=0.09; respectively; see Figure 4).
Forest plots of standardized mean difference in Stroop word reading, Stroop color naming, Trail Making Test Part A, and WAIS–R digit symbol. CI=confidence interval; IV=inverse variance; SMD=standardized mean difference.

Executive function
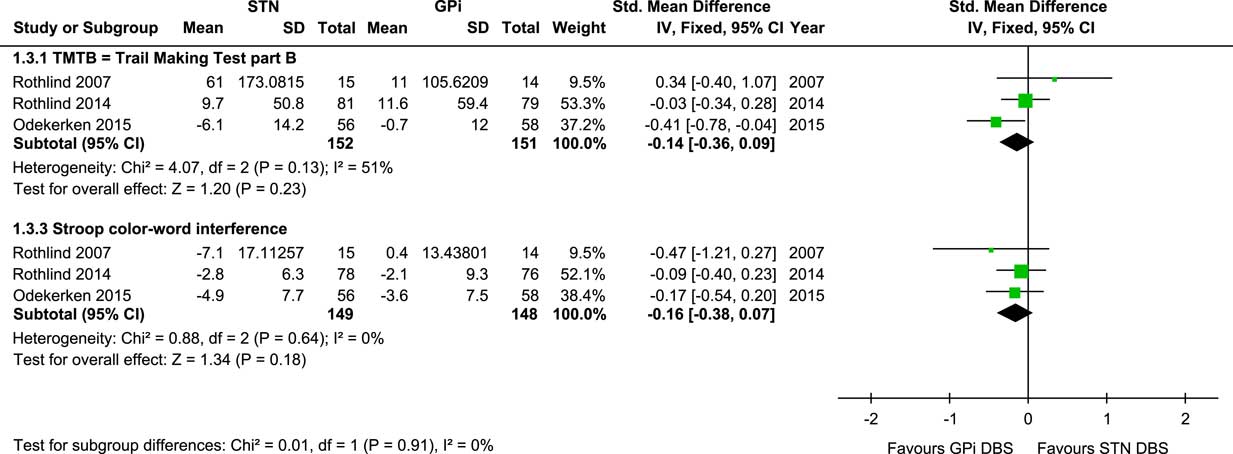
In terms of executive functions, the pooled SMD of change on the Trail Making Test Part B (TMTB) and Stroop color–word interference did not favor either of the two groups (SMD=–0.11, CI 95%=[–0.47, 0.24], p=0.53; and SMD=–0.16, CI 95%=[–0.38, 0.07], p=0.18; respectively; Figure 5). The pooled studies were homogeneous (p>0.1).
Forest plots of standardized mean difference in Trail Making Test Part B and Stroop color–word interference. CI=confidence interval; IV=inverse variance; SMD=standardized mean difference.

Verbal fluency
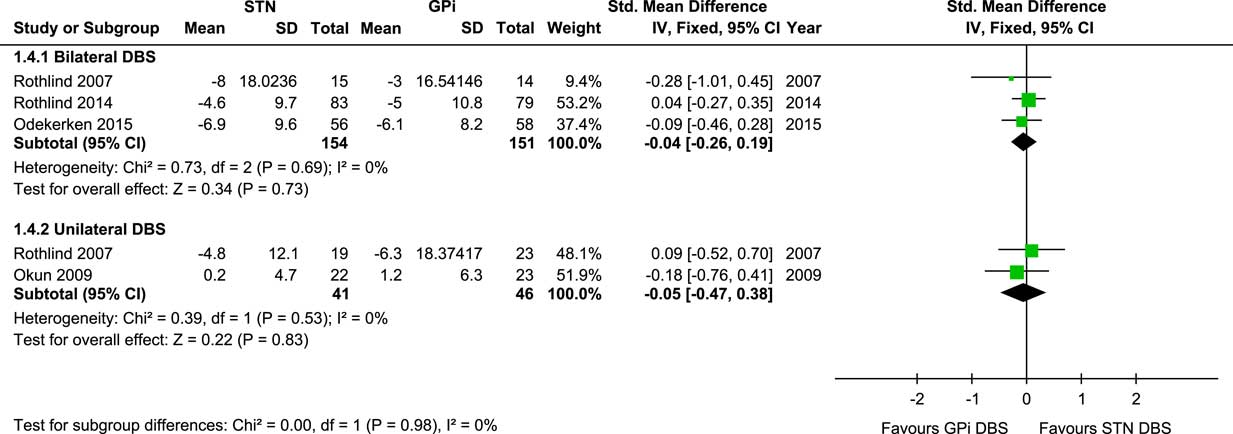
The pooled SMD of change in phonemic verbal fluency did not favor either of the two groups (bilateral DBS: SMD=–0.04, CI 95%=[–0.26, 0.19], p=0.73; and unilateral DBS: SMD=–0.05, CI 95%=[–0.47, 0.38], p=0.83; Figure 6). The pooled studies were homogeneous (p>0.1).
Forest plots of standardized mean difference in phonemic verbal fluency (bilateral DBS and unilateral DBS). CI=confidence interval; IV=inverse variance; SMD=standardized mean difference.

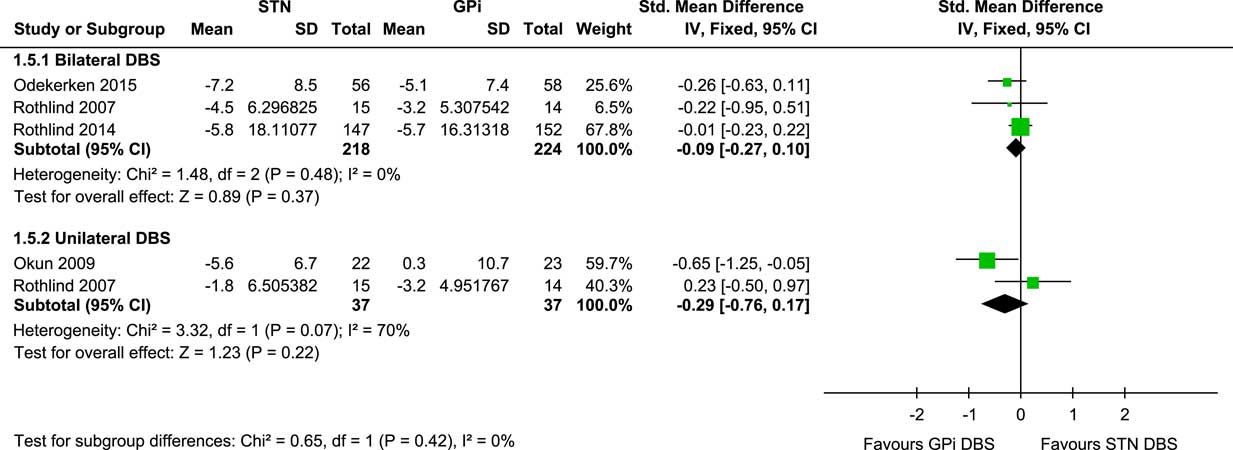
In terms of semantic verbal fluency, the SMD of change between the two groups did not favor either of the two groups (bilateral DBS: SMD=–0.09, CI 95%= [–0.27, 0.10], p=0.37; and unilateral DBS: SMD= –0.23, CI 95%=[–1.29, 0.63], p=0.60; Figure 7). The pooled studies of bilateral DBS were homogeneous (p>0.1), but for unilateral DBS, the two pooled studies (Okun et al.Reference Okun, Fernandez and Wu 21 and Rothlind et al.Reference Rothlind, Cockshott, Starr and Marks 8 ) were not homogeneous (p>0.07).
Forest plots of standardized mean difference in phonemic verbal fluency (bilateral DBS and unilateral DBS). CI=confidence interval; IV=inverse variance; SMD=standardized mean difference.

Language
The pooled SMD of change on the Boston Naming Test (BNT) did not favor either of the two groups (SMD= –0.11, CI 95%=[–0.34, 0.11], p=0.33; Figure 8). The pooled studies were homogeneous (p>0.1).
Forest plots of standardized mean difference in Boston Naming Test. CI=confidence interval; IV=inverse variance; SMD=standardized mean difference.

Severity of depression
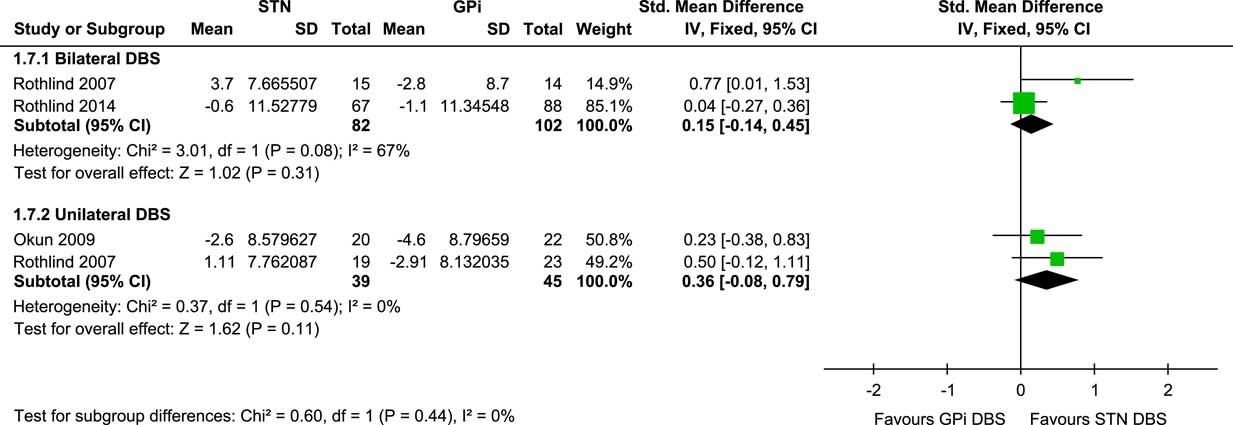
The pooled SMD of change in the severity of depression score did not significantly favor either of the two groups but tended to favor STN DBS (bilateral DBS: SMD= 0.32, CI 95%=[–0.37, 1.02], p=0.36; and unilateral DBS: SMD=0.36, CI 95%=[–0.08, 0.79], p=0.11; Figure 9).
Forest plots of standardized mean difference in Beck Depression Inventory (bilateral DBS and unilateral DBS). CI=confidence interval; IV=inverse variance; SMD=standardized mean difference.

When we assumed a fixed-effect model for all outcomes, the Stroop word-reading and Stroop color-naming tests showed a trend toward more decline with STN DBS than with GPi DBS (p=0.08 and 0.09, respectively; data not shown). When we changed the effect size to mean difference (MD) instead of SMD, the TMTB and Stroop color-naming tests significantly favored GPi DBS over STN DBS, which indicates more decline in the STN DBS group (p=0.03 and 0.04, respectively; data not shown).
Discussion
This metaanalysis provides a direct comparison between STN DBS and GPi DBS in terms of neuropsychological performance. Because the recent evidence showed no difference between the two targets in terms of motor functions, the assessment of nonmotor outcomes is gaining more attention as a basis for selecting patients for appropriate DBS targets. The effects of DBS surgery on neuropsychological performance is not consistent throughout the literature, and nearly all significant findings have a small effect size. Our metaanalysis showed no statistically significant difference between STN DBS and GPi DBS in most neuropsychological domains. Only psychomotor processing speed showed a trend to favor the GPi DBS group as measured by the Stroop color-naming test. Most studies reported more decline in semantic verbal fluency in the STN DBS group (compared to GPi DBS), but the effect size was not significant. Our additional analyses showed a trend toward more decline in the STN DBS group in terms of the Stroop word-reading test and the TMTB. The low sample size of the pooled analysis may justify this nonsignificance. In addition, this implies that the differences between STN DBS and GPi DBS are of small effect size and thus not likely to be of clinical significance.
Attention and working memory
Four studies reported better attention and working memory with GPi DBS than with STN DBS. In addition, Odekerken et al.Reference Trépanier, Kumar, Lozano, Lang and Saint-Cyr 18 reported significant differences on Stroop word-reading, Stroop color-naming, TMTB, and WAIS similarities, with STN DBS showing a greater negative change than GPi DBS. In contrast, Pillon et al.Reference Pillon, Ardouin and Damier 6 reported a trend toward improved working memory in the STN DBS group. Our pooled analysis showed no statistically significant difference between the two groups in WAIS digits forward, WAIS digits backward, and WAIS arithmetic.
A previous study by Kim et al.Reference Kim, Jeon and Paek 24 showed that bilateral STN DBS did not affect working memory. However, another studyReference Aono, Iga, Ueno, Agawa, Tsuda and Ohmori 25 showed that unilateral STN DBS is associated with impairment in the most affected side of the brain.
Executive functions
Odekerken et al.Reference Odekerken, Boel, Geurtsen, Schmand, de Haan and Schuurman 20 reported a significant difference between the STN DBS and GPi DBS groups. The decline on the TMTB was greater with STN DBS than with GPi DBS (MD=–6.1 vs. –0.7). In addition, the STN DBS groups in Rothlind et al.Reference Rothlind, Cockshott, Starr and Marks 8 , 19 and Odekerken et al.Reference Odekerken, Boel, Geurtsen, Schmand, de Haan and Schuurman 20 demonstrated a greater decline in the Stroop color–word interference test than the GPi DBS groups. However, our pooled analysis of the TMTB and Stroop color–word interference tests showed no significant between-group differences.
The literature suggests that STN DBS has a negative impact on the executive functions of PD patients.Reference Perozzo, Rizzone and Bergamasco 22 – Reference Alberts, Voelcker-Rehage, Hallahan, Vitek, Bamzai and Vitek 27 Saint-Cyr et al.Reference Saint-Cyr, Trépanier, Kumar, Lozano and Lang 28 reported a decline in the executive functions of PD patients after DBS. This worsening began 3 to 6 months after DBS surgery and continued beyond the duration of follow-up. They reported that patients who did not have STN DBS were not suffering from this problem.Reference Saint-Cyr, Trépanier, Kumar, Lozano and Lang 28 Auclair-Ouellet et al.Reference Auclair-Ouellet, Chantal, Cantin, Prud’homme, Langlois and Macoir 29 and Funkiewiez et al.Reference Funkiewiez, Ardouin and Caputo 7 reported a significant worsening of executive functions in PD patients who underwent STN DBS.
When it comes to GPi DBS, the cognitive outcome is more likely to be different from that of STN stimulation. Fields et al.Reference Fields, Troster, Wilkinson, Pahwa and Koller 30 found no significant worsening in the executive functions of PD patients with bilateral GPi DBS. Some studies proposed that unilateral pallidal stimulation in PD patients has no significant negative influence on executive functioning except in patients of older age who took higher doses of levodopa preoperatively.Reference Vingerhoets, van der Linden and Lannoo 31 Other studies also reported that the negative effect of DBS on executive functioning is more significant in bilateral STN stimulation than in unilateral pallidotomy.Reference Smeding, Esselink and Schmand 32
Certain risk factors have been correlated with this worsening of executive function. Age is a considerable predictor of decline in executive function. Older patients are more susceptible to postoperative neuropsychological complications. Other risk factors include levodopa equivalence dosage (LED) and axial subscore on the Unified Parkinson’s Disease Rating Scale (UPDRS) in the off-medication state at baseline.Reference Funkiewiez, Ardouin and Caputo 7 , Reference Saint-Cyr, Trépanier, Kumar, Lozano and Lang 28 , Reference Daniels, Krack and Volkmann 33 Yamanaka et al.Reference Yamanaka, Ishii and Umemura 34 found an association between deterioration of executive functions following STN DBS and reduced dosages of dopaminergic medications after the operation.Reference Yamanaka, Ishii and Umemura 34
Psychomotor speed
The TMTA and WAIS-R digit symbol tests tended to favor GPi DBS over STN DBS in Odekerken et al.Reference Odekerken, Boel, Geurtsen, Schmand, de Haan and Schuurman 20 and Rothlind et al.19 Our pooled analysis did not show a statistically significant difference between the STN DBS and GPi DBS groups.
Previous studies have showed that DBS has a negative impact on processing speed compared to the best practices medical therapy.Reference Rothlind, York and Carlson 19 Bilateral STN DBS tends to cause a more significant decline in processing speed and in other cognitive domains than unilateral STN DBS.Reference Alberts, Voelcker-Rehage, Hallahan, Vitek, Bamzai and Vitek 27 This may be due to the greater reduction in dopaminergic medications after STN stimulation compared to post-GPi stimulation.Reference Rothlind, York and Carlson 19
Verbal fluency
The STN DBS group showed a decline in verbal fluency in the studies conducted by Okun et al.,Reference Okun, Fernandez and Wu 21 Ardouin et al,Reference Ardouin, Pillon and Peiffer 13 and Pillon et al.,Reference Pillon, Ardouin and Damier 6 while such a decline was not found in the GPi DBS group of the same studies. However, our pooled analysis failed to show a statistically significant difference between the two groups.
Multiple reports described a significant decline in both phonemic and semantic verbal fluency in patients with chronic bilateral STN stimulation.Reference Kim, Jeon and Paek 24 , Reference Saint-Cyr, Trépanier, Kumar, Lozano and Lang 28 , Reference Moretti, Torre and Antonello 35 , Reference Gironell, Kulisevsky, Rami, Fortuny, Garcia-Sanchez and Pascual-Sedano 36
In addition, previous studies found that preoperative apathy and depressive mode were associated with an increased probability of verbal fluency decline after STN DBS surgery.Reference Marshall, Strutt, Williams, Simpson, Jankovic and York 37 , Reference De Gaspari, Siri and Di Gioia 38 Other studies found a correlation between increasing age of PD patients and declines in verbal fluency following STN DBS.Reference Smith, O’Connor, Papavassiliou, Tarsy and Shih 39 Disturbed verbal fluency was also associated with left-sided DBS.Reference Harati and Müller 40 – Reference Zahodne, Okun and Foote 42
In terms of GPi DBS, the literature suggests that verbal fluency might not be affected as it is with STN DBS. Miyawaki et al.Reference Miyawaki, Perlmutter, Troster, Videen and Koller 43 reported the case of a PD patient who had surgery with pallidal stimulation as a part of treatment and who showed both improved phonemic and semantic verbal fluency.
Verbal and visual memory
Verbal and visual memory were measured by the Rey Auditory Verbal Learning Test (RAVLT), the Rivermead Behavioural Memory Test (RMBT), the Hopkins Verbal Learning Test (HVLT), the Brief Visuospatial Memory Test (BVMT), and the WAIS. The data gathered with these measures were available from two RCTs (Rothlind et al.,Reference Rothlind, Cockshott, Starr and Marks 8 Odekerken et al.Reference Odekerken, Boel, Geurtsen, Schmand, de Haan and Schuurman 20 ), and none of them reported a statistically significant difference between the two groups.
Language
Language was assessed by the BNT in three RCTs (Rothlind et al.,Reference Rothlind, Cockshott, Starr and Marks 8 , 22 and Odekerken et al.Reference Odekerken, Boel, Geurtsen, Schmand, de Haan and Schuurman 20 ). The pooled effect size showed no significant difference between the two groups, which was concordant with the results from the three RCTs.
Severity of depression
Rothlind et al.22 reported no difference between the two groups in terms of severity of depression. Ardouin and colleaguesReference Ardouin, Pillon and Peiffer 13 described a series of cases in which 62 patients were assigned to either STN DBS or GPi DBS. Postoperative evaluation of mood by the Beck Depression Inventory (BDI) showed a slight improvement in both the STN DBS and GPi DBS groups. Rothlind et al.Reference Rothlind, Cockshott, Starr and Marks 8 reported improving depression in the STN DBS group and worsening depression in the GPi DBS group. Okun et al.Reference Okun, Fernandez and Wu 21 (reported later by Zahodne et al. Reference Zahodne, Okun and Foote 44 ) found a decline in BDI scores in both groups (STN –2.6 vs. GPi –4.6). However, none of these differences were statistically significant. In addition, our pooled analysis did not show any significant differences between the two groups.
Previous studies have reported heterogeneous effects of DBS in terms of mood. Some research suggested an ameliorating effect on mood with both STN DBS and GPi DBS.Reference Woods, Fields and Troster 45 , Reference Witt, Daniels and Reiff 46 In addition, Lhommée and colleaguesReference Lhommée, Klinger and Thobois 47 found improved mood, anxiety, and fatigue in the STN DBS group compared to the medical therapy group. The amelioration found in some studies might be explained by the improvement in motor symptoms, which improves patients’ functioning in daily activities, which ameliorates their mood.Reference Heo, Lee and Paek 48
Other reports have reported that STN DBS does not affect depression in PD patients.Reference Saint-Cyr, Trépanier, Kumar, Lozano and Lang 28 , Reference Rizzone, Fasano and Daniele 49 – Reference Kaiser, Kryspin-Exner, Brucke, Volc and Alesch 52 However, transient mood improvement has been reported for an elderly group of patients, but it did not last for long during the first year of follow-up.Reference Saint-Cyr, Trépanier, Kumar, Lozano and Lang 28
In contrast, the work of York et al.Reference York, Wilde, Simpson and Jankovic 53 found mood worsening after STN DBS in some patients. They explained this with the suboptimal location of DBS electrodes within the STN, especially those in the lateral and inferior aspects of the left hemisphere.
Agreements and disagreements with previous reviews
To the best of the present authors’ knowledge, this is the first metaanalysis to compare neuropsychological performance between STN DBS and GPi DBS. In a recent metaanalysis, Combs and colleaguesReference Combs, Folley and Berry 54 assessed neuropsychological performance after GPi DBS and STN DBS separately, with no direct comparison between the two groups. In contrary to Combs et al., we directly compared the two targets to provide more precise estimates. We included studies that were RCTs or quasiexperimental that directly compared STN DBS to GPi DBS; however, only RCTs were included in the metaanalysis models. According to the Cochrane Handbook, randomization is the only way to prevent systematic differences between the baseline characteristics of participants, and empirical evidence suggests that potential biases are likely to be greater with nonrandomized compared to randomized trials.Reference Higgins and Green 55 In addition, including single-arm studies would lead to unadjusted indirect synthesis of evidence. Unadjusted indirect comparisons ignore the within-trial comparison and may increase the liability of bias and overprecise estimates.Reference Glenny, Altman and Song 56 The STN DBS group demonstrated moderate to mild decrements in multiple neuropsychological domains, including verbal fluency (d=−0.398), attention (d=−0.123), processing speed (d=−0.162), learning and memory (d=−0.115), and executive function (d=−0.134). On the other hand, in the GPi DBS group, only verbal fluency (d=−0.220) and attention (d=−0.185) showed mild significant declines. These findings are consistent with our systematic review and metaanalysis. The current evidence suggests a trend toward a greater decline in verbal fluency and processing speed (Stroop color-naming test) in the STN DBS group than in the GPi DBS group.
Completeness of evidence
Of the total of 404 patients allocated to STN DBS or GPi DBS in the four RCTs, there were 50 (~12.3%) discontinuations. We think that this percentage of discontinuations is quite high, and we consider it a limitation of our metaanalysis. Discontinuations are high since the two largest datasets—of Odekerken et al.Reference Odekerken, Boel, Geurtsen, Schmand, de Haan and Schuurman 20 (n=128) and Rothlind et al.22 (n=182)22—were secondary evaluations from two large primary RCTs,Reference Odekerken, van Laar and Staal 14 , Reference Follett, Weaver and Stern 57 while the two other studies—Okun et al.,Reference Okun, Fernandez and Wu 21 Rothlind et al.Reference Rothlind, Cockshott, Starr and Marks 8 —were performed primarily to assess the neuropsychological performance of DBS.
Although analysis of all the studies was conducted with an intention-to-treat approach, Odekerken et al.Reference Odekerken, Boel, Geurtsen, Schmand, de Haan and Schuurman 20 did not perform an intention-to-treat analysis. Reasons for discontinuations were specified and described in detail in all studies except Odekerken et al.,Reference Odekerken, Boel, Geurtsen, Schmand, de Haan and Schuurman 20 where some discontinuations were not clearly explained. However, these losses were balanced between the two groups.
In addition, the patients studied by Rothlind et al.Reference Rothlind, Cockshott, Starr and Marks 8 underwent a staged bilateral DBS. Of the 42 patients who underwent unilateral implantation, 13 did not undergo a contralateral implantation and were not included in the final analysis. For our study, we considered the final endpoint (after bilateral DBS; n=29) in all outcomes except in depression and verbal fluency. We presented the data on both conditions in two subgroups (unilateral and bilateral) to allow indirect comparison between unilateral and bilateral DBS. However, none of the comparisons yielded a significant difference (χ2, p>0.05).
Recommendations for Future Research
Based on the present findings and given the low statistical power of the pooled analysis, we recommend further RCTs comparing STN DBS and GPi DBS in terms of neuropsychological performance with standardized outcome measures to allow comparison with other reports. In addition, some investigators have noted that the neuropsychological decline can be attributed to specific population characteristics (such as age, baseline levodopa dose, and preoperative verbal fluency). A better description of factors associated with neuropsychological decline would help to enhance selection of DBS targets for patients and would allow us to synthesize a prediction model (nomogram) for the expected risks of DBS surgery.
Limitations and Strengths of the Study
The limitations of our study include the small number of studies in our sample and the unavailability of full neuropsychological assessment in all studies. For example, some outcomes were assessed by two studies only, which limited the statistical power of the metaanalysis models. We did not pool nonrandomized studies because they were published before 2000, and their neuropsychological measures have been revised or substituted in recent studies, and pooling tests or versions of different accuracy and reliability would have affected the quality of our metaanalysis models.
The strengths of our study are as follows: (1) this is the first metaanalytic study that presents a direct neuropsychological comparison between STN DBS and GPi DBS; (2) the search strategy included multiple medical electronic databases; (3) our eligibility criteria were well-defined; (4) our analysis was conducted in multiple scenarios assuming both random- and fixed-effect models, and we also reported any trend toward either of the two groups; (5) all steps were performed by at least two authors independently to avoid possible errors; (6) we followed the PRISMA statement guidelines during preparation of the study; and 7) we performed all steps in strict accordance with the Cochrane Handbook.
Conclusions
We found no difference in most of the neuropsychological outcomes. The current evidence shows slight improvement among the GPi DBS group in terms of psychomotor speed and verbal fluency. However, these findings should be confirmed by further large RCTs with standard outcome measures and a description of outcome predictors.
Funding
No funding was received in connection with this research.
Conflicts of Interest
All the authors certify that they have no affiliations or involvement with any organization or entity with any financial interest (such as honoraria, educational grants, participation in speakers bureaus, membership, employment, consultancies, stock ownership, or other equity interest; and expert testimony or patent-licensing arrangements), or non-financial interest (such as personal or professional relationships, affiliations, knowledge or beliefs) in the subject matter or materials discussed in this manuscript.
Ethical Approval
All procedures performed in studies involving human participants were in accordance with the ethical standards of the institutional review board and/or the national research committee and with the 1964 Helsinki Declaration and its later amendments, or comparable ethical standards.
Informed Consent
This article does not contain any studies with human participants or animals performed by any of the authors.
Disclosures
Ahmed Elgebaly, Mohamed Elfil, Attia Attia, Mayar Magdy, and Ahmed Negida do not have anything to disclose.
Supplementary Material
To view supplementary materials for this article, please visit https://doi.org/10.1017/S1092852917000062.