Introduction
Representative democracies are said to be uniquely virtuous because they ensure that public preferences drive policy (May, Reference May1978). ‘Dynamic representation’ is the result of the electorate and parties responding to each other over time. In this system of moving parts, preferences can shape government policy via two possible mechanisms. The ‘policy accomodation’ mechanism suggests that governments respond directly to the electorate’s preferences. The ‘electoral turnover’ mechanism, on the other hand, assumes that preferences shape policy indirectly via three links. Parties pursue their ideological goals. Public preferences respond ‘thermostatically’ by moving in the opposite direction to policy. This, in turn, causes voters to switch votes and leads to a turnover of power from one ‘side’ to ‘the other’ (Hakhverdian, Reference Hakhverdian2010; Bartle et al., Reference Bartle, Avellaneda and McGann2019).
Expectations about the operation of the macro-political system are based on assumptions about the motivations of the electorate and parties. Parties are assumed to pursue office and to be willing to accommodate preferences (Strøm, Reference Strøm1990). Electorates are assumed to be motivated, at least in part, by policy considerations. The recurring interaction between parties and electorate, however, leads to ‘feedback’ within the system. The electorate’s preferences, for example, respond ‘thermostatically’ to actual policy, demanding ‘less’ as governments deliver ‘more’ (Wlezien, Reference Wlezien1995). If parties are office seeking and control policy, they can accommodate preferences by thermostatically adjusting policy (Wlezien, Reference Wlezien1995). If they have strong ideological motivations, however, they may be unresponsive (Bartle et al., Reference Bartle, Avellaneda and McGann2019). Policy can only be brought into line with preferences by replacing the government (Hakhverdian, Reference Hakhverdian2010).
Previous macro-political studies have examined the processes of dynamic representation in well-established majoritarian countries such as the USA (Stimson et al., Reference Stimson, MacKuen and Erikson1995) and Great Britain (Bartle et al., Reference Bartle, Dellepiane Avellaneda and Stimson2011; Bartle et al., Reference Bartle, Avellaneda and McGann2019). There is little evidence about the interaction between the electorate and parties in other systems. Here we examine the case of Spain, a somewhat younger democracy, using the same methods deployed in earlier studies. We show that the Spanish electorate has moved right over time in parallel with the increase in the scope of the government activity. We demonstrate that Spanish preferences for government activity respond ‘thermostatically’ to policy and that these movements are associated with changes in vote intentions. While public preferences respond to policy activity, governments do not seem to respond thermostatically to preferences. While there are few constitutional limits on Spanish governments, we find that policy is not shaped by preferences but by party ideology. It seems that public preferences in Spain – just as in Great Britain – can only shape policy indirectly via electoral turnover. These findings have important implications for democratic theory and recent developments in the party system. When governments do not adjust their policy proposals to public preferences, electoral turnover is the only possible mechanism for ensuring congruence between policy and preferences. In these circumstances, democracy’s promise of ensuring representative governments can only be guaranteed if the electorate can choose between parties with distinct policy platforms. The likelihood of party system breakup and the emergence of populist parties may increase when voters perceive that existing mainstream parties are enacting policy that does not match the public mood. The Spanish case may provide a good example of this. The lack of responsiveness of the Spanish governments to policy mood may have reinforced citizens’ political disaffection with the existing party system. This may have contributed to the collapse of the Spanish two-party system in 2015 and the emergence of Podemos, Ciudadanos, and, afterwards, Vox.
We structure the article as follows: in ‘Policy moods, thermostatic models and representation’, we discuss the literature on policy mood and dynamic representation. In ‘The Spanish case study’, we explain how the Spanish case adds to our understanding. In ‘Data and methods’, we discuss the data used to build our mood measure for Spain and the dyads ratio algorithm used to estimate mood. In ‘Empirical findings’, we report our results. We assess whether preferences shape policy indirectly by examining the three assumed links in the electoral turnover mechanism. We also assess whether policy responds directly to preferences as assumed by the policy accommodation mechanism. In ‘Discussion’, we discuss the implications of our findings.
Policy moods, thermostatic models, and representation
In order to examine dynamic representation within the macro-political system, we need indicators of both public preferences and public policy over time. The estimation of preferences faces two data problems: the availability and coherence of measures. Very few countries have long series made up of responses to identical survey questions. Spain is no more fortunate in this regard compared to many others. Those responsible for surveys have prioritized topical rather than enduring issues. Things have improved as the power of time series research designs has become appreciated (Page and Shapiro, Reference Page and Shapiro1992). Institutions such as Centro de Investigaciones Sociológicas (CIS) now enable us to track shifting preferences. Nevertheless, the data in earlier years are intermittent and irregular, often consisting of short, seemingly unrelated, and partially overlapping series.
Efforts to measure preferences over time have been further frustrated by the fact that political preferences appear incoherent. Individuals often express inconsistent opinions across seemingly related issues (Zaller and Feldman, Reference Zaller and Feldman1992). Responses to questions about welfare, for example, are weakly correlated to responses about taxation. Individual respondents provide contradictory responses to questions about the same issue. Minor differences in question wording and response options can produce different responses (Schuman and Presser, Reference Schuman and Presser1996). Indeed, respondents provide contradictory responses to the same question asked at different times (Converse, Reference Converse and Apter1964). Correlations between responses to the same question at t 1 and t 2 and t 2 and t 3 are small and often no larger than those between t 1 and t 3. It appears that genuine opinion change among individuals cannot account for this variability.
The existence of measurement error implies that individual survey responses produce a lot of noise and confusing signals. Once responses are aggregated, however, random error cancels out (Page and Shapiro, Reference Page and Shapiro1992). While an individual’s opinion in t 2 is difficult to predict from their opinions in t 1, the electorate’s aggregate preferences are very predictable. Comparing responses to identical questions, moreover, eliminates non-random error (Stimson, Reference Stimson2004). The major parties tend to take contrasting positions on issues; moreover, preferences across diverse issues can be coded as ‘left’ and ‘right’ (Carmines and Stimson, Reference Carmines and Stimson1990). Once done, preferences on diverse issues seem to move in parallel. This is labelled ‘the policy mood’ (Stimson, Reference Stimson1999).
The policy mood (or ‘mood’) can be inferred by observing longitudinal change across series. Since many indictors provide information, breaks in individual series no longer represent an insurmountable obstacle to inferring mood. The dyads ratio algorithm identifies a common metric by expressing preference series as ratios at two time points (‘dyads’) (see Supplementary material Appendix). It calculates all possible dyads, averages across series, and weights each by their relationship with the latent variable (Stimson, Reference Stimson1999).Footnote 1 Previous studies suggest that mood summarizes preferences for ‘more’ or ‘less’ government activity (Erikson et al., Reference Erikson, MacKuen and Stimson2002; Bartle et al., Reference Bartle, Dellepiane Avellaneda and Stimson2011; Stimson et al., Reference Stimson, Thiébaut and Tiberj2012).Footnote 2
The policy mood is one of the fundamental variables in the system of equations that describe the USA macro polity (Erikson et al., Reference Erikson, MacKuen and Stimson2002). Like preferences in specific domains, it responds ‘thermostatically’ to government policy (Wlezien, Reference Wlezien1995; Erikson et al., Reference Erikson, MacKuen and Stimson2002). If policy overshoots the electorate’s ideal point, it signals its desire for ‘less’ than before. If spending undershoots the ideal, the electorate signals its desire for ‘more’. Preferences act like a thermostat: signalling whether the government should increase or reduce the temperature by spending ‘more’ or ‘less’.Footnote 3
Fluctuations in mood have consequences in a system of many moving parts. In the USA, the distance between candidates and average voter as indicated by mood has a powerful effect on presidential election outcomes. The mood also influences elections to the House of Representatives and Senate (Erikson et al., Reference Erikson, MacKuen and Stimson2002, pp. 256–272). In Britain, mood has an impact on annual labour vote intentions (Bartle et al., Reference Bartle, Avellaneda and McGann2019) and labour’s general election vote share (Allen et al., Reference Allen, Bartle and Quinn2018).
The USA studies of dynamic representation suggest that the policy mood has a direct impact on policy, as measured by laws and votes in Congress (Erikson et al., Reference Erikson, MacKuen and Stimson2002). As the electorate signals their demand for more or less, government responds like a thermostat (Soroka and Wlezien, Reference Soroka and Wlezien2010). This suggests that a ‘policy accommodation’ mechanism directly connects the electorate’s preferences to policy (Erikson et. al., Reference Erikson, MacKuen and Stimson2002). One study of Britain came to similar conclusions (Hakhverdian, Reference Hakhverdian2010). This particular analysis, however, used a single indicator of preferences (left–right self-location) and a text-based indicator of annual policy (budget speeches in the House of Commons). Another study using estimates of the policy mood based on a wider range of preferences data and an indicator of policy based on government spending suggests that preferences do not have a direct impact on policy. Instead, policy is shaped by party ideology and economic conditions (Bartle et al., Reference Bartle, Avellaneda and McGann2019). Mood contributes to representation – but only indirectly via an electoral turnover mechanism.
To date, the policy mood has been estimated in the USA, Great Britain, France, and Italy (Stimson Reference Stimson1999; Bartle et al., Reference Bartle, Dellepiane Avellaneda and Stimson2011; Stimson et al., Reference Stimson, Thiébaut and Tiberj2012; Bellucci and Pellegata, Reference Bellucci and Pellegata2017). Thermostatic models of mood, moreover, have been examined only in the USA and Britain (Erikson et al., Reference Erikson, MacKuen and Stimson2002; Bartle et al., Reference Bartle, Dellepiane Avellaneda and Stimson2011). The responsiveness of government policy has also been examined only in those two countries.Footnote 4 Our understanding of dynamic representation is thus heavily dependent on these two cases. In the British case, moreover, there is disagreement about whether a policy accommodation or electoral turnover mechanism operates (Hakhverdian, Reference Hakhverdian2010; c.f Bartle et al., Reference Bartle, Avellaneda and McGann2019). There is a clear risk that ‘USA exceptionalism’ may distort our understanding of how dynamic representation works. This concern is heightened by the fact that we have reasons to believe that the responsiveness of the electorate and government is conditioned by institutions: the electoral systems, degree of federalism, checks and balances, and country-specific factors.
Comparative studies have suggested that proportional systems produce policies closer to the preferences of the typical voter than majoritarian systems because coalitions usually contain centrist parties (Powell, Reference Powell2000). It seems only natural to suggest that coalitions are also more responsive to preferences than the single-party governments. Yet there are also reasons to doubt this (Wlezien and Soroka, Reference Wlezien and Soroka2015a). Proportional systems lead to greater dispersion of parties and thus more extreme coalition positions (Blais and Bodet, Reference Blais and Bodet2006). This may lead party members to resist calls to change policy as public preferences change. Both specific preferences and the global policy mood move and are driven by policy and economic conditions. Coalitions muddy electoral accountability and may dissuade governments from responding to changing preferences. They may also reduce the speed of adjustment since changes need to be agreed by coalition partners. A single-party government, moreover, will find it less easy to escape accountability. In plurality electoral systems, small changes in vote can be magnified into large swings in seat shares. This may make single-party governments responsive to preferences. Such governments find it easier to respond once ‘signals’ are received (Wlezien and Soroka, Reference Wlezien and Soroka2015b). Other features of the electoral system may affect responsiveness. When citizens cast their vote in single-winner districts (such as Britain and the USA), only the governing or official opposition parties usually have a chance of winning the seat. The act of voting is framed in a way that favours the thermostatic hypothesis: voters express support for the current policy with the incumbent or a policy reversal with the opposition. In most advanced democracies, however, there are multiple-winner districts. This may dampen the ‘signal’.
Basic constitutional designs are also likely to influence responsiveness. The USA, for example, is a federal state. Many policy-making powers are reserved to the individual states. This makes it difficult for the electorate to allocate responsibility (Soroka and Wlezien, Reference Soroka and Wlezien2010). It also makes it more difficult for the federal government – president and Congress – to respond to changing preferences. Britain, by contrast, is – despite moves towards devolution – highly centralized. Sub-national governments are subservient to Westminster (King, Reference King2010). This makes it puzzling why British governments do not appear to rationally accommodate preferences.
Other aspects of constitutional design may also modify government responsiveness. The USA has an elaborated system of checks and balances that reduces the ability of government to respond to preferences (King, Reference King2010). The activities of congress and president are also subject to constitutional review by the courts. Lawmakers must factor this in when considering their response to the ebb and flow of public preferences. The British system, moroever, is characterized by a ‘fusion’ of executive and legislative power. The prime minister and cabinet usually command a majority in the House of Commons. The courts have very limited powers and ministers do not fear the ‘judge over their shoulder’ (King, Reference King2010). British governments are capable of responding. This again makes it all the more puzzling that they do not appear to respond (Bartle et al., Reference Bartle, Avellaneda and McGann2019).
The Spanish case study
The macro-political research design provides a powerful framework to examine claims about representation. Nevertheless, it requires a great deal of data on both public preferences and policy. The Spanish case is potentially significant because it is just the fifth study of the national policy mood and only the third study of dynamic representation. It is also interesting because it is the first macro-political study of a proportional system. Elections to the Congreso use a party-list system and the d’Hondt method. The fact that there can be multiple winners in each constituency frames the choices that voters make in less clearly thermostatic ways. To be sure, the Spanish system is not entirely representative of the proportional systems. The small district magnitude produces a larger seats to votes ratio and a tendency to single-party government (Bosch, Reference Bosch, Muro and Lago2020). The Spanish constitution provides the central government with the ability to respond to changes in preferences. There are also few checks and balances. Spanish governments have the ability to respond to preferences.
To date, the number of factors that might influence the responsiveness of the electorate and governments exceeds the number of cases. It will not be possible to isolate the unique contribution of these factors until we can undertake a large N comparative study. Until we reach that point, the addition of the Spanish case is a step towards a broader understanding of dynamic representation.
The Spanish case is also an interesting case for other reasons. It is a relatively new democracy and is generally thought to be the most prominent of the early third-wave democracies (Fishman, Reference Fishman, Muro and Lago2020). Among those countries, it has one of the longest histories and – vitally for our purposes – some of the best data (Gunther et al., Reference Gunther, Montero, Puhle, Gunther, Beck, Magalhaes and Moreno2016). It also represents the paradigmatic case of rapid welfare expansion. Just 20 years after the return of democracy and the end of the Franco regime, Spanish spending on welfare approached average European levels (Boix, Reference Boix1996). This could have left no time for Spanish public opinion (contrary to Britain, USA, and France) to evaluate policy fluctuations and respond thermostatically.
Before we apply the macro-polity framework to the Spanish case, it is useful to provide a thumbnail sketch of the development of the Spanish system. There have been just five turnovers of power in 1982, 1994, 2004, 2011, and 2018 (the latter falls outside the period for which we have data). The first turnover was not a simple transfer from one ‘side’ to another. The transition government that ruled Spain from 1976 to 1982 was made up of the reformists of the old regime (such as Presidents Adolfo Suárez and Leopoldo Calvo-Sotelo) under the umbrella of the Unión de Centro Democrático (UCD). Its essential task was to consolidate the democratic regime and meet European standards for the political and economic systems (Powell, Reference Powell2009). From our current perspective, it may seem a rather right-wing government. At that time, however, it was a reformist project.
Felipe González’s Partido Socialista Obrero Español (PSOE) were social democrats who formed governments for 14 years from 1982 to 1996. The PSOE won four consecutive election victories. This government adopted standard social democratic policies and increased spending on welfare. It expanded universal healthcare and education. It also significantly increased old-age transfers through non-contributory pensions. As a result, Spain was one of the few countries in which inequality decreased in the 1980s. During the UCD and socialist governments, the fiscal revenues also increased considerably and, as a result, tax burden increased more than ten percentage points from 1977 to 1992 (Fernández-Albertos, Reference Fernández-Albertos2012).
The PSOE was replaced by the conservative Partido Popular (PP) led by José María Aznar between 1996 and 2004. This government focussed on achieving economic stability and promoted market solutions. It was in turn replaced by the PSOE led by Rodríguez Zapatero. The new socialist government mainly focused on issues such as the territorial reform and, especially, the promotion of the social and civil rights (such as gay marriage and recognition of the Franco dictatorship victims) (Sánchez-Cuenca, Reference Sánchez-Cuenca2012). It increased the minimum wage and old-age pensions, expanded paternity leave, and implemented new disability laws (Bernardi and Sarasa, Reference Bernardi, Sarasa, Sánchez-Cuenca and Bosco2009)
Economic issues dominated Zapatero’s second government. It tried to elude the Great Recession of the late 2000s by increasing public spending and implementing public works programmes (Gunther and Montero, Reference Gunther and Montero2009; Urquizu, Reference Urquizu, Anduiza, Bosch, Orriols and Rico2014). It then announced a U-turn. The stimulus program ended, public wages were cut, and pensions frozen (Fernández-Albertos, Reference Fernández-Albertos2012). It was replaced in 2011 by a new PP government led by Mariano Rajoy. This continued to implement the austerity policies in line with Spain’s membership of the eurozone. This government lost its majority in 2016 and collapsed in 2018. It was replaced by PSOE after losing a vote of non-confidence.
The economic crisis of 2008 rapidly turned into a political crisis. Political distrust in all political institutions (parliament, government, European Union, and political parties) peaked during the 2010–2012 period, when the economic crisis hit hardest (Orriols and Rico, Reference Orriols, Rico, Anduiza, Bosch, Orriols and Rico2014). The two-party system dominated by PP and PSOE was eroded in the 2015 general elections. The economic crisis (Bosch and Duran, Reference Bosch and Duran2019) and political disaffection and distrust (Orriols and Cordero, Reference Orriols and Cordero2016) led to the emergence of two new parties in the 2014–2016 period: the left-wing Podemos and the centre-right Ciudadanos.
Data and methods
Our methodology replicates that used in the USA, Britain, and France (Stimson Reference Stimson1999; Bartle et al., Reference Bartle, Dellepiane Avellaneda and Stimson2011; Stimson et al., Reference Stimson, Thiébaut and Tiberj2012).Footnote 5
Preferences and mood
The database that is used to estimate mood consists of marginal responses to survey items that measure preferences on controversial issues (Stokes, Reference Stokes1963). These include those that touch on the traditional left–right battles between government intervention and the free market, the welfare state, public vs. private ownership, public spending, taxation, and poverty and inequality. It also includes preferences on law and order, moral attitudes, abortion, post-materialism, race and immigration, the environment, defence, Europe, and left–right self-placement.Footnote 6 The database includes unambiguous indicators of preference, such as the CIS ‘forced choice’ question about devolution that asks respondents to choose between ‘a national government without regions’, ‘regions with less powers’, ‘regions with the same powers as now’, ‘regions with more powers’, and ‘regions with the right of independence’. It also includes a large number of ‘Likert-type’ items that invite respondents to agree or disagree with statements. These responses imply preferences: those who agree that ‘homosexuality is a disease’, for example, are likely to oppose liberalization (Ellis and Stimson, Reference Ellis and Stimson2012).
The algorithm used to estimate mood uses information about changing preferences to estimate the annual mood. Accordingly, only items that are repeated in more than 1 year can be used for estimation. Responses to each item were coded from 0 (most right-wing) to 11 (most left-wing), with 5 as the neutral point. The coding of responses is potentially controversial since there may be genuine disagreement in some cases about whether a position is left or right. In practice, these decisions are generally simple because the parties take positions on issues that are important to voters (Carmines and Stimson, Reference Carmines and Stimson1990). While the normative question of what positions are ‘really’ appropriate for those on the left and right absorbs the attention of political theorists, the objective question of what is left and right in relation to party competition is solved for us by the parties. The left–right dimension is a ‘party-defined space’ (Budge and Farlie, Reference Budge and Farlie1977). Spanish politics has been dominated by two major parties since the mid-1980s. The problem of how to code responses boils down to assigning the PSOE position and PP position to each issue on the understanding that these parties take opposing positions on most controversial issues. Coding responses is simply a way of establishing the ‘polarity’ of the items and does not force items onto a single left–right dimension. If items exhibit distinctive longitudinal movements – that are not shared with other series – the algorithm will identify this.
We include the respondents’ self-reported left–right positions with some hestitation. Describing oneself as ‘left’ or ‘right’ need not imply a preference (Ellis and Stimson, Reference Ellis and Stimson2012). Nevertheless, there are good reasons for believing that longitudinal changes in the number of self-declared left- or right-wingers reflect changes in preferences. In Great Britain, the left-right self-reported positions correlate with the policy mood (Bartle et al., Reference Bartle, Dellepiane Avellaneda and Stimson2011, p. 273). The same is true in France (Stimson et al., Reference Stimson, Thiébaut and Tiberj2012, p. 302). Previous studies, moreover, have relied on such indicators as a measure of mood (Hakhverdian, Reference Hakhverdian2010). Accordingly, we treat this as an empirical issue. If left-right self-positions do not track other preferences, this is something that the algorithm will identify. This decision allows us to make use of a large amount of data on left–right self-location. It also extends our time series since it is the only evidence of preferences available between 1978 and 1981.
A couple of decisions to include or exclude items need further justification. Unlike the USA case study (Erikson et al., Reference Erikson, MacKuen and Stimson2002, p. 201), we decided to include survey questions on foreign affairs. International issues have, in many instances, divided the major parties in Spain. This was especially so since 2002, when the PP government aligned with the USA foreign policy in the Middle East. The PSOE, by contrast, was less supportive of the USA foreign policy than the PP did (Del Arenal, Reference Del Arenal2008). In accordance with our general strategy of ‘letting the data decide’, we include foreign affairs items in our database.Footnote 7 We removed all survey questions whose wordings include references to named parties or politicians because we want to avoid those preferences that are excessively polluted by party or leader evaluations (Stimson, Reference Stimson1999). Those questions that refer to ‘government’ are a special case and require a degree of interpretative judgement. Those that clearly refer to a specific administration are excluded. Those that refer to ‘the government’ in the abstract are retained.
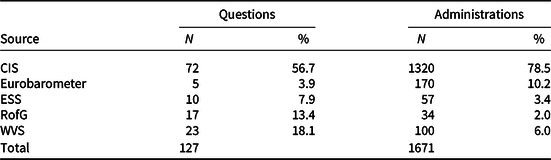
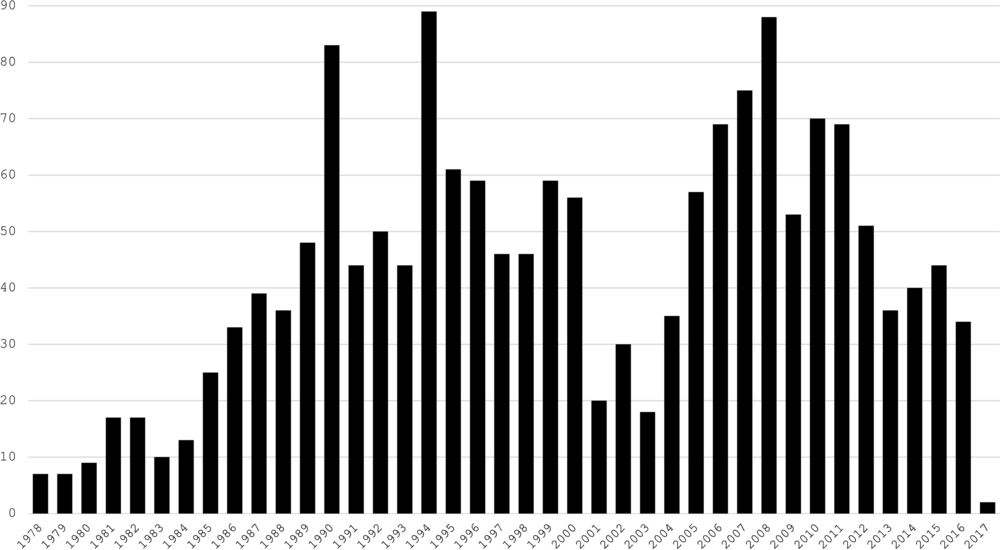
The items that were finally included were collected by five survey houses: CIS, Eurobarometer, the European Social Survey, the Role of Government survey, and the World Values Survey. Table 1 displays the number of unique questions asked by these houses and the number of administrations (times that questions were asked). The database is dominated by the CIS. This source supplies around 58% of all questions and 79% of all administrations. Figure 1 displays the number of administrations of survey questions per year. The data are thin in the late 1970s but much richer later on, with between 30 and 90 administrations per year from the mid-1980s onwards (with the partial exception of the early 2000s when there are around 20). Averaging over a large number of questions provides a reliable indicator of the underlying mood.
Data sources

Number of administrations of items per year.

The data are drawn from nationally representative studies between 1978 and 2017. Accordingly, we exclude data relating only to specific regions such as Catalonia. The final preferences data set consists of 127 survey items asked in 1671 separate administrations. On average, each survey item was asked in 13 administrations.Footnote 8 This statistic conceals considerable variation.Footnote 9 One question on left–right self-placement was asked more than 300 times, while some items were asked just twice. The longer series contributes more information about mood.
Policy
In order to test the thermostatic models, we need to develop an indicator of policy that is analogous to mood. Policy can be defined as the cumulative ‘total sum of laws and regulations regarding the particular set of issues’ (Erikson et al., Reference Erikson, MacKuen and Stimson2002, p. 285). This concept is difficult to summarize in a single measure. Governments make many laws and regulations over a wide range of issues. They legislate, enter into treaties, make administrative decisions, and tax and spend. In principle, policy can be indicated by words and/or deeds. In the Spanish case, there is no obvious text-based indicator of annual policy. Even if we had such data, moreover, the validity of such text-based indicators of policy position would depend on assumptions of unknown validity (Laver et al., Reference Laver, Benoit and Garry2003; Lowe, Reference Lowe2008). We anticipate that preferences respond to delivered rather than promised policy.Footnote 10 Most, though by no means all, issues reflect the fundamental disagreement between parties about government activity. In general, the PSOE favours more activity and the PP favours less. Most activity involves spending. Total public spending provides a convenient way of summarizing policy (Bartle et al., Reference Bartle, Avellaneda and McGann2019).
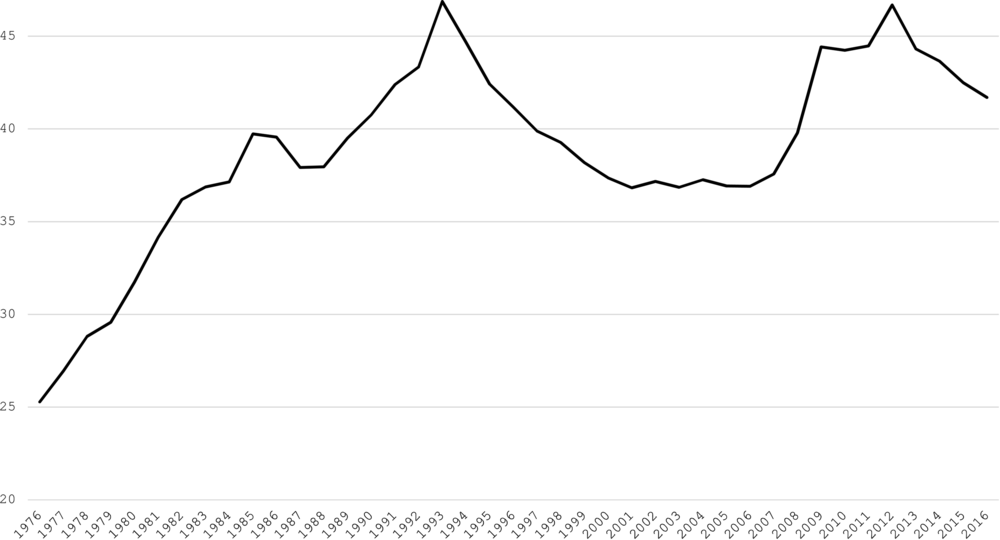
Our indicator of government activity is total outlays (disbursements) of general government as a percentage of GDP as reported by the Organization for Economic Cooperation and Development. In general, parties of the left prefer higher spending compared to the PP. In some issue domains, however, these preferences are reversed. The PSOE, for example, prefers less spending on defence. Since the return of democracy, defence spending has ranged from a high of 3% of GDP in 1984 to just 1.2% in 2016 according to Stockholm International Peace Research Institute data. In order to provide an indicator of policy that is analogous to our measure of mood, we subtract defence spending from total outlays in order to produce an indicator that we call non-military government expenditure (NMGE). Annual NMGE is displayed in Figure 2 (Bartle et al., Reference Bartle, Avellaneda and McGann2019). There has been a general increase in spending since 1976, but there were visible reductions between 1993 and 2001. Spending levelled off in the early to mid-2000s and rapidly increased following the financial crash up to 2012. Spending then fell until 2017 under the austerity programme followed by the Rajoy PP government.
Non-military government expenditure as a proportion of GDP in Spain, 1976–2017.

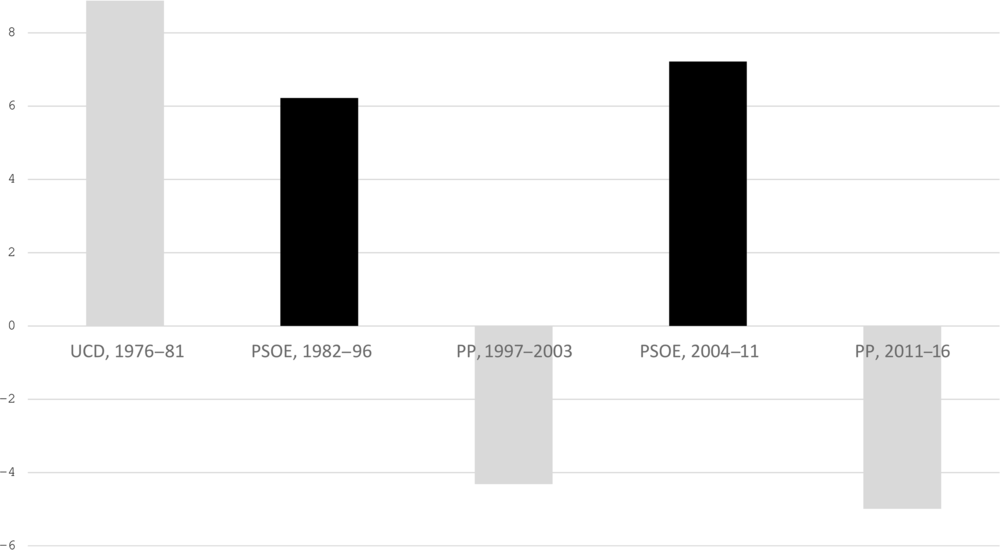
Figure 2 contains a great deal of information. In Figure 3, we simplify this to show how NMGE has varied by the five administrations between 1978 and 2017. This visual evidence suggests that the two governing parties have pursued their ideological goals. The transitional UCD government increased NMGE by fully 8.9 points between 1976 and 1982. The PSOE increased NMGE by 6.2 and 7.2 points, respectively, during their periods in office. The PP, by contrast, reduced NMGE by 4.3 and 5.0 points, respectively. Some of the increase under the PSOE between 2004 and 2011, however, was a response to the economic crisis. The NMGE was static between 2004 and 2007 at around 37% of GDP. It rose to 40% in 2008 and 45% by 2011.
Changes in government spending as a proportion of GDP by government (NMGE), 1976–2017.

Economic conditions
Studies in the USA and Britain have suggested that the mood responds to economic conditions. As unemployment increases, mood moves left as the electorate signal their desire for action to get people back to work. Accordingly, we control for unemployment in order to estimate the unique impact of discretionary policy on mood. The unemployment rate is measured by data compiled by the National Statistics Institute through its Economically Active Population Survey.
Party control of government
Mood may also respond to party control of government. Some components of policy are not properly captured by spending. Some of the variations in mood represents a rejection of government positions. To measure party control, we use a trichotomous variable scored as ‘1’ in years PSOE is in power, ‘0’ in years of right-wing (UCD or PP) rule, and ‘0.5’ in those years when there is a turnover of government.
Vote intentions
In the macro polity made up of many moving parts, mood has both causes and consequences. We examine whether the fluctuations in mood influences support for parties. Our indicator of support is the mean annual vote intention based on quarterly CIS data. Since the Spanish system has undergone a series of reconfigurations, we combine annual vote intentions for parties of the right and left. For most of the period, the right is largely PP and the left is largely the PSOE. We also explore the Pearson’s correlation between mood and party vote in general elections. In this case, the N is limited by the number of elections and the age of the party. The PP, for example, first contested the 1988 general election and contested just nine general elections.
Statistical models
Time series models enable us to track the dynamics of preferences and policy. The nature of the time series, however, raises issues. In particular, when the mood, vote intentions, and domestic spending series are inspected, we find that these variables are not stationary: the mean score moves over time. Non-stationarity creates the problem of spurious regression (Enders, Reference Enders2004). Two non-stationary variables are likely to correlate significantly, even if they are unrelated.
One approach to the problem of non-stationarity is to model relationships using error correction models (De Boef and Keele, Reference De Boef and Keele2008; Keele et al., Reference Keele, Linn and Webb2016). We difference the series until we have a stationary time series.
 $$\Delta {Y_t} = {b_0} + {b_1}\,\Delta {X_t} + a\left( {{Y_t}_{ - 1}-{g_0}-{g_1}{X_t}_{ - 1}} \right)$$
This assumes that there is a long-term equilibrium relationship between the variables. The further out of equilibrium we are, the larger the adjustment (the parameter a represents the speed of this adjustment). Error correction models are appropriate with non-stationary data if the variables are co-integrated (Engle and Granger, Reference Engle and Granger1987). Roughly speaking, this means that the variables move up and down in parallel, and the relationship remains approximately the same over the whole time period.
We use the error correction model whenever we identify a co-integrating relationship. We identify this in two ways. We perform an augmented Dickey–Fuller test (Enders, Reference Enders2004). We also establish whether the error correction parameter is significant. When using the augmented Dickey–Fuller test as a test for co-integration, we use the distribution derived by MacKinnon (Reference MacKinnon1994) and Ericsson and MacKinnon (Reference Ericsson and MacKinnon2002) (see also Grant and Lebo, Reference Grant and Lebo2016). We find evidence of co-integration in our models with mood, vote intentions, and NMGE as the dependent variables, and use error correction models in these cases.
Empirical findings
In the section on ‘The estimated mood’, we lay out our estimates of mood. In the following three sub-sections, we assess whether preferences shape policy indirectly via an ‘electoral turnover’ mechanism. More specifically, we assess whether public preferences respond to policy (in the section on ‘What drives mood?’), whether votes respond to preferences (in the section on ‘What are the consequences of mood for vote intentions?’), and finally whether policy responds to party control (in the section on ‘What are the consequences of party control and policy mood for policy?’). We also assess the ‘policy accommodation’ model by determining whether policy responds directly to mood.
The estimated mood
The preferences data, comprising 127 separate series and 1671 separate administrations, enable us to generate a large number of dyadic comparisons. This produces an estimate of the mood for each year between 1978 and 2017. About 45% of all variances in the observed preferences is common to this mood. The remaining 55% is specific to the particular issue domain, item-specific, or a function of the specific wording of each question (Erikson et al., Reference Erikson, MacKuen and Stimson2002, p. 203).Footnote 11
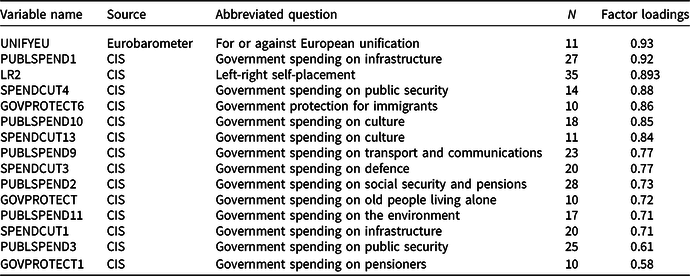
In order to illustrate the content of mood, we briefly examine the factor loadings for individual items on the estimated mood series. There are 127 series. It is not easy to interpret all the loadings. Since the series vary in length and their relationship with mood, it would be misleading to examine all loadings. Table 2 displays the loadings for the preference items that are entered in the database in at least 10 years and load at 0.5 or above. In total, there are 15 items that meet these joint requirements. Of these items, 13 relate to government activity as monitored by the CIS, including spending on infrastructure, pensions, culture, transport, public security, and the environment. These are exactly the sorts of issues that the PSOE and the PP have always disagreed about.
Item loadings of policy mood, 1978–2017
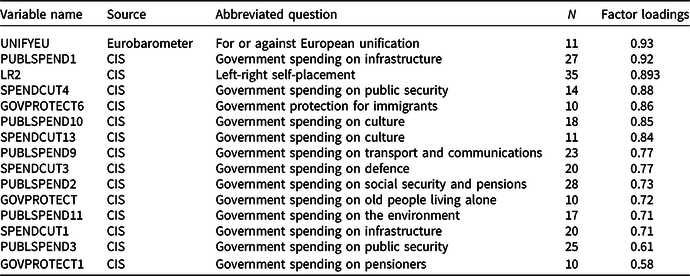
The remaining two items that satisfy the joint conditions for inclusion in Table 2 relate to support for European unity and left–right self-placement. The prominence of the European issue in this table suggests that it may have been folded into a general left–right dimension (Carmines and Stimson, Reference Carmines and Stimson1990). This replicates findings in Britain (Bartle et al., Reference Bartle, Dellepiane Avellaneda and Stimson2011). The loadings for left–right self-placement suggest that in Spain – just as in Britain and France – left–right self-placement tracks other preferences.
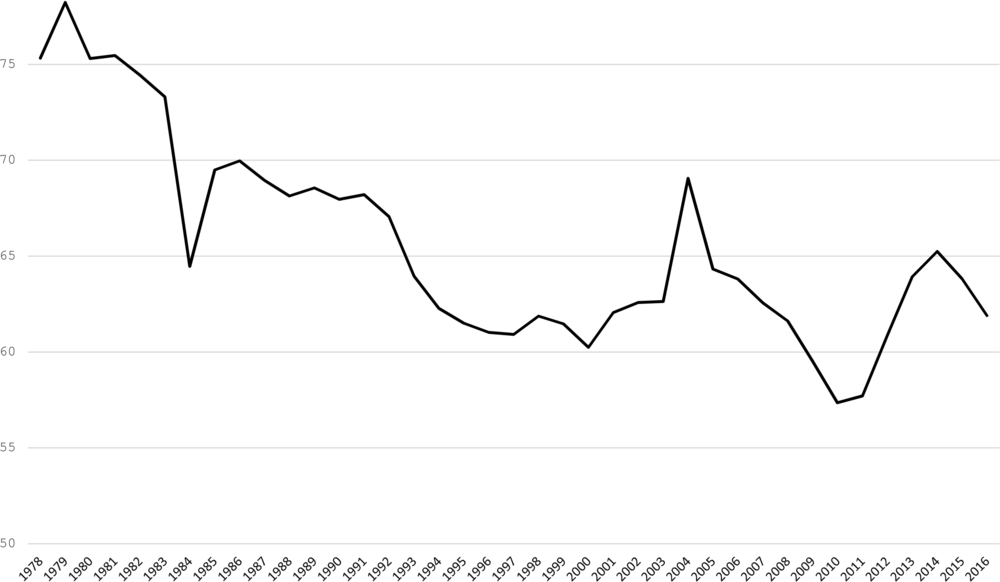
The series is calibrated, so that 50 represents a balance of left and right responses. Scores above 50 indicate that the mood is on balance left. Scores below 50 indicate that the mood is right. Figure 4 suggests that the Spanish electorate has been left throughout the 39 years for which we have data. Nevertheless, the electorate’s mood trended to the right across this period. Within this overall picture, there are a series of distinct movements. The mood shifted sharply left between 2003 and 2004, just before PSOE’s return to power. It then tracked right until 2011, when it shifted left again, peaking in 2015. The mood then fell back to the right by 2017, though this may be a product of the small amount of data available to use in that year (see Figure 1).Footnote 12
The Spanish policy mood, 1978–2017.

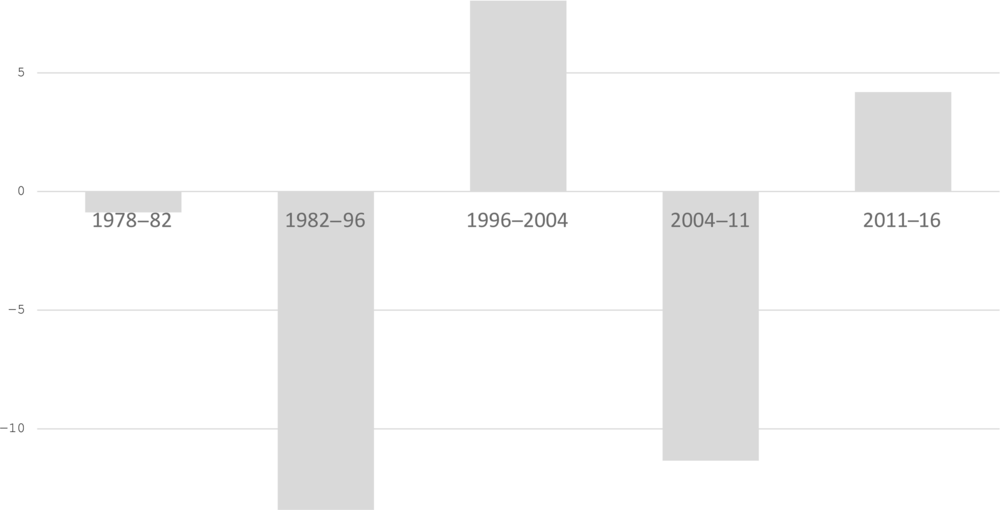
Figure 4 contains a lot of detail about the annual policy mood. Figure 5 summarizes the variations in mood by government. This shows that the mood moved right under the transitional UCD government and both the PSOE governments. Conversely, it moved left under both PP administrations. If we take party as a rough indicator of policy (left under UCD and PSOE, right under PP), this provides some initial support for the thermostatic hypothesis. Party control of government is, however, an imperfect indicator of policy. In the next section, we directly examine whether the electorate respond thermostatically to policy using our spending-based measure (NMGE).
Changes in the policy mood by government, 1978–2017.

What drives mood?
Before we formally model the policy mood, we must take into account the fact that the mood series is not stationary. The augmented Dickey–Fuller for the raw mood is −2.04.Footnote 13 This is less than the critical value of –3.662. The augmented Dickey–Fuller for the first difference in the policy mood is −7.15. This suggests that an error correction model (ECM) specification, with the first difference as the dependent variable, is appropriate. The ECMs assume that the major path of causality between two variables is that the explanatory variables create a dynamic equilibrium for the variable to be explained. The unit root variable (Y) is thought to equilibrate to a level dependent on the level of the causal series (X). When disturbed by some exogenous condition or event, it will tend to equilibrate but to the dynamic target set by the explanatory variable, not to a fixed mean. The evidence for dynamic equilibration is (1) the significant relationships that are observed between the level of the explanatory series and change in the dependent series (the ‘long-term’ effects) and (2) the error correction phenomenon, where changes in the dependent variable are negatively related to the previous deviations from the dynamic equilibrium.
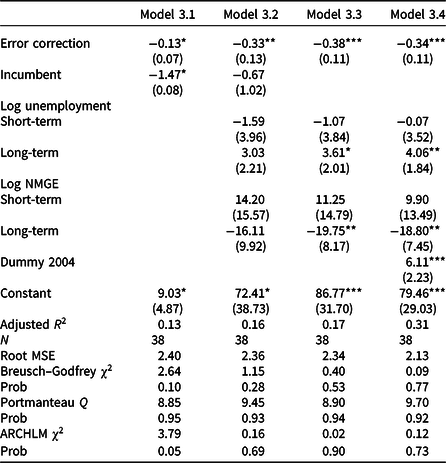
Table 3 displays a series of error correction models.Footnote 14 Model 3.1 simply examines the impact of party control on mood. The negative coefficient for the error correction term is correctly signed and supports an ECM specification. The negative coefficient for the party control variable suggests that the mood moves right under PSOE and left under PP/UCD governments. The coefficient for control (b = −1.47), however, is not large. Both it and the error correction coefficient are statistically significant only at the generous threshold of P < 0.1.
Models of mood, 1978–2017 (unsmoothed estimates)
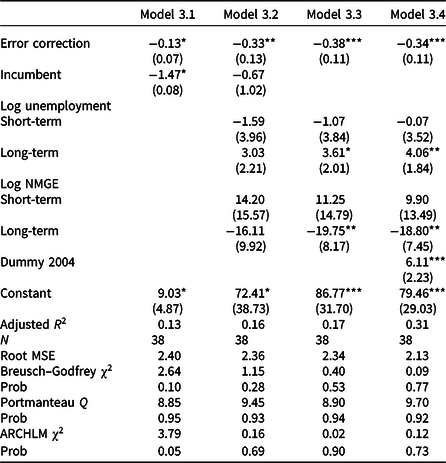
Model 3.2 adds logged indicators of policy and economic conditions to the equation.Footnote 15 Neither of the coefficients for short-term effects of NMGE and unemployment are statistically significant. The coefficients for the long-term effects of NMGE (b = −16.11) and unemployment (b = 0.23) are both correctly signed but only NMGE is statistically significant at P < 0.1. The coefficient for party control (b = −0.67) is no longer significant. This is omitted in Model 3.3. The long-term effects for both NMGE (b = 19.75) and unemployment (b = 3.61) have the correct (and statistically significant) relationships with mood. The fit of this model is low (R 2 = 0.17) but similar to the ECM models for Britain (Bartle et al., Reference Bartle, Dellepiane Avellaneda and Stimson2011). Model 3.4 finally adds a dummy variable to account for the steep increase that we observe in Figure 2 around 2004. The adjusted R 2 for this model increases substantially to 0.31. The coefficient for this variable is both large (b = 6.11) and statistically significant (P < 0.01). The coefficients for both the long-term effects of both NMGE (b = −18.80) and unemployment (b = 4.06) are also both larger and more significant.Footnote 16
Predicting first differences is challenging. All in all, however, these results provide support for the thermostatic hypothesis in relation to the responsiveness of the electorate.Footnote 17 While Figure 5 provides the impression that party control of government alone influences mood, it does not have an effect net of policy and economic conditions. The swing of preferences for government activity is caused by policy (NMGE).
These findings provide a reassuring story about public responsiveness. Preferences are driven by policy (Soroka and Wlezien, Reference Soroka and Wlezien2010). The electorate displays a collective responsiveness that is surprising, given what we know about the ‘typical individual’ (Erikson et al., Reference Erikson, MacKuen and Stimson2002). In the next section, we examine whether variations in mood have consequences for another form of mass political behaviour.
What are the consequences of mood for vote intentions?
Mood is one of the most important variables in the system of equations that make up the USA macro-political system (Erikson et al., Reference Erikson, MacKuen and Stimson2002). We now examine its impact on vote intentions. We need to be cautious about interpreting our findings since we are not able to control for other factors that might influence vote, such as evaluations of party competence (Green and Jennings, Reference Green and Jennings2012) and evaluations of party leaders (King, Reference King2002). The time series evidence about these concepts, however, is too fragmentary to incorporate in our annual vote intention models.
Vote intentions for parties of the left and parties of the right are both unit roots. The Dickey–Fuller statistic for left vote intentions is −2.853 and that for the right is −1.463. The Dickey–Fuller statistics for the first differences are −6.212 and −4.094, respectively, suggesting that error correction specifications with the first difference as the dependent variable are appropriate.
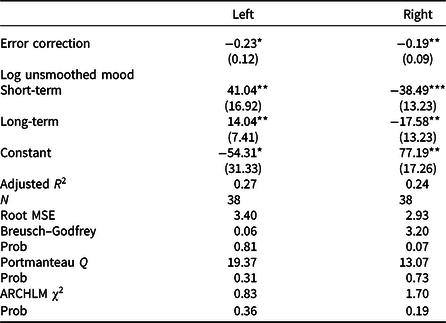
Table 4 reports models of annual vote intentions for parties of the left and right between 1978 and 2017. The models clearly suggest that logged value of lagged unsmoothed mood has significant short-term and long-term effects on annual vote intentions for the left and right. The positive coefficients for mood in the left vote intentions model (short-term b = 41.04 and long-term b = 14.04) suggest that as the mood moves left, support for parties of the left increase. The negative coefficients for mood in the right vote intentions vote model (short-term b = −38.49 and long-term b = −17.59) suggest that as the mood moves left, support for the parties of the right decrease.Footnote 18
Models of vote intentions 1978–2017

The evidence further suggests that mood is associated with general election vote shares. The Pearson’s correlation between mood and vote for the PSOE is 0.33 (N = 17), while that for the PP is 0.87 (N = 17). There are more forces that influence general election outcomes. Movements in mood, however, appear to have electoral consequences. This evidence provides further support for the proposed electoral connection.
What are the consequences of party control and policy mood for policy?
To this point, we have established the first two links in the electoral turnover mechanism. In this section, we assess what drives policy. If party control drives policy, the electoral turnover mechanism will be supported. If mood drives policy, the policy accommodation mechanism will be supported.
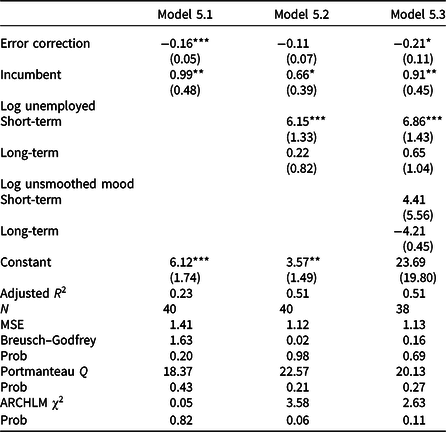
Table 5 displays the results of a series of regressions that are designed to test whether policy responds thermostatically to party control, unemployment, and mood (as the ‘policy accommodation’ hypothesis suggests). Model 5.1 provides a test of the hypothesis that policy is simply a function of party control: that parties of the left spend more than parties of the right. The coefficient for control (b = 0.99) is correctly signed and statistically significant. It remains so as we add controls for logged lagged unemployment in Model 5.2 and logged lagged mood in Model 5.3. The finding that ‘party matters’ to policy is robust (Blais et al., Reference Blais, Blake and Dion1993, Reference Blais, Blake and Dion1996 cf. Rose, Reference Rose1980).
Model of policy, 1978–2018

Model 5.2 provides a test of the hypothesis that spending rises as a result of unemployment. This is confirmed in the short-term (b = 6.15) but not in the long-term (b = 0.22 and is statistically insignificant). These findings persist when we add controls for mood in model 5.3. This final model tests the proposition that spending responds thermostatically to movements in mood as proposed in the policy accommodation mechanism (Erikson et al., Reference Erikson, MacKuen and Stimson2002; Bartle et al., Reference Bartle, Avellaneda and McGann2019). This can be rejected in both the short and long-terms. The coefficients (b = 4.41 and −4.21, respectively) are both statistically insignificant. Spanish governments respond to the public by paying more attention to the ‘most important issue’, particularly where the government has a clear responsibility (Chaqués Bonafont and Palau, Reference Chaqués Bonafont and Palau2011). This attention, however, does not appear to translate into policy activity, at least as measured by spending.
These findings suggest that mood is thermostatically responsive to policy. The reverse, however, is not true: policy is not thermostatically responsive to mood. This asymmetry suggests that Spanish macro polity is similar to Britain and different from the USA (Erikson et al., Reference Erikson, MacKuen and Stimson2002; Bartle et al., Reference Bartle, Avellaneda and McGann2019). It may also suggest that the USA findings are exceptional and unrepresentative of how representation works in macro-political systems. Political scientists should not assume that policy accommodation produces dynamic representation everywhere. We need further case studies before drawing general conclusions. In the meantime, this study provides a useful template to follow.
Discussion
The measures of policy in the USA, Great Britain, and Spain are not equivalent. The USA studies incorporated congressional rating scales and congressional role call outcomes (Stimson et al., Reference Stimson, MacKuen and Erikson1995; Erikson et al., Reference Erikson, MacKuen and Stimson2002, pp. 294–296). They did not examine spending. The different findings may be the result of these differences. Policy is a combination of what governments say and do. Policy activity includes both legislative votes and legislation. Rating scales are not available for Great Britain or Spain. Roll call votes, moreover, make little sense in systems such as Westminster and the Congresso where party loyalty is strong.
If we are to understand how institutions condition the macro-polity of moving parts, the next generation of studies should focus on producing cross-national indicators of policy analogous to mood. Government spending as a proportion of GDP seems an appropriate indicator. It gets to the heart of the main dimension of political competition in most countries. To be sure, not all policy involves spending but a lot – even most of it – does. Equivalent measures of spending are widely available. Money and GDP are obvious numeraires. Spending is likely to loom large in most comparative studies.
There are some texts that provide a basis for comparison of policy and representation across systems. Party programmes provide the basis for government policy. To be sure, promises and delivered policy are not the same, particularly given the complexities of coalitions. Nevertheless, the cross-national Manifesto Research on Political Representation group has conveniently analysed the text of party programmes and produced a summary measure that is tolerably analogous to mood. If parties are office seeking, we might expect party positions to correlate with the mood.
The right–left (RILE) scores that summarize party positions are estimated by allocating each sentence or quasi-sentence into one of 56 coding categories (Budge et al., Reference Budge, Klingemann, Volkens, Bara and Tanenbaum2001). Thirteen of these categories are designated as ‘right’ and thirteen as ‘left’. The latter are subtracted from the former to calculate the overall RILE score. The higher the score, the more right-wing the party’s position. This measure has a degree of face validity and proven useful in a wide range of studies (Budge et al., Reference Budge, Klingemann, Volkens, Bara and Tanenbaum2001).
The Pearson’s correlation between Spanish mood and PSOE RILE scores is 0.39 (N = 11).Footnote 19 This suggests that the PSOE moves in the opposite direction to mood. The correlation between mood and PP RILE score, on the other hand, is −0.38 (N = 8). The PP has tracked mood to a degree. This replicates British findings (Allen et al., Reference Allen, Bartle and Quinn2018). For the moment at least, it appears that parties of the right track mood better than parties of the left. This does not tell us, of course, which party was closer to the average elector at any point in time. If we could find someway of recalibrating both series on the same metric, we would be able to establish just how close the parties were to the mood (Erikson et al., Reference Erikson, MacKuen and Stimson2002). For the moment, it seems that the PP’s policy promises are more sensitive to the mood than the PSOE’s. Over time this ought to mean that the electorate is closer to the PP than before. This may account for its improved electoral performance.
Conclusion
This paper has examined the role of the policy mood in the Spanish system between 1978 and 2017 using a wealth of data. The Spanish electorate have tended to move right over time in response to both government policy and economic conditions. Since the scope of government activity – as measured by NMGE and other indicators – has increased over time, this sustained thermostatic response provides a plausible explanation of the rightward drift of the electorate (Wlezien, Reference Wlezien1995; Soroka and Wlezien, Reference Soroka and Wlezien2010). This is an important finding: Spanish public preferences reflect policy activity.
Since Spanish governments are thermostatically unresponsive to mood, the only way that policy can be brought into line with preferences is via a turnover of power from one ‘side’ to ‘the other’. The fact that votes respond to preferences suggests that mood may indirectly influence policy. To be sure, a government whose basic policy programme is out of line with preferences may win re-election if it enjoys a reputation for competence (Green and Jennings, Reference Green and Jennings2012). When it loses this reputation, as a result of poor performance or ‘the costs of ruling’, the turnover of power from one ‘side’ to another may bring preferences back into line over time (Bartle et al., Reference Bartle, Avellaneda and McGann2019).
While the electorate is responsive to policy, party policy does not appear to be thermostatically responsive to the mood. This is a striking finding in the British and Spanish cases because there are few constitutional limits on government. Policy inertia may make it difficult to respond or reverse policy when needed (Wilson, Reference Wilson2000). It may simply be that parties are rather more policy and rather less office seeking than widely assumed (Strøm, Reference Strøm1990). Even if parties are aware of the mood, they may ignore it and pursue ideological goals to satisfy their members. Parties, afterall, rely on those members for funds and campaigns. They cannot easily modulate policy in response to electoral preferences (Budge, Reference Budge1994). Parties may also be ignorant of the mood and not sense these long-term shifts in opinion across seemingly unrelated issues. The two explanations, of course, may be inter-related. Ideology provides the emotional basis for the sort of ‘motivated reasoning’ (Epley and Gilovich, Reference Epley and Gilovich2016). Strong ideological motivations may lead to a distorted impression of public opinion.
The lack of responsiveness may be a factor behind citizens’ disaffection with the system and distrust of political parties. It may even be a factor behind the collapse of the two-party system in 2015 and the emergence of new parties, Podemos and Ciudadanos, with political and democratic regeneration agendas. Policy is often moving in the opposite direction to preferences. Political distrust after the Great Recession certainly appears to have been caused by citizens’ feelings that the system was unresponsive (Torcal, Reference Torcal2014). A great deal of research shows that Spaniards are dissatisfied with how their MP represents citizens’ interests (Delgado et al., Reference Delgado, Martínez and Oñate1998; Méndez-Lago and Martínez, Reference Méndez-Lago and Martínez2002). Voting for Podemos in 2015 was associated with the belief that politicians do not care much with what people think (Rodríguez-Teruel et al., Reference Rodríguez-Teruel, Barrio, Barberà, Llera, Baras and Montabes2018a). Similarly, voting for Ciudadanos was correlated with thinking that politicians pursue their own self-interests (Rodríguez-Teruel and Barrio, Reference Rodríguez-Teruel, Barrio, Llera, Baras and Montabes2018b).
If this is a general phenomenon across representative democracies, we tentatively suggest that the prolonged unresponsiveness of policy to mood may account for the rise of populist politicians, especially after the economic crisis that further limits governments’ ability to respond. This important change in the political supply may reverse the situation and make the Spanish democracy more responsive to citizens’ preferences. We must be careful, however, not to claim too much. Our study deals with the long-term evolution of policy mood. For the moment, we lack sufficient information to determine the potential effects of the party system change on policy responsiveness. This does, however, appear to represent a potentially rich research agenda.
Acknowledgements
Agusti Bosch acknowledges the funding from the Spanish Ministry of Science through grant number CSO2017-83086-R.
Supplementary material
To view supplementary material for this article, please visit https://doi.org/10.1017/S175577392000003X.