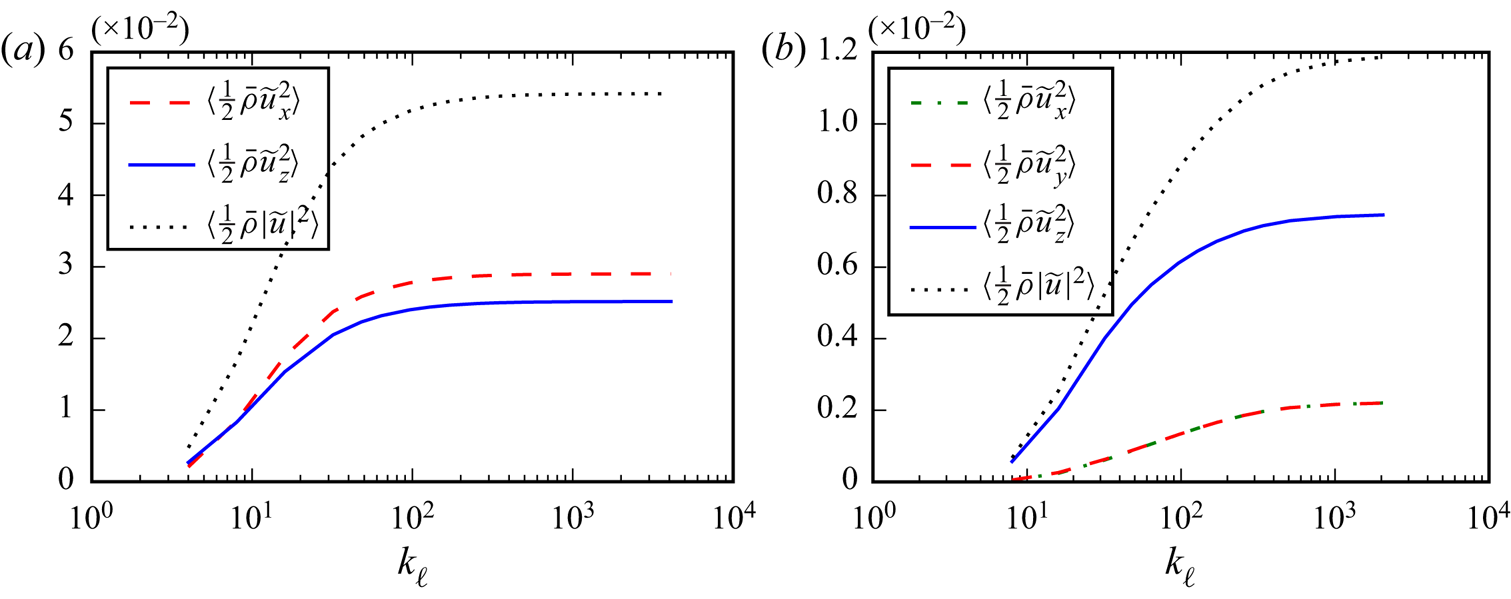
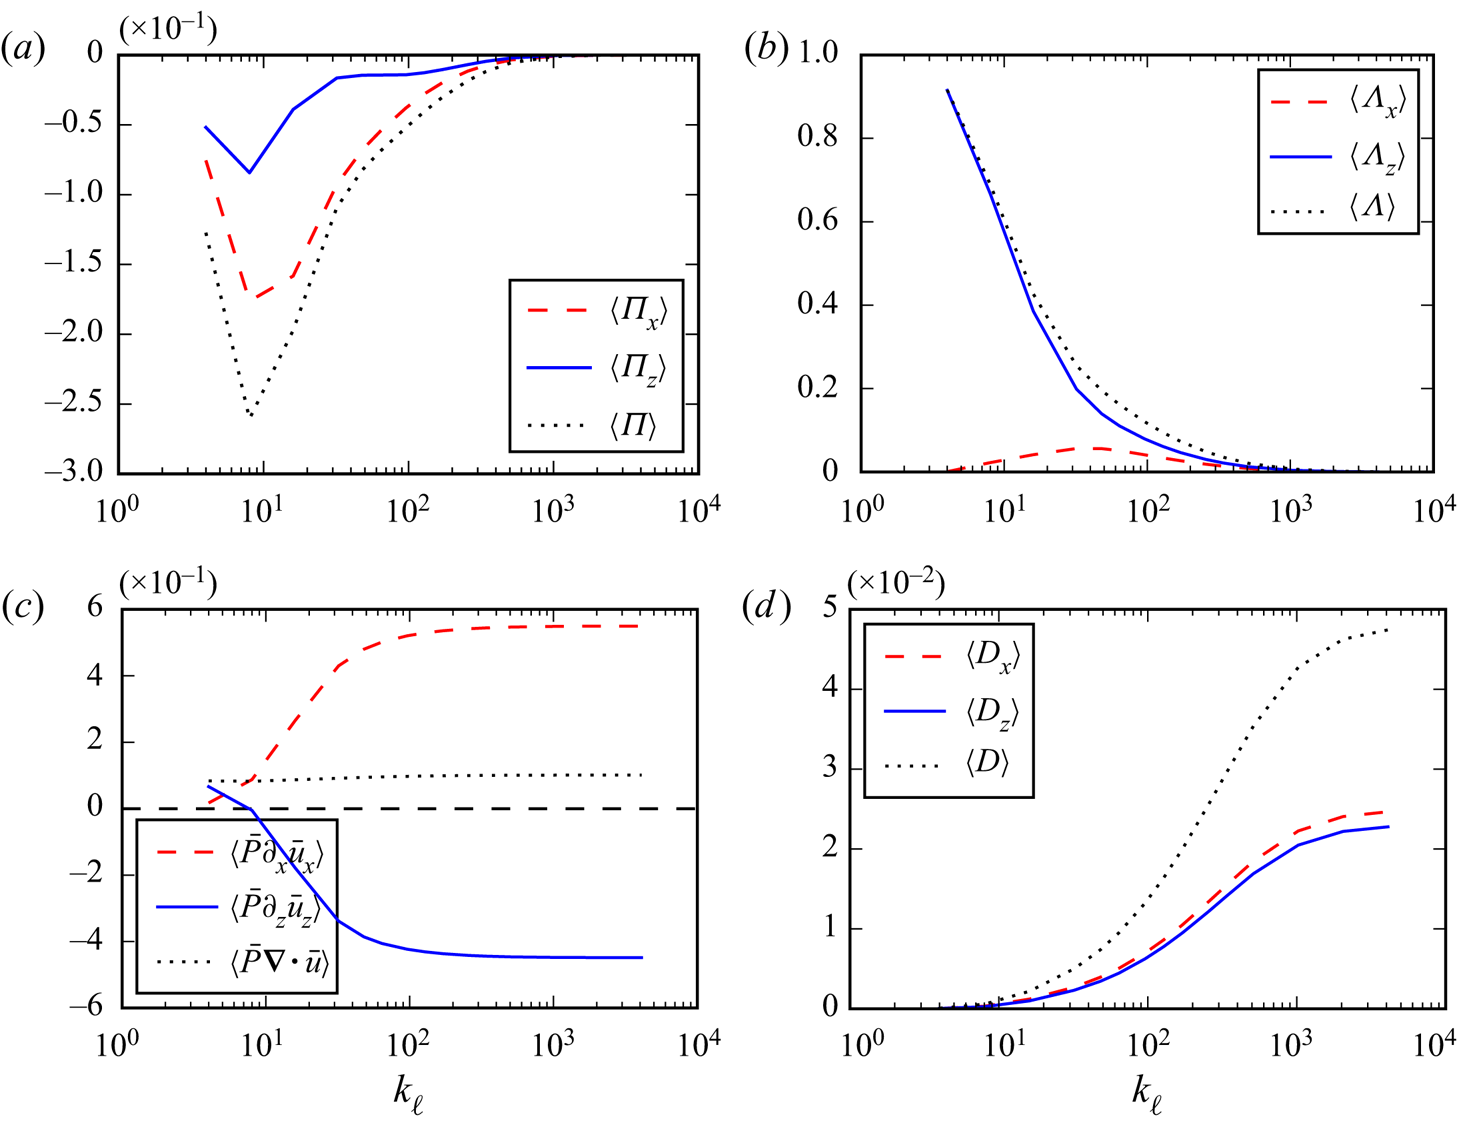
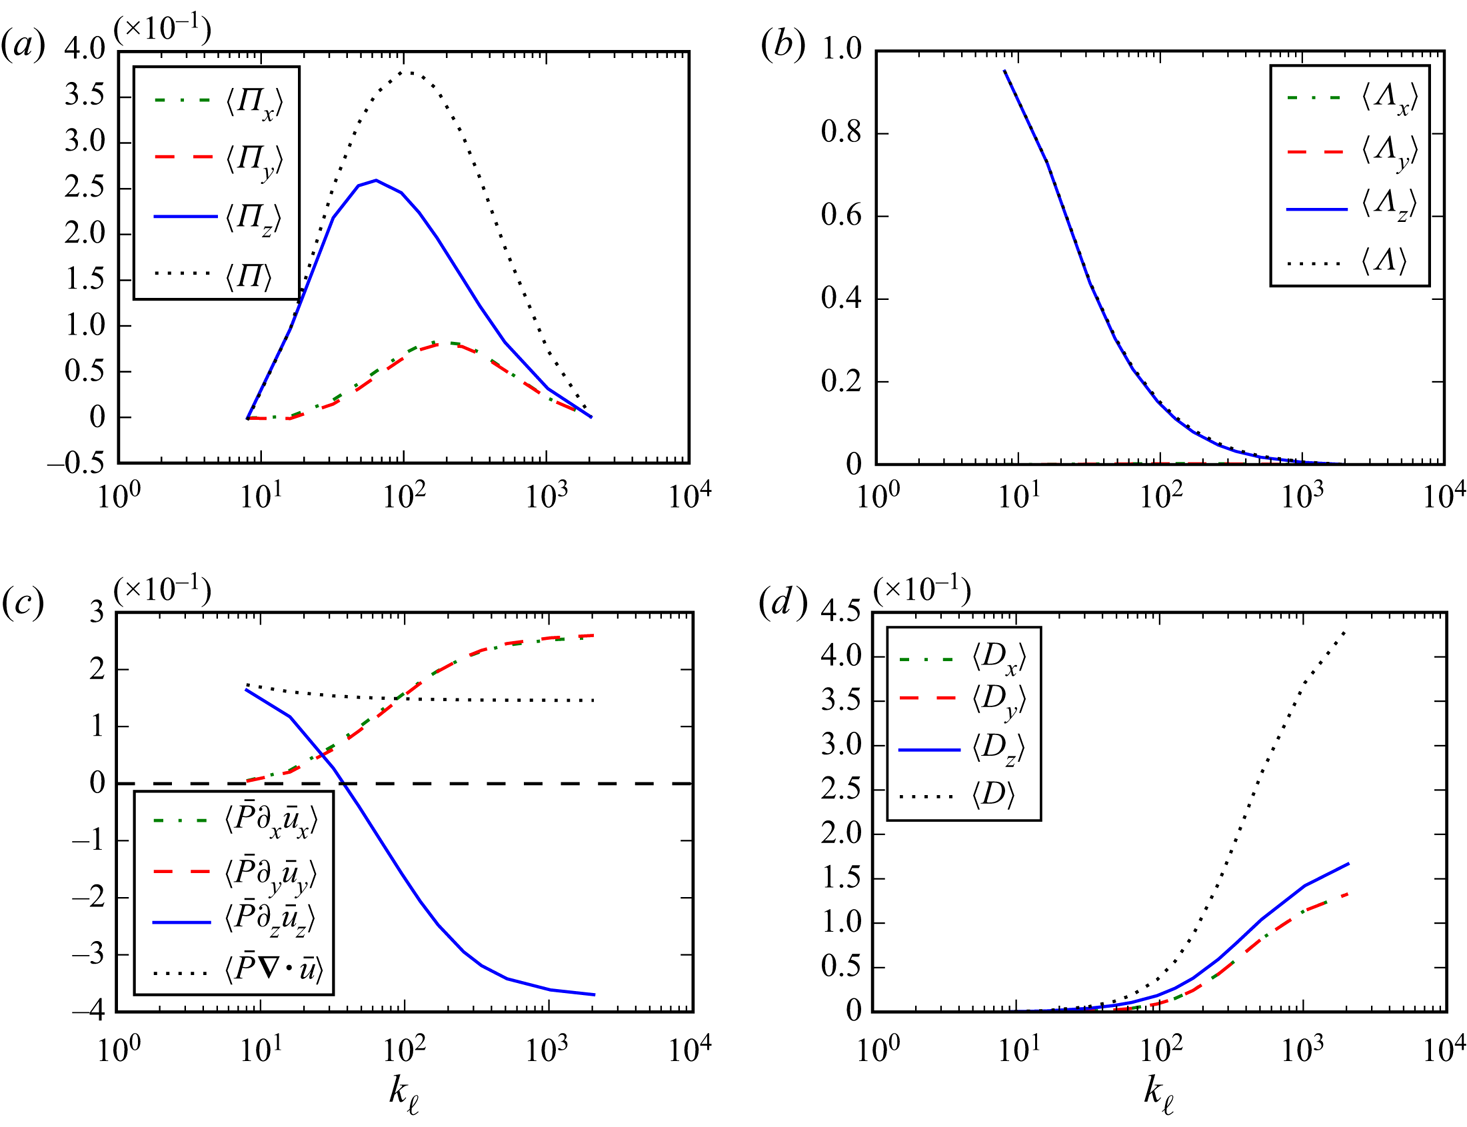
1. Introduction
The Rayleigh–Taylor (RT) instability occurs when a heavy fluid is on top of a light fluid in the presence of gravity, or more generally when a light fluid is accelerated against a heavy fluid (Rayleigh Reference Rayleigh1883; Taylor Reference Taylor1950). It is of both fundamental interest and practical importance in many fields and applications. For example, RT instability plays a leading role in the propagation of the thermonuclear flame front in supernova explosions (Hillebrandt & Niemeyer Reference Hillebrandt and Niemeyer2000) and is a main obstacle towards achieving ignition in inertial confinement fusion (ICF) (Betti & Hurricane Reference Betti and Hurricane2016).
Any reasonable fluid dynamicist would probably agree that modelling such RT unstable three- dimensional (3-D) systems using two-dimensional (2-D) simulations is inferior to using 3-D simulations. Yet, what aspects of the dynamics may be misrepresented in a 2-D simulation? How might such misrepresentation affect the overall modelled system and conclusions? Answers to these questions are not readily clear, which perhaps explains why 2-D RT modelling still being relied upon due to its lower computational costs. This holds to varying degrees in the fluids literature (e.g. Wei et al. Reference Wei, Dou, Qian and Wang2017; Zhang et al. Reference Zhang, Wang, Ye, Wu, Guo, Ding, Zhang and He2018c; Bestehorn Reference Bestehorn2020), the astrophysics literature (e.g. Just et al. Reference Just, Bollig, Janka, Obergaulinger, Glas and Nagataki2018; Kotake et al. Reference Kotake, Takiwaki, Fischer, Nakamura and Martínez-Pinedo2018; Chen, Woosley & Whalen Reference Chen, Woosley and Whalen2020) among several others. For example, in plasma physics research, 2-D simulations are still the main ‘workhorse’ for experimental design in inertial fusion to this day (e.g. Hopkins et al. Reference Hopkins2018; Anderson et al. Reference Anderson2020; Carpenter et al. Reference Carpenter, Mancini, Harding, Harvey-Thompson, Geissel, Weis, Hansen, Peterson and Rochau2020; Meaney et al. Reference Meaney2020; Weber et al. Reference Weber2020). The ICF modellers aim to predict or postdict results from shots (i.e. experiments) in the laboratory. Given finite computational resources, the choice is often to include more physical processes in simulations at the expense of conducting them in two dimensions, despite the recognition that 3-D modelling is preferable. Such decisions are often made in large part because the trade-offs between 2-D and 3-D flow physics are not as clear as the trade-offs between whether or not to include laser deposition physics, hohlraum physics or resolve effects such as from the ‘tent’ or ‘stalk-mount’ (Clark et al. Reference Clark2016). A main aim of this work is to highlight the stark differences between 2-D and 3-D RT flow physics.
Based on constant-density incompressible homogeneous 2-D turbulence (Kraichnan Reference Kraichnan1967), it is sometimes argued that due to vorticity (or enstrophy) conservation, we should expect a net upscale cascade in 2-D RT (e.g. Cabot Reference Cabot2006). However, RT flows do not conserve vorticity, even in two dimensions, due to baroclinicity. Therefore, extending such an argument (Kraichnan Reference Kraichnan1967) from constant-density homogeneous flows to inhomogeneous flows with variable density (VD) remains dubious. Why should we expect 2-D RT flows to yield an upscale cascade if the underlying cause for such a phenomenon, namely vorticity conservation, does not hold in VD flows? One contribution of this work is to demonstrate, via a direct measurement of the cascade, that a net upscale cascade does indeed exist in 2-D RT flows with significant density variation, despite the lack of vorticity conservation. Moreover, we show that such an upscale cascade leads to a spurious positive feedback loop that is absent from 3-D RT.
Even in 3-D RT, there is considerable confusion on whether kinetic energy (KE) is transferred upscale or downscale. In many studies discussing RT flows in three dimensions, there is a pervasive notion that the generation of successively larger bubbles following the presence of smaller ones is due to an upscale cascade of energy which causes small bubbles to ‘merge’ into larger ones. This seems to pervade several research areas, such as studies motivated by ICF (e.g. Alon et al. Reference Alon, Hecht, Ofer and Shvarts1995; Shvarts et al. Reference Shvarts, Alon, Ofer, Mccrory and Verdon1995; Ofer et al. Reference Ofer, Alon, Shvarts, Mccrory and Verdon1996; Oron et al. Reference Oron, Arazi, Kartoon, Rikanati, Alon and Shvarts2001; Zhou et al. Reference Zhou2003), magnetic fusion (e.g. Douglas, Deeney & Roderick Reference Douglas, Deeney and Roderick1998), astrophysics (e.g. Joggerst, Almgren & Woosley Reference Joggerst, Almgren and Woosley2010; Porth, Komissarov & Keppens Reference Porth, Komissarov and Keppens2014) or fundamental fluid dynamics (e.g. Abarzhi Reference Abarzhi1998; Cheng, Glimm & Sharp Reference Cheng, Glimm and Sharp2002; Cabot Reference Cabot2006). According to such a narrative, the small scales are the source of energy feeding and sustaining the large scales, even in three dimensions. A main result of our paper is measuring the net energy transfer in 3-D RT directly and showing that it is downscale rather than upscale. We show that the emergence of successively larger scales in 3-D RT is driven not by an upscale cascade but by baropycnal work.
1.1. Brief overview of RT flows
Rayleigh–Taylor instability driven flows occur when a heavy fluid is accelerated against a light fluid and is manifested by the formation of upward rising bubbles of the light fluid and downward sinking spikes of the heavy fluid. There are several valuable reviews on the topic (Sharp Reference Sharp1984; Kull Reference Kull1991; Abarzhi Reference Abarzhi2010; Boffetta & Mazzino Reference Boffetta and Mazzino2017; Zhou Reference Zhou2017a,Reference Zhoub; Livescu Reference Livescu2020).
Rayleigh–Taylor flows are usually categorized either as single-mode, in which the initial perturbation consists of a single sinusoidal wave spanning the domain, or as multimode, in which the initial perturbation has a broad spectrum. During the early linear stage of evolution, single-mode RT grows exponentially before nonlinear effects set in and its growth rate plateaus (Layzer Reference Layzer1955; Goncharov Reference Goncharov2002), then undergoes further acceleration (Wei & Livescu Reference Wei and Livescu2012) due to vorticity production (Ramaprabhu et al. Reference Ramaprabhu, Dimonte, Woodward, Fryer, Rockefeller, Muthuraman, Lin and Jayaraj2012; Bian et al. Reference Bian, Aluie, Zhao, Zhang and Livescu2020). In contrast, multimode RT is expected to evolve as a set of uncoupled modes during the linear stage before mode coupling sets in due to nonlinear interactions between different scales (Dimonte Reference Dimonte2004). Multimode RT becomes turbulent with a wide range of scales, characterized by a quadratic-in-time self-similar growth of the mixing layer between the heavy and light fluids (e.g. Ristorcelli & Clark Reference Ristorcelli and Clark2004).
The self-similar stage is dominated by growth of the largest structures present at any given time. The self-similar dynamics has been divided into two categories, depending on the initial perturbation spectrum (Glimm & Li Reference Glimm and Li1988; Shvarts et al. Reference Shvarts, Alon, Ofer, Mccrory and Verdon1995; Dimonte Reference Dimonte2004; Dimonte et al. Reference Dimonte, Ramaprabhu, Youngs, Andrews and Rosner2005). (i) When long-wavelength modes grow directly from perturbations present at the initial time. This category is sometimes called ‘bubble competition’, and is believed to be sensitive to initial conditions (Dimonte et al. Reference Dimonte2004; Zhou Reference Zhou2017a). (ii) When long-wavelength modes are absent at the initial time and grow from the interaction of short-wavelength perturbations present initially. This self-similar category is often called ‘bubble merger’, and is believed to be insensitive to initial conditions (e.g. Ramaprabhu, Dimonte & Andrews Reference Ramaprabhu, Dimonte and Andrews2005). In both categories, growth of the RT mixing layer between the heavy and light fluids is quadratic-in-time,  ${\sim }t^{2}$ of the mixing layer, but differing in the growth proportionality constant,
 $\alpha$. Whether describing single-mode or multimode RT, the primary focus of past studies has been the RT growth rates at different times (e.g. Dimonte et al. Reference Dimonte2004), which is of foremost importance in applications such as fusion. Our focus here is rather different and aimed at understanding the energy pathways across scales.
1.2. Energy scale transfer in Boussinesq RT turbulence
Rayleigh–Taylor turbulent flows are unsteady, inhomogeneous and anisotropic, and it is unclear that the traditional cascade picture from Kolmogorov's theory holds (Alexakis & Biferale Reference Alexakis and Biferale2018; Zhou Reference Zhou2021). A motivation of this paper is to measure the cascade in RT flows directly, without having to rely on traditional tools from turbulence theory, such as Fourier analysis or structure functions, which rest on assumptions that do not hold in RT turbulence.
Several previous works (Zhou Reference Zhou2001; Chertkov Reference Chertkov2003; Ristorcelli & Clark Reference Ristorcelli and Clark2004; Boffetta et al. Reference Boffetta, Mazzino, Musacchio and Vozella2009; Livescu et al. Reference Livescu, Ristorcelli, Petersen and Gore2010; Zhou et al. Reference Zhou, Huang, Lu, Liu and Ni2016) have made valuable contributions to addressing this problem, the majority of which focused on low Atwood number incompressible RT flows described by the Boussinesq model. In this model, density variation is negligible except in the buoyancy term of the momentum equation, and the associated velocity field is solenoidal.
An important phenomenological theory on Boussinesq RT turbulence was proposed by Chertkov (Reference Chertkov2003), but had to assume a (quasistationary) constant KE flux to small scales and a balance between buoyancy and the time derivative of velocity. Subsequently, Boffetta et al. (Reference Boffetta, Mazzino, Musacchio and Vozella2009) carried out 3-D Boussinesq RT simulations and analysed the energy budget equations in Fourier space, where a Fourier transform was applied in the homogeneous (horizontal) directions. Simulations of 2-D Boussinesq RT flows were also analysed using both Fourier analysis (Boffetta et al. Reference Boffetta, De Lillo, Mazzino and Musacchio2012) and a filtering approach in physical space (Zhou et al. Reference Zhou, Huang, Lu, Liu and Ni2016) similar to what we do here for the more general (non-Boussinesq) problem. Boffetta et al. (Reference Boffetta, De Lillo, Mazzino and Musacchio2012) and Zhou et al. (Reference Zhou, Huang, Lu, Liu and Ni2016) both concluded that there is an inverse energy cascade and a forward enstrophy cascade in 2-D Boussinesq RT flows.
Moreover, Boffetta et al. (Reference Boffetta, De Lillo, Mazzino and Musacchio2012) studied the 3-D to 2-D transition in high aspect ratio RT simulations, with a domain size  $L_x = 32 L_y=L_z/2$, and inferred the presence of a transition scale. Using Fourier analysis in the homogeneous directions, Boffetta et al. (Reference Boffetta, De Lillo, Mazzino and Musacchio2012) concluded that the flow has 2-D-like evolution at (horizontal) scales larger than the transition scale and seems to follow a Bolgiano–Obukhov phenomenology, characterized by an inverse energy cascade, while smaller scales evolve as in the 3-D case following the Kolmogorov–Obukhov phenomenology, characterized by a forward energy cascade.
These studies have established a self-consistent picture of phenomenological Boussinesq RT turbulence. Note that the Boussinesq description of RT fails in the presence of large density ratios, which restricts its application to a relatively limited class of flows. Generalizing this framework to the full RT problem is non-trivial (Livescu & Ristorcelli Reference Livescu and Ristorcelli2007) and our paper may be viewed as a contribution towards that goal.
1.3. Variable density flows: which ‘length scale’?
Many flows which can exhibit RT instability, ranging from astrophysics to ICF to multiphase flow applications, are characterized by large density ratios,  $O(10)$–
 $O(10^{20})$ (Zhao & Aluie Reference Zhao and Aluie2018) for which the Boussinesq description is invalid. In these applications, RT flows have to be investigated in a VD flow setting, where the KE is a non-quadratic quantity due to the explicit density dependence, unlike in Boussinesq flows where KE is quadratic.
A ‘length scale’ is not an independent entity but is associated with the specific flow variable being analysed (Zhao & Aluie Reference Zhao and Aluie2018). This is often lost in our discussion of the ‘inertial range’ or the ‘viscous range’ of length scales in turbulence as if they exist independently of a flow variable, which in constant density (and Boussinesq) turbulence is the velocity field (Kolmogorov Reference Kolmogorov1941). Therefore, in constant-density turbulence, when discussing inertial scales or a  $k^{-5/3}$ scaling of the energy spectrum,
 $k$ is associated with the velocity field. What is the corresponding variable whose scales are appropriate to analyse in VD turbulence?
In constant density (and Boussinesq) turbulence, the velocity spectrum and the energy spectrum are the same. This is no longer the case in VD turbulence (Sadek & Aluie Reference Sadek and Aluie2018). Moreover, in VD flows there are many possible ways to construct a ‘spectrum’ in  $k$-space having units of energy per wavenumber. These different ‘spectra’ correspond to the Fourier transform (or scale decomposition) of different variables and are not equivalent. Which of these is meaningful, if any, remains unclear.
Zhou (Reference Zhou2001) proposed an RT turbulence (and also of the related Richtmyer–Meshkov instability) phenomenology and predicted a power-law scaling for the energy spectrum, although it was not specified which variable's length scales are to be analysed. Cook & Zhou (Reference Cook and Zhou2002) introduced a new variable,  $\boldsymbol {w} \equiv \rho ^{1/2} \boldsymbol {u}$, in RT flows, borrowed from Kida & Orszag (Reference Kida and Orszag1990), where
 $\rho$ is density and
 $\boldsymbol {u}$ is the fluid velocity, effectively treating KE as a quadratic term. Cook & Zhou (Reference Cook and Zhou2002) Fourier analysed
 $\boldsymbol {w}$ in the homogeneous directions from 3-D RT simulations and found that the net energy transfer is from large to small (horizontal) scales, but with significant backscatter in
 $k$-space. A follow-up work by Cabot, Schilling & Zhou (Reference Cabot, Schilling and Zhou2004) also analysed energy transfer in Fourier space across scales associated with
 $\boldsymbol {w}=\rho ^{1/2} \boldsymbol {u}$ in the homogeneous (horizontal) directions.
Several previous works in VD flow (Dimonte et al. Reference Dimonte2004; Cabot & Cook Reference Cabot and Cook2006; Lawrie & Dalziel Reference Lawrie and Dalziel2011) studied the budgets of KE, potential energy (PE) and internal energy (IE), but these were only for the bulk flow and not as functions of scale as we do in this paper. Other studies of RT turbulence within the full VD (non-Boussinesq) flow setting (Livescu & Ristorcelli Reference Livescu and Ristorcelli2007; Schilling & Mueschke Reference Schilling and Mueschke2010) performed Reynolds averaging on direct numerical simulation (DNS) data, and analysed the time evolution of the ensemble mean KE across the mixing width, but did not analyse energy transfer across length scales.
The above works on energy transfer in RT were either restricted to analysing scales in the homogeneous directions via Fourier analysis, or relied on statistical (Reynolds or Favre) averaging procedures. The former lacks information on the energy transfer in the vertical (inhomogeneous) direction, which is essential in the RT dynamics. The latter lacks information about the dynamics (including the cascades) as a function of scale.
A series of past studies (Aluie Reference Aluie2011; Aluie, Li & Li Reference Aluie, Li and Li2012; Aluie Reference Aluie2013; Eyink & Drivas Reference Eyink and Drivas2018; Zhao & Aluie Reference Zhao and Aluie2018) developed the coarse-graining approach (Eyink Reference Eyink2005; Eyink & Aluie Reference Eyink and Aluie2009) for variable-density flows to probe the energy scale pathways in inhomogeneous and anisotropic systems. The coarse-graining formalism is the same as that used in large-eddy simulation (LES) modelling of turbulent flows. However, while the coarse-grained equations analysed in these studies coincide (to a considerable extent) with those employed in LES, their use was for rather different purposes. In LES, plausible but uncontrolled closures are adopted for the subscale terms, whereas the primary aim of coarse graining as used in the aforementioned studies is to develop several exact estimates and a general physical understanding of the subscale terms. Another difference is that LES generally takes the length scale parameter  $\ell$ to be a fixed length of the order of the ‘integral scale’
 $L$. The primary interest in coarse graining is rather to probe all scales in the flow, including limits of small
 $\ell \ll L$. While our paper was undergoing journal revisions, an important work toward this effort by Saenz, Aslangil & Livescu (Reference Saenz, Aslangil and Livescu2021) was published, which aims to connect coarse graining with Reynolds averaging in 3-D homogeneous VD flows, and showed that such flows undergo a downscale cascade.
Despite the important work done previously, we are still lacking a thorough understanding of the RT instability dynamics at different scales, including the cascades, anisotropy and inhomogeneity. Addressing these gaps is a main thrust of our paper. In addition, notions of the cascade and the inertial range that we will address below lay a theoretical foundation for the practical development of LES for RT flows.
1.4. Outline of this paper
The paper is organized as follows. In § 2, we describe high-resolution turbulent RT simulations in two dimensions and three dimensions, and discuss basic flow properties. In § 3, we analyse the energy pathways across scales, including the KE cascades, and coupling to PE and IE. In § 4, we examine the anisotropy of RT cascades in physical space. We summarize our findings and conclude the paper in § 5. We include two appendices which show that our results are insensitive to the compressibility levels, either due to the initial set-up (Appendix A) or due to the governing equations by repeating our analysis to data from the two-species incompressible RT model (Appendix B). A separate document found on the journal's website contains supplementary material available at https://doi.org/10.1017/jfm.2021.902 on the (i) efficiency of energy fluxes (supplementary material, section A), (ii) anisotropy of energy fluxes obtained with anisotropic kernels (supplementary material, section B), (iii) filtering spectra for different scale-decompositions of KE (supplementary material, section C), (iv) insensitivity of our results to initial conditions (supplementary material, section D) and (v) discussion of another formulation of the energy budget commonly used in the LES literature (supplementary material, section E).
2. Preliminaries and simulations
2.1. Governing equations
In this paper we primarily focus on what we call the single-species two-density RT model, which is governed by the fully compressible Navier–Stokes equations. In Appendix B, we repeat our main analysis on the more widely used two-species incompressible Navier–Stokes model (Cook & Dimotakis Reference Cook and Dimotakis2001; Livescu & Ristorcelli Reference Livescu and Ristorcelli2007) for comparison.
The dynamics is governed by the continuity equation (2.1), the momentum equation (2.2) and the total energy equation (2.3); the IE (2.4) and KE (2.5) equations are also shown for convenience as follows:
 \begin{gather} \partial_t\rho+\partial_j(\rho u_j)=0, \end{gather}
 \begin{gather}\partial_t(\rho u_i)+\partial_j(\rho u_i u_j)={-}\partial_i P+\partial_j\sigma_{ij}+\rho F_i, \end{gather}
 \begin{gather} \partial_t (\rho E) + \partial_j (\rho E u_j)={-}\partial_j (Pu_j)+\partial_j \left[2\mu u_i \left(S_{ij}-\frac{1}{d} S_{kk}\delta_{ij}\right)\right]\nonumber\\ -\partial_j q_j +\rho u_i F_i, \end{gather}
 \begin{gather} \partial_t (\rho e)+\partial_j(\rho e u_j)={-}P\partial_j u_j+2\mu\left(|S_{ij}|^{2}-\frac{1}{d}|S_{kk}|^{2}\right)-\partial_j q_j, \end{gather}
 \begin{gather} \partial_t\left(\rho \frac{|\boldsymbol{u}|^{2}}{2}\right)+\partial_j \left\{\left(\rho \frac{|\boldsymbol{u}|^{2}}{2}+P\right)u_j-2\mu\left(u_i S_{ij}-\frac{1}{d}u_j S_{kk}\right)\right\} \nonumber\\ =P\partial_j u_j-2\mu\left(|S_{ij}|^{2}-\frac{1}{d}|S_{kk}|^{2}\right)+\rho u_i F_i. \end{gather}
Here,  $\rho$ is the density field,
 $\boldsymbol {u}$ is the velocity field,
 $P$ is pressure,
 $e$ is the specific IE (or IE per unit mass),
 $E=e+|\boldsymbol {u}|^{2}/2$ is total energy per unit mass. Here
 $S_{ij}=(\partial _i u_j+\partial _j u_i)/2$ is the strain rate tensor, while
 $\sigma _{ij}=2\mu (S_{ij}-d^{-1}S_{kk}\delta _{ij})$ is the deviatoric viscous stress tensor in
 $d$ space dimensions, where
 $\mu$ is dynamic viscosity. Here
 $\boldsymbol {F}$ is the external acceleration,
 $\boldsymbol {q}$ is the heat flux satisfying Fourier's law
 $\boldsymbol {q}=-\kappa \boldsymbol {\nabla } T$, where
 $\kappa$ is thermal conductivity and
 $T$ is temperature. The ideal gas law
 $P=\rho R T$ is adopted to close the set of equations, with
 $R$ the specific gas constant.
The governing equations are solved in 2-D and 3-D rectangular domains in Cartesian coordinates. The boundary conditions are periodic in the horizontal directions and no-slip rigid walls in the vertical  $z$-direction. Following Bian et al. (Reference Bian, Aluie, Zhao, Zhang and Livescu2020), the density is initialized such that
 $\rho _0(z)$ is uniform in the
 $z$-direction on either side of the interface. Hydrostatic equilibrium requires that away from the interface, the initial (background) pressure varies as
 $P_0\sim \rho _0 g z$. For our single fluid case here, using the ideal gas equation of state yields that the background temperature gradient is constant and equal on both sides of the interface. Thus, the initial conditions represent a particular case of the analysis of Gerashchenko & Livescu (Reference Gerashchenko and Livescu2016), with
 $\textrm {d} T_0/\textrm {d}z= -g/R$. Away from the interface, when the thermal conductivity coefficient is constant as in our case here, a constant temperature gradient implies that the heat conduction term vanishes in the energy equation, so that the initial conditions are also in thermal equilibrium.
In this work, we choose viscosity  $\mu$ to be spatially constant. In most practical applications,
 $\mu$ varies with temperature, sometimes strongly such as in ICF. Previous work by Aluie (Reference Aluie2013) and Zhao & Aluie (Reference Zhao and Aluie2018) has shown that the effects of a variable viscosity are still guaranteed to be localized to the smallest scales if the Reynolds number remains sufficiently high, thereby allowing for an inertial range of scales to exist, which is the main focus of this paper. We also choose the Prandtl number
 $Pr=c_p \mu /\kappa =1$, where again
 $\kappa$ is spatially constant, which is often not the case, especially in ICF (e.g. Zhang et al. Reference Zhang, Betti, Gopalaswamy, Yan and Aluie2018a). Our choices are similar to those adopted in previous studies of the fundamental hydrodynamics of RT (e.g. Cabot & Cook Reference Cabot and Cook2006; Reckinger, Livescu & Vasilyev Reference Reckinger, Livescu and Vasilyev2016; Wieland et al. Reference Wieland, Hamlington, Reckinger and Livescu2019). They are meant to simplify the problem to focus on the fundamental study of the cascades in RT flows, although we acknowledge ongoing research on the potentially important roles of temperature dependent viscosity and heat diffusion in some applications (e.g. Weber et al. Reference Weber, Clark, Cook, Busby and Robey2014).
2.2. Numerical method
The pseudospectral method (Patterson & Orszag Reference Patterson and Orszag1971) is adopted in the periodic directions, in which spatial derivatives and time integration are performed in Fourier space, while nonlinear terms are calculated in physical space. The fast Fourier transform provides an efficient way to convert the fields between physical and Fourier spaces. Aliasing errors in nonlinear terms are removed by the 2/3 dealiasing rule (Patterson & Orszag Reference Patterson and Orszag1971). For the vertical direction with wall boundaries, we use a compact finite difference scheme that is sixth order inside the domain and fifth order at the boundaries (Lele Reference Lele1992; Brady & Livescu Reference Brady and Livescu2019). In addition, the compact filtering scheme is performed in the inhomogeneous direction to filter out unphysical high-wavenumber oscillations (Lele Reference Lele1992; Brady & Livescu Reference Brady and Livescu2019). A fourth-order explicit Runge–Kutta method is used to integrate in time.
At the interface, as density changes between the heavy and light regions, the temperature gradient can no longer be constant. The energy equation then has non-zero time derivative at the initial time,  $\partial _t (\rho e) = \partial _j (\kappa \partial _j T_0)$, which results in the generation of acoustic waves at initial time that can reflect off the top and bottom walls. We have carried out controlled tests by including a sponge layer at the top and bottom boundaries to damp these transient waves (Bian et al. Reference Bian, Aluie, Zhao, Zhang and Livescu2020), and could not detect any effect on the RT evolution. Even without the sponge layer, these initial acoustic waves are quickly damped at very early times, long before the flow becomes turbulent.
2.3. Analysis method
In fluid dynamics, coarse graining provides a natural and versatile framework to understand scale interactions (Leonard Reference Leonard1975; Meneveau & Katz Reference Meneveau and Katz2000; Eyink Reference Eyink2005). For any field  $\boldsymbol {a}(\boldsymbol {x})$, a coarse-grained or (low-pass) filtered field, which contains modes at scales
 $\gtrsim \ell$, is defined in
 $n$-dimensions as
 \begin{equation} \bar{\boldsymbol{a}}_\ell(\boldsymbol{x}) = \int\,\textrm{d}^{n}\boldsymbol{r}\ G_\ell(\boldsymbol{r})\, \boldsymbol{a}(\boldsymbol{x}+\boldsymbol{r}), \end{equation}
where  $G(\boldsymbol {r})$ is a normalized convolution kernel and
 $G_\ell (\boldsymbol {r})= \ell ^{-n} G(\boldsymbol {r}/\ell )$ is a dilated kernel with width comparable to
 $\ell$. The scale decomposition in (2.6) decomposes the field
 $\boldsymbol {a}(\boldsymbol {x})$ into a large-scale (
 ${\gtrsim }\ell$) component
 $\bar {\boldsymbol {a}}_\ell$, and a small-scale (
 ${\lesssim }\ell$) component, captured by the residual
 $\boldsymbol {a}'_\ell =\boldsymbol {a}-\bar {\boldsymbol {a}}_\ell$. The coarse-graining framework is a general method to analyse unsteady, anisotropic and inhomogeneous flows, such as the RT instabilities studied here, which conventional turbulence analysis techniques are unable to handle. More extensive discussions of the framework and its utility can be found in many references (Piomelli et al. Reference Piomelli, Cabot, Moin and Lee1991; Germano Reference Germano1992; Meneveau Reference Meneveau1994; Eyink Reference Eyink1995; Aluie & Eyink Reference Aluie and Eyink2009; Rivera, Aluie & Ecke Reference Rivera, Aluie and Ecke2014; Fang & Ouellette Reference Fang and Ouellette2016). In what follows, the subscript
 $\ell$ may be dropped from filtered variables when there is no risk of ambiguity.
Here, we use a Gaussian filter kernel at scale  $\ell$ (Piomelli et al. Reference Piomelli, Cabot, Moin and Lee1991),
 \begin{equation} G_\ell({|\boldsymbol{x}|})=\left(\frac{6}{{\rm \pi} \ell^{2}}\right)^{n/2}\exp\left({-\frac{6}{\ell^{2}}|\boldsymbol{x}|^{2}}\right), \end{equation}
in dimensions  $n=1,2,3$. Its Fourier transform is
 \begin{equation} \hat{G}_\ell({|\boldsymbol{k}|})=\exp\left({-\frac{\ell^{2}}{24}|\boldsymbol{k}|^{2}}\right). \end{equation}
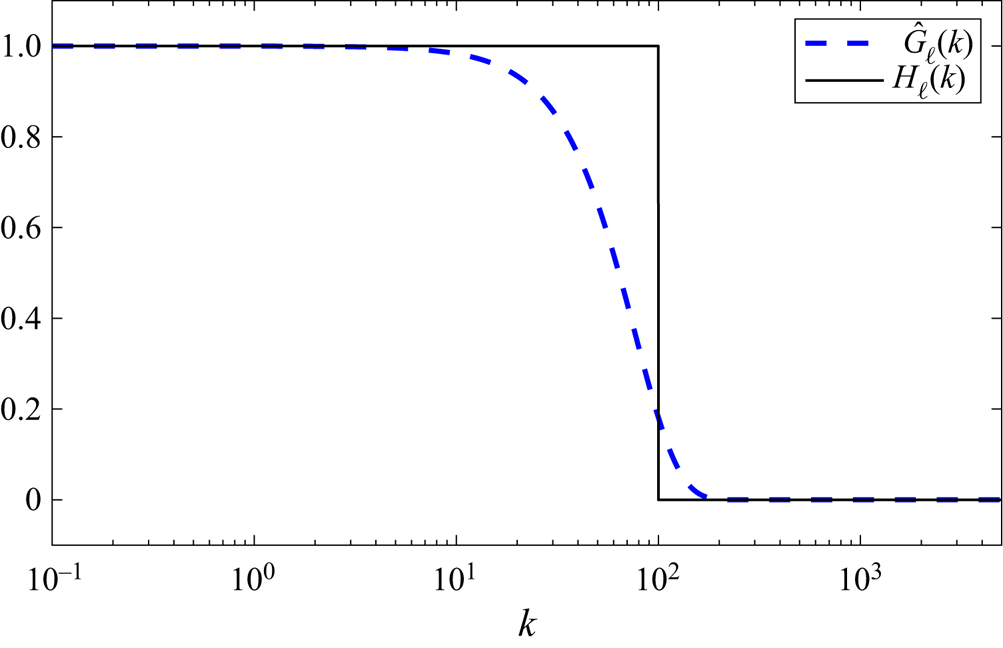
Figure 1 plots the Gaussian kernel in  $k$-space and compares it with sharp-spectral truncation. Note that a Fourier analysis is not possible in the non-homogeneous (vertical) direction. A detailed discussion on the different kernels can be found in Rivera et al. (Reference Rivera, Aluie and Ecke2014) (see figures 12 and 13 in that paper and associated discussion). The Gaussian kernel form in (2.7) has been used in several prior studies (Piomelli et al. Reference Piomelli, Cabot, Moin and Lee1991; Wang et al. Reference Wang, Wan, Chen and Chen2018) due to its numerical discretization advantages (see John Reference John2012, p. 30).
The Gaussian kernel  $\hat {G}_\ell ({|\boldsymbol {k}|})$ in (2.8) compared with a sharp-spectral cutoff,
 ${H}_\ell ({|\boldsymbol {k}|})$, in Fourier space, with cutoff wavenumber
 $k_\ell =100$ and
 $\ell = L_z/k_\ell =6.4/100$. The horizontal axis has a logarithmic scale.

In simulations with non-periodic boundary conditions, such as our RT flow with rigid walls at the top and bottom, filtering near the boundary requires a choice for the fields beyond the boundary. In this paper, the choice is to extend the domain beyond the physical boundaries with values compatible with the boundary conditions (Aluie, Hecht & Vallis Reference Aluie, Hecht and Vallis2018). Filtering near the wall is then performed on this extended data. For our RT problem specifically, the velocity is kept at zero beyond the walls, the density field is kept constant (zero normal gradient), and the extended pressure field satisfies the hydrostatic condition  $\textrm {d}P/\textrm {d}z=-\rho g$. The coarse-graining operation can then be performed at every point in the flow domain without requiring complicated inhomogeneous filters, which do not commute with spatial derivatives.
Analysing the energy cascade and inertial range dynamics in constant-density turbulence centres on studying the large-scale KE,  $|\bar {\boldsymbol {u}}_\ell |^{2}/2$. Since KE in VD flows,
 $\rho |\boldsymbol {u}|^{2}/2$, is non-quadratic, its large-scale definition is not as straightforward. Several different definitions have been proposed in the literature, including
 $\bar {\rho }_\ell |\bar {\boldsymbol {u}}_\ell |^{2}/2$ (Chassaing Reference Chassaing1985; Bodony & Lele Reference Bodony and Lele2005; Burton Reference Burton2011; Karimi & Girimaji Reference Karimi and Girimaji2017) and
 $|\overline {(\sqrt {\rho }\boldsymbol {u})}_\ell |^{2}/2$ (Kida & Orszag Reference Kida and Orszag1990; Cook & Zhou Reference Cook and Zhou2002; Wang et al. Reference Wang, Wan, Chen and Chen2018). However, as was shown in Zhao & Aluie (Reference Zhao and Aluie2018), the above two definitions can fail to satisfy the ‘inviscid criterion’ in flows with large density variations, leading to viscous contamination at all scales, and preventing the unravelling of inertial range dynamics. The ‘inviscid criterion’ requires that viscous contributions be negligible at large scales. Aluie (Reference Aluie2013) proved mathematically, and Zhao & Aluie (Reference Zhao and Aluie2018) showed numerically, that the Favre decomposition,
 $(\bar {\rho }_\ell |\tilde {\boldsymbol {u}}_\ell |^{2})/2$, where
 \begin{equation} \tilde{\boldsymbol{u}}=\overline{\rho\boldsymbol{u}}_\ell/\bar{\rho}_\ell \end{equation}
is the Favre filtered velocity (Favre, Gaviglio & Dumas Reference Favre, Gaviglio and Dumas1958; Aluie Reference Aluie2013; Eyink & Drivas Reference Eyink and Drivas2018), satisfies the inviscid criterion even in the presence of arbitrarily large density variations. In the current paper, we shall adopt the Favre decomposition when analysing scale dynamics.
2.4. Simulation results
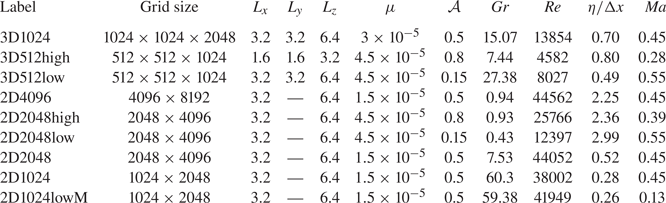
Two-dimensional and 3-D RT simulations are performed to analyse the energy budget and cascade in RT turbulence. These simulations, summarized in table 1, are performed at low and high Atwood numbers, with grid resolution up to  $4096\times 8192$ in two dimensions and
 $1024\times 1024\times 2048$ in three dimensions. The Atwood number
 $\mathcal {A}$ is defined by
 $\mathcal {A}=(\rho _h-\rho _l)/(\rho _h+\rho _l)$, where
 $\rho _h, \rho _l$ are the densities of the initial uniform heavy and light fluids. The results shown below are primarily based on the largest simulations 2D4096 and 3D1024, while other simulations shown in the table are for numerical convergence and verification purposes.
Parameters of the 2-D RT and 3-D RT simulations conducted in this paper. All simulations have a spatially uniform dynamic viscosity  $\mu$ and Prandtl number
 $Pr=c_p \mu /\kappa =1$, with thermal conductivity
 $\kappa$ and specific heat capacity
 $c_p$ at constant pressure. Here
 $L_x,L_y,L_z$ are the domain lengths in three directions, and
 $\mathcal {A}$ is the Atwood number. Gravitational acceleration
 $g=1$ is in the
 $-z$ direction. The mesh Grashof number is
 $Gr=2\mathcal {A}g\langle \rho \rangle ^{2} \Delta x^{3}/\mu ^{2}$, the Kolmogorov scale is
 $\eta =\mu ^{3/4}/(\epsilon ^{1/4}\langle \rho \rangle ^{3/4})$ and the Reynolds number is
 $Re=\langle |\boldsymbol {u}|^{2}\rangle ^{1/2} L_x\langle \rho \rangle /\mu$, where
 $\langle \cdot \rangle$ denotes the spatial mean value. Here
 $Ma=\sqrt {g L_x}/\sqrt {\gamma R T_0}$ denotes the interface Mach number (Reckinger et al. Reference Reckinger, Livescu and Vasilyev2016), where
 $R$ is the specific gas constant,
 $\gamma$ is the ratio of specific heats and
 $T_0$ is the initial temperature at the interface. In the table, the Reynolds number and the Kolmogorov scale are calculated at dimensionless time
 $\hat {t}=t/\sqrt {{L_x}/{\mathcal {A}g}}=4.0$.

The initial conditions for simulations shown in table 1 are as follows. The initial density field is composed of uniform heavy fluid on top with  $\rho _h=1$, and uniform light fluid with density
 $\rho _l$ at the bottom. The initial pressure field satisfies hydrostatic balance
 $\textrm {d}P / \textrm {d}z = -\rho g$, with pressure at the bottom set to be 10 for all simulations in table 1, except 2D1024lowM, where the pressure is set to 100 at the bottom to yield lower compressibility levels. In Appendix A, we show that our results do not depend on the compressibility level of RT flows. The velocity fields are initially zero with perturbations added to the interface of vertical velocity. The interfacial velocity perturbations are imposed in wavenumber space, and are non-zero only within a band of high wavenumbers. In three dimensions, the velocity amplitude is perturbed in a shell
 $k\in [32, 128]$, and the magnitude is set to be proportional to
 $\exp ({-({1}/{c})|k_x^{2}+k_y^{2}-80^{2}|})$, where
 $c = 22.63$ is a normalization constant to further limit the range of effectively perturbed wavenumbers. While in two dimensions, the velocity amplitude is perturbed in an annulus
 $k\in [72, 128]$, with magnitude proportional to
 $\exp ({-({1}/{c})|k_x^{2}-100^{2}|})$, where
 $c$ is the same constant as in three dimensions. Since the perturbation wavenumber band is slightly different between 2D4096 and 3D1024, for verification purposes, we also perform additional 2-D simulations 2D1024 and 2D2048 (see table 1) with initial perturbations identical to those in 3D1024. Analysis results based on these 2-D simulations are similar to the 2D4096 case, and are shown in the supplementary material, section D.
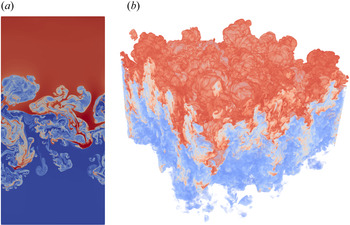
Visualizations of density snapshots are shown in figure 2(a) for the 2D4096 case and figure 2(b) for the 3D1024 case, both at dimensionless time  $\hat {t} = t/\sqrt {{L_x}/{\mathcal {A}g}}= 4.0$, where
 $\sqrt {{L_x}/{\mathcal {A}g}}$ is the characteristic time scale and
 $g$ is the gravitational acceleration. Both figures show complex flow patterns and structures with a wide spectrum of sizes. It is also easy to see that the 3-D field develops much finer scale structures than the 2-D field, a property which we will quantify using spectra below. We now present some basic properties of our simulations.
Density visualizations from the simulations 2D4096 and 3D1024 in table 1. The dimensionless time for both is  $\hat {t} = t/\sqrt {{L_x}/{\mathcal {A}g}}= 4.0$. The mixing width, which is defined and analysed in § 2.5, is
 $h\approx 1.69$ for 2-D RT, and
 $h\approx 1.1$ for 3-D RT. The density fields are turbulent with the presence of a wide range of scales. (a) This is the 2D4096 snapshot and (b) is the 3D1024 snapshot.

2.5. Mixing width
The mixing width  $h(t)$ is an important quantity characterizing the total width of the mixing layer between bubble and spike fronts in RT flows. It is used to quantify the penetration depth of RT bubbles and spikes into the unperturbed flow. When there are sufficient multimode interactions, turbulent RT flows become self-similar at later times (Birkhoff Reference Birkhoff1955; Dimonte et al. Reference Dimonte2004; Ristorcelli & Clark Reference Ristorcelli and Clark2004). During the self-similar stage, the mixing width is well-described by
 $h(t)=\alpha \mathcal {A} g t^{2}$, a quadratic growth in time which is proportional to a constant coefficient
 $\alpha$.
The value for  $\alpha$ has been the subject of vigorous research and discussion within the community. It is believed to depend on whether initial conditions render the RT flow in the bubble competition regime or in the bubble merger regime (e.g. Ramaprabhu et al. Reference Ramaprabhu, Dimonte and Andrews2005). Numerical simulations of 3-D RT in the bubble merger regime generally report values
 $\alpha \approx 0.02$ to
 $0.03$ (see table 6.1 in Zhou (Reference Zhou2017a) for a summary), although values larger than
 $0.05$ have been reported in 3-D simulations using front tracking (e.g. Glimm et al. Reference Glimm, Sharp, Kaman and Lim2013). Experiments, on the other hand, generally report much larger values
 $\alpha \approx 0.05$ to
 $0.06$ (Zhou Reference Zhou2017a), which is thought to be a result of unintended large-scale perturbations (Dimonte et al. Reference Dimonte2004).
While we report  $\alpha$ values from our simulations here, its precise value is far from being the focus of our paper. Our interest in
 $\alpha$ here is rather more limited to comparing its values from 2-D simulations relative to 3-D simulations within the same modelling framework. For reasons that remain unclear and subject to various speculations, the parameter
 $\alpha$ in 2-D simulations has often been found larger than in 3-D simulations (e.g. Youngs Reference Youngs1991, Reference Youngs1994; Dimonte et al. Reference Dimonte2004; Cabot Reference Cabot2006). Such enhanced RT growth in 2-D simulations has been somewhat of a puzzle given that both analytical models and simulations of single-mode RT predict that it is growth in three dimensions that should be faster (Layzer Reference Layzer1955; Goncharov Reference Goncharov2002; Bian et al. Reference Bian, Aluie, Zhao, Zhang and Livescu2020). A goal of this paper is to shed light on the puzzle.
We calculate the mixing width using the formula (Cabot & Cook Reference Cabot and Cook2006; Zhang et al. Reference Zhang, Betti, Yan, Zhao, Shvarts and Aluie2018b),
 \begin{equation} h(t)=\frac{2}{\rho_h-\rho_l}\int_{-\infty}^{\infty} \min\left(\langle \rho\rangle_{xy}(z)-\rho_l, \rho_h-\langle \rho\rangle_{xy}(z)\right)\,\textrm{d}z, \end{equation}
where  $\langle \rho \rangle _{xy}(z)$ denotes a horizontal average of the density field, which is a function of
 $z$ and
 $t$, and
 $\rho _h, \rho _l$ denote the original heavy and light fluid densities. After obtaining
 $h(t)$,
 $\alpha$ can be calculated using one of two methods. The first is by directly calculating
 $h(t)/\mathcal {A}gt^{2}$, while the second is by carrying a best linear fit between
 $\sqrt {h(t)}$ and
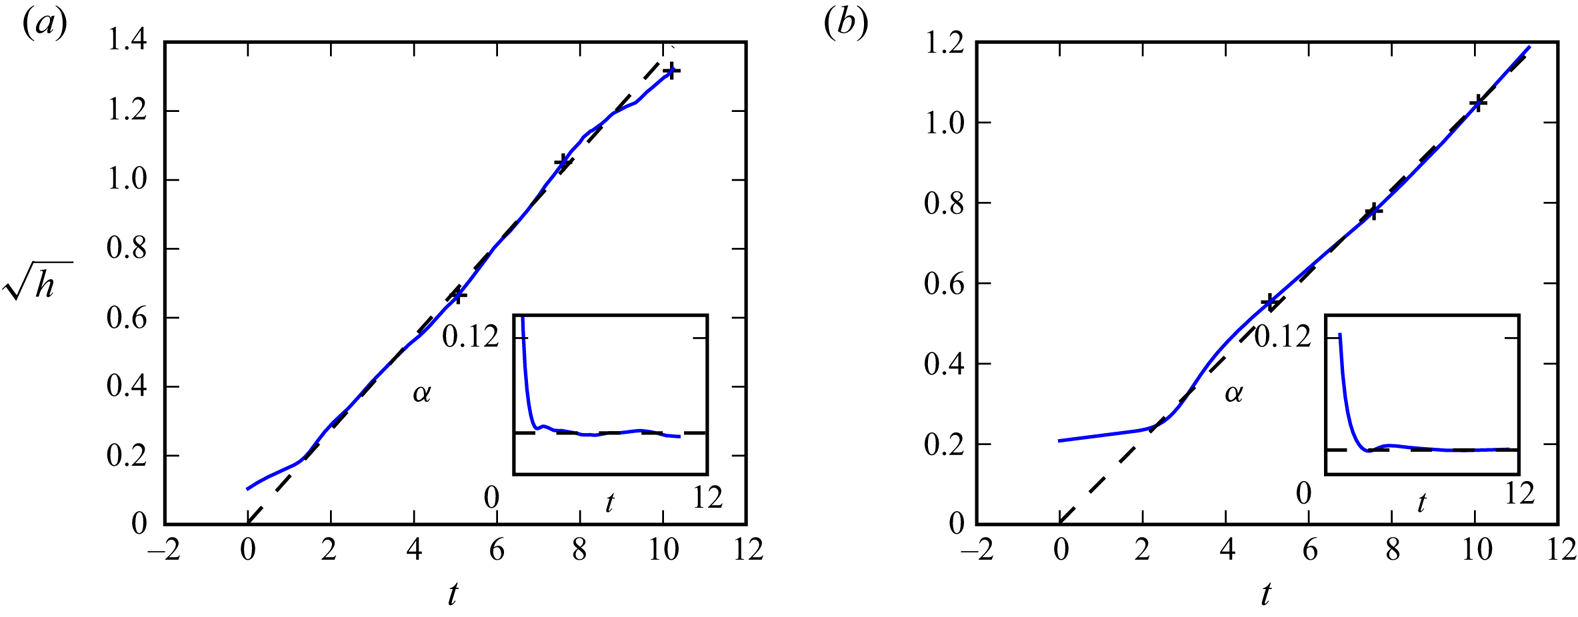
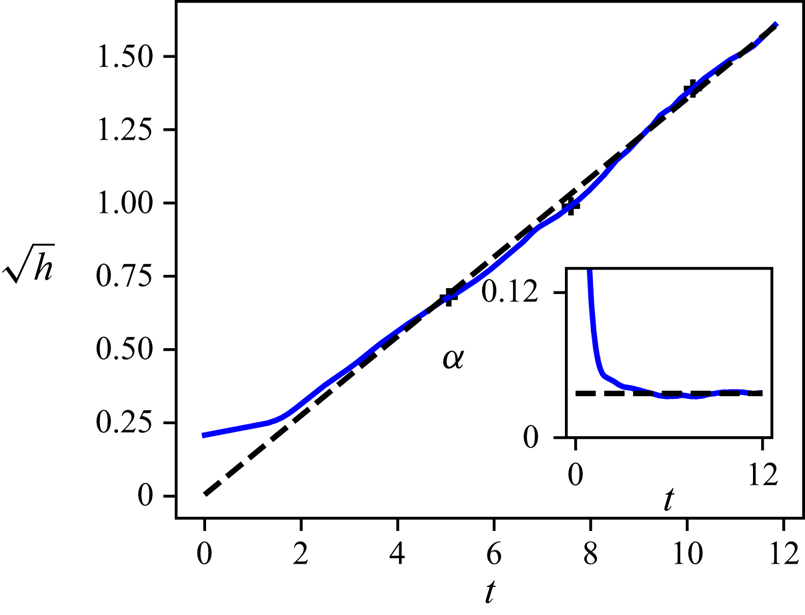
 $\sqrt {\mathcal {A}g}t$ in the self-similar regime (Olson & Jacobs Reference Olson and Jacobs2009). Figure 3 plots
 $\sqrt {h(t)}$ versus time from the 2D4096 and 3D1024 data, and a linear fit in the self-similar regime is marked with a dashed line. The inset of the figures corresponds to the first approach:
 $\alpha =h/\mathcal {A}gt^{2}$ is plotted against time, while the
 $\alpha$ value obtained by the linear fit is marked with a horizontal dashed line. We obtain the same results from these two methods. Figure 3 shows that there is a substantial time range of self-similarity in both two dimensions and three dimensions, in which there is an excellent linear fit between
 $\sqrt {h(t)}$ and
 $t$. The values of
 $\alpha$ we obtain (0.036 in two dimensions and 0.021 in three dimensions) fall within the range reported from simulations in the literature (Dimonte et al. Reference Dimonte2004; Cabot & Cook Reference Cabot and Cook2006). Note that
 $\alpha$ from the 2-D RT is almost twice as large as that from 3-D RT.
Evolution of the square root of mixing width  $\sqrt {h(t)}$ versus time in two dimensions and three dimensions, for which self-similarity analysis predicts a linear relation at late time (Olson & Jacobs Reference Olson and Jacobs2009). The slope of the straight line is 0.135 in (a) and 0.104 in (b), which corresponds to
 $\alpha =0.036$ and
 $\alpha =0.021$, respectively. The ‘+’ markers in both panels correspond to dimensionless time
 $\hat {t}=t/\sqrt {{L_x}/{\mathcal {A}g}}= 2, 3, 4$. The inset gives the compensated plot
 $\alpha =h(t)/(\mathcal {A}gt^{2})$ versus time, in which the horizontal lines correspond to the
 $\alpha$ values obtained by the linear fit. (a) The 2-D mixing width and (b) the 3-D mixing width.

2.6. Overall energy balance
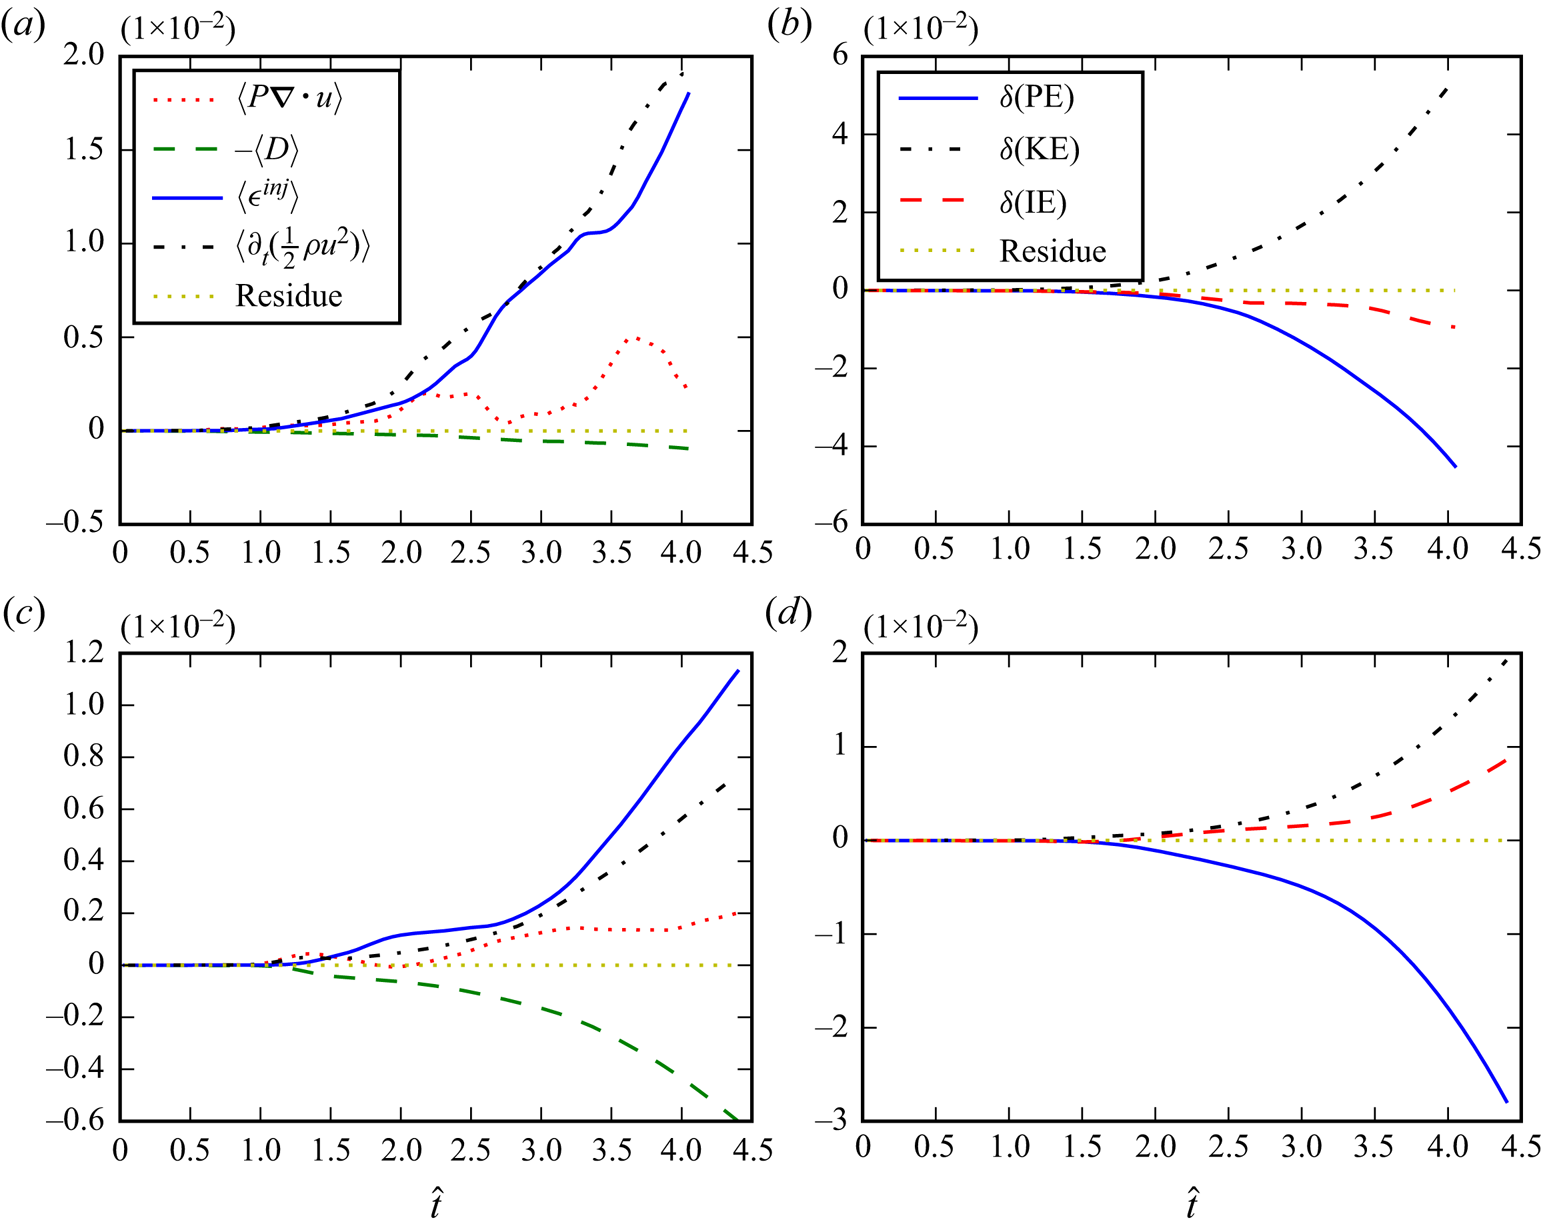
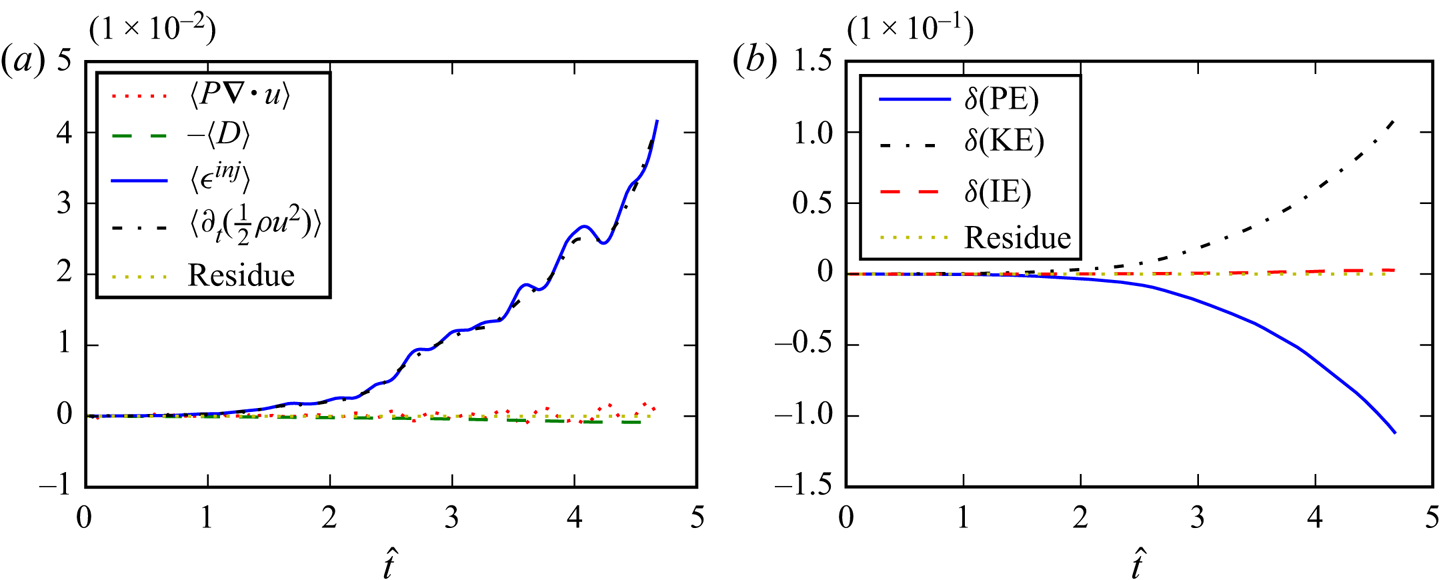
We shall now discuss the bulk balance between PE, KE and IE in our simulated flows. Temporal evolution of the spatial mean of each of the budget terms in the KE equation (2.5) is shown in figures 4(a) and 4(c) for two dimensions and three dimensions, where  $D=S_{ij} (2\mu S_{ij}-({2}/{d}) \mu S_{kk} \delta _{ij})$ is the dissipation term, and
 $\epsilon ^{{inj}}=-\rho g u_z$ is the energy injection. Correspondingly, figures 4(b) and 4(d) show the temporal evolution of bulk (over volume
 $V$ of the domain) PE
 $\delta \text {PE}$, bulk IE
 $\delta \text {IE}$ and bulk KE
 $\delta \text {KE}$, in two dimensions and three dimensions. The bulk energy is measured relative to its initial value:
 \begin{gather} \delta \text{PE}(t)=\int [\rho(\boldsymbol{x},t)-\rho(\boldsymbol{x},0)]gz\,\textrm{d}V={-}\int_0^{t}\,\textrm{d}t \int\,\textrm{d}V \epsilon^{{inj}}, \end{gather}
 \begin{gather}\delta \text{IE}(t) = \int [\rho e(\boldsymbol{x},t)-\rho e(\boldsymbol{x},0)]\,\textrm{d}V=\int_0^{t}\,\textrm{d}t \int\,\textrm{d}V (D-P\boldsymbol{\nabla} \boldsymbol{\cdot} \boldsymbol{u}), \end{gather}
 \begin{gather}\delta \text{KE}(t) =\int \left[\tfrac{1}{2}\rho \boldsymbol{u}^{2}(\boldsymbol{x},t)-\tfrac{1}{2}\rho \boldsymbol{u}^{2}(\boldsymbol{x},0)\right]\,\textrm{d}V=\int_0^{t}\,\textrm{d}t\int\,\textrm{d}V \partial_t \left(\tfrac{1}{2}\rho |\boldsymbol{u}|^{2}\right). \end{gather}
The second equality in (2.11) is due to the relation  $\int _V \rho g u_z\,\textrm {d}V = ({\textrm {d}}/{\textrm {d}t})\int _V \rho g z\,\textrm {d}V$ (Cabot & Cook Reference Cabot and Cook2006), while (2.12) can be obtained by time integrating the IE equation (2.4).
Temporal evolution of terms in the KE budget, and overall energy balance in two dimensions (a,b) and three dimensions (c,d). Here  $D=-\sigma _{ij} S_{ij}$ is the KE dissipation rate,
 $\epsilon ^{{inj}}=\rho u_i g_i$ is the energy injection rate. Time
 $\hat {t}= t/\sqrt {{L_x}/{\mathcal {A}g}}$ in the panels is dimensionless.

Plot of 2-D instantaneous energy budget terms in figure 4(a) shows the time derivative of KE and the energy injection rate keep increasing in time, while the average value of  $P\boldsymbol {\nabla }\boldsymbol {\cdot } \boldsymbol {u}$ is positive so that IE is converted to KE via this term. The overall viscous dissipation term
 $-\langle D\rangle$ is negative and converts KE to IE, but the amount of conversion is smaller in magnitude relative to
 $\langle P \boldsymbol {\nabla }\boldsymbol {\cdot } \boldsymbol {u}\rangle$ in two dimensions. Thus, in figure 4(b) both the overall IE and PE decrease and are converted to KE. The overall bulk energy balance satisfies
 $\delta \text {PE}+\delta \text {KE} + \delta \text {IE} = 0$, as is marked by the ‘residue’ term in the figure.
The corresponding 3-D results are shown in figures 4(c) and 4(d). The injection rate and time derivative of KE keeps increasing, while the dissipation and pressure dilatation terms convert between KE and IE. One difference from two dimensions is that in three dimensions, the dissipation term contributes more than  $P\boldsymbol {\nabla }\boldsymbol {\cdot } \boldsymbol {u}$, and the overall energy conversion is from KE to IE, opposite to the 2-D case. Total energy conservation,
 $\delta \text {PE}+\delta \text {KE} + \delta \text {IE} = 0$, still holds in three dimensions. This conservation holds in all simulations in table 1. In § 3, we will present a more refined balance relation applied to the coarse-grained quantities, where the balance of energy at different length scales is established.
The rate-governing quantities in our figure 4 seem more sensitive to fluctuations around the self-similar trajectory than the mixing width  $h(t)$ in figure 3, which has often been the main focus of previous RT studies. The fluctuations may be either due to intrinsic variability or due to a transient response to initial conditions, the removal of which has been recently discussed in Horne & Lawrie (Reference Horne and Lawrie2020). In Appendix A for the high interface Mach number case, the corresponding figure shows similar fluctuations under different initial and compressibility conditions suggests it may be the former, yet a careful investigation of this observation is beyond the scope of our paper. Nevertheless, we shall show below that energy transfer across scales exhibits clear self-similar evolution despite the presence of these fluctuations in the rate-governing quantities.
One may notice that mean injection,  $\langle \epsilon ^{{inj}}\rangle \equiv -\langle \rho g u_z\rangle$, shown in figures 4(a) and 4(c), grows more rapidly in two dimensions than in three dimensions. There are two (related) ways to understand this. (i) The mixing width growth rate
 $\alpha$ in two dimensions is larger than in three dimensions and, thus, the mixing layer width should be larger in two dimensions than in three dimensions at any physical time. This implies that relatively more PE is released in two dimensions due to the rising light fluid and sinking heavy fluid, leading to a higher mean injection
 $\langle \epsilon ^{{inj}}\rangle$. (ii) From the balance relation
 $\delta \text {PE}+\delta \text {KE} + \delta \text {IE} = 0$, we have
 $\delta \text {IE}<0$ in two dimensions, which is converted to KE, while
 $\delta \text {IE}>0$ in three dimensions. This implies a larger mean
 $\delta \text {KE}$ is expected in two dimensions, and thus
 $u_z$ is expected to be larger in two dimensions than in three dimensions. This leads to a larger
 $\langle \epsilon ^{{inj}}\rangle = -\langle \rho g u_z\rangle$ in two dimensions. We shall show below that there is a deeper physical explanation behind these differences between 2-D RT and 3-D RT arising from differences in the energy pathways across scales. Given the difference in
 $\langle \epsilon ^{{inj}}\rangle$ between the RT flows in two dimensions and three dimensions, we shall normalize by it to allow for a fair comparison of the budget terms between two dimensions and three dimensions.
2.7. ‘Filtering’ spectra
For completeness, we now present the spectra of density, velocity and KE using our RT data. In homogeneous constant-density flows, the energy spectrum is obtained by taking the Fourier transform of the velocity field and summing over shells in wavenumber space:  $E(k) = ({1}/{2})\varSigma _{k-0.5 < |\boldsymbol {k}| \leq k+0.5}|\hat {u}(\boldsymbol {k})|^{2}$. Obtaining the spectra for variable density RT flows is difficult because (i) the domain is not periodic in the vertical direction so the Fourier transform is not straightforward, and (ii) the non-quadratic nonlinearity of KE poses another problem.
Previous works in RT (Cook & Zhou Reference Cook and Zhou2002; Cabot et al. Reference Cabot, Schilling and Zhou2004) obtained the spectra for density and velocity by Fourier transforming in the horizontal periodic directions and then taking an average in the vertical direction. By taking Fourier transforms only in the horizontal directions, spectral information in the vertical direction is completely ignored.
Unlike in constant density turbulence, where the spectrum of energy is the same as that of velocity, in VD the two quantities are different. Moreover, when KE is non-quadratic, there are many possible ways to construct a ‘spectrum’ in  $k$-space having units of energy per wavenumber. These different ‘energy spectra’ correspond to the Fourier transform (or scale decomposition) of different combinations of variables and are not equivalent. To avoid the difficulty pertaining to its non-quadratic nature, previous studies constructed a KE spectrum by introducing a new variable
 $w_i=\sqrt {\rho }u_i$ and analysing it in Fourier space,
 $\hat {w}_i(k_x,k_y)$. However, as emphasized in Zhao & Aluie (Reference Zhao and Aluie2018), the evolution of
 $w_i$ is fundamentally different from the evolution of momentum,
 $(\rho u_i)$, especially when each of these variables is being decomposed in scale. A length scale
 $\sim 1/k$ does not exist on its own but is associated with the variable being decomposed. Zhao & Aluie (Reference Zhao and Aluie2018) showed that this new variable
 $w_i=\sqrt {\rho }u_i$ fails to satisfy the ‘inviscid criterion’ in VD flows, which means that dissipation can contaminate its large-scale dynamics in the presence of significant density variations. Thus,
 $\sqrt {\rho }u_i$ is not an appropriate quantity to analyse because it is inconsistent with inertial-range dynamics. Moreover, as was observed in Zhao & Aluie (Reference Zhao and Aluie2018), a putative power-law scaling of a quantity alone, such as
 $|\widehat {\sqrt {\rho }\boldsymbol {u}}|^{2}(k)$, is not indicative of an inertial cascade (see supplementary material, section C).
Here we adopt a new approach to obtain the spectra using spatial coarse graining. For any field  $\boldsymbol {u}$, the filtering spectrum is defined as (Sadek & Aluie Reference Sadek and Aluie2018)
 \begin{equation} E_{\boldsymbol{u}}(k_\ell)\equiv \frac{\textrm{d}}{\textrm{d}k_\ell}\langle |\bar{\boldsymbol{u}}_\ell(\boldsymbol{x})|^{2}\rangle /2, \end{equation}
where  $k_\ell =L/\ell$,
 $L$ is the domain size of interest,
 $\ell$ is the scale we are probing and
 $\langle \cdot \rangle$ stands for spatial averaging. The filtering spectrum of KE is
 \begin{equation} E_{{KE}}(k_{\ell})\equiv \frac{\textrm{d}}{\textrm{d}k_\ell}\langle \bar{\rho}_\ell|\tilde{\boldsymbol{u}}_\ell(\boldsymbol{x})|^{2}\rangle /2. \end{equation}
Sadek & Aluie (Reference Sadek and Aluie2018) showed that this filtering spectrum guarantees energy conservation, similar to the Plancherel theorem when working with Fourier spectra. The filtering spectrum allows us to measure the energy content at scale  $\ell$ by probing the change in
 $\langle \bar {\rho }_\ell |\tilde {\boldsymbol {u}}_\ell (\boldsymbol {x})|^{2}\rangle /2$ as
 $\ell$ is varied. The calculation can be done in physical space without any Fourier transforms. The obvious advantage is that definition (2.14) allows us to extract the spectrum in inhomogeneous flows such as RT. Moreover, the filtering spectrum generalizes easily to non-quadratic quantities, such as KE,
 $\rho \boldsymbol {u}^{2}/2$, in VD flows. The Fourier spectrum, on the other hand, is limited to quadratic quantities and requires treating KE as such, even when this is inconsistent with the dynamics.
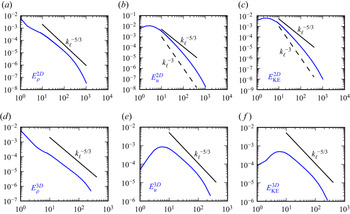
Figure 5 shows the spectra of density, velocity and KE for 2-D RT and 3-D RT flows calculated with the above definition. The density spectra follow a putative  $k_\ell ^{-5/3}$ scaling over an intermediate wavenumber range in both two dimensions and three dimensions. The velocity spectrum in two dimensions is steeper than
 $k_\ell ^{-5/3}$ but shallower than
 $k_\ell ^{-3}$ as would have been expected from 2-D homogeneous constant-density turbulence (e.g. Boffetta & Ecke Reference Boffetta and Ecke2012). In three dimensions the filtering spectrum is slightly shallower than a
 $k_\ell ^{-5/3}$ scaling over a decade. The KE spectra follow similar scalings as the velocity field. Both velocity and KE spectra attain a peak value at low wavenumbers, where most of the energy content resides. In contrast, the density spectra show the importance of much larger scales due to density variation in the vertical. Indeed, the density jumps between heavy and light fluids are expected to yield a spectrum
 ${\sim }k_\ell ^{-2}$, which is consistent with the scaling at the largest scales. Plots in figure 5 demonstrate the utility of the coarse-graining approach to probe the spectral content in all directions, including scales along the inhomogeneous (vertical) direction, as discussed in Sadek & Aluie (Reference Sadek and Aluie2018). For completeness, we show in the supplementary material section C the filtering spectra for three different scale decompositions of KE.
Density, velocity and KE ‘filtering’ spectra versus filtering wavenumber  $k_\ell =L_z/\ell$ (horizontal axes) for 2-D RT and 3-D RT turbulence at dimensionless time
 $\hat {t}=4$, visualized in figure 2. The spectra are calculated using a Gaussian filter. A
 $k_\ell ^{-5/3}$ scaling is shown for reference, and for 2-D velocity and KE spectra an additional
 $k_\ell ^{-3}$ scaling is shown. Note that
 $k_\ell$ is not a Fourier wavenumber, just a proxy for scale. The panels show: (a) density spectrum (2-D); (b) velocity spectrum (2-D); (c) KE spectrum (2-D); (d) density spectrum (3-D); (e) velocity spectrum (3-D); (f) KE spectrum (3-D).

3. Multiscale energy balance in RT flows
We now investigate the energy scale pathways of RT flows. We employ the Favre decomposition as discussed in §§ 2.3 and 2.7 to chart the channels for PE, IE and KE at large and small scales. Energy conversion between different forms and across different length scales is investigated by analysing the budget terms from numerical data.
3.1. Coarse-grained energy budget equations
Within the Favre decomposition, the budgets for large- and small-scale KE, IE and PE are
 \begin{gather} \partial_t\bar{\rho}_\ell \frac{|\tilde{\boldsymbol{u}}_\ell |^{2}}{2}+\boldsymbol{\nabla}\boldsymbol{\cdot} \boldsymbol{J}_\ell ={-}\varPi_\ell-\varLambda_\ell+\bar{P}_\ell \boldsymbol{\nabla}\boldsymbol{\cdot}\bar{\boldsymbol{u}}_\ell-D_\ell+\epsilon_\ell^{{inj}}, \end{gather}
 \begin{gather}\partial_t \frac{\bar{\rho}_\ell \tilde{\tau}_\ell(u_i, u_i)}{2} + \boldsymbol{\nabla} \boldsymbol{\cdot} \boldsymbol{J}_\ell^{{small}} = \varPi_\ell +\varLambda_\ell +\bar{\tau}_\ell(P,\boldsymbol{\nabla}\boldsymbol{\cdot} \boldsymbol{u})-D_\ell^{{small}}+\epsilon_\ell^{{small}}, \end{gather}
 \begin{gather}\partial_t \overline{\rho e}_\ell + \boldsymbol{\nabla} \boldsymbol{\cdot} [\overline{\rho e \boldsymbol{u}} -\overline{\kappa \boldsymbol{\nabla} T}] ={-}\bar{P}_\ell \boldsymbol{\nabla} \boldsymbol{\cdot} \bar{\boldsymbol{u}}_\ell - \bar{\tau}_\ell(P, \boldsymbol{\nabla}\boldsymbol{\cdot} \boldsymbol{u})+D_\ell^{{int}}, \end{gather}
 \begin{gather}\partial_t \bar{\mathcal{P}}_\ell + \boldsymbol{\nabla}\boldsymbol{\cdot} \overline{\mathcal{P} \boldsymbol{u}} ={-}\epsilon_\ell^{{inj}}, \end{gather}
where  $e$ is specific IE,
 $\mathcal {P}=\rho g z$ is PE density,
 $\boldsymbol {J}_\ell$ is spatial transport of KE,
 $\varPi _\ell$ and
 $\varLambda _\ell$ are KE fluxes across scale
 $\ell$,
 $-\bar {P}_\ell \boldsymbol {\nabla } \boldsymbol {\cdot } \bar {\boldsymbol {u}}_\ell$ is large-scale pressure dilatation,
 $D_\ell$ is viscous dissipation and
 $\epsilon _\ell ^{{inj}}$ is KE injection (hence, the ‘inj’ superscript) due to gravity at scales larger than
 $\ell$. These terms are defined as
 \begin{align} \left. \begin{aligned} \varPi_\ell(\boldsymbol{x}) & ={-}\bar{\rho} \partial_j \tilde{u}_i \tilde{\tau}(u_i,u_j); \ \varLambda_\ell(\boldsymbol{x})=\frac{1}{\bar{\rho}}\partial_j \bar{P} \bar{\tau}(\rho,u_j);\ \epsilon_\ell^{{inj}}(\boldsymbol{x})=\tilde{u}_i\bar{\rho}\tilde{g}_i; \\ D_\ell(\boldsymbol{x}) & =\partial_j \tilde{u}_i \left[2\overline{\mu S_{ij}}-\frac{2}{d}\overline{\mu S_{kk}}\delta_{ij}\right]; \ J_j(\boldsymbol{x})=\bar{\rho} \frac{|\tilde{\boldsymbol{u}}|^{2}}{2}\tilde{u}_j+\bar{P}\bar{u}_j+ \tilde{u}_i \bar{\rho} \tilde{\tau}(u_i,u_j)-\tilde{u}_i\bar{\sigma}_{ij}; \\ D_\ell^{{small}}(\boldsymbol{x}) & =\overline{\partial_j u_i \sigma_{ij}}-\partial_j \tilde{u}_i \overline{\sigma}_{ij}; \ \epsilon_\ell^{{small}}=\bar{\rho}\tilde{\tau}(u_i,g_i); \ D_\ell^{{int}}=\overline{\partial_j u_i \sigma_{ij}} = D_\ell + D_\ell^{{small}}; \\ J_j^{{small}}(\boldsymbol{x}) & =\frac{\bar{\rho}\tilde{\tau}(u_i,u_i)}{2} \tilde{u}_j+\frac{1}{2} \bar{\rho}\tilde{\tau}(u_i,u_i,u_j)+\bar{\tau}(P,u_j)-(\overline{u_i\sigma_{ij}}-\tilde{u}_i\bar{\sigma}_{ij}); \end{aligned} \right\} \end{align}
in which  $\tau (\cdot,\cdot )$ is the generalized second-order moment (Germano Reference Germano1992):
 $\tilde {\tau }(u_i,u_j)=\widetilde {u_i u_j}-\tilde {u}_i\tilde {u}_j$ and
 $\bar {\tau }(\rho,u_j)=\overline {\rho u_j}-\bar {\rho }\ \bar {u}_j$. Note that our small-scale KE, defined as
 $\bar {\rho }(\widetilde {|\boldsymbol {u}|^{2}} - |\tilde {\boldsymbol {u}}|^{2})/2$, is sometimes referred to as ‘subscale’ or ‘subgrid’ KE in the LES literature.
Coarse-grained PE density equation (3.4) can be derived by noting that
 \begin{align} \frac{\textrm{D} \mathcal{P}}{\textrm{D}t} &= \frac{\partial \mathcal{P}}{\partial t} + \boldsymbol{u} \boldsymbol{\cdot} \boldsymbol{\nabla}\mathcal{P}\nonumber\\ &= g z \frac{\partial\rho}{\partial t} + \rho g u_z + g z \boldsymbol{u}\boldsymbol{\cdot} \boldsymbol{\nabla}\rho\nonumber\\ &={-}\mathcal{P} \boldsymbol{\nabla}\boldsymbol{\cdot} \boldsymbol{u} + \rho g u_z. \end{align}
We analyse the energy pathways by inspecting the budget equations (3.1)–(3.4) using our simulations in table 1. In particular, we shall demonstrate the existence of an inertial range in such flows. Note that we do not formulate budgets for small-scale IE and PE, since it is unclear if these two quantities cascade (Eyink & Drivas Reference Eyink and Drivas2018).
3.2. Energy pathways in RT flows
This section presents some of the main results of our paper, which we summarize in § 3.2.5 for the reader's convenience. Here, we refine our analysis of the global energy balances in figure 4 at different scales via coarse-grained budgets. The types of energy involved in the scale transfer, as shown in (3.1)–(3.4), are PE, IE, large-scale KE and also small-scale KE. Differences in the energy pathways between two dimensions and three dimensions will be emphasized during our presentation.
3.2.1. Conversion between different forms of energy
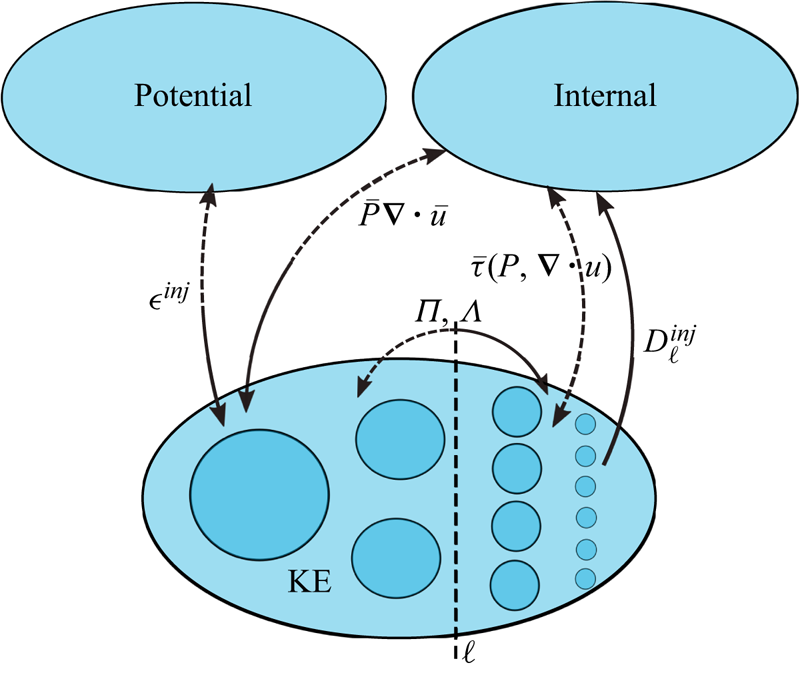
Figure 6 summarizes the RT energy pathways we discuss in this section. In RT flows, the ultimate energy source is the release of PE from the initial unstable density stratification. From (3.4), large-scale PE is a source for large-scale KE via  $\epsilon ^{{inj}}$ in (3.1). Small-scale KE injection
 $\epsilon ^{{small}}_\ell = \bar {\rho }\tilde {\tau }(u_i, g_i)$ is identically zero for RT flows since the gravitational acceleration
 $\boldsymbol {g}$ is constant in space. Thus, PE is available directly to large-scale KE. Meanwhile, KE is also linked to IE via pressure dilatation and viscous dissipation. The term
 $\bar {P}_\ell \boldsymbol {\nabla }\boldsymbol {\cdot } \bar {\boldsymbol {u}}_\ell$ appears as a source in the large-scale KE equation (3.1) and a corresponding term
 $\bar {\tau }(P, \boldsymbol {\nabla }\boldsymbol {\cdot } \boldsymbol {u})$ is a source in the small-scale KE budget equation (3.2), while both appear as sinks in the IE equation (3.3). Similarly, dissipation terms
 $D_\ell$ and
 $D_\ell ^{{small}}$ are sinks in large- and small-scale KE budgets, respectively, and sources in the IE budget:
 $D_\ell ^{{int}} = D_\ell + D_\ell ^{{small}}$. These channels, summarized in figure 6, are responsible for converting energy between different forms. In addition to these conversion channels, the transfer between large- and small-scale KE is now presented.
Schematic of energy pathways in RT flows between reservoirs of KE, PE and IE. The flow is further decomposed into its constituent scales within the KE reservoir, where a vertical dashed line denotes an arbitrary inertial scale  $\ell$ we are probing. Kinematically possible pathways are depicted with dashed arrows, while those that are dynamically manifested in 3-D RT are depicted with solid arrows (see §§ 3.2.3–3.2.4). Gravitational PE is converted into KE at the largest scale by
 $\epsilon ^{{inj}}$. This energy is then transferred to inertial scales by fluxes
 $\varLambda$ and
 $\varPi$. On average,
 $\varLambda$ acts as a conduit for PE, transferring KE to smaller inertial scales in both two dimensions and three dimensions. On average,
 $\varPi$ transfers energy downscale in three dimensions and upscale in two dimensions. The KE is coupled to IE at largest scales via pressure dilatation, and at the smallest viscous scales via dissipation.

3.2.2. KE scale pathways
There are two KE fluxes across scales,  $\varPi$ and
 $\varLambda$. Deformation work
 $\varPi$ is solely due to the turbulent velocity field, which is closely related to vortex stretching in constant-density 3-D turbulence (e.g. Eyink Reference Eyink2006). Baropycnal work
 $\varLambda$ was shown in Lees & Aluie (Reference Lees and Aluie2019) to transfer energy by strain and vorticity generation, in which density, pressure and velocity fields all play a role. These fluxes provide a pathway for KE across scales, and operate in the ‘inertial range’, as we shall see shortly.
Figure 6 sketches the mean or bulk pathways based on the energy budgets. Some arrows in the schematic are dashed, representing energy transfer directions which are not realized dynamically in our RT flows. For example, gravity converts PE to large-scale KE despite the kinematic possibility for the transfer to be in reverse. Pressure dilatation converts IE to large-scale KE. Baropycnal work,  $\varLambda$, transfers energy from large-scale KE to smaller scales, consistent with its role as as an energy flux. Deformation work,
 $\varPi$, also transfers KE energy downscale, but only in three dimensions. We find that
 $\varPi$ transfers KE in the reverse direction in two dimensions, from small to large scales. However, the total flux
 $\varPi +\varLambda$ is always downscale in both two dimensions and three dimensions. Irreversible viscous dissipation converts only small-scale (but not large-scale) KE to IE due to our scale decomposition satisfying the inviscid criterion. Last, although mean
 $\bar {\tau }(P, \boldsymbol {\nabla }\boldsymbol {\cdot }\boldsymbol {u})$ is a kinematically possible pathway between small-scale KE and IE, we observe it is close to zero in our RT flows. This is consistent with previous studies showing that mean pressure dilatation is a large-scale process and does not couple KE and IE at small scales, on average (Aluie Reference Aluie2011; Aluie et al. Reference Aluie, Li and Li2012; Kritsuk, Wagner & Norman Reference Kritsuk, Wagner and Norman2013; Wang et al. Reference Wang, Yang, Shi, Xiao, He and Chen2013).
Note that in the LES modelling literature, another formulation of the KE budget is often used in which baropycnal work,  $\varLambda$, is missing by lumping it with pressure dilatation. The traditional LES formulation is mathematically equivalent to our (3.1), but the physical interpretation of energy pathways is different. Stated briefly, our KE budget allows for an inertial range over which KE can cascade (Aluie Reference Aluie2011, Reference Aluie2013), unlike the more common LES formulation, which misses the distinct physics of baropycnal work
 $\varLambda$ that is essential in VD flows such as RT. A discussion is presented in supplementary material, section E.
3.2.3. The inertial range in turbulent RT flows
Having identified the pathways, we now present a quantitative analysis. We calculate all terms in the large-scale KE budget (3.1) as a function of scale  $\ell$, which allows us to test and validate ideas on energy conversion and the cascade.
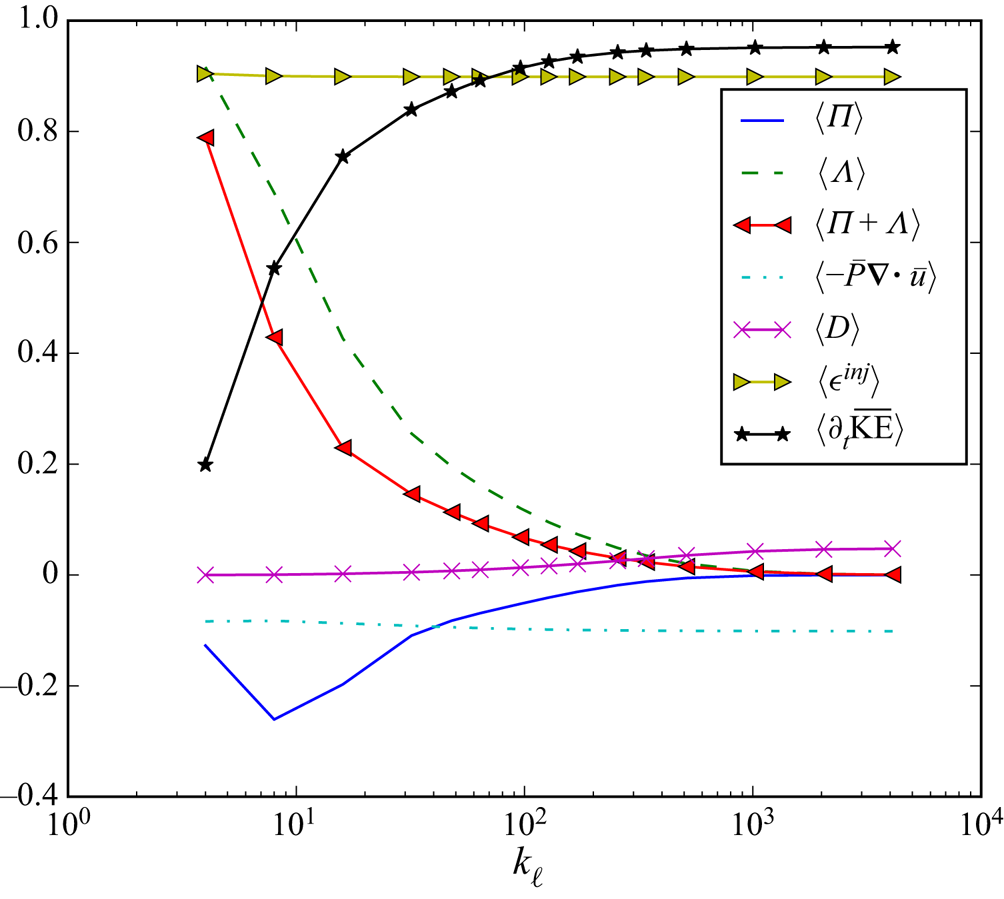
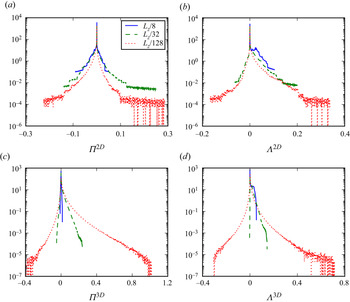
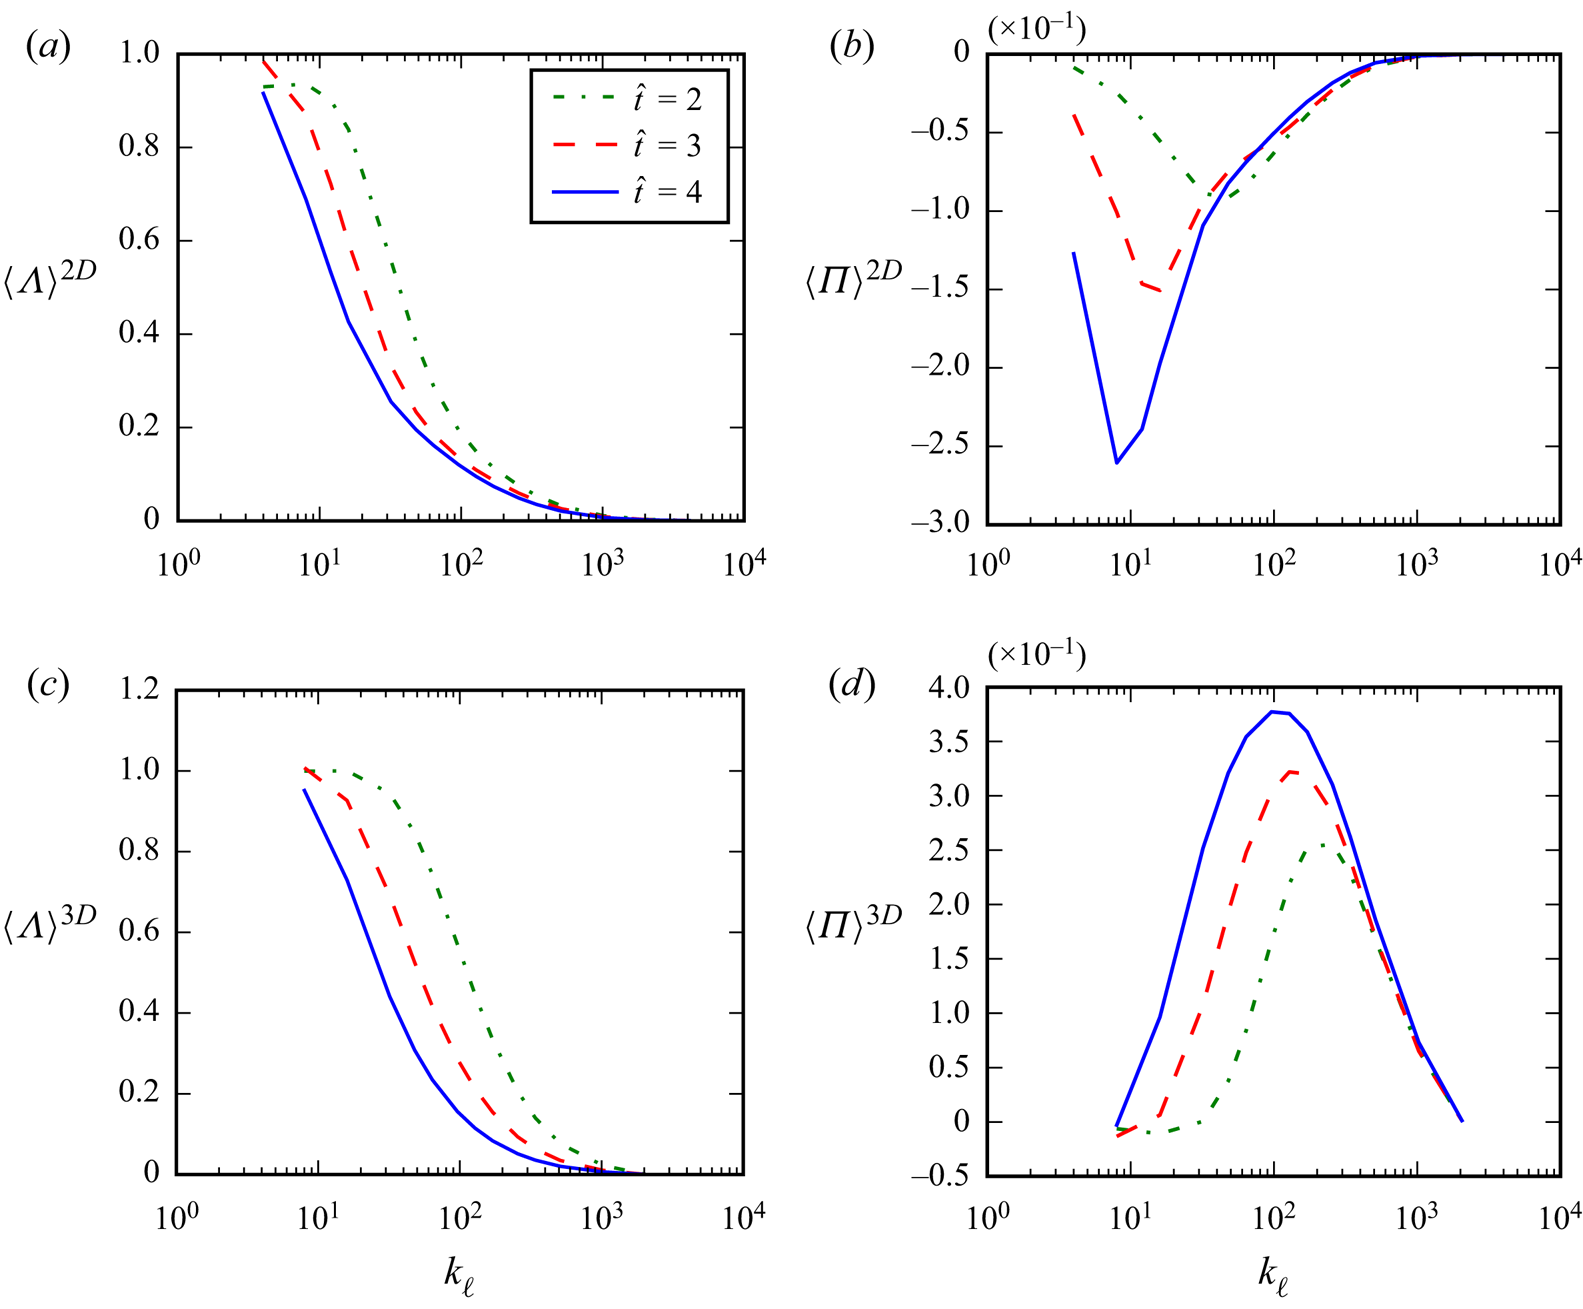
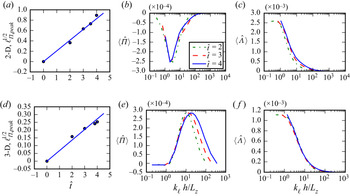
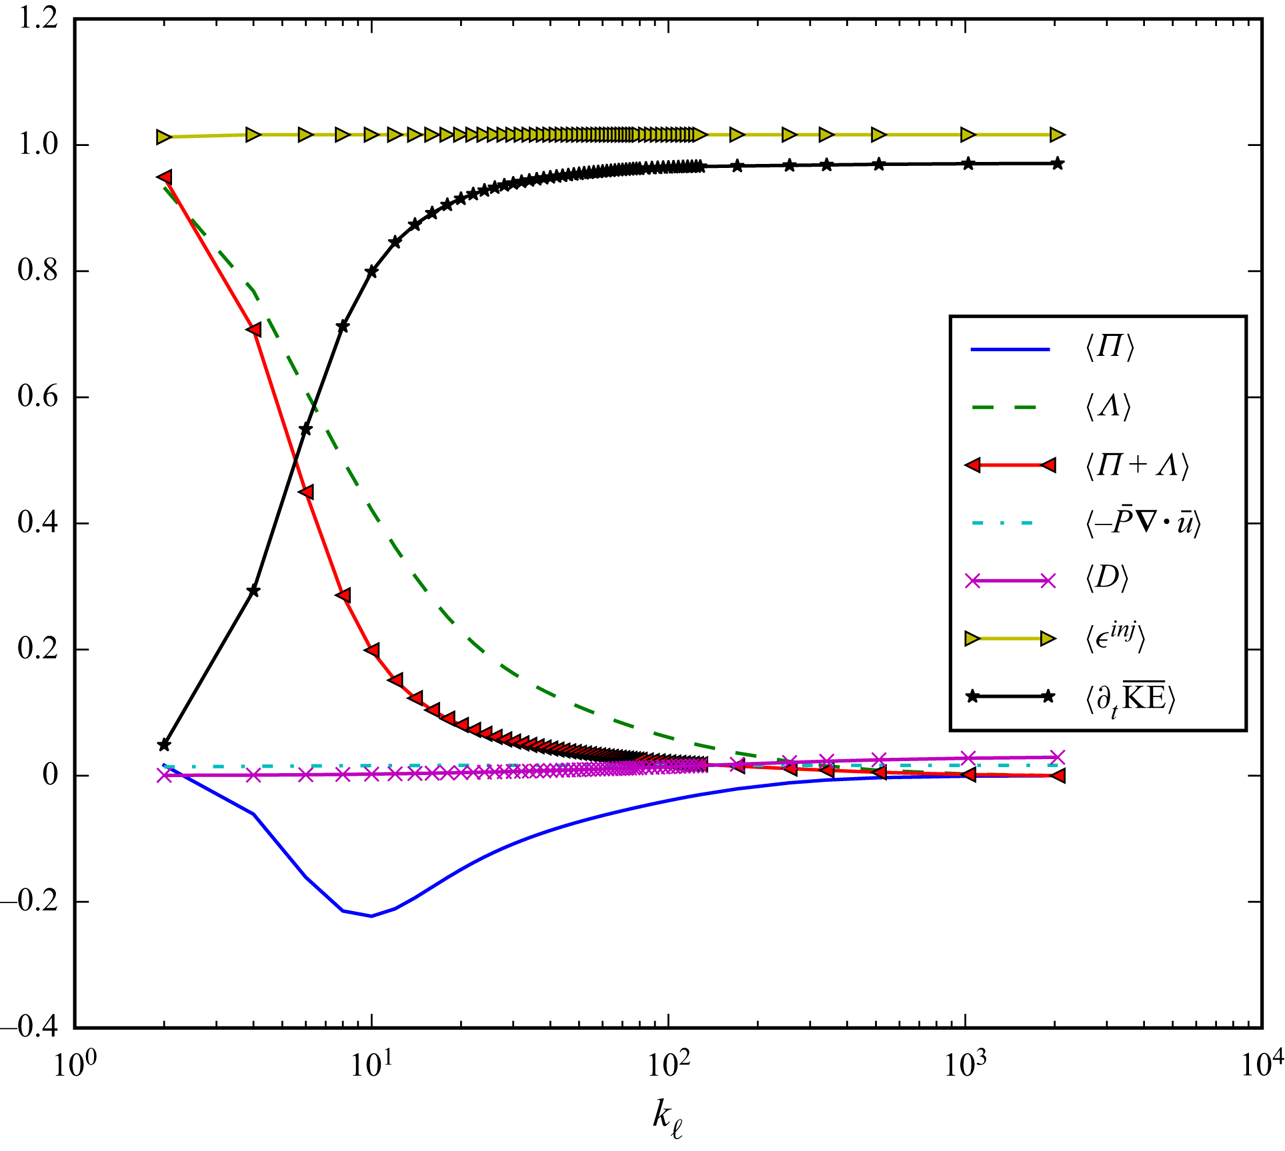
The results from the 2D4096 simulation (see table 1) are shown in figure 7, while the 3D1024 results are in figure 8. These figures plot the domain-averaged terms in (3.1) as a function of filtering wavenumber (inverse of scale)  $k_\ell =L_z/\ell$. Note that our ‘filtering wavenumber’
 $k_\ell$ does not involve any Fourier transform, and we only use it to refer to the corresponding scales, as is conventional in the turbulence literature. For large
 $k_\ell$ (small scales), these terms approach their unfiltered values. Therefore, they represent cumulative processes acting at all scales larger than
 $\ell$ and not just the contribution from scale
 $\ell$ itself. For example, if
 $\langle \partial _t \overline {\text {KE}}\rangle \equiv \langle \partial _t (\bar {\rho }_\ell ({|\tilde {\boldsymbol {u}}_\ell |^{2}}/{2}))\rangle$ increases in value over the range
 $[k_1,k_2]$ (
 $k_1< k_2$), then the KE content of scales within the band
 $[L_z/k_2,L_z/k_1]$ is growing. The only exceptions are the flux terms,
 $\varLambda _\ell$ and
 $\varPi _\ell$, which are hybrid quantities involving coarse-grained fields (
 $\boldsymbol {\nabla }\bar {P}_\ell$ or
 $\tilde {\boldsymbol {S}}_\ell$) acting against subscale contributions (
 $\bar {\tau }_\ell (\rho,\boldsymbol {u}$) or
 $\tilde {\tau }_\ell (\boldsymbol {u},\boldsymbol {u})$) and, therefore, represent the energy transfer across the partitioning scale
 $\ell$ (Aluie Reference Aluie2011, Reference Aluie2013).
Kinetic energy processes as a function of scale in the 2D4096 simulation at dimensionless time  $\hat {t}=4.0$. Filtering wavenumber
 $k_\ell =L_z/\ell$ is a proxy for length scale. Plots are normalized by
 $\langle \epsilon ^{{inj}} + P\boldsymbol {\nabla }\boldsymbol {\cdot } \boldsymbol {u}\rangle$, the (unfiltered) available mean source of KE. All mean budget terms in the filtered large scale KE equation (3.1) are plotted as a function of
 $k$. The time derivative of filtered KE
 $\partial _t \overline {\text {KE}}\equiv \partial _t (\bar {\rho }_\ell ({|\tilde {\boldsymbol {u}}_\ell |^{2}}/{2}))$ is also shown for this unsteady RT flow.

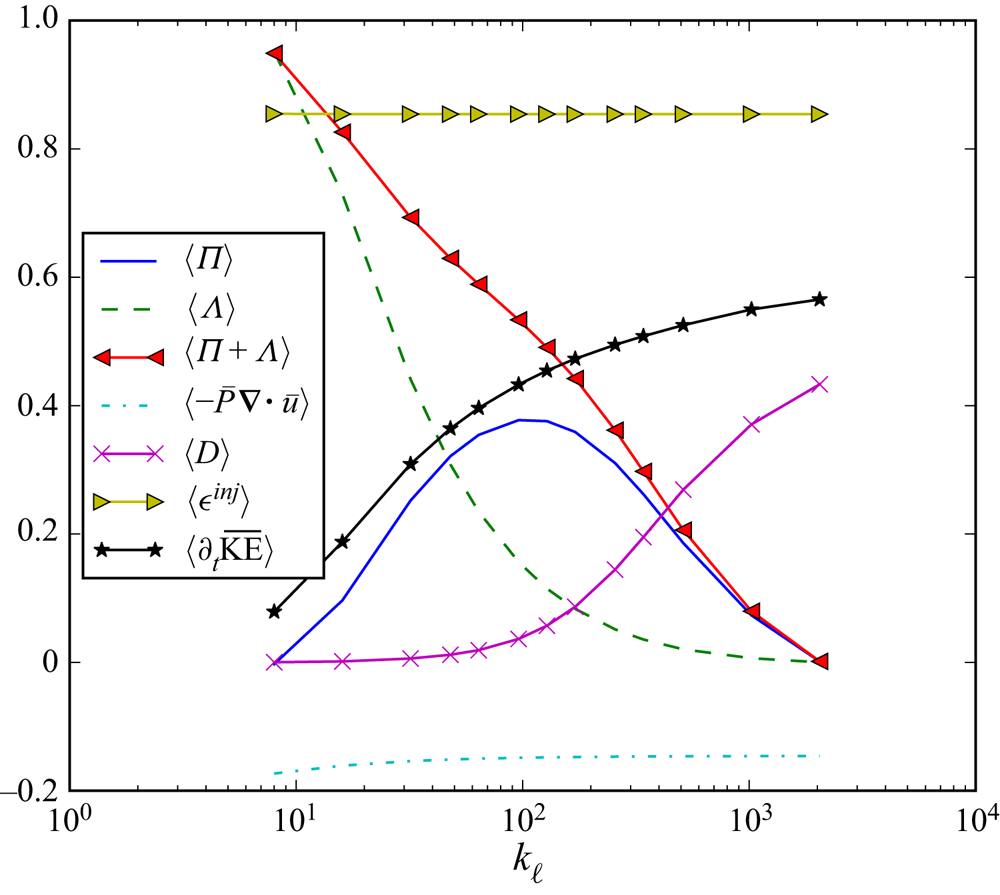
Same as in figure 7 but applied to the 3D1024 data at the same dimensionless time  $\hat {t}=4.0$. Plots are normalized by
 $\langle \epsilon ^{{inj}} + P\boldsymbol {\nabla }\boldsymbol {\cdot } \boldsymbol {u}\rangle$ at that time. Main differences from two dimensions are that here
 $\langle \varPi \rangle > 0$ (blue), transferring energy to smaller scales and resulting in much higher dissipation (magenta). Also, small scales at
 $k_\ell >100$ are still growing in time (black) unlike in figure 7 where
 $\langle \partial _t \overline {\text {KE}}\rangle$ (a cumulative quantity with contributions from all scales
 $< k_\ell$) becomes
 $k_\ell$-independent at large
 $k_\ell$, indicating that there is negligible growth at
 $k_\ell >100$ with most of the temporal KE increase happening at very larger scales in two dimensions (see figure 7, jump in black curve over
 $k\in [4,30]$).

Figures 7 and 8 show results from the 2D4096 and 3D1024 simulations, respectively. Spatial mean injection  $\langle \epsilon ^{{inj}}\rangle$ shown in the figures is constant in
 $\ell$, which is due to the spatially uniform gravitational acceleration used here (Aluie Reference Aluie2013). The reason becomes clear when considering that
 $\langle \epsilon ^{{inj}}\rangle = \langle \bar {\rho } \tilde {u}_i \tilde {g}_i\rangle = -\langle \overline {\rho u_z} \rangle g=-\langle \rho u_z \rangle g$ is independent of
 $\ell$. This implies that mean injection from PE is released directly only at the largest scale (Aluie Reference Aluie2013). To elaborate, consider two scales, one with length
 $L$, the largest in the system, and another with a smaller length scale
 $\ell$. Since mean injection at the two distinct scales is the same, injection within the band of scales
 $(\ell, L)$ is zero. Taking the limit
 $\ell \rightarrow 0$, it is obvious that no mean injection occurs at any scale below
 $L$. Thus, mean injection occurs only at the largest length scale, that of the domain size. Subsequent transfer to smaller scales occurs via the fluxes
 $\varLambda$ and
 $\varPi$, as we shall discuss below.
Similar to injection, mean pressure dilatation  $\langle -\bar {P}\boldsymbol {\nabla }\boldsymbol {\cdot }\bar {\boldsymbol {u}}\rangle$ is almost flat as a function of
 $\ell$ in figures 7 and 8. This is consistent with predictions in Aluie (Reference Aluie2011) and simulations by Aluie et al. (Reference Aluie, Li and Li2012), where the pressure dilatation was shown to operate over a transitional scale range of limited extent. Hence, mean pressure dilatation only affects the large-scale dynamics. Dissipation
 $\langle D_\ell \rangle$ within the Favre scale decomposition has already been proved to be negligible at large scales (Aluie Reference Aluie2013; Zhao & Aluie Reference Zhao and Aluie2018), which is again confirmed here in figures 7 and 8. Thus, in well-developed RT turbulence, there is a range of length scales which is immune from injection and pressure dilatation at large scales, and also from dissipation at small scales. This range of length scales is the ‘inertial range’ in the spirit of Kolmogorov's turbulence theory. Within this inertial range, KE dynamics is governed by the two fluxes
 $\varPi$ and
 $\varLambda$.
3.2.4. Energy fluxes across scales
The narrative that will emerge throughout this paper indicates that baropycnal work,  $\varLambda$, in RT flows acts as a conduit for gravitational PE, transferring (non-locally in scale) the energy deposited by
 $\epsilon ^{{inj}}$ at scale
 $L$ to smaller scales. Figures 7 and 8 show that
 $\langle \varLambda \rangle$ is positive, acting as a KE source for intermediate to small scales. Mean
 $\varLambda$ decays monotonically with
 $k_\ell$ in both two dimensions and three dimensions, indicating that
 $\varLambda$ does not persist to arbitrarily small scales. As we discuss in supplementary material, section A, this decay is consistent with
 $\varLambda$ being predominantly a non-local transfer in scale. As shown in figures 7 and 8, the decrease in
 $\varLambda$ is accompanied by an increase in
 $\partial _t \overline {\text {KE}}$ at those scales. This implies that as RT turbulence is evolving,
 $\varLambda$ acts as a KE source for unsteady scales within the inertial range, increasing their KE content. The largest scales increase their KE content the most, leaving less energy to be transferred by
 $\varLambda$ to smaller inertial scales, which explains why
 $\varLambda$ is not persistent (i.e. constant) but decays with smaller
 $\ell$. Further analysis of the scale locality of
 $\varLambda$ and decay in
 $k_\ell$ is undertaken in supplementary material, section A.
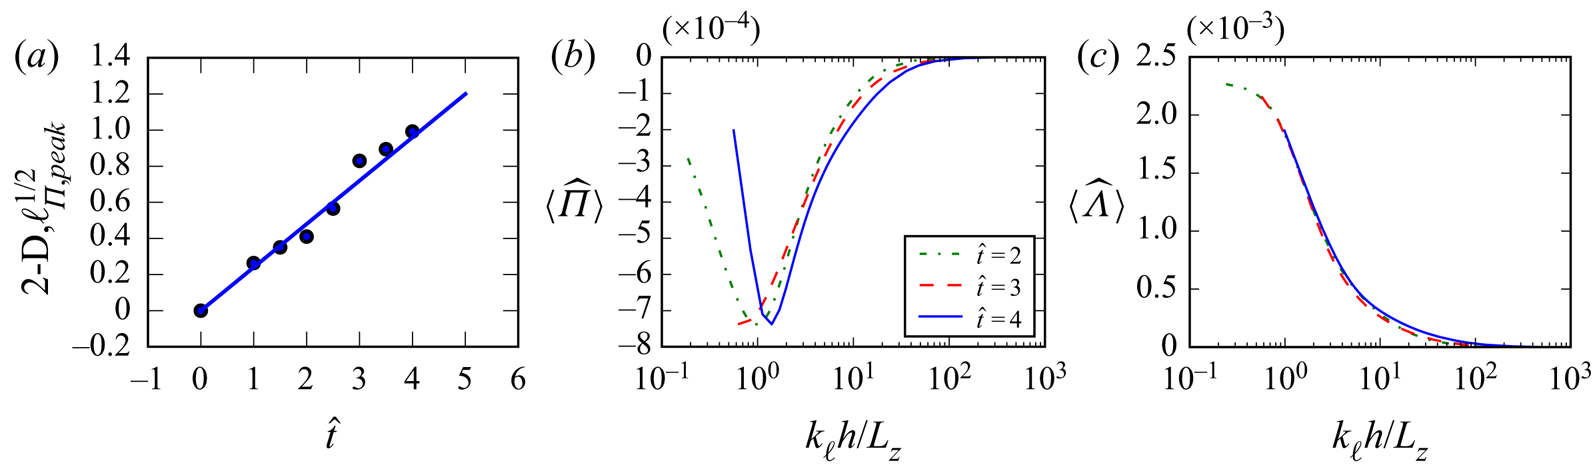
As these inertial scales become energetic enough and vortex stretching starts operating in three dimensions (figure 8), deformation work  $\varPi$ takes over and transfers energy to smaller inertial scales similar to constant-density homogeneous 3-D turbulence. Transfer by
 $\varPi$ is strongest (peak in figure 8) at an inertial scale that grows in time and is
 $O(10)$ smaller than the mixing width. In the absence of vortex stretching in two dimensions (figure 7),
 $\langle \varPi \rangle$ is negative as in constant-density homogeneous 2-D turbulence, transferring energy upscale. Hence, the only mechanism for growth of small-scale KE in two dimensions is baropycnal work
 $\varLambda$.
The downscale cascade of energy by  $\langle \varPi \rangle$ in three dimensions delivers energy to viscous scales which is manifested by large values of viscous dissipation in figure 8. In contrast, dissipation levels in two dimensions are miniscule since
 $\langle \varPi \rangle <0$, cascading energy upscale. This fundamental difference also explains the difference in spectra in figure 5, where there is less energy at small scales (
 $k_\ell \approx 100$) in two dimensions relative to three dimensions, despite there being more overall KE (integrated across all scales) in two dimensions relative to three dimensions. This is because
 $\varPi$ in three dimensions acts as a source term for these small inertial scales, in addition to
 $\varLambda$, delaying the saturation of KE at these scales in three dimensions relative to two dimensions.
Indeed, note that  $\langle \partial _t \overline {\text {KE}} \rangle$ as a function of scale in two dimensions in figure 7 saturates to a constant value at
 $k_\ell =L_z/\ell \approx 100$, with almost zero KE growth at higher
 $k_\ell$. This indicates that at the time being analysed, these small scales have reached a steady state and are not increasing on average. However, in two dimensions, unlike in three dimensions, their energy is subsequently transferred to large scales by
 $\varPi$ (which is negative), resulting in a low level of dissipation of KE. In contrast,
 $\langle \varPi \rangle$ and
 $\langle \varLambda \rangle$ are both positive in three dimensions, transferring a larger amount of energy to small scales compared with two dimensions. This leads to higher KE levels at small scales in three dimensions, as evidenced by plots of spectra in figure 5 and also of
 $\langle \partial _t \overline {\text {KE}} \rangle$ in figure 8, which keeps increasing as a function of
 $k_\ell$, indicating that those scales are still growing and have not yet reached a steady state. Since viscous dissipation is most effective at the smallest scales (within the Favre decomposition), this substantially higher energy input at high
 $k_\ell$ in three dimensions (versus two dimensions) leads to the higher levels of energy dissipation in figure 8 (versus figure 7).
Our analysis points to fundamental differences in physics between 2-D RT and 3-D RT instabilities. It is often observed that the turbulent RT instability mixing layer grows faster in 2-D simulations relative to 3-D simulations. (It is worth noting that Horne & Lawrie (Reference Horne and Lawrie2020) have reported smaller  $\alpha =0.012$ in quasi-2-D RT experiments. However, Ekman friction is prominent as discussed lucidly in that work and it would be expected to reduce the
 $\alpha$ value since it acts preferentially on large scales.) This is captured by the
 $\alpha$ parameter appearing in the mixing width evolution,
 $h=\alpha \mathcal {A} g t^{2}$, which has often been found to be larger in two dimensions than in three dimensions (Youngs Reference Youngs1991, Reference Youngs1994; Dimonte et al. Reference Dimonte2004; Cabot Reference Cabot2006), consistent with the values we found in figure 3. The enhanced growth in 2-D simulations has been somewhat of a puzzle since single-mode (non-turbulent) RT instability models and simulations predict that it is growth in three dimensions that should be faster (Layzer Reference Layzer1955; Goncharov Reference Goncharov2002; Bian et al. Reference Bian, Aluie, Zhao, Zhang and Livescu2020). The difference in
 $\alpha$ values in turbulent RT instability had been attributed to the smaller dissipation levels in two dimensions (Youngs Reference Youngs1991, Reference Youngs1994), although we have seen above that viscous dissipation levels are merely a symptom (or a consequence) of the energy scale-fluxes and do not directly influence inertial-range dynamics governing the mixing layer.
The fundamental difference in inertial-range physics is that deformation work  $\langle \varPi \rangle$ channels energy upscale in two dimensions and downscale in three dimensions. In 2-D RT,
 $\langle \varPi \rangle$ redirects energy delivered by
 $\varLambda$ to inertial scales back to larger scales, driving a positive feedback loop that is absent in 3-D RT. In this feedback loop, the upscale cascade leads to an enhanced growth of the mixing layer, which in turn leads to enhanced PE release (as seen in figure 4) by raising the light fluid and lowering the heavy fluid. The excess release of PE results in enhanced baropycnal energy transfer by
 $\varLambda$ to smaller scales which is rechannelled back upscale by
 $\varPi _\ell$, closing the feedback loop. This narrative is consistent with plots of filtering spectra in figure 5, where we see that the KE (and velocity) spectral peak in two dimensions is at larger scales and has a higher magnitude compared with three dimensions. Cabot (Reference Cabot2006) had speculated that the difference in
 $\alpha$ between two dimensions and three dimensions may be due to an inverse energy cascade in 2-D RT, although that study did not conduct an analysis of energy transfer across scales. Our results here provide thorough evidence in support of that hypothesis, and highlight the potentially misleading 2-D RT flow physics when modelling real-world 3-D RT flows.
Another important conclusion we can draw from our analysis is the absence of a net upscale energy transfer in 3-D RT. In many studies discussing RT flows in three dimensions, motivated by ICF (e.g. Alon et al. Reference Alon, Hecht, Ofer and Shvarts1995; Shvarts et al. Reference Shvarts, Alon, Ofer, Mccrory and Verdon1995; Ofer et al. Reference Ofer, Alon, Shvarts, Mccrory and Verdon1996; Oron et al. Reference Oron, Arazi, Kartoon, Rikanati, Alon and Shvarts2001; Zhou et al. Reference Zhou2003) astrophysics (e.g. Joggerst et al. Reference Joggerst, Almgren and Woosley2010; Porth et al. Reference Porth, Komissarov and Keppens2014) or fundamental fluid dynamics (e.g. Abarzhi Reference Abarzhi1998; Cheng et al. Reference Cheng, Glimm and Sharp2002; Cabot Reference Cabot2006), it is often claimed that the generation of successively larger bubbles following the presence of smaller ones is due to an inverse cascade of energy which causes small bubbles to merge into larger ones. According to such a narrative, the small scales are the source of energy feeding and sustaining the large scales, even in three dimensions.
Such claims are often based on qualitative observations of the flow development, including spectral energy content, but without clarifying the causality of energy spectral broadening and do not analyse the energy transfer across scales directly (e.g. scale fluxes  $\varPi$ and
 $\varLambda$) as we do here. While energy at small scales saturates before energy at larger scales, this does not necessarily imply that energy is being continuously channelled to the small scales and back up to larger scales. Indeed, our findings indicate the absence of a net upscale energy transfer in 3-D RT, and that growth of large-scale bubbles and spikes is solely due to baropycnal work
 $\varLambda _\ell$ in three dimensions, which deposits energy directly from gravitational PE at the largest scales in the system. No persistent upscale transfer of energy is required to explain the evolution of spectral energy content. The assumed existence of an inverse cascade had been used in some instances (e.g. Abarzhi Reference Abarzhi1998) to explain the dependence of RT flows on initial perturbations (Dimonte Reference Dimonte2004; Ramaprabhu et al. Reference Ramaprabhu, Dimonte and Andrews2005). If this were the case, it would have created significant difficulties in the subgrid modelling of RT flows. Our results here provide compelling evidence that the inverse cascade narrative in 3-D RT is unjustified. (Beating of modes to seed larger scales from smaller ones can still transfer minuscule amounts of energy upscale but this is fundamentally different from the notion of a cascade, which requires persistent transfer in scale and/or time. Consider, for example, 3-D constant-density homogeneous isotropic turbulence forced at an intermediate wavenumber
 $k_f$ in a triply periodic domain and having slightly smaller wavenumbers
 $k\lesssim k_f$ gain finite energy. Such transient upscale energy transfer is not sustained (or persistent) in wavenumber, which is why it is widely agreed that an inverse cascade in 3-D homogeneous isotropic turbulence is absent. Another example is the downscale cascade of enstrophy in 2-D constant-density flows: there is invariably non-zero energy transferred downscale along with enstrophy, but such energy transfer is not a cascade since it is not persistent in scale, vanishing rapidly
 $\sim \ell ^{2}$ as
 $\ell \to 0$ within the inertial range (Kraichnan Reference Kraichnan1967).)
3.2.5. Summary of RT energy pathways
Section 3.2 presented some of the main results of this paper, which we now summarize. We showed that Baropycnal work,  $\varLambda$, in RT flows acts as a conduit for gravitational PE, transferring the energy deposited by
 $\epsilon ^{{inj}}$ at the largest domain scale
 $L$ to smaller scales. As these inertial scales become energetic enough and vortex stretching starts operating in three dimensions (figure 8), deformation work
 $\varPi$ takes over and transfers energy to smaller inertial scales. The net downscale cascade of energy by
 $\langle \varPi \rangle$ in three dimensions delivers energy to viscous scales which is manifested by large values of viscous dissipation. In contrast, in 2-D RT,
 $\langle \varPi \rangle <0$ redirects energy delivered by
 $\varLambda$ back to larger scales via an upscale cascade. The upscale cascade in two dimensions leads to an earlier saturation of small inertial scales compared with three dimensions, which explains why small inertial scales are weaker than in three dimensions (see spectrum in figure 5). This is despite the greater overall KE (integrated across all scales) in two dimensions relative to three dimensions, which is explained by the positive feedback loop in 2-D RT.
The upscale cascade in 2-D RT drives a positive feedback loop that is absent in 3-D RT. In this feedback loop, the upscale cascade leads to an enhanced growth of the mixing layer, which in turn leads to enhanced PE release (as seen in figure 4) by raising the light fluid and lowering the heavy fluid. The excess PE released results in enhanced baropycnal energy transfer by  $\varLambda$ to smaller scales which is rechannelled back upscale by
 $\varPi$, closing the feedback loop.
3.3. Spatial distribution of fluxes
The spatial distribution of values for fluxes  $\varLambda$ and
 $\varPi$ is shown by their p.d.f.s in figure 9, for 2-D RT and 3-D RT. Results at three scales
 $\ell =L_z/8, L_z/32, L_z/128$ are shown. All p.d.f.s are non-Gaussian, with heavy tails and a stronger departure from Gaussianity at smaller scales. In two dimensions,
 $\varPi$ is skewed towards negative values, but in three dimensions it is positively skewed, reflecting the inverse versus forward net energy cascade by
 $\varPi$ in two dimensions versus three dimensions. The p.d.f. of
 $\varLambda$ is always skewed towards positive values. In particular, at large scales (e.g.
 $\ell =L_z/8$),
 $\varLambda _\ell$ is positive everywhere in the domain as is seen in figures 9(b) and 9(d). As we shall discuss in a subsequent paper, negative values of
 $\varLambda _\ell$ are correlated with spiralling regions of the flow, which are part of the mushroom structure that appears in late time single-mode RT. Note that the p.d.f. of
 $\varLambda$ in two dimensions (figure 9a) contains both positive and negative values when
 $\ell$ is below or equal to
 $L_z/32$, while the p.d.f. of
 $\varLambda$ in three dimensions (figure 9d) is almost always positive even at
 $\ell =L_z/32$. This observation is in accord with visualizations of density fields in figures 2(a) and 2(b) where 3-D RT exhibits much finer structures than in 2-D RT, such that the spiralling structures are on average smaller in three dimensions.
Probability density functions (p.d.f.s) of  $\varPi$ and
 $\varLambda$ from simulations 2D4096 and 3D1024 at dimensionless time
 $\hat {t}=4$. Results for three different scales
 $\ell =L_z/8, L_z/32, L_z/128$ are shown. The panels are for: (a) the p.d.f. of
 $\varPi$ in two dimensions; (b) the p.d.f. of
 $\varLambda$ in two dimensions; (c) the p.d.f. of
 $\varPi$ in three dimensions; (d) the p.d.f. of
 $\varLambda$ in three dimensions.

3.4. Temporal self-similarity of flux terms
So far, we have discussed the fluxes as a function of scale at one time instant. In this section we investigate their temporal evolution. Figure 10 shows mean  $\varPi$ and
 $\varLambda$ normalized by
 $\langle \epsilon ^{{inj}} + P\boldsymbol {\nabla }\boldsymbol {\cdot } \boldsymbol {u}\rangle$ at dimensionless times
 $\hat {t}=2,3,4$ using the 2D4096 and 3D1024 RT data (see table 1). As RT turbulence develops, the magnitude of normalized
 $\varLambda$ decreases, whereas the normalized
 $\varPi$ increases in magnitude. Note, however, that the absolute values of both fluxes keep increasing (not shown). A decrease in normalized
 $\varLambda$ indicates that as KE at scale
 $\ell$ saturates in time, the relative importance of
 $\varLambda$, which is responsible for redistributing injected energy from the potential release, also decreases. In contrast, turbulence levels in RT flows increase in time, leading to an increasing relative magnitude of
 $\langle \varPi \rangle$. The scale corresponding to the peak magnitude of
 $\varPi$, indicated by
 $k_{{peak}}$, shifts to smaller
 $k_\ell$ (or larger scales) over time. For example, in two dimensions,
 $k_{{peak}}$ shifts from
 $\approx 64$ at
 $\hat {t}=2$, to
 $\approx 10$ at
 $\hat {t}=4$, while in three dimensions,
 $k_{{peak}}$ shifts from approximately
 $\approx 256$ at
 $\hat {t}=2$ to
 $\approx 100$ at
 $\hat {t}=4$. Thus, as expected, turbulence encroaches onto larger scales as RT evolves, so that vortex stretching (in three dimensions) or mergers (in two dimensions) which drive the
 $\varPi$ flux are more pronounced at these scales.
Temporal evolution of fluxes in two dimensions and three dimensions at dimensionless time  $\hat {t}=2,3,4$. The filtering wavenumber is
 $k_\ell =L_z/\ell$. Plots are normalized by
 $\langle \epsilon ^{{inj}} + P\boldsymbol {\nabla }\boldsymbol {\cdot } \boldsymbol {u}\rangle$ at the corresponding time: (a) normalized
 $\langle \varLambda \rangle$ evolution in two dimensions; (b) normalized
 $\langle \varPi \rangle$ evolution in two dimensions; (c) normalized
 $\langle \varLambda \rangle$ evolution in three dimensions; (d) normalized
 $\langle \varPi \rangle$ evolution in three dimensions.

The above observations indicate possible self-similar (in time) behaviour of turbulent RT fluxes. If we plot the scales corresponding to the peak magnitude of  $\langle \varPi \rangle$, which we denote as
 $\ell _{\varPi, {peak}}$, against dimensionless time
 $\hat {t}$, we obtain a quadratic scaling in time as shown in figure 11(a,d), similar to the mixing width
 $h(t)$ in figure 3. Figure 11(a,d) indicate that, in both two dimensions and three dimensions,
 $\sqrt {\ell _{\varPi, {peak}}} \propto \hat {t} \propto t$, with the coefficients
 \begin{equation} \ell_{\varPi, {peak}}^{2D} = \alpha_{\rm \pi}^{2D} \mathcal{A} g t^{2} \approx 0.37 h^{2D}(t), \quad \ell_{\varPi, {peak}}^{3D} = \alpha_{\rm \pi}^{3D} \mathcal{A} g t^{2} \approx 0.067 h^{3D}(t), \end{equation}
where  $h^{2D}(t), h^{3D}(t)$ are the mixing widths from the 2D4096 and 3D1024 RT data. Note from figure 10 (also figure 11b,e) how
 $\langle \varPi \rangle$ in two dimensions is skewed to larger scales, unlike in three dimensions, peaking at approximately half the size of the mixing width,
 $\ell _{\varPi, {peak}}^{2D}\approx h^{2D}/2$ (3.7a,b). This is consistent with the net upscale transfer by
 $\varPi$ driving the mixing layer growth as discussed in § 3.2.4. In comparison,
 $\langle \varPi \rangle$ in three dimensions is symmetric, peaking at a scale
 $O(10)$ smaller than the mixing width,
 $\ell _{\varPi, {peak}}^{3D}\approx h^{3D}/10$.
Temporal self-similarity of turbulent RT fluxes. Panels (a–c) show results for 2-D RT, (d–f) show 3-D RT. Panels (a,d) plot length scale  $\ell _{\varPi, {peak}}$ associated with the peak of
 $\varPi$ in two dimensions and three dimensions, versus dimensionless time
 $\hat {t}$. Panels (b,e) show rescaled
 $\langle \hat {\varPi }\rangle$ in (3.8). Panels (c,f) show rescaled
 $\langle \hat {\varLambda }\rangle$.

The temporal scaling of  $\ell _{\varPi, {peak}}$ in figure 11(a,d) is evidence that the evolution of mean fluxes
 $\langle \varPi \rangle, \langle \varLambda \rangle$ is self-similar. Recall that self-similarity implies that functions of length and time, such as
 $\langle \varPi \rangle$ and
 $\langle \varLambda \rangle$, should collapse to the same curve when properly rescaled (Ristorcelli & Clark Reference Ristorcelli and Clark2004). Specifically, the rescaled fluxes should satisfy
 \begin{equation} \left. \begin{aligned} \langle\hat{\varPi}\rangle(\hat{k}_\ell)\equiv f_{\rm \pi}(k_\ell\,t^{2}) & = F_{\rm \pi}^{{-}1}(t)\langle\varPi\rangle\left(\hat{k}_\ell\frac{L_z}{h},t\right),\\ \langle\hat{\varLambda}\rangle(\hat{k}_\ell)\equiv f_\lambda(k_\ell\,t^{2}) & =F_\lambda^{{-}1}(t)\,\langle\varLambda\rangle\left(\hat{k}_\ell\frac{L_z}{h},t\right), \end{aligned} \right\} \end{equation}
where  $\hat {k}_\ell$ is just filtering wavenumber
 $k_\ell =L_z/\ell$, rescaled by the mixing width
 $h(t)$,
 $\hat {k}_\ell \equiv k_\ell \,h/L_z$. Here
 $F_{\rm \pi} (t)$,
 $F_\lambda (t)$ are temporal scaling functions, and
 $f_{\rm \pi} (\cdot ), f_\lambda (\cdot )$ are the similarity functions. If mean fluxes
 $\langle \varPi \rangle, \langle \varLambda \rangle$ are temporally self-similar, then
 $\langle \hat {\varPi }\rangle, \langle \hat {\varLambda }\rangle$ should collapse onto the same curve.
Figure 11(b,e) for  $\langle \hat {\varPi }\rangle$ in two dimensions and three dimensions, and figure 11(c,f) for
 $\langle \hat {\varLambda }\rangle$ in two dimensions and three dimensions indicate that they indeed collapse onto each other. In figure 11(b,e), the horizontal axis is rescaled by the mixing width
 $h(t)/L_z$. To account for the temporal function
 $F_{\rm \pi} (t)$, we rescaled the plots at
 $\hat {t}=3, 4$ so that their maxima match with that at
 $\hat {t}=2$. The same rescaling amplitudes for
 $\langle \hat {\varPi }\rangle$ are also applied to
 $\langle \hat {\varLambda }\rangle$, as is shown in figure 11(c,f), which indicates that
 $F_{\rm \pi} (t)\approx F_\lambda (t)$. We have found that
 $F_{\rm \pi} (t)$ and
 $F_\lambda (t)$ follow a scaling close to
 $t^{3}$ both in two dimensions and three dimensions (not shown). This
 $t^{3}$ growth of the fluxes can be understood from the cumulative amount of PE released, which follows
 $\delta P\sim h^{2}\sim t^{4}$ (Dimonte et al. Reference Dimonte2004), implying that the rate of KE injection should scale as
 $\langle \epsilon ^{{inj}}\rangle \sim t^{3}$. This energy is eventually channelled by the fluxes
 $\varLambda$ and
 $\varPi$, which grow in magnitude accordingly.
While plots of the fluxes show good collapse in figure 11, it is worth discussing the relatively poor collapse of  $\langle \hat {\varPi }\rangle$ in three dimensions (figure 11e) at scales smaller than that of the peak. The reason
 $\langle \hat {\varPi }\rangle$ decays at those scales is due to viscous dissipation removing the KE available to cascade. As the RT flow evolves and there is more KE cascading, the dissipation scale
 $\ell _d$ should become smaller as
 $\ell _d\sim t^{-1/4}$ as shown in Ristorcelli & Clark (Reference Ristorcelli and Clark2004) by invoking Kolmogorov's turbulence phenomenology. This is reflected in
 $\langle \hat {\varPi }\rangle$ extending to smaller scales at later times in figure 11(e). Therefore, the dissipation dynamics is not expected to follow the temporal self-similarity of inertial scales captured in (3.8). Note that the
 $\langle \hat {\varPi }\rangle$ cascade in two dimensions, being upscale, is not arrested by viscous dissipation at the smallest scales, which explains the much better collapse of
 $\langle \hat {\varPi }\rangle$ in figure 11(b).
4. Directionally split analysis of RT anisotropy
In RT flows the KE injection acts only in the vertical direction due to the downward gravitational acceleration. In addition, the initial and boundary conditions are different in the horizontal and vertical directions. Therefore, anisotropy both in the bulk flow and as a function of scale is expected in RT flows. Using DNS data, Cabot & Zhou (Reference Cabot and Zhou2013) examined RT anisotropy mostly based on bulk flow quantities such as the Taylor microscale, Kolmogorov scale and velocity derivatives, and using other statistical measures such as correlation functions. These quantities do not rely on a proper scale decomposition. They also analysed anisotropy as a function of scale but only in the homogeneous directions using Fourier transforms to measure spectra. They found that large-scale dynamics (based on the bulk flow and Fourier spectra) in RT is highly anisotropic, but that the flow becomes more isotropic at small scales, where velocity derivatives appear more isotropic than the velocity field itself. In a follow-up work, Zhou & Cabot (Reference Zhou and Cabot2019) studied the time evolution of anisotropy, mixing and scaling in RT instability, extending their previous one-snapshot analysis to different times and Atwood numbers. Other works on anisotropy of RT relied on analysing the normalized deviatoric part of the Reynolds stress tensor,  $b_{ij}=\langle u_i u_j\rangle / \langle u_k u_k\rangle -1/3\delta _{ij}$ to measure the anisotropy in RT flows (Livescu et al. Reference Livescu, Ristorcelli, Gore, Dean, Cabot and Cook2009, Reference Livescu, Ristorcelli, Petersen and Gore2010; Banerjee, Kraft & Andrews Reference Banerjee, Kraft and Andrews2010; Zhou Reference Zhou2017b), whose values are bounded between
 $-1/3$ and
 $2/3$. Non-zero values of
 $b_{ij}$ indicate deviation from isotropy, and typical values of
 $b_{33}\approx 0.3$ or
 $0.35$ are observed with DNS RT data (e.g. Livescu et al. Reference Livescu, Ristorcelli, Gore, Dean, Cabot and Cook2009). The above works relied primarily on statistical approaches, such as Reynolds averaging, to analyse RT anisotropy, which are not capable of identifying anisotropy as a function of scale. On the other hand, a Fourier scale decomposition is limited to homogeneous (horizontal) directions. A more refined analysis is possible with our coarse-graining approach, which analyses the scale-by-scale anisotropy in RT flows, as we shall discuss now and also in supplementary material, section B.
4.1. Directionally split anisotropy at scales
Here, we investigate anisotropy of RT flows at different scales in physical space. To quantify the contribution to the KE budget from different directions, we first formulate the budgets along each direction separately, and then diagnose the constituent terms from numerical data. We call this ‘directionally split’ analysis of anisotropy, which is different from the analysis of scale anisotropy done in supplementary material, section B. Similar to the filtered total KE equation (3.1), we can get the filtered KE equations in separate directions,
 \begin{equation} \partial_t\bar{\rho}_\ell \frac{|\tilde{\boldsymbol{u}}_\xi |^{2}}{2}+\boldsymbol{\nabla}\boldsymbol{\cdot} \boldsymbol{J}_\ell^{\xi} ={-}\varPi^{\xi}_\ell-\varLambda^{\xi}_\ell+\bar{P}_\ell \partial_\xi\bar{u}_\xi-D^{\xi}_\ell+\epsilon_\ell^{inj,\xi}, \end{equation}
where  $\xi$ is a symbol denoting a single direction
 $x$,
 $y$ or
 $z$. Note that since we are not concerned with scale anisotropy here, the filtering kernel is still isotropic as before,
 $G(\boldsymbol {r}) = G(|\boldsymbol {r}|)$. The budget terms in the above equation are defined by
 \begin{equation} \left. \begin{aligned} & \varPi^{\xi}_\ell(\boldsymbol{x})={-}\bar{\rho} \partial_j \tilde{u}_\xi \tilde{\tau}(u_\xi,u_j), \quad \varLambda^{\xi}_\ell(\boldsymbol{x})=\frac{1}{\bar{\rho}}\partial_\xi \bar{P} \bar{\tau}(\rho,u_\xi), \quad D^{\xi}_\ell(\boldsymbol{x})=\partial_j \tilde{u}_\xi \bar{\sigma}_{\xi j}, \\ & J^{\xi}_j(\boldsymbol{x})=\bar{\rho} \frac{\tilde{u}_\xi^{2}}{2}\tilde{u}_j+\bar{P}\bar{u}_\xi\delta_{\xi j}+\tilde{u}_\xi \bar{\rho} \tilde{\tau}(u_\xi,u_j)-\tilde{u}_\xi\bar{\sigma}_{\xi j}, \quad \epsilon^{inj,\xi}_\ell(\boldsymbol{x})=\tilde{u}_\xi\bar{\rho}\tilde{F}_\xi, \end{aligned} \right\} \end{equation}
whose forms are similar to their counterparts in the total KE budget equation (3.1). The sum of these equations in all directions reduces to the full budget equation (3.1). Note that in the above definitions, the subscript  $\xi$ represents only one direction, and
 $\xi$ itself does not follow the Einstein summation convention.
Before delving into details of the budgets in separate directions, we shall first check the coarse-grained KE in each direction. This is shown as a function of filtering wavenumber  $k_\ell =L_z/\ell$ in figure 12 for 2-D RT and 3-D RT data. In two dimensions, mean KE is approximately isotropic at all scales, with the horizontal component slightly greater than the vertical at large scales. This may seem counterintuitive since KE is injected in the vertical direction. In contrast, we see that in 3-D, horizontal KE in the
 $x$ and
 $y$ directions is almost equal, but is more than three times smaller than KE in the vertical at large scales. This indicates that in the horizontal plane, 3-D RT turbulent flow is isotropic as expected, but the vertical flow is much stronger than the horizontal at large scales, consistent with results of Cabot & Zhou (Reference Cabot and Zhou2013) based on Fourier spectra in the homogeneous direction. Thus, we have different behaviours for 2-D RT and 3-D RT. In 2-D RT, the flow seems to be close to isotropic, while it is highly anisotropic in 3-D RT. Note that in figure 12, derivatives of the plots with respect to
 $k_\ell$ give rise to the filtering spectra defined in (2.14). At small scales, the
 $k_\ell$-derivatives of both 2-D and 3-D filtered KE are small and comparable in all directions. At large scales, the filtering spectrum indicates that the flow is approximately isotropic in two dimensions (figure 12a) and highly anisotropic in three dimensions (figure 12b), where the vertical large-scale flow contains more energy than the horizontal large-scale flow. We will now investigate this difference carefully by analysing the energy budgets in separate directions.
Directional anisotropy of RT flows. Coarse-grained KE of the flow in different directions as a function of scale in two dimensions and three dimensions. Their sum over all directions is also shown for reference. Data is at dimensionless time  $\hat {t}=4.0$. These are cumulative quantities, showing energy at all scales larger than
 $\ell =L_z/k_\ell$. Energy content at any
 $k_\ell$ (i.e. the spectrum) is obtained from the
 $k_\ell$-derivative of these plots. Panel (a) is for the 2-D result and (b) for the 3-D result.

In figure 13 we show mean values of the normalized budget terms in (4.2) for the 2D4096 simulation at time  $\hat {t}=4.0$. Budget terms corresponding to the evolution of horizontal KE, vertical KE and the full KE are shown. In figure 13(a),
 $\varPi _x$ is larger in magnitude than
 $\varPi _z$, in accordance with the larger magnitude of KE in the horizontal direction in 2-D RT. The
 $\varLambda$ term resides mostly in the vertical component
 $\varLambda _z$, while
 $\varLambda _x$ is almost zero. This indicates that
 $\varLambda$ is mainly responsible for transferring injected energy to vertical scales, and does not redistribute KE among different directions.
The 2-D RT directionally split budget terms for filtered KE using the 2D4096 data at  $\hat {t}=4$. Filtering wavenumber
 $k_\ell =L_z/\ell$. Plots are normalized by
 $\langle \epsilon ^{{inj}} + P\boldsymbol {\nabla }\boldsymbol {\cdot } \boldsymbol {u}\rangle$. Panels show deformation work, baropycnal work, pressure dilatation and dissipation.

The next term in figure 13 is the (negative) pressure dilatation, which is a cumulative quantity, similar to filtered KE in figure 12, meaning that its contribution at scale  $\ell$ is determined by its derivative with respect to filtering wavenumber
 $k_\ell =L_z/\ell$. That is, its contribution at scale
 $\ell$ equals
 $({\partial }/{\partial k})\langle \bar {P}_\ell \boldsymbol {\nabla }\boldsymbol {\cdot }\bar {\boldsymbol {u}}_\ell \rangle \rvert _{k=L_z/\ell }$. Therefore, as indicated by figure 13(c), pressure dilatation acts as a source for mean horizontal KE, since
 $\langle \bar {P} \partial _x \bar {u}_x\rangle$ increases with respect to scale, so that its contribution to horizontal KE at scale
 $\ell =L_z/k_\ell$ measured by the derivative is positive. For the mean vertical KE, the vertical component
 $\langle \bar {P} \partial _z \bar {u}_z\rangle$ at the largest scale is positive and acts as a source, but at all subsequent scales its mean value decreases with increasing filtering wavenumber,
 $({\textrm {d}}/{\textrm {d}k})\langle \bar {P} \partial _z \bar {u}_z\rangle < 0$, indicating it is a sink term at these scales. The combined value in all directions gives rise to a pressure dilatation that is almost constant on average with respect to filtering wavenumber. Therefore, pressure dilatation acts to mix up horizontal and vertical velocities and isotropize the KE in different directions, similar to the role of pressure strain in constant-density turbulence (Pope Reference Pope2001). Considering dissipation in figure 13, the two components have comparable magnitude, but since there is little KE residing at small scales due to the fast decay of spectrum and a net upscale cascade by
 $\varPi$, the magnitude of dissipation in two dimensions is far smaller than other budget terms.
The directionally split budget terms for 3-D RT are shown in figure 14. In all four panels, the  $x$ and
 $y$ components are equal, indicating isotropy in the horizontal plane. However, anisotropy in the vertical direction is more pronounced than in two dimensions. Furthermore,
 $\langle \varPi _z\rangle$ in the vertical direction is much larger than the horizontal components, contrary to the 2-D case where the horizontal
 $\langle \varPi _x\rangle$ is larger in magnitude. Also in three dimensions,
 $\langle \varPi _x\rangle$ and
 $\langle \varPi _y \rangle$ peak at smaller scales compared with
 $\langle \varPi _z\rangle$, indicating a strengthening of the cascade in the horizontal direction at smaller scales, where it becomes more comparable to
 $\langle \varPi _z \rangle$. Mean
 $\varLambda$ is only significant in the vertical direction, with almost zero values in the horizontal directions, similar to two dimensions. Also, pressure dilatation is the source of KE input in the horizontal directions, similar to two dimensions. Dissipation is more isotropic in all directions, consistent with a trend towards isotropy of
 $\langle \varPi \rangle$ at these small scales, although the vertical component attains a slightly higher value.
Same as in figure 13 but for 3-D RT using the 3D1024 data at  $\hat {t}=4$.

In summary, the directionally split energy budgets in 2-D RT and 3-D RT indicates that mean injection and its conduit  $\varLambda$ contribute only to the vertical component of KE. Horizontal KE is forced by the horizontal component of pressure dilatation in both two dimensions and three dimensions. Dissipation, which is at the smallest scales, is approximately isotropic. However, significant differences between two dimensions and three dimensions appear in the fluxes
 $\langle \varPi _x\rangle$ and
 $\langle \varPi _z\rangle$ at inertial scales.
In the earlier discussion of this section, we observed a sharp contrast between two dimensions and three dimensions in figure 12, which indicated that the 2-D flow is surprisingly isotropic at large scales, while it is highly anisotropic in three dimensions due to the expected stronger vertical velocity. The reason can be gleaned from the foregoing results, especially those in figures 13 and 14. The primary difference between the directionally split budgets in two dimensions and three dimensions is due to the cascade  $\varPi$. In two dimensions, figure 13(a) shows that
 $\varPi _x$ is an energy source for mean horizontal large-scale KE, and similarly,
 $\varPi _z$ is a source for vertical large-scale KE. However, the magnitude of
 $\langle \varPi _x\rangle$ is approximately two to three times greater than
 $\langle \varPi _z\rangle$, indicating that large-scale KE gains more energy from
 $\varPi$ in the horizontal direction than in the vertical, offsetting anisotropy due to
 $\varLambda$, which energizes the vertical flow. Thus, the inverse cascade
 $\varPi$ acts alongside pressure dilatation to isotropize the large-scale flow, where most of the KE resides. In contrast, results from 3-D RT indicate that
 $\langle \varPi _x\rangle$ and
 $\langle \varPi _y\rangle$ are positive, acting as an energy sink for horizontal large-scale KE. Therefore, the large-scale horizontal flow in three dimensions has only pressure dilatation as a source of energy, unlike the vertical flow that is being driven by
 $\varLambda$, which ultimately leads to the large anisotropy in 3-D RT.
While the anisotropy analysed above is due to horizontal and vertical components of the flow, another measure of anisotropy is that of length scales by using anisotropic filtering kernels as we do in the supplementary material, section B.
5. Conclusions
In this work, we have undertaken a thorough analysis of the energy pathways across scales in RT turbulence. We coarse grained the dynamics using the Favre decomposition to probe nonlinear processes at different scales without resorting to Fourier transforms. In particular, this allowed us to probe scales in the inhomogeneous (vertical) direction, which had not been done before in VD (non-Boussinesq) RT flows. Our approach does not assume the a priori presence of turbulence and is applicable to general multiscale flows that may not be considered as turbulent in the traditional sense.
We focused on the role of two flux terms responsible for KE transfer across scales. One of these, baropycnal work  $\varLambda _\ell$, has been often neglected in LES modelling and lumped with pressure dilatation. Aluie (Reference Aluie2011, Reference Aluie2013) had identified
 $\varLambda _\ell$ as being essential in the transfer of energy across scales in VD flows such as RT, arising from work done by large-scale pressure gradients on small scales of density and velocity. Here, we have presented a first analysis of
 $\varLambda _\ell$ in RT flows and found that it acts as a conduit for PE, transferring energy non-locally from the largest scales to smaller scales in the inertial range where the other flux term,
 $\varPi _\ell$, takes over the cascade process.
Unlike  $\varLambda _\ell$, which is inherently due to variations in density, deformation work,
 $\varPi _\ell$, also arises in constant-density flows and may be thought of as representing the process of vortex stretching in three dimensions, or of vortex mergers in two dimensions. In 3-D RT, we have shown how
 $\varPi _\ell$ takes the energy delivered by
 $\varLambda _\ell$ at inertial scales
 $\ell$ and transfers it via a persistent cascade to smaller scales, until it is dissipated at the viscous scales. On the other hand, we have shown how 2-D RT is fundamentally different from 3-D RT, since
 $\varPi _\ell$ rechannels the energy back to larger scales, driving a positive feedback loop that is absent in 3-D RT. In this feedback loop, the net upscale cascade leads to an enhanced growth of the mixing layer, which in turn leads to enhanced PE release by raising the light fluid and lowering the heavy fluid. The excess PE released results in enhanced baropycnal energy transfer by
 $\varLambda _\ell$ to smaller scales which is rechannelled back upscale by
 $\varPi _\ell$, closing the feedback loop. Despite higher bulk KE levels in two dimensions compared with three dimensions as a result of this feedback loop, small inertial scales are weaker than in three dimensions. Our findings also indicate the absence of a net upscale energy transfer in 3-D RT as is often claimed, and that growth of bubbles and spikes at the largest scales is solely due to baropycnal work
 $\varLambda _\ell$ in three dimensions.
Our scale analysis demonstrated the presence of an inertial range of scales in RT flows over which KE fluxes  $\varLambda _\ell$ and
 $\varPi _\ell$ are not directly influenced by either external inputs at the largest scales or by dissipation at the smallest scales. Our measurement of
 $\varLambda _\ell$ and
 $\varPi _\ell$ over this scale range revealed that they exhibit a self-similar evolution that is quadratic in time,
 $\sim t^{2}$, similar to the RT mixing layer.
It had been shown by many prior studies that the mixing layer width  $h=\alpha \mathcal {A} g t^{2}$ grows quadratically in time. It had also been often observed that the growth coefficient
 $\alpha$ is significantly larger in two dimensions than in three dimensions, despite the precise value of
 $\alpha$ still being an open problem. Our identification of the positive feedback loop in 2-D RT serves to explain this discrepancy as arising from the fundamentally different scale dynamics between two dimensions and three dimensions. The possibility of an upscale cascade had been suggested as a possible reason in prior work (Cabot Reference Cabot2006) but, to our knowledge, never demonstrated by an analysis of energy scale transfer in VD RT flows before now. We also showed that the net upscale cascade by
 $\varPi _\ell$ in two dimensions tends to isotropize the large-scale flow, in stark contrast to the high level of anisotropy in three dimensions at large scales. These differences in the fundamental flow processes highlight the stark disparity between the evolution of 2-D RT and 3-D RT, and pinpoint the potentially misleading physics when employing 2-D RT simulations to model real-world 3-D systems.
Supplementary material
Supplementary material is available at https://doi.org/10.1017/jfm.2021.902.
Acknowledgements
We thank X. Bian, E. Blackman and D. Livescu for valuable discussions. We also thank the anonymous reviewers for their time and valuable suggestions, which helped improve our manuscript.
Funding
This research was funded by DOE FES grants DE-SC0014318 and DE-SC0020229. Partial support from NNSA award DE-NA0003856 is acknowledged. H.A. was also supported by NASA grant 80NSSC18K0772, NSF grant PHY-2020249, DOE grant DE-SC0019329 and NNSA grant DE-NA0003914. Computing time was provided by the National Energy Research Scientific Computing Center (NERSC) under contract no. DE-AC02-05CH11231, and by an award from the INCITE program, using resources of the Argonne Leadership Computing Facility, which is a DOE Office of Science User Facility supported under Contract DE-AC02-06CH11357. We also acknowledge using data from the JHU Turbulence database (http://turbulence.pha.jhu.edu/).
Declaration of interests
The authors report no conflict of interest.
Appendix A. Effects of interface Mach number
To investigate the influence of interface Mach number (e.g. Wieland et al. Reference Wieland, Reckinger, Hamlington and Livescu2017) on our conclusions, we performed another 2-D RT simulation using  $1024\times 2048$ grid points, at a lower Mach number, which we name 2D1024lowM in table 1. To achieve this, we set the initial pressure at the bottom boundary to be 100, instead of 10 as in simulations 2D4096 and 3D1024, in order to lower the interface Mach number. The interface Mach number,
 $Ma = \sqrt {{g\lambda }/{\gamma R T_0}}$, is based on the ratio between characteristic gravity wave speed
 $\sqrt {g\lambda }$, where
 $\lambda =L_x$ is the width of the domain, and sound speed at the interface
 $\sqrt {\gamma R T_0}$, where
 $T_0$ is initial temperature at the interface, and
 $R$ is the specific gas constant (Reckinger et al. Reference Reckinger, Livescu and Vasilyev2016). The interface Mach number for simulations 2D4096 and 3D1024 in table 1 is 0.45, while in simulation 2D1024lowM, it is 0.13.
Results from run 2D1024lowM are similar to 2D4096, except for pressure dilatation as would be expected. Figure 15 shows the mixing width versus time, with growth rate  $\alpha =0.037$. Figure 16 shows the instantaneous and overall energy budget versus non-dimensional time. The major difference compared with 2D4096 is that pressure dilatation is greatly suppressed, and the cumulative change of IE
 $\delta (IE)$ plays a minor role in 2D1024lowM compared with 2D4096. This is consistent with physical expectations when reducing the compressibility of the RT flow by lowering its Mach number. Figure 17 plots the KE budget terms as a function of scale. All results are consistent with those in figure 7 from run 2D4096, except for the suppressed pressure dilatation. Finally, figure 18 shows that energy fluxes at low Mach number also exhibit a self-similar behaviour.
Similar to figure 3, the square root of mixing width  $\sqrt {h(t)}$ versus time for the simulation 2D1024lowM with low Mach number, and the plot corresponds to
 $\alpha =0.037$. The ‘+’ markers correspond to dimensionless time
 $\hat {t}=t/\sqrt {{L_x}/{\mathcal {A}g}}= 2, 3, 4$. The inset gives the compensated plot
 $\alpha = {h(t)}/{\mathcal {A}gt^{2}}$ versus time, in which the horizontal lines correspond to the
 $\alpha$ value obtained by linear fit.


Similar to figure 7, mean KE budget as a function of scale in two dimensions at dimensionless time  $\hat {t}=4.0$ for the simulation 2D1024lowM. The plot is normalized by
 $\langle \epsilon ^{{inj}} + P\boldsymbol {\nabla }\boldsymbol {\cdot } \boldsymbol {u}\rangle$, the available mean source of KE.

Similar to figure 11, where (a–c) show the temporal self-similarity of turbulent RT fluxes for the simulation 2D1024lowM. Panel (a) shows the length scale  $\ell _{\varPi, {peak}}$ associated with the peak of
 $\varPi$ versus dimensionless time
 $\hat {t}$. Panel (b) shows the rescaled
 $\langle \hat {\varPi }\rangle$ in (3.8). Panel (c) shows the rescaled
 $\langle \hat {\varLambda }\rangle$.

Appendix B. Comparison with two-species incompressible RT
Throughout the paper we use the single-species two-density model to describe RT flows, but there are other models commonly used in the literature. One notable example is the two-species incompressible model (Sandoval Reference Sandoval1995; Cook & Dimotakis Reference Cook and Dimotakis2001; Cabot et al. Reference Cabot, Schilling and Zhou2004; Livescu & Ristorcelli Reference Livescu and Ristorcelli2007, Reference Livescu and Ristorcelli2008). Here, we compare the energy budgets between the two-species model and our single-species two-density RT model to highlight similarities and differences.
Two-species incompressible RT falls into the category of VD flows, similar to the compressible model. Governing equations consist of transport equations for each of the two species of mass fraction  $Y_1$ and
 $Y_2$, and densities
 $\rho _1$ and
 $\rho _2$, respectively. Average density
 $\rho$ satisfies
 ${1}/{\rho }={Y_1}/{\rho _1}+{Y_2}/{\rho _2}$, where
 $Y_1+Y_2=1$. The dynamics reduces to (Sandoval Reference Sandoval1995; Cook & Dimotakis Reference Cook and Dimotakis2001; Livescu & Ristorcelli Reference Livescu and Ristorcelli2007)
 $$\begin{gather} \partial_t\rho + \partial_j (\rho u_j) = 0, \end{gather}$$
 $$\begin{gather}\partial_t(\rho u_i) + \partial_j (\rho u_i u_j) ={-}\partial_i P + \partial_j \sigma_{ij} + \rho g_i, \end{gather}$$
 $$\begin{gather}\partial_j u_j ={-}\partial_j(\mathcal{D}\partial_j \ln{\rho}). \end{gather}$$
Equation (B3) represents the non-zero velocity divergence due to the local change in volume when mixing incompressible fluids of different densities (e.g. Baltzer & Livescu Reference Baltzer and Livescu2020). Here  $\sigma _{ij}$ is viscous stress tensor as in the compressible equations, and
 $\mathcal {D}$ is the binary species diffusivity. The system described by (B1)–(B3) can be obtained (Livescu Reference Livescu2004) by taking the
 ${Ma}\to 0$ limit of the compressible equations (2.1)–(2.5).
Compared with (2.1)–(2.5) for compressible dynamics, a key difference is that the two-species model here does not account for IE and its coupling to the flow via pressure dilatation and viscous dissipation. In fact, the primary difference between these two models is a finite (single-species two-density model) versus a zero (two-species model) Mach number (Livescu Reference Livescu2004, Reference Livescu2020). If we decompose the pressure in (2.1)–(2.5) into a mean  $P_0$ and fluctuation
 $p'$,
 $P=P_0+p'$, and we take the limit
 $P_0 \to \infty$, then we approach the
 ${Ma}\to 0$ limit in the compressible model. Meanwhile, the mean of IE equation (2.4) in this infinite
 $P_0$ limit reduces to
 $\partial _j u_j = -\partial _j(\alpha \partial _j \ln {\rho })$, which is similar to (B3), except that mass diffusivity
 $\mathcal {D}$ in (B3) is replaced by thermal diffusivity
 $\alpha$ (Livescu Reference Livescu2013). Thermal diffusivity is defined as
 $\alpha = {\kappa }/{\rho c_p}$, where
 $\kappa$ is thermal conductivity and
 $c_p$ is the specific heat at constant pressure. Hence, in the
 ${Ma}\to 0$ limit, the two models are equivalent. Similar to the analysis we have done in § 3.1, by coarse graining the two-species dynamics, we obtain a large-scale KE budget of the same form as the filtered KE budget (3.1).
For a quantitative comparison, we download and analyse the homogeneous buoyancy driven RT data from the Johns Hopkins Turbulence Database (Livescu & Ristorcelli Reference Livescu and Ristorcelli2007; Li et al. Reference Li, Perlman, Wan, Yang, Meneveau, Burns, Chen, Szalay and Eyink2008). The database stores the output of an incompressible two-species RT simulation at a  $1024^{3}$ grid resolution. A total of 1015 snapshots are stored densely in time. Unlike our 3-D RT flow presented earlier, this flow is statistically homogeneous in all directions, with a triply periodic domain of equal dimensions,
 $L_x=L_y=L_z=2{\rm \pi}$. A spatially uniform pressure gradient is imposed externally and changes with the bulk mixing between species (Livescu & Ristorcelli Reference Livescu and Ristorcelli2007). The two species are initialized as random blobs, with a characteristic size
 $\approx 1/5$ of the domain. Flow is driven from rest due to buoyancy, eventually leading to turbulence. However, since the two fluids are miscible, PE is ultimately depleted as the fluids mix, leading to turbulence decay. The Atwood number is 0.05, which is close to the Boussinesq limit, but the velocity divergence is non-zero due to the diffusion between the two fluids (Livescu & Ristorcelli Reference Livescu and Ristorcelli2007; Li et al. Reference Li, Perlman, Wan, Yang, Meneveau, Burns, Chen, Szalay and Eyink2008). We download a snapshot at time
 $t=6.56$ when the Reynolds number
 $Re$ is maximum, and another at
 $t=14.56$ when the dissipation rate peaks.
We study the scale dynamics following our earlier analysis in §§ 3.2.3–3.2.4. Normalized KE budget terms are shown in figure 19, with a normalization factor  $\langle \epsilon ^{{inj}} + P\boldsymbol {\nabla }\boldsymbol {\cdot } \boldsymbol {u}\rangle$ at the corresponding time.
Kinetic energy processes as a function of scale from the homogeneous incompressible two-species RT data (Livescu & Ristorcelli Reference Livescu and Ristorcelli2007; Li et al. Reference Li, Perlman, Wan, Yang, Meneveau, Burns, Chen, Szalay and Eyink2008). Two different snapshots are analysed, (a) at time  $t=6.56$ when
 $Re$ is maximum, and (b) at time
 $t=14.56$ when dissipation is maximum. Filtering wavenumber
 $k_\ell =L_z/\ell$ is a proxy for length scale. Plots are normalized by
 $\langle \epsilon ^{{inj}} + P\boldsymbol {\nabla }\boldsymbol {\cdot } \boldsymbol {u}\rangle$ at the corresponding time. The legend is the same as in figures 7 and 8. Panel (a) is at the time of maximum
 $Re$ and (b) is at the time of maximum dissipation.

Figure 19(a) shows the result at early time  $t=6.56$ when the RT is still in the developing stage, which is qualitatively similar to our 3-D RT budgets in figure 8. Mean injection is constant in scale, and pressure dilatation saturates at small scales but with a slower convergence rate compared with our results using the compressible Navier–Stokes equations. Fluxes
 $\varPi$ and
 $\varLambda$ have a similar scale behaviour as in our 3-D RT case. Specifically, both are positive transferring energy to small scales, and
 $\varPi$ peaks at filtering wavenumber
 $k_\ell \approx 20$. During this developing stage of the flow, the forward cascade via
 $\varPi$ is arrested not by dissipation but by growth of KE at scales smaller than
 $\ell \approx L_z/20$. This can be seen from the plot of
 $\langle \partial _t \overline {\text {KE}}\rangle$, which keeps increasing as a function of
 $k_\ell$ until
 $k_\ell \approx 200$ (positive
 $k_\ell$-derivative indicates those scales are experiencing a net gain of KE). Dissipation at this time of the flow (figure 19a) is negligible.
At the later time when dissipation is maximum (figure 19b), we observe negative values of  $\langle \partial _t \overline {\text {KE}}\rangle$, indicating decaying turbulence at that time step. Available PE is close to being exhausted in this decaying phase of RT, so that the mean injection and
 $\varLambda$ become relatively small, while dissipation dominates all other terms. This stage of the homogeneous flow is never reached in our inhomogeneous RT simulations since the effects of walls becomes important at those times. Note in figure 19(b) that unlike the earlier time (figure 19a), the forward cascade via
 $\varPi$ operates across a much broader scale range and is arrested by viscous dissipation.
In summary, RT using the two-species incompressible model and RT using the single-species two-density model both belong to the category of VD flows, and exhibit scale processes in the KE evolution that are similar in many aspects.