Introduction
The life-history traits of extinct organisms are difficult to determine, but such traits may influence extinction selectivity. Across the Cretaceous/Paleogene (K/Pg) boundary, evidence supports selection by characteristics including geographic range (Jablonski and Hunt Reference Jablonski and Hunt2006; Payne and Finnegan Reference Payne and Finnegan2007; Landman et al. Reference Landman, Goolaerts, Jagt, Jagt-Yazykova, Machalski and Yacobucci2014), physiology (Knoll et al. Reference Knoll, Bambach, Payne, Pruss and Fischer2007), and larval ecology (Jablonski and Hunt Reference Jablonski and Hunt2006). Among the victims of the K/Pg extinction are the ammonites, and their early life history has been the subject of much interest (Ward and Bandel Reference Ward and Bandel1987; Ritterbush et al. Reference Ritterbush, Hoffmann, Lukeneder and De Baets2014; De Baets et al. Reference De Baets, Landman and Tanabe2015). The egg size and hatchling ecology of ammonites contrasts strongly with that of the co-occurring nautilids at the K/Pg boundary, a condition that was established and persisted since the Late Devonian (Wani Reference Wani2011; De Baets et al. Reference De Baets, Klug, Korn and Landman2012). Identifying the presence or absence of a planktic stage, defined here as shallow-water habitat and not explicitly passive floatation (i.e., not on bottom), in ammonites at the K/Pg is important, because that stage may have been vulnerable during ocean acidification (Arkhipkin and Laptikhovsky Reference Arkhipkin and Laptikhovsky2012).
No general consensus exists about the development depth or habitat of ammonite eggs (Ritterbush et al. Reference Ritterbush, Hoffmann, Lukeneder and De Baets2014; De Baets et al. Reference De Baets, Landman and Tanabe2015). Some authors have proposed ovoviviparity or brooding (Ward and Bandel Reference Ward and Bandel1987; Jacobs and Chamberlain Reference Jacobs and Chamberlain1996), based on the preservation of eggs within adult body chambers (Mironenko and Rogov Reference Mironenko and Rogov2015) or modification to the adult body chamber that could contain eggs (Landman Reference Landman1987). Others have suggested independently floating egg masses because of preservation in association with planktic gastropods and rare benthic organisms (Mapes and Nützel Reference Mapes and Nützel2009) or egg masses attached to floating debris (Westermann Reference Westermann1996). Putative ammonite eggs from the Jurassic have been inferred to suggest benthic deposition (Etches et al. Reference Etches, Clarke and Callomon2009). In modern octopods, adult depth habitat and hatching living depth are not predictable from egg size (Boletzky Reference Boletzky1978), so it seems unlikely that all ammonites had a similar egg development pathway (De Baets et al. Reference De Baets, Landman and Tanabe2015).
Many ammonite hatchlings were likely planktic (i.e., free floating, poorly swimming, shallow-water dwelling; Ritterbush et al. Reference Ritterbush, Hoffmann, Lukeneder and De Baets2014; De Baets et al. Reference De Baets, Landman and Tanabe2015); however, some authors suggested sessile benthic or suspended sessile lifestyles (Stinnesbeck et al. Reference Stinnesbeck, Frey and Zell2016). Several lines of indirect evidence suggest that hatchling ammonites could be planktic. Their small size, generally between 0.5 and 1 mm, suggests a planktic stage due to similar sizes in modern planktic cephalopods (Landman Reference Landman1987; Wani Reference Wani2011). However, because there are no closely related modern analogues for ammonite ecology, it is possible that hatchling size and ecology in ammonites had a different relationship than in modern coleoids (Jacobs and Landman Reference Jacobs and Landman1993; Kröger et al. Reference Kröger, Vinther and Fuchs2011). Other authors have suggested that accumulations of newly hatched ammonites in facies that suggest anoxic bottom waters where eggs could not survive point to planktic hatchlings (Mapes and Nützel Reference Mapes and Nützel2009; De Baets et al. Reference De Baets, Klug, Korn and Landman2012). Shells might have been transported into locations with anoxic bottom waters, or intermittent anoxia could have produced similar patterns (Stephen et al. Reference Stephen, Bylund, Garcia, McShinsky and Carter2012). Buoyancy calculations from shells suggest neutral to positive buoyancy at hatching (Shigeta Reference Shigeta1993; Westermann Reference Westermann1996; Lemanis et al. Reference Lemanis, Zachow, Fusseis and Hoffmann2015). To calculate buoyancy, soft tissue density and morphology must be assumed, because ammonite soft tissue has minimal preservation (Klug et al. Reference Klug, Riegraf and Lehmann2012), potentially due to a persistent preservation bias caused by ammonia in the soft tissues (Clements et al. Reference Clements, Colleary, De Baets and Vinther2017).
If some or all ammonite hatchlings and eggs were planktic, then there must have been a transition to a demersal mode of life in at least some groups. The comparison of stable isotope ratios in ammonites to co-occurring sessile benthic organisms suggests some adults were demersal, free-swimming near the seafloor (Moriya et al. Reference Moriya, Nishi, Kawahata, Tanabe and Takayanagi2003; Moriya Reference Moriya2015; Sessa et al. Reference Sessa, Larina, Knoll, Garb, Cochran, Huber, MacLeod and Landman2015). Fully mature adult scaphites were likely demersal, a conclusion supported by considerations from shell geometry and stable isotope evidence (Landman et al. Reference Landman, Cobban and Larson2012a; Sessa et al. Reference Sessa, Larina, Knoll, Garb, Cochran, Huber, MacLeod and Landman2015). The neanoconch stage is proposed to be the transition between the planktic and demersal modes. This stage is thought to occur at a diameter of 3–5 mm and is expressed by minor changes in shell morphology and the appearance of ornamentation (Landman Reference Landman1987; Westermann Reference Westermann1996).
Habitat change can be interpreted from the isotopic expression of environmental gradients recorded in the shells of organisms that lived in the same environment or passed through it. In a stratified water mass, the thermocline and the biological pump influence δ18O and δ13C, respectively. The biological pump refers to the process of photosynthesis preferentially removing low-δ13C organic matter from the surface water and then degradation of that organic matter in the bottom waters that releases low-δ13C carbon (e.g., Kroopnick et al. Reference Kroopnick, Weiss and Craig1972; Hain et al. Reference Hain, Sigman and Haug2014). Ammonites are thought to precipitate their shell in oxygen isotopic equilibrium with seawater in analogy with modern Nautilus (Cochran et al. Reference Cochran, Landman, Turekian, Michard and Schrag2003; Moriya et al. Reference Moriya, Nishi, Kawahata, Tanabe and Takayanagi2003; Zakharov et al. Reference Zakharov, Shigeta, Smyshlyaeva, Popov and Ignatiev2006; Lukeneder et al. Reference Lukeneder, Harzhauser, Müllegger and Piller2010; Kruta et al. Reference Kruta, Landman and Cochran2014; Stevens et al. Reference Stevens, Mutterlose and Wiedenroth2015; Linzmeier et al. Reference Linzmeier, Kozdon, Peters and Valley2016). Habitat change through ontogeny has been inferred from serial δ18O aragonite (δ18Oarag) sampling of the septa and shell wall in larger specimens (Fatherree et al. Reference Fatherree, Harries and Quinn1998; Lukeneder et al. Reference Lukeneder, Harzhauser, Müllegger and Piller2010; Zakharov et al. Reference Zakharov, Shigeta, Popov, Velivetskaya and Afanasyeva2011; Lukeneder Reference Lukeneder2015; Stevens et al. Reference Stevens, Mutterlose and Wiedenroth2015). However, sample mass requirements of micromill-sampled traditional phosphoric acid isotope analyses have prevented analysis of the earliest whorls of ammonite shells, where the shell wall is <50 µm thick. Sampling ~10-µm-diameter spots for δ18O and ~7-µm-diameter spots for δ13C is possible by using secondary ion mass spectrometry (SIMS) and allows in situ analysis of volumes many orders of magnitude smaller than traditional techniques.
In this study, we compare high-spatial-resolution, high-analytical-precision stable isotope sampling of well-preserved ammonites and co-occurring bivalves and surrounding diagenetic calcite from the upper Maastrichtian of the U.S. Western Interior to determine the habitat in which the eggs and hatchlings developed. We show how these results contrast with previously published data on habitat change of newly hatched nautilids and broadly discuss the implications of our data for understanding the dynamic epeiric seaway paleoenvironment and the K/Pg extinction.
Geologic Background
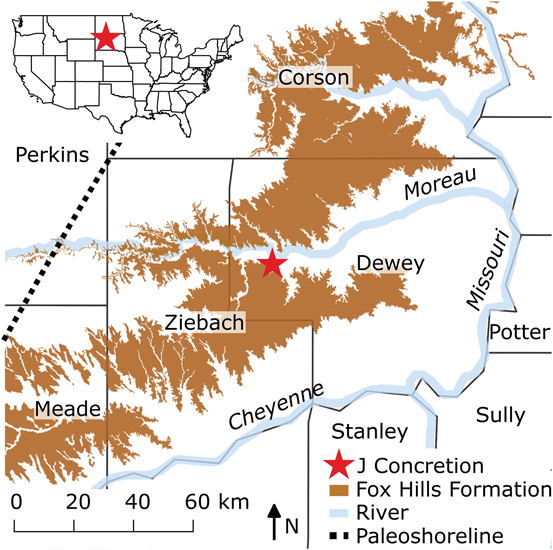
The specimens used in this study are attributed to the late Maastrichtian ammonite Hoploscaphites comprimus. They were collected from the Upper Cretaceous (upper Maastrichtian) Fox Hills Formation of south-central South Dakota (Fig. 1) and are housed at the American Museum of Natural History in New York City (sample number=AMNH number: J-125=85630, J-145=85629, J-209=85613, J-215=85632, J-273=75647). The Fox Hills Formation constitutes the marginal marine phase of a progradational sequence deposited during the final retreat of the Western Interior Seaway (WIS). At its maximum extent, this seaway extended from the western Canadian Arctic to the proto-Gulf of Mexico (Gill and Cobban Reference Gill and Cobban1966). In the early part of the late Maastrichtian, the shoreline of the WIS cut across the western half of South Dakota and formed a broad delta (the Sheridan Delta) at the southeastern corner of Montana and the northeastern corner of Wyoming (Cobban et al. Reference Cobban, Merewether, Fouch and Obradovich1994; Landman et al. Reference Landman, Remin, Garb and Chamberlain2013). The exact temperature, magnitude, and seasonal duration of stratification in the WIS is unknown (Kump and Slingerland Reference Kump and Slingerland1999; Petersen et al. Reference Petersen, Tabor, Lohmann, Poulsen, Meyer, Carpenter, Erickson, Matsunaga, Smith and Sheldon2016). However, stable isotope evidence from biogenic carbonates suggests that water-column stratification occurred at least episodically (Tsujita and Westermann Reference Tsujita and Westermann1998; Fisher and Arthur Reference Fisher and Arthur2002; Petersen et al. Reference Petersen, Tabor, Lohmann, Poulsen, Meyer, Carpenter, Erickson, Matsunaga, Smith and Sheldon2016).
Map showing the location of the J concretion (red star) and outcrop of the Fox Hills Formation (brown) in north-central South Dakota superimposed over county boundaries. Hoploscaphites comprimus are distributed throughout the map area. The map of the Fox Hills Formation is from the Macrostratigraphy Database (Peters et al. Reference Peters, Husson and Czaplewski2018). The paleoshoreline is from Landman et al. (Reference Landman, Remin, Garb and Chamberlain2013).

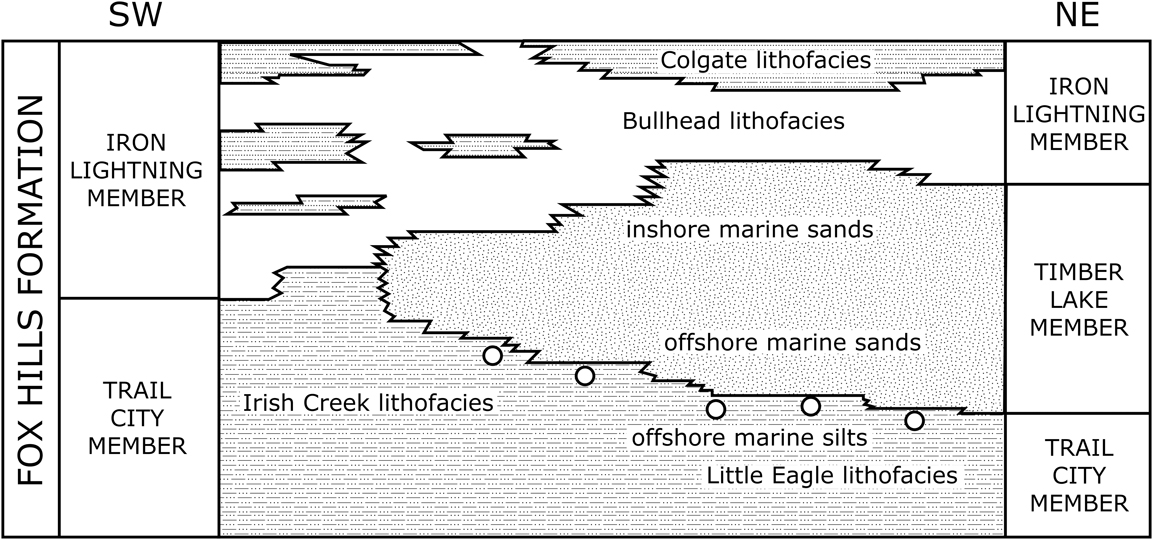
To limit confounding factors of long-term climate change on the interpretation of the oxygen isotope results, we focused on five specimens from a single concretion. The ammonites are from the so-called abyssinus or transition concretions at the contact between the underlying Trail City Member and the overlying Timber Lake Member of the Fox Hills Formation (Landman and Waage Reference Landman and Waage1993; Fig. 2). These concretions occur in or just below the Sphenodiscus Layer. The locality is in the southwest-facing exposures on the ridge extending northwest from bluffs on the Timber Lake Member, about 4 km west-southwest of Green Grass (Fig. 1; NE1/4SE1/4 sec. 21, T. 14N., R. 23E., Lantry NE quadrangle, Dewey County, SD, 45.16041°N, 101.306°W). This locality was positioned approximately 75 km east of the paleoshoreline, but the exact position relative to the coast is difficult to pinpoint, and the coast itself likely consisted of extensive wetlands and many embayments (Landman et al. Reference Landman, Remin, Garb and Chamberlain2013). These concretions contain abundant juvenile ammonites and plant material. They are interpreted to have been deposited on the lower shore face or transition zone (Landman and Waage Reference Landman and Waage1993).
Stratigraphic overview of the Fox Hills Formation indicating the position of the transition concretions (circles), Dewey County, SD. Modified from Landman and Waage (Reference Landman and Waage1993). The concretions occur near the boundary between offshore silts and sands during regression and are likely time transgressive.

Material
The transition concretions contain many small juvenile ammonites. These specimens are assigned with confidence to H. comprimus based on several criteria. Even though they are juveniles, they are identical in terms of their shell shape and ornamentation to the early whorls of this species. Landman and Waage (Reference Landman and Waage1993: Fig. 81) dissected adults of H. comprimus to reveal the change in characters through ontogeny. The juvenile shell bears fine growth lines that parallel the ornamentation. Ribs first appear at approximately 4–5 mm in shell diameter and cross the venter with a marked forward projection. Primary ribs are straight to slightly sinuous and rectiradiate to prorsiradiate. Specimens of H. comprimus are consistently more compressed through ontogeny than those of the biostratigraphically older species Hoploscaphites nicolletii. In addition to the similarity of the morphology between the juveniles that are present in the concretion and the dissected early whorls of H. comprimus, the few adult ammonites that occur in these concretions also belong to the same species. We analyzed five juveniles (informal numbers: J-125, J-145, J-209, J-215, and J-273) that we attribute to H. comprimus.
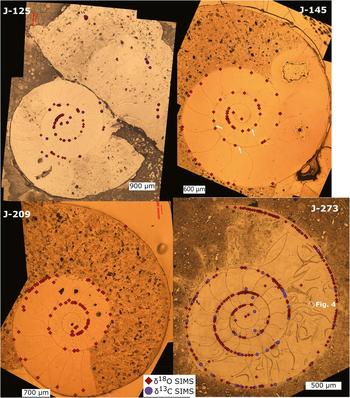
All of the individuals sampled in this study consist of the phragmocone filled with calcite and part of the body chamber filled with detrital sediment (Figs. 3–5). They are 2.9–7.8 mm in diameter (1.7–4.9 mm in phragmocone diameter), with a little more than two whorls of growth beyond the primary constriction (Figs. 3, 5A). The angle of the body chamber ranges from 178 to 230°. J-125 is 6.5 mm in diameter and is wholly septate. We used SIMS to analyze fragments of three specimens of bivalves with calcitic shells and the diagenetic calcite spar infilling the ammonite chambers (Fig. 6). Bivalves are benthic mollusks that have either an epifaunal or infaunal mode of life and therefore record the temperature and water conditions on or in the upper few centimeters of the sediment. Diagenetic calcite preserves pore-fluid conditions during precipitation. Two additional whole bivalves were sampled by micromill (Fig. 6). The whole bivalves are Protocardia, but the fragments, analyzed by SIMS, are unidentifiable, probably either Protocardia or Tenuipteria, as whole individuals of these genera are also present in the J concretion (Speden Reference Speden1970). Because these fragments appear to be from different species and still exhibit similar δ18O values, strong vital effects seem unlikely. Although the bivalves and the ammonites sampled here may not have lived in the exact same environment, bivalve results may record regional seawater characteristics (Sessa et al. Reference Sessa, Ivany, Schlossnagle, Samson and Schellenberg2012).
Distribution of δ18O and δ13C secondary ion mass spectrometry (SIMS) pits on cross sections of Hoploscaphites comprimus. Reflected light image of gold-coated samples with the position, but not size, of δ18O pits indicated by diamonds and δ13C by circles. Three anomalous posthatching varixes are highlighted with white arrows on the image of J-145. Early diagenetic calcite fills the chambers at the center of each image. Sediment infills later chambers and surrounds the shells. Septa in later whorls of J-273 are broken and sometimes wedged apart by the diagenetic calcite (white outlined area, Fig. 4).

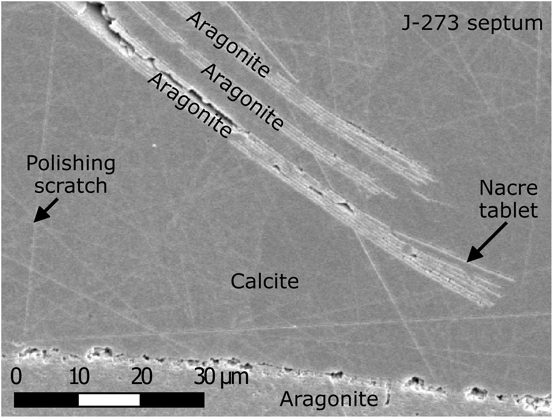
Calcite wedging apart and surrounding nacreous aragonite. The pictured broken septum is from a later whorl of J-273 and is surrounded by diagenetic calcite. Individual layers of nacreous aragonite are split from one another and surrounded by calcite.

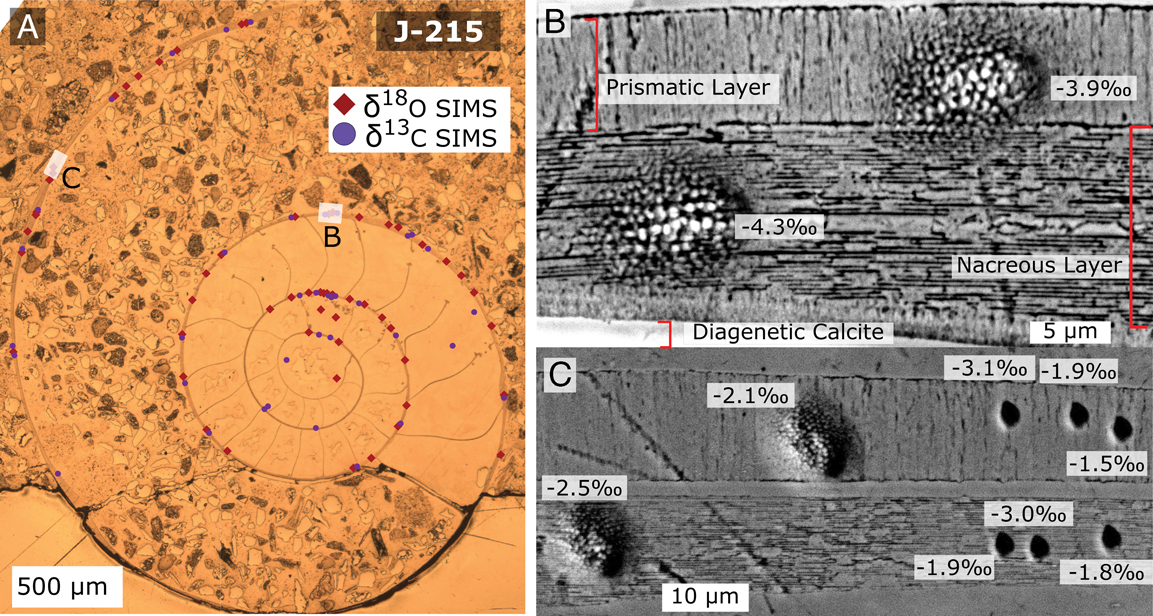
Distribution of δ18O secondary ion mass spectrometry (SIMS) pits on a cross section of Hoploscaphites comprimus (J-215) and SEM images of analyzed pits and shell microstructure. A, Reflected light image of gold-coated sample with the position, but not size, of δ18O (diamonds) and δ13C (circles) pits on the ammonite shell. B, SEM image of two ~10 µm SIMS pits in the outer prismatic layer and nacreous layer of the shell. The δ18O values are similar between the two domains given instrumental precision of ±0.3‰ for large pit analyses. C, A comparison of δ18O measured in the outer prismatic layer and inner nacreous layer with small pit (~3 µm) and large pit (~10 µm) analyses. The δ18O values of these microstructures are indistinguishable given instrumental precision (3 µm, ±0.7‰; 10 µm, ±0.3‰).

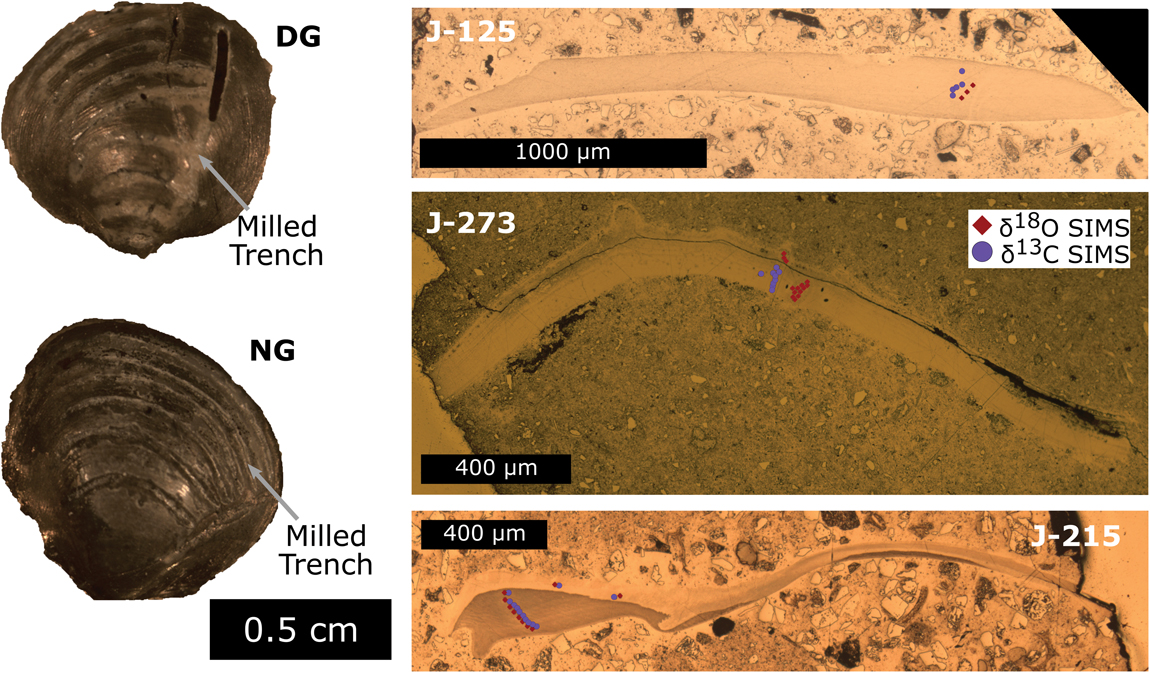
Images of bivalves sampled by milling (DG and NG) and samples measured by secondary ion mass spectrometry (SIMS) (J-125, J-273, and J-215). Trenches from handheld drill are visible in the images of NG and DG bivalves. NG and DG are Protocardia. SIMS analysis pits are highlighted by circles (δ13C) and diamonds (δ18O).

Terminology
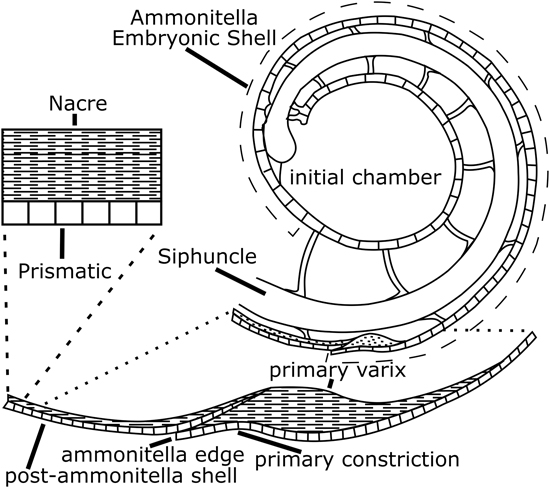
Embryonic scaphite shells are composed of aragonite and consist of the protoconch and approximately two-thirds of the first whorl (Fig. 7). Collectively the embryonic shell is known as the ammonitella. The embryonic shell terminates in the primary constriction and associated varix and is approximately 700 µm in diameter (Landman et al. Reference Landman, Tanabe and Shigeta1996). The outer shell wall of the embryonic shell is prismatic, except for the primary varix, which is nacreous (Landman et al. Reference Landman, Tanabe and Shigeta1996). The outer shell wall of the postembryonic shell consists of an outer prismatic and inner nacreous layer. The boundary between the two layers, an organic-rich membrane may be phosphatized (Tanabe et al. Reference Tanabe, Landman and Kruta2012).
Diagram of the exterior and cross section of the early whorls of an ammonite, modified from (Landman et al. Reference Landman, Tanabe and Shigeta1996). Ammonitella (embryonic shell) comprises the initial chamber and shell wall up to the primary constriction. This portion of the shell has a prismatic microstructure. The primary varix consists of nacre and is hypothesized to have precipitated at or close to hatching (Landman et al. Reference Landman, Tanabe and Shigeta1996). All shell precipitated after the primary varix comprises a thin outer prismatic layer and a thicker nacreous layer (Kulicki Reference Kulicki1996). Septa are thought to precipitate in the ammonitella later, after hatching, as additional shell grows (Landman et al. Reference Landman, Tanabe and Shigeta1996).

Methods
Samples were mechanically removed from the J concretion, mounted in epoxy (Buehler EpoKwik), and then subsequently ground to the medial plane. Excess initial epoxy was cut away, and later shells were recast in Buehler epoxide resin QT and epoxide hardener (6:1 epoxy to hardener by mass) with calcite standard UWC-3 (δ18O=12.49‰, Vienna Standard Mean Ocean Water [VSMOW] or −17.87‰ Vienna Pee Dee Belemnite [VPDB]; δ13C=−0.91‰ [VPDB] Kozdon et al. Reference Kozdon, Ushikubo, Kita, Spicuzza and Valley2009). Samples were ground and polished to eliminate surface relief to minimize variability of instrumental bias and enhance reproducibility (Kita et al. Reference Kita, Ushikubo, Fu and Valley2009).
We assessed diagenesis of the shell by scanning electron microscopy (SEM) using energy-dispersive spectroscopy (EDS), scanning electron (SE), backscattered-electron (BSE) imaging, and electron backscatter diffraction (EBSD) detectors. EBSD was used to determine mineralogy as an additional test for diagenesis, because aragonite readily alters to calcite (Cusack et al. Reference Cusack, England, Dalbeck, Tudhope, Fallick and Allison2008). The outer shell was confirmed to be aragonite. BSE imaging revealed the nacreous and prismatic microstructure, indicating the original shell preservation (Fig. 5B, C; Cochran et al. Reference Cochran, Landman, Turekian, Michard and Schrag2003). Within instrumental detection limits (20 s live time, 15 kV), EDS indicated that minor element composition was different enough between materials sampled by SIMS to induce different instrumental mass fractionation between the diagenetic calcite and bivalve calcite (UWC-3 calcite standard element wt%: Mn ~0.1, Mg ~0.5, Fe ~0.4 [Kozdon et al. Reference Kozdon, Ushikubo, Kita, Spicuzza and Valley2009]; ammonite wt%: Mn ~0.5, Mg ~0.1, Fe 0.0; bivalve calcite wt%: Mn ~0.0, Mg ~0.1, Fe ~0.4; diagenetic calcite wt%: Mn ~3.2, Mg ~1.8, Fe ~1.4). This could adjust the δ18O of diagenetic calcite by approximately −1.7‰ and would align our measured values with the bivalve calcite but would not alter our interpretations of the measurements in the ammonites. Locations for SIMS analysis on the ammonite shells were selected based on shell preservation and amount of change in δ18O from adjacent pits during the analysis session.
SIMS Analysis
Oxygen and carbon isotope analyses were performed using a CAMECA IMS-1280 ion microprobe at WiscSIMS (Wisconsin Secondary Ion Mass Spectrometer Laboratory), University of Wisconsin−Madison (Kita et al. Reference Kita, Ushikubo, Fu and Valley2009; Valley and Kita Reference Valley and Kita2009). After analysis, the sample surface was reimaged, and both images and SIMS pit data were combined in QGIS following the procedures outlined in Linzmeier et al. (Reference Linzmeier, Kitajima, Denny and Cammack2018). Most δ18O analyses were from spots 10 μm in diameter (samples n=475, standards n=235); additional analyses with 3 μm spots (samples n=41, standards n=52; Fig. 5C) were performed to sample either the prismatic or nacreous layers in locations where larger spots could not cleanly sample only one layer. Spot size can vary by 10%. Most 10 μm analyses are of the outer shell (n=418), including 158 analyses that are clearly placed in the nacreous layer, 68 spots that are clearly positioned in the prismatic layer, and multiple mixed measurements (n=83), but several analyses are of the later septa (n=9). Some analyses minimally intersected diagenetic calcite and are placed either in the nacreous layer (n=31), the prismatic layer (n=30), or both (n=48). Carbon isotope analyses were done with a 7 μm beam diameter (samples n=154, standards n=92). Raw and instrumental mass fractionation–corrected oxygen and carbon isotope ratios measured on the five ammonite specimens (J-125, J-145, J-209, J-215, and J-273) are available in separate supplementary data tables (Supplementary Material SI 6 and SI 7). A series of reflected light maps and SEM images of pits are also included in the Supplementary Material (SI 1–SI 5).
Four analyses of the UWC-3 standard were made before and after each set of 10–15 sample measurements. At the start of each session, the instrumental bias between calcite and aragonite was calibrated with analysis of UWArg-7, aragonite standard (δ18O=19.73‰, VSMOW, δ13C 5.99‰; Orland Reference Orland2012; Linzmeier et al. Reference Linzmeier, Kozdon, Peters and Valley2016). Standards bracketing analyses on samples were used to calculate the instrumental bias in order to correct measured δ18O and δ13C values to the VPDB scale (Kita et al. Reference Kita, Ushikubo, Fu and Valley2009) and to evaluate the external reproducibility of the measurements. For all analyses, either 16O1H or 13C1H was measured simultaneously with the stable isotope ratio, and 16O1H/16O (OH/O hereafter) or 13C1H/13C (CH/C) are interpreted to track intrasample organic or water components (Linzmeier et al. Reference Linzmeier, Kozdon, Peters and Valley2016). The spot-to-spot reproducibility or external precision of each set of bracketing standards for δ18O averaged ~0.3‰ (2 SD) for 10 μm spots, ~0.8‰ (2 SD) for 3 μm spots, and ~0.7‰ (2 SD) for δ13C analyses. Detailed descriptions of the analytical conditions and the instrument setup have been published previously (Orland et al. Reference Orland, Bar-Matthews, Kita, Ayalon, Matthews and Valley2009; Kozdon et al. Reference Kozdon, Kelly, Kitajima, Strickland, Fournelle and Valley2013; Vetter et al. Reference Vetter, Kozdon, Valley, Mora and Spero2014; Linzmeier et al. Reference Linzmeier, Kozdon, Peters and Valley2016; Śliwiński et al. Reference Śliwiński, Kitajima, Kozdon, Spicuzza, Fournelle, Denny and Valley2016a, Reference Śliwiński, Kitajima, Kozdon, Spicuzza, Fournelle, Denny and Valleyb). SIMS spots were initially selected based on reflected light, SE, and BSE images taken before analysis. After analysis, spots were classified based on the material sampled by each pit as identified in SE images. Pits including even a minor amount of diagenetic calcite were conservatively classed as including diagenetic calcite. During analysis, if an area showed detectable change between two points, additional pits were placed between them. Exclusion of pits based on low ion yield, high OH/O, high CH/C, or intersection with diagenetic calcite does not change our conclusions.
Some disagreement in oxygen isotope values between SIMS and the phosphoric acid digestion technique has been observed in Recent (<100,000 yr) biogenic calcite and speleothems (Rollion-Bard et al. Reference Rollion-Bard, Mangin and Champenois2007; Aubert et al. Reference Aubert, Williams, Boljkovac, Moffat, Moncel, Dufour and Grün2012; Orland et al. Reference Orland, Edwards, Cheng, Kozdon, Cross and Valley2015a, Reference Orland, Kozdon, Linzmeier, Wycech, Śliwiński, Kitajima, Kita and Valleyb; Wycech et al. Reference Wycech, Kelly, Kozdon, Orland, Spero and Valley2018). Oxygen isotope ratios measured by the phosphoric acid digestion technique also may vary with pretreatment (Wierzbowski Reference Wierzbowski2007; Tobin et al. Reference Tobin, Schauer and Lewarch2011). The magnitude of the offset is systematic for similar samples and OH/O; we observe the offset to be constant and lower for older samples (Orland et al. Reference Orland, Kozdon, Linzmeier, Wycech, Śliwiński, Kitajima, Kita and Valley2015b). Thus, because our samples are Cretaceous in age and the patterns and ranges of values within samples are critical to interpreting life history, a systematic offset would not affect the δ18O proxy for relative position in the water column. Unless an instrumental offset exists that is different between the bivalves and ammonites, our interpretations of relative position in the water column should be robust; however, absolute temperature estimates may be biased toward warmer values.
Micromilling and Bulk Isotope Analysis
Two whole bivalves were serially sampled using a dental burr made of carbide in a handheld microdrill to complement the data sets collected on bivalve fragments by SIMS (Fig. 6). Shallow trenches were made in the shell parallel to growth banding (Fig. 6). Powdered shell was then sent to Isolab at the University of Washington, where δ13C and δ18O of carbonate were measured using a Finnigan Delta Plus mass spectrometer with attached Kiel III Carbonate Device (SI 8). Carbonate was reacted with five drops of phosphoric acid at 70°C for 10 minutes. Measured values were converted to the VPDB scale by standardization with calcite reference materials (NBS 18 and NBS 19) and using the calcite acid fractionation factor published by Kim et al. (Reference Kim, Mucci and Taylor2007a). External precision of analyses were 0.07‰ (2 SD) for δ18O and 0.16‰ (2 SD) for δ13C.
Calculated Aragonite Comparison
Comparing isotope ratios measured in calcite to those measured in aragonite across both methods requires an adjustment to account for the difference in isotope ratio between the minerals during equilibrium preciptiation. The adjustment to calculated aragonite from measured calcite isotope ratios was performed using fractionations from Romanek et al. (Reference Romanek, Grossman and Morse1992; +1.7‰ Δ13Caragonite-calcite from 0°C to 40°C) and Kim et al. (Reference Kim, O’Neil, Hillaire-Marcel and Mucci2007b; +0.8‰ Δ18Oaragonite-calcite at 25°C). For simplicity of comparison between mineral phases, all δ13C and δ18O ratios from calcite (bivalve and diagenetic calcite) are reported as the calculated value of equilibrated aragonite (δ18OAragCal and δ13CAragCal). Raw and corrected data are included in supplementary tables (Supplementary Material SI 6 and SI7).
Oxygen Isotope Temperature Calculation
Temperatures are calculated from measured δ18O values assuming equilibrium precipitation with seawater. The aragonite–temperature equation of Kim et al. (Reference Kim, O’Neil, Hillaire-Marcel and Mucci2007b) is used because of a wider temperature calibration (0°C – 40°C) of laboratory-precipitated inorganic aragonite compared with that of the commonly used calibration of Grossman and Ku (Reference Grossman and Ku1986; 2.6°C – 22.0°C), which was determined using wild-collected aragonitic gastropod and scaphopod mollusks. Grossman and Ku (Reference Grossman and Ku1986) and other biogenic aragonite–derived temperature equations are statistically indistinguishable from the calibration of Kim et al. (Reference Kim, O’Neil, Hillaire-Marcel and Mucci2007b). The Kim et al. (Reference Kim, O’Neil, Hillaire-Marcel and Mucci2007b) equation is as follows:
 $$\eqalignno{1000ln{\rm \alpha }_{{{\rm aragonite}{\minus}{\rm water}}} &{\equals}\cr & \hskip-45pt 17.88\,\pm\,0.13\left( {{{10^{3} } \over T}} \right) {\minus}31.14\,\pm\,0.46$$
We solve for temperatures assuming δ18Owater=−1.0‰, −2.0‰, and −3.0‰ (VSMOW) because of the likely influence of brackish water on this environment (Dennis et al. Reference Dennis, Cochran, Landman and Schrag2013; Petersen et al. Reference Petersen, Tabor, Lohmann, Poulsen, Meyer, Carpenter, Erickson, Matsunaga, Smith and Sheldon2016; Whitney et al. Reference Whitney, Wanamaker, Kreutz and Introne2017).
Data Analysis
Calculation of postembryonic growth in whorl number (degrees) for each specimen was done in R (R Core Team 2017). A center point for each ammonite shell was determined, and the angle between lines to the center of the shell was calculated. Change-point analysis was done to identify the locations of stepwise change in mean δ18O and δ13C values across the ammonite shells using a cpt.mean without penalty within the ‘changepoint’ package for R (Killick and Eckley Reference Killick and Eckley2014). An analysis of variance (ANOVA) hypothesis test was done using aov in R to determine whether the mean δ18O was equal across embryonic whorls, the varix, and the first two postvarix whorls. Pairwise contrasts for the equality of means were done for these groups using Tukey’s honestly significant differences function tukeyHSD that corrects for increased likelihood of rejecting the null hypothesis of no difference between groups. Tables of results for contrasts are included in the Supplementary Material (SI 11).
Results
Transition Concretions
The carbonate-cemented concretion in which the ammonites occur is small, approximately 40 cm in diameter, and contains small protobranch bivalves, abundant plant fragments (nuts), abundant juvenile scaphites, ammonite jaws, ammonite hooklike structures, and rare adult scaphites (microconchs of H. comprimus and H. nicolletii). Both ammonite jaws and hooklike structures have not been found in body chambers. The concretion contains approximately 326 juvenile specimens of H. comprimus. A histogram of the juvenile specimens reveals a mode between 4 and 6 mm (Fig. 8). The body chambers of the juveniles are commonly broken, although some attain a body chamber length of 270°. The concretion used in this study is similar to three other concretions analyzed from the same horizon that also contain an unusual abundance of juveniles and differs from other concretions in the Trail City Member (Fig. 8; Landman et al. Reference Landman, Klofak and Sarg2008).
Histogram showing the size distribution of scaphite ammonites in 4 abyssinus or transition concretions from the transition zone between the Trail City Member and Timber Lake Member and 16 additional concretions from the Trail City Member in the Fox Hills Formation, Dewey County, SD (data from Landman et al. Reference Landman, Klofak and Sarg2008). The J concretion that contains the individuals sampled in this study has a similar distribution of sizes to other transition concretions (A, B, and C). The diameters of the five Hoploscaphites comprimus analyzed in this study range from 2.9 to 7.8 mm, encompassing the mean and modal diameter of juveniles from these concretions. Trail City ammonite diameters are from concretions of the Limopsis-Gervillia Assemblage Zone and are much larger and contain no juveniles (Landman et al. Reference Landman, Klofak and Sarg2008).

Shell Morphology
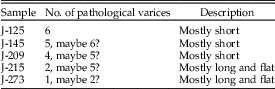
Several of the specimens exhibit varices or shell thickenings that are irregularly spaced (Table 1, Figs. 3, 5 A). Some varices are associated with pockets of pyrite either inside them or inside the adjacent chamber. Varices have not been documented before in Hoploscaphites. The presence of regularly spaced varices is diagnostic of the genus Desmoscaphites (Landman and Cobban Reference Landman and Cobban2007). Because the varices observed in these Hoploscaphites are irregularly spaced, they may be pathological and may have formed in response to an irritant or parasite (De Baets et al. Reference De Baets, Klug and Korn2011).
Count of varices in five specimens of Hoploscaphites comprimus, J concretion, Fox Hills Formation, Dewey County, SD.

Oxygen Isotopes
Oxygen isotope ratios were sampled from diagenetic calcite, calcitic bivalves, and aragonitic ammonites (Fig. 9). Within diagenetic calcite in ammonite mounts, no major differences were observed in the δ18O values. Differences of up to ~2‰ are detectable between ammonite mounts J-125 and J-273, and they bracket the range of values measured across all samples. The δ18OAragCal values of diagenetic calcite for all mounts average −0.6‰.
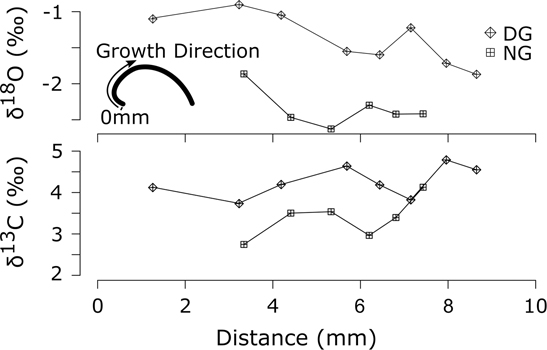
Oxygen and carbon isotope values (VPDB) from two micromilled Protocardia bivalves (DG and NG). Simple diagram inset shows the growth direction away from the umbo of the bivalves and orienting the zero position of the growth distance axis. Line plots showing the δ18OAragCal and δ13CAragCal of micromilled calcite from each bivalve. Partial sinusoids may indicate some seasonal variability. The range between individuals may indicate transport from nearshore. Analysis precision is 0.07‰ (2 SD) for δ18O and 0.16‰ (2 SD) for δ13C.

All bivalves have similar δ18O values. The δ18OAragCal measured by SIMS average −2‰ (VPDB). The average values for each bivalve by SIMS are −2.4‰ for J-273, −1.7‰ for J-215, and −2.1‰ for J-125. Average δ18OAragCal values for the two bivalves that were micromilled (DG and NG; Figs. 6, 9) are −1.5‰ and −2.4‰, respectively (VPDB).
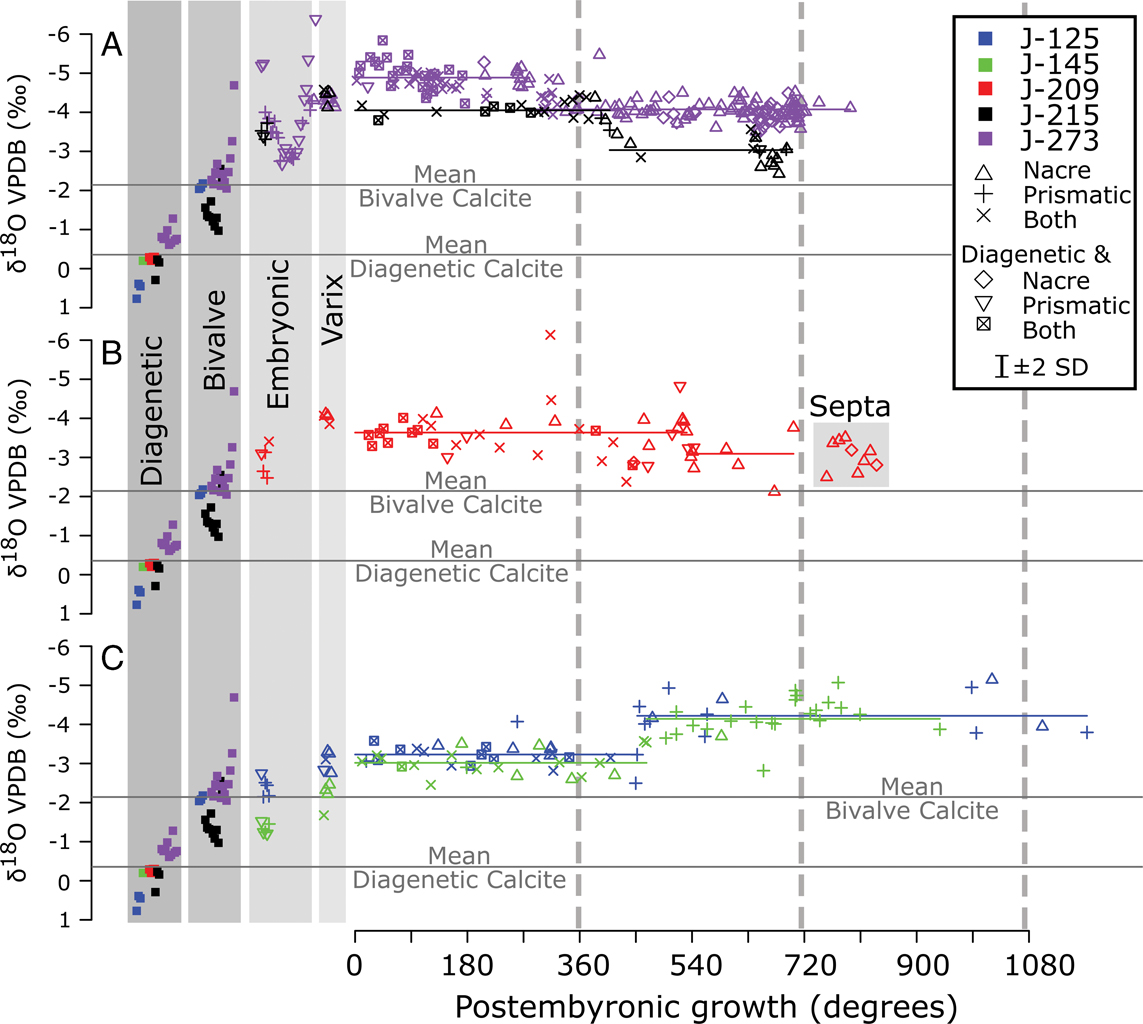
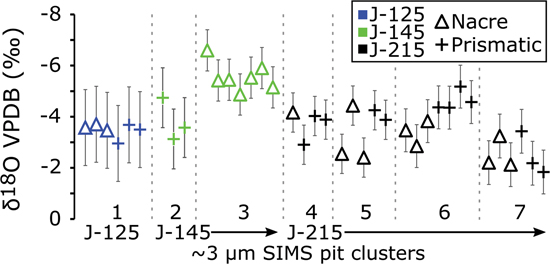
Broad similarities exist in δ18O across the sampled portions of the five ammonites. No differences in δ18O were detected between adjacent nacreous and prismatic shell by either ~10 µm or ~3 µm analyses (Figs. 7, 10, 11). Embryonic shell, precipitated before the varix and at the center of the shells, has a higher δ18O value than that of the varix (Fig. 10, Table 2). These values on embryonic shell overlap with those of the bivalves, and δ18O is generally lower for varix than bivalve (Fig. 10). The isotope values in the immediate postembryonic whorls are the same or lighter than those at the varix (Fig. 10, Table 2). Change points are detected in all five ammonites between 0.75 and 1.5 whorls postvarix (Fig. 10). Exclusion of data based on relative ion yield, measured 16O1H/16O, or intersection with negligible amounts of diagenetic calcite does not substantially change the observed patterns within or between ammonites.
Comparison of ~10 µm secondary ion mass spectrometry (SIMS) analyses of δ18O from diagenetic calcite, bivalve calcite, and ammonite aragonite plotted against whorl number (degrees). Ammonites are divided into three groups to facilitate discussion (A, black-J-273 and purple-J-215; B, red-J-209; and C, green-J-125 and blue-J-145). The distribution of SIMS measured diagenetic and bivalve calcite is reproduced for comparison with all three ammonite data sets. Microstructure measured by SIMS of postvarix shell is indicated by different symbols. Changing means through the time series were identified using the ‘changepoint’ package in R (Killick and Eckley Reference Killick and Eckley2014). A shift in mean δ18O was identified in all five individuals between 270° and 540°. Means for the identified segments of the data sets are plotted corresponding to sample colors.

Comparison of δ18O from ~3 µm secondary ion mass spectrometry (SIMS) pits on nacre and prismatic layers of J-215, J-145, and J-125. Gray dashed vertical lines demarcate clusters of pits that are closely adjacent (within ~20 µm) to each other. Cluster 5 may suggest differences between the two microstructures; however, any apparent difference here could be due to difference in the timing of precipitation between the two locations. Overall, there is no detectable, systematic difference in δ18O that corresponds to differing microstructures of the ammonite shell, given the larger instrumental precision (~0.7‰ 2 SD). Larger analysis spots (~10 µm) with smaller error (~0.3‰ 2 SD) do not show a systematic difference between the microstructures either (Fig. 10).

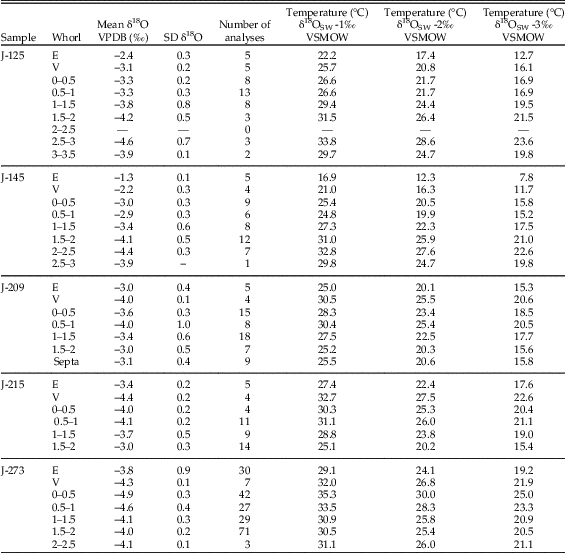
Summary of secondary ion mass spectrometry–measured δ18O values from 10 µm spots and temperatures calculated assuming aragonite precipitated in equilibrium with seawater at different values of δ18O. Temperature calculations were done with the equation derived by Kim et al. (Reference Kim, O’Neil, Hillaire-Marcel and Mucci2007b). E, embryonic; V, varix; VPDB, Vienna Pee Dee Belemnite; VSMOW, Vienna Standard Mean Ocean Water.

Differences in the patterns of δ18O though ontogeny were also observed. The embryonic, varix, and first two half-whorls postvarix do not exhibit the same mean δ18O within and across sample mounts (ANOVA, p=<0.002). Tukey’s honestly significant difference test (Miller Reference Miller1981) was done to test multiple contrasts at the 95% confidence level, including testing grouped embryonic whorls, varix, and the first two half-whorls of growth for equal means (6 contrasts per individual). The summary tables for these contrasts are included as Supplementary Material SI 11. Average absolute values for the embryonic and varix measured δ18O are significantly different in J-125, J-145, and J-209, but not J-215 and J-273 (Fig. 10, Table 2, Supplementary Material SI 11). Average δ18O in embryonic shell was significantly higher (p<0.01) than that of the first whorl and the first whorl in all but specimen J-209 (Fig. 10, Table 2, Supplementary Material SI 11). The direction and magnitude of δ18O change at the detected change points group broadly into two patterns, a stepped decrease (J-125, J-145; Fig. 10C) and a stepped increase (J-209, J-215, J-273; Fig. 10 A, B). In J-209, the δ18O values from shell precipitated later than the varix varies with a greater magnitude than in the other ammonites, and sometimes match those of the bivalves.
Oxygen Isotope Temperatures
Seawater temperatures calculated from δ18O measured in these ammonites range from ~16°C to 35°C if δ18O of seawater (δ18OSW) is assumed to be −1.0‰ (VSMOW), the commonly used value for seawater in an ice-free world (e.g., Shackleton and Kennett Reference Shackleton and Kennett1975) and the value determined from clumped isotope analysis of Fox Hills fossils (Dennis et al. Reference Dennis, Cochran, Landman and Schrag2013). Temperatures range from ~12°C to 30°C if δ18OSW was −2.0‰ (VSMOW) and ~8°C to 25°C if δ18OSW was −3.0‰ (VSMOW). The calculated temperature ranges within individuals are approximately 7°C to 15°C, assuming uniform δ18OSW. Temperatures calculated for the average δ18O per half-whorl are summarized in Table 2.
Carbon Isotopes
Carbon isotope ratios were measured by SIMS in three ammonites, three associated bivalves, and diagenetic calcite (Fig. 12). Diagenetic calcite was distinctly different between the three mounts. An average value of −23.0‰ (VPDB, n=4) was measured in J-215, an average of −16.8‰ (VPDB, n=5) was measured in J-125, and the heaviest average of −8.4‰ (VPDB, n=4) was measured in J-273.
Comparison of δ13C secondary ion mass spectrometry (SIMS) analyses from diagenetic calcite, bivalve calcite, and ammonite aragonite plotted against whorl number (degrees) for J-125, J-215, and J-273. Infilling diagenetic calcite has δ13C that is much more negative than the ammonite shells. Each diagenetic infilling has a distinct δ13C value, which may indicate lower δ13C of the organic carbon bicarbonate source. The diagenetic calcite has lower δ13CAragCal (−23‰ to −8.4‰), which may indicate remineralized organic matter. Embryonic shell has the most positive values measured, ~5‰ (VPDB). These values change to 0‰ (VPDB) in the varix. This large change could be due to different δ13C in the diet or dissolved inorganic carbon (DIC) from vertical movement in a water column that has a freshwater lens.

Bivalve calcite was similar in δ13C between J-125 and J-215. J-215 has an average value of +5.6‰ (VPDB, n =12) and J-125 has an average value of +5.1‰ (n=5). The bivalve associated with J-273 has a very different δ13CAragCal, with an average value of −12.3‰ (n=10). The micromilled bivalves and those associated with ammonites J-125 and J-215 have δ13CAragCal values that are close to +5‰.
In all three ammonite specimens analyzed for δ13C (J-125, J-215, and J-273), there is no apparent difference between adjacent measurements in different microstructure after hatching (Fig. 12). The δ13C value averages approximately 5.0‰ in the embryonic shell and then transitions to lighter values in the varix, ranging from an average of 0.0 to 2.0‰. Measured δ13C values are more variable both between and within individuals in shell adoral of the varix. In J-125, the values are much lighter and average −4‰, whereas in J-215 and J-273, the values are only slightly lighter and average 0.0 and −1.0‰, respectively. The δ13C values become lighter throughout sampled ontogeny in all the specimens (Fig. 12).
Discussion
Timescale of Isotope Record
The fossils in this single concretion likely represent time averaging on the order of months to decades. Presence of ammonite jaws and hooklike structures in these concretions, even outside body chambers, suggests that the ammonites did not have a protracted period of exposure on the seafloor before burial (Wani Reference Wani2007). Similar calcareous concretions from the WIS are estimated to have accumulated in 10–50 yr because of the incorporation of jaws and lack of encrustation, although these are from more offshore sites in the Pierre Shale and contain a higher diversity of fauna and more adults (Landman and Klofak Reference Landman and Klofak2012). Low incidence of borings in these individuals also suggests low seafloor-residence time especially in areas with high sedimentation rates (Tomašových et al. Reference Tomašových, Schlögl, Biroň, Hudáčková and Mikuš2017). However, if we assume that the accumulation is not time averaged beyond 100 yr, it implies that the ammonites sampled here were living at nearly the same time and experienced similar environmental conditions (e.g., seasonal temperature range, mean annual temperature, freshwater input).
The sparry calcite infilling the ammonites is authigenic carbonate that was likely precipitated rapidly. Calcite wedging between the nacreous and prismatic layers of the shell (Figs. 3, 5C) and calcite wedging between tablets of nacre (Figs. 3, 4, J-273) suggest rapid calcite precipitation at low temperatures, because fine-grained aragonite tends to recrystallize to calcite or dissolve (Rude and Aller Reference Rude and Aller1991; Macintyre and Reid Reference Macintyre and Reid1995; Cherns and Wright Reference Cherns and Wright2000; Sessa et al. Reference Sessa, Patzkowsky and Bralower2009). SEM imaging also shows calcite encasing individual tablets of nacre in some places where the shell is broken (see Supplementary Material SI 1–SI 5). The low δ13C measured in the authigenic calcite suggests the carbon source was likely the decaying mollusk or plant organic matter in the volume of the concretion (Landman and Klofak Reference Landman and Klofak2012; Landman et al. Reference Landman, Grier, Grier, Cochran and Klofak2015). An alternative source for the low δ13C values in the authigenic calcite is fresh groundwater, carrying low-δ13C dissolved inorganic carbon (DIC) from decay of terrestrial organic matter, flushing through the sediments before compaction. Both carbon and strontium isotopes suggest groundwater interaction was an important component of WIS hydrology (Cochran et al. Reference Cochran, Landman, Turekian, Michard and Schrag2003). Some modern, nearshore calcite-siderite concretions formed within the last 50 yr through a combination of increased sedimentation and tidal groundwater flushing (Allison and Pye Reference Allison and Pye1994). It is notable that there is no indication of aragonite shell dissolution, even though pH is expected to decrease during organic matter degradation (Walter et al. Reference Walter, Bischof, Patterson, Lyons, O’Nions, Gruszczynski, Sellwood and Coleman1993).
To interpret the stable isotope data collected from the ammonites, the timescale of mollusk growth must be estimated. Sinusoidal patterns in bivalve calcite δ18O are widely interpreted to indicate seasonal temperature variability that serves as a chronometer of growth (e.g., Killingley and Berger Reference Killingley and Berger1979; Jones Reference Jones1983; Ivany et al. Reference Ivany, Wilkinson and Jones2003). However, the range of δ18O within ammonites that exhibit sinusoidal variability (e.g., ~2‰ [Fatherree et al. Reference Fatherree, Harries and Quinn1998] or ~0.8‰ [Lécuyer and Bucher, Reference Lécuyer and Bucher2006]) have been argued to be too large for seasonality to be the primary cause (Lukeneder Reference Lukeneder2015). Other authors have interpreted δ18O variability preserved in belemnite rostra as reflecting primarily seasonal changes (Urey et al. Reference Urey, Lowenstam, Epstein and McKinney1951; Dutton et al. Reference Dutton, Huber, Lohmann and Zinsmeister2007). Ammonites were likely mobile both vertically and horizontally in their environment, which is expected to add variability to the isotopic composition of their growing shells (Linzmeier et al. Reference Linzmeier, Kozdon, Peters and Valley2016). Sinusoidal variability in ammonite δ18O values can, therefore, only dubiously be interpreted as reflecting seasonal patterns. In adult scaphites, sinusoidal variability, if present, may be interpretable as seasonality, because a high degree of morphological partitioning by facies suggests more limited long-distance movement of mature individuals (Jacobs et al. Reference Jacobs, Landman and Chamberlain1994) and the morphology of the aperture, especially in mature shells, suggests limited swimming capacity (Landman et al. Reference Landman, Cobban and Larson2012a). In juvenile scaphites, sinusoidal variation in measured stable isotope ratios could also indicate seasonality; however, because circumstantial evidence suggests at least a portion of early, posthatching life was spent in shallow water, variation is likely an integrated signal of changes in the location within the environment and seasonal environmental change.
The best available estimates of growth can come from analogies with modern coleoid cephalopods. Modern cephalopod growth is highly temperature dependent. Thus, if the ammonites studied here grew at different times of the year, then regardless of their realized size, they may have differed in age, even if they reached the same diameter (Boletzky Reference Boletzky1983; Summers Reference Summers1983). Development in Sepia officinalis can take from more than 100 to 30 d depending on whether the egg grows in 15°C or 25°C water (Boletzky Reference Boletzky1983). Food availability and temperature also modulate the rate of statolith (internal biomineral) growth (Zumholz et al. Reference Zumholz, Hansteen, Klügel and Piatkowski2006; Aguiar et al. Reference Aguiar, Rossi-Wongtschowski and Perez2012).
Because the ammonites studied here are small (<8 mm), their growth rate (i.e., % mass, diameter) was probably the most rapid of their life spans. The evacuation of fluids from newly formed chambers by osmosis through the siphuncle would have been fastest at small shell volumes (Bucher et al. Reference Bucher, Landman, Klofak and Guex1996). The rate of growth and age at maturity of H. comprimus is difficult to determine, because all ammonites are extinct. The total lifespan of Hoploscaphites is estimated to be less than 6 yr (Landman et al. Reference Landman, Cobban and Larson2012a). Data on modern cephalopods provide a context for comparison. Growth rate estimates of modern cephalopods fall into two groupings. Nautilus grows slowly and reaches maturity in 10–15 yr (Landman and Cochran Reference Landman and Cochran2010). Shallow-water coleoids such as Loligo, on the other hand, grow quickly and reach maturity in 1 or 2 yr (Forsythe and Van Heukelem Reference Forsythe and Van Heukelem1987). Jacobs and Landman (Reference Jacobs and Landman1993) have argued that ammonites are phylogenetically closer to coleoids than to nautilids, implying that ammonites and coleoids may have shared similar growth rates. However, the plesiomorphous retention of an external shell must have imposed physiological constraints on the rate of growth. In addition, within the ammonites themselves, growth rates probably varied widely depending on the depth of the habitat, ranging from rapid rates in shallow-water forms such as scaphitids to slower rates in deeper-water forms such as desmoceratids. On this basis, we estimate that the age of maturity of H. comprimus is 3–5 yr. This estimate is comparable to estimates of other shallow-water ammonites based on a variety of proxies, including septal spacing, jaw increments, size classes, and epizoans (Bucher et al. Reference Bucher, Landman, Klofak and Guex1996).
Therefore, the isotope record from within the ammonites probably reflects weeks or months, although not necessarily in the same year. Thus, in the ontogeny of any individual, the data do not show complete annual temperature change, nor do they reflect long-term global temperature change, and the results should be interpreted considering subannual water mass conditions. This means that abrupt changes in isotope ratios probably reflect spatially close changes in the environment, because the small scaphites are unlikely to have been fast swimmers with high mobility. Swimming velocity estimates suggest hatchling ammonites may have moved as much as ~167 m/d in calm water, and jetting was likely important for maintaining position in the water column (Lemanis et al. Reference Lemanis, Zachow, Fusseis and Hoffmann2015). Movement vertically in the water column could cause abrupt changes in temperature or salinity in the WIS (Petersen et al. Reference Petersen, Tabor, Lohmann, Poulsen, Meyer, Carpenter, Erickson, Matsunaga, Smith and Sheldon2016). Horizontal movement of water masses could also have occurred, but these would have likely developed over more time. Alternatively, the ammonites may have experienced changes as passive inhabitants being moved along the shoreline parallel to longshore current (Waage Reference Waage1968).
Bivalve Interpretation
Seasonality or Partial Seasonality
Bivalve isotope data provide constraints on benthic temperature and seasonality characteristics in the WIS. Stable isotope data from bivalves in this study come from small fragmentary samples and therefore likely do not capture the full range of seasonal variability within any one individual (Figs. 6, 9). Common sclerochronological estimation of seasonal range from sinusoidal fits cannot be done with this data set, because we have not found complete sinusoids (Ivany Reference Ivany2012). Potential seasonal magnitude, however, can be conservatively estimated by the range in δ18O within individuals capturing only partial years, which in this case averages 1.2‰ or ~5°C. Pooling all data (SIMS and acid digestion) suggests a larger seasonal range of 3.7‰ or ~18°C, but potentially introduces confounding factors associated with transport from nearshore brackish water with different mean δ18O or with species-specific vital effects (Landman and Klofak Reference Landman and Klofak2012).
Bivalve δ 13 C range—Infaunal Life or Transport?—A large δ13C range (~22‰) was measured across bivalves in this concretion. Bivalve δ13C reflects a combination of dietary and DIC sources (McConnaughey and Gillikin Reference McConnaughey and Gillikin2008). Most (four of five) have δ13C values near +5‰ VPDB. These values are similar to the embryonic ammonite shells and may indicate an epifaunal or shallow-infaunal mode of life and growth in the same water as the ammonites, because of large δ13CDIC gradients in pore waters (McCorkle et al. Reference McCorkle, Emerson and Quay1985). One bivalve has low δ13C values that suggest either transport from more brackish water with lower δ13CDIC like similarly aged bivalves from the Hell Creek Formation (Cochran et al. Reference Cochran, Landman, Turekian, Michard and Schrag2003) or a deep infaunal mode of life across a δ13C gradient within the sediment pore water (McCorkle et al. Reference McCorkle, Emerson and Quay1985). Similar changes in δ13C are found in modern benthic foraminifera that live farther below the sediment–water interface (McCorkle et al. Reference McCorkle, Corliss and Farnham1997). Living near seeping methane can also drive δ13C of mollusk carbonate low (Hein et al. Reference Hein, Normark, McIntyre, Lorenson and Powell2006). However, well-developed seeps have not been identified in the Fox Hills (Landman et al. Reference Landman, Cochran, Larson, Brezina, Garb and Harries2012b).
Ammonite Interpretation
Oxygen Isotopes
The isotope values of the embryonic shell provide insight into the environment in which the eggs developed (Landman et al. Reference Landman, Cochran, Rye, Tanabe and Arnold1994). The fact that the δ18O values of the embryonic shells approach those of the bivalves suggests that the eggs developed on the bottom (Fig. 10; Moriya et al. Reference Moriya, Nishi, Kawahata, Tanabe and Takayanagi2003; Zakharov et al. Reference Zakharov, Shigeta, Smyshlyaeva, Popov and Ignatiev2006; Sessa et al. Reference Sessa, Larina, Knoll, Garb, Cochran, Huber, MacLeod and Landman2015). A variety of modes of egg development have been proposed for benthic development, including individual or masses of eggs deposited on the seafloor (Ritterbush et al. Reference Ritterbush, Hoffmann, Lukeneder and De Baets2014; De Baets et al. Reference De Baets, Landman and Tanabe2015). A recent report of embryonic shells with in situ aptychi preserved in the body chamber of adults suggests ovoviviparity may have occurred in some ammonites (Mironenko and Rogov Reference Mironenko and Rogov2015). However, similar preservation has not been observed for scaphites. Most studies of the mode of life of scaphites suggest they lived in the bottom of the water column; therefore, agreement between bivalve and embryonic ammonite shell suggests ovoviviparity cannot be excluded (Landman et al. Reference Landman, Cobban and Larson2012a; Sessa et al. Reference Sessa, Larina, Knoll, Garb, Cochran, Huber, MacLeod and Landman2015). Future work may find females with developing embryos in the body chamber.
The average δ18O for the embryonic shell is different between individuals (Fig. 10, Table 2), which may indicate that the eggs developed in different seasons. Some modern coleoids have protracted spawning seasons that span several months, suggesting that this behavior is possible in ammonites (Worms Reference Worms1983; Rocha and Guerra Reference Rocha and Guerra1996; Rocha et al. Reference Rocha, Guerra and González2001). The measured range in just the embryonic shell, combining all observations, would translate to a seasonal temperature range of ~8°C, which is comparable to the ranges observed within individual bivalves. However, the measured oxygen isotope ratios of J-215 and J-273 that approach −4‰ (VPDB) are unusually light. Temperatures for the two would be anomalously high at 31°C (δ18OSW=−1.0‰), which suggests that they may also have developed at a different site, nearer to shore in slightly more brackish water, with a lower value of δ18OSW.
The values of δ18O consistently decrease from the embryonic shell into the varix by 0.6‰ to 1.1‰. This transition translates to an increase in temperature of approximately 4°C. Data from posthatching shell do not indicate a difference in δ18O of adjacent nacreous or prismatic aragonite, so this transition can be interpreted as environmental change (Figs. 5, 9, 10). The varix is thought to have developed during late embryogenesis (De Baets et al. Reference De Baets, Landman and Tanabe2015). It is also possible that the varix formed immediately before and immediately after hatching, reflecting the initial posthatching environment. This change in δ18O between embryonic shell and varix could reflect vertical movement in the water column to warmer or more brackish water at hatching, a scenario that is possible given buoyancy calculations and jetting potential (Lemanis et al. Reference Lemanis, Zachow, Fusseis and Hoffmann2015). If brooding is considered as a possibility, the lighter values of both δ18O and δ13C in all five specimens may imply that the females migrated inshore at the end of embryonic development. The lighter values of δ18O at the varix could also reflect hatching at a warmer time of the year or seasons with lower seawater δ18O. Most of the specimens lack a sufficient number of data points in the embryonic shell to reveal a trend, but J-273 shows a partial sinusoidal pattern in δ18O with a shift toward warming near the varix (Fig. 10). Although embryonic shell growth was not likely simply accretionary like that of posthatching shell (Landman et al. Reference Landman, Tanabe and Shigeta1996; De Baets et al. Reference De Baets, Landman and Tanabe2015), this pattern may suggest differences in timing of precipitation across the shell. Future analysis will be necessary to disentangle this pattern. The average δ18O values of embryonic shell across all five ammonites reveals a range of 2.5‰, suggesting that these individuals experienced events in different places or times, likely showing seasonal differences in the timing of spawning like some modern cephalopods (e.g., Worms Reference Worms1983). The isotope values of embryonic shell of J-215 and J-273 translate to temperatures of 29°C and 27°C (δ18OSW=−1.0‰), respectively, that could possibly reflect a more nearshore, slightly more freshwater-rich environment or convection of lower δ18O waters.
The values of δ18O immediately after hatching (postvarix) in the first postembryonic whorl are the same as those of the varix and lighter than the average of the bivalves. It suggests that the hatchlings did not occupy the same habitat as the ammonite eggs, that is, along the bottom. In summary, compared with the embryonic shell, the varix and postvarix shell may have been secreted in warmer, shallower depths, or possibly more freshwater influenced nearshore environments, but still with salinities ≥20‰ based on the salinity tolerances of modern cephalopods (von Boletzky, pers. comm., 2015), although lower salinities (<20‰) have been suggested from recent paleoclimate modeling (Petersen et al. Reference Petersen, Tabor, Lohmann, Poulsen, Meyer, Carpenter, Erickson, Matsunaga, Smith and Sheldon2016), but these seem unlikely in light of the present results.
After the first postembryonic whorl in J-215 and J-273 (phragmocone diameters of 5.8 and 2.9 mm, respectively), δ18O becomes slightly heavier, in the direction of the benthic bivalves. Change in the stable oxygen isotopic composition of ammonites toward bivalves at this growth stage suggests that the ammonites assumed a more demersal, possibly adult-like, habitat after one postembryonic whorl (360° growth). In scaphites, minor morphological changes occur at this size, including changes in the size of the umbilicus and the appearance of ornamentation (Landman Reference Landman1987), which have been interpreted as a shift to a more demersal mode of life. In contrast, in J-125 and J-145, with phragmocone diameters of ≥6.5 and 4.8 mm, respectively, δ18O decreases. This may suggest that the individuals remained in shallower water or in more nearshore settings for longer periods of time. In J-209, δ18O oscillates, and during the end of the second whorl, approaches that of benthic bivalves. This could imply vertical movement in the water column or transport through variable δ18OSW. It is possible that the presence of short pathological varices is reflected in δ18O patterns like those in J-125 and J-145 (Table 1, Fig. 10); however, J-209 exhibits similar varices but a stepwise change more like that of J-215 and J-273 (Fig. 10).
Carbon Isotopes
Variation in mollusk shell δ13C is caused by changing δ13C of either diet or DIC or the ratio of respired carbon to DIC (McConnaughey and Gillikin Reference McConnaughey and Gillikin2008). There are three hypotheses that can readily explain the δ13C shift between the embryonic whorls, varix, and posthatching ammonite shell: (1) the ratio of respired to ambient CO2 changes with the removal of the egg–membrane barrier, (2) δ13C of yolk and particulate organic matter are dramatically different, and (3) the δ13CDIC gradient is influenced by freshwater input. Our data alone do not provide enough evidence to clearly determine whether one change had a greater impact, but we can offer some constraints based on published data from the WIS, δ13CDIC gradients in modern oceans, and aquarium-rearing experiments in Nautilus.
The largest shift in ammonite δ13C occurs at hatching, between the embryonic shell and the varix. Three major state changes occur at hatching that all could have contributed to the observed shift: (1) changing diet from yolk to particulate organic matter, (2) movement to a higher position in the water column, and (3) leaving the egg membrane and starting to swim by jetting. The diet of embryonic ammonites was sourced solely from the egg yolk, which may have been an invariable δ13Cdiet reservoir. After hatching, the ammonite diet was likely suspended particulate organic matter that likely had a different δ13C value than that of the yolk. An aquarium-reared Nautilus showed an approximately −4‰ shift in δ13C at hatching, while δ13CDIC was likely constant (Landman et al. Reference Landman, Cochran, Rye, Tanabe and Arnold1994).
Hatching and moving to a shallower position in the water column would have changed the δ13CDIC the ammonites were experiencing. Because of the biological pump, most δ13CDIC profiles in the modern open ocean or Black Sea show higher δ13C values in surface water and lower δ13C values lower in the water column (Kroopnick Reference Kroopnick1985). This profile may not hold true in the WIS, where brackish water was an important control on the vertical structure of the seaway (Petersen et al. Reference Petersen, Tabor, Lohmann, Poulsen, Meyer, Carpenter, Erickson, Matsunaga, Smith and Sheldon2016). Freshwater δ13CDIC is strongly influenced by the degradation of terrestrial organic matter and often has low δ13C values (Amiotte-Suchet et al. Reference Amiotte-Suchet, Aubert, Probst, Gauthier-Lafaye, Probst, Andreux and Viville1999). Bivalves (Unio) measured from the time-equivalent Hell Creek Formation have carbon isotope values of ~−4‰ (VPDB), which indicates relatively low values can be expected for surface waters, especially during seasons of high freshwater discharge (Cochran et al. Reference Cochran, Landman, Turekian, Michard and Schrag2003).
The presence of the egg membrane may have caused more respired CO2 to be incorporated into the ammonite shell before hatching or could have preferentially trapped more heavy carbon, creating a different δ13CDIC in the egg than that of ambient seawater. However, the potential magnitude of these effects has not been calibrated with modern experimental studies on macroinvertebrates. An additional membrane separating the mantle fluids (where calcification occurs) from ambient seawater could cause a fractionation because of preferential 12C loss in the form of CO2 and retention of 13C as HCO3 (McConnaughey and Gillikin Reference McConnaughey and Gillikin2008). The magnitude of this fractionation would depend on diffusion rates across the membrane and therefore the difference in pCO2 between the egg case and the ambient environment. Hatching removes the egg-case barrier, exposing the ammonite to ambient δ13CDIC and changes the difference in pCO2 across the mantle membrane (Melzner et al. Reference Melzner, Gutowska, Langenbuch, Dupont, Lucassen, Thorndyke, Bleich and Pörtner2009). Active ventilation presumably also starts at hatching and may increase the amount of ambient CO2 incorporated into the shell. To explain the δ13C signal with a constant value of respired δ13C and δ13CDIC would require a shift in the proportion of respired CO2 incorporated comparable to ontogenetic changes in larger (~10–100 mm) bivalves (~10–40% respired carbon) and is therefore unlikely (Gillikin et al. Reference Gillikin, Lorrain, Meng and Dehairs2007; McConnaughey and Gillikin Reference McConnaughey and Gillikin2008).
A dietary shift from yolk to particulate organic matter or vertical movement in the water column are possible causes of the pre- to posthatching shift in δ13C. A change in depth is consistent with the δ18O shifts observed between embryonic shell and varix values in the shells that indicate transition to warmer or fresher water. A pre- to posthatching change in dietary δ13C must necessarily occur because of the loss of yolk as a carbon source at hatching. Aquarium studies investigating the δ13CDIC of Nautilus or other extant cephalopods could provide constraints on the magnitude of change that hatching itself causes by the removal of an additional membrane.
Comparison with Co-occurring Nautilids
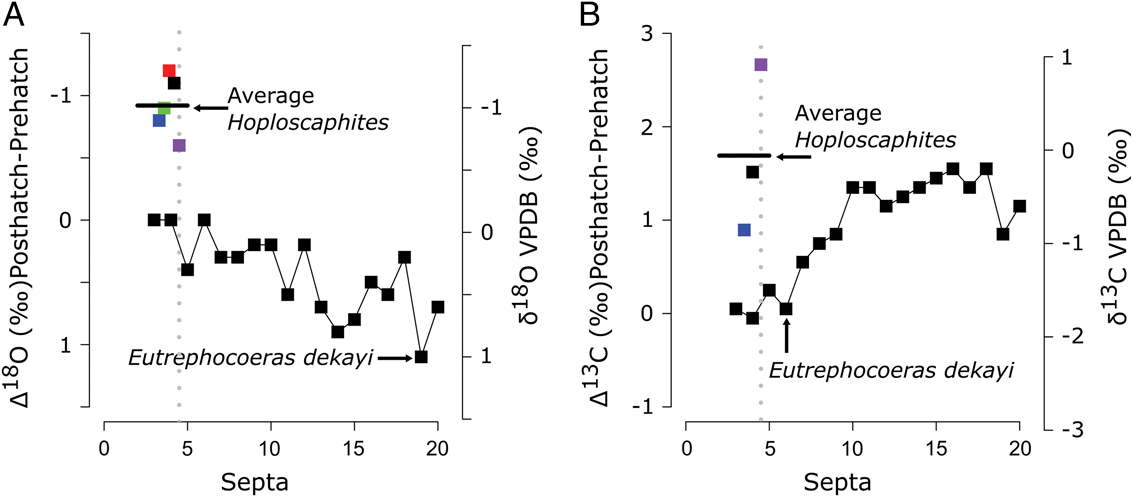
The isotope patterns in these five ammonites are distinctly different from a nautilid sampled from a different concretion in the Fox Hills Formation (FH1 in Landman et al. Reference Landman, Rye and Shelton1983; reproduced here as Fig. 13). In Eutrephocoeras dekayi, hatching occurs between septa 4 and 5. The values of δ18O in the prehatching septa (3 and 4) average −0.1‰. The average value of the next 16 septa is 0.4‰, suggesting that there is almost no net change between the embryonic and postembryonic habitat compared with the transition in the ammonites (Figs. 8, 12, Table 2). No major transition is apparent in δ13C between septa 4 and 5; however, a transition of +0.5‰ is present between septa 9 and 10. Like those of modern Nautilus, the eggs of E. dekayi must have been laid on the bottom, and the newly hatched animal must have also lived close to the bottom.
Septa number vs. δ18O and δ13C from a Eutrephoceras dekayi collected in the Fox Hills formation compared with the pre- to posthatching change in the scaphites measured in this study. Eutrephoceras dekayi data are from sample FH1 (Landman et al. Reference Landman, Rye and Shelton1983). A and B, Hatching is inferred to have occurred between septa 4 and 5 and is indicated by the dashed vertical gray line. The right axis of both A and B show the δ18O and δ13C values as reported in (Landman et al. Reference Landman, Rye and Shelton1983). The left axis shows the change in δ18O and δ13C from the average prehatching values (septa 3 and 4). Points scattered around the average Hoploscaphites line indicate the average varix isotope ratio minus the average embryonic isotope ratio for each ammonite. A, From left to right, points are J-125, J-145, J-209, J-215, and J-273. B, From left to right, points are J-145, J-215, and J-273. The average embryonic to varix change is approximately −1‰ for δ18O and +1.9‰ for δ13C. The ammonites in this study clearly show habitat change at hatching that this E. dekayi did not undergo (compare with Figs. 10, 12).

Concretion Accumulation and Paleoenvironmental Interpretation
Despite their various ontogenetic trajectories, all the studied specimens are preserved in the same concretion. They died at a diameter of 2.9 to 7.8 mm corresponding to a phragmocone diameter of 1.7 to ≥6.5 mm. This corresponds to the size peak of the juveniles in this and associated concretions. The silty lithology and the presence of abundant plant debris suggest that they were deposited in a nearshore environment at the base of the lower shoreface transition zone (Landman and Waage Reference Landman and Waage1993). The presence of comminuted plant fragments, jaws, and hooklike structures outside body chambers and broken apertures on the juveniles suggest that the scaphites were subjected to some postmortem transportation and abrasion. The fact that the phragmocones are filled with calcite and the body chambers are filled with sediment, however, suggests that the process did not permit sediment transport into the phragmocones through breakage or infiltration through the siphuncle. Accumulations such as these, consisting almost exclusively of juveniles in the Fox Hills Formation, are only known from this horizon between the Timber Lake and Trail City Members (Figs. 2, 8).
Waage (Reference Waage1965, Reference Waage1968) inferred the presence of a northeast–southwest trending current that possibly paralleled the coastline in north-central South Dakota during the deposition of the Fox Hills Formation. The current is inferred based on the increase in siltier/sandier sediments up-section toward the southwest, and the general geometry of a coarser sand body (Waage Reference Waage1965, Reference Waage1968). The newly hatched ammonites may have been caught up in this current, permitting wide dispersal. The environment, much like other near-coastline environments in the WIS, may have also been influenced by hyperpycnal and hypopycnal flows sourced from nearby rivers (Bhattacharya and MacEachern Reference Bhattacharya and MacEachern2009). Normal and reverse bedding indicative of hyperpycnal flows have not been reported in the Fox Hills Formation of South Dakota, perhaps due to extensive bioturbation (Waage Reference Waage1968). Such episodic flows, often triggered by storms, would have coincided with plumes of freshwater discharge that were threatening to ammonites and other stenotopic organisms. Transport of sediments from nearshore containing plant material would also have occurred.
WIS Paleoceanography
Unlike much of the previous work on WIS paleoceanography (Cochran et al. Reference Cochran, Landman, Turekian, Michard and Schrag2003; Dennis et al. Reference Dennis, Cochran, Landman and Schrag2013; Petersen et al. Reference Petersen, Tabor, Lohmann, Poulsen, Meyer, Carpenter, Erickson, Matsunaga, Smith and Sheldon2016), our data describe the paleoenvironment on a small spatial (tens to hundreds of meters) and temporal (months to decades) scale. Modern data sets of δ18OSW for nearshore surface water collected on the decadal scale exhibit high spatial and seasonal variability (3–4‰, with salinities >20‰ [Whitney et al. Reference Whitney, Wanamaker, Kreutz and Introne2017]). The range of δ18O and δ13C within and between individual ammonites and bivalves indicates that significant spatial and temporal heterogeneity in the salinity or temperature was present in the WIS. The range of δ18O within ammonites is likely to reflect both temperature and salinity effects. Large δ13C gradients of 5–6‰ may have existed within the water column, with the surface water dominated by fresher water with low δ13CDIC, and then pore fluid being dominated by even lower δ13CDIC caused by the degradation of organic matter. Large temperature gradients (~20°C) are also indicated by our data if uniform δ18Owater through the water column is assumed; however, nearshore δ18Owater is suggested to have had a range of −8‰ to −2‰ (Petersen et al. Reference Petersen, Tabor, Lohmann, Poulsen, Meyer, Carpenter, Erickson, Matsunaga, Smith and Sheldon2016). Our data suggest extremely low δ18OSW values were unlikely unless nearer shore than our sampling location. Perhaps this oceanographic heterogeneity drove endemism (Myers et al. Reference Myers, MacKenzie and Lieberman2012) in the WIS and could drive differences in evolutionary kinetics between epeiric seaways and the open ocean (Peters Reference Peters2007; Miller and Foote Reference Miller and Foote2009).
Conclusions
Authigenic calcite, bivalve calcite, and ammonite aragonite have distinct δ13C and δ18O values in the Fox Hills Formation concretion. Authigenic calcite has more positive δ18O (~−0.6‰, VPDB) and much more negative δ13C (~−24‰, VPDB) than either bivalve or ammonite material. There is some range of δ18O within bivalves, but individuals do not exhibit complete seasonal sinusoids. Embryonic ammonite shell has the highest δ18O (~−2‰, VPDB) and δ13C (~+5‰, VPDB) values within the ammonites, and the values approach those of the bivalves. Ammonite shell values change noticeably at the varix (average change embryonic to varix: δ18O +1‰, δ13C −5‰), when hatching is inferred to have occurred. Two patterns of stepwise change in δ18O are present in posthatching ammonite shells. Three shells show a more positive shift of ~1‰, and two show a more negative shift of ~1‰. No differences in δ18O or δ13C were detectable between the nacreous or prismatic layers of the ammonite shell.
Hoploscaphites comprimus in the Fox Hills Formation appear to have had eggs that developed near the seafloor. The similarity in δ18O and δ13C between bivalves and embryonic ammonite shell suggests that these individuals developed in the lower water column. Upon hatching, the ammonites all moved into either a warmer or more brackish habitat, both of which were likely characteristic of shallower-water environments that were accessible to slow-swimming hatchlings. Such a scenario suggests a planktic mode of life for hatchlings and corroborates inferences about a planktic stage based on buoyancy, stratigraphic occurrence, and analogy to the modern cephalopods (e.g., Ritterbush et al. Reference Ritterbush, Hoffmann, Lukeneder and De Baets2014; De Baets et al. Reference De Baets, Landman and Tanabe2015). A stepwise transition in δ18O near one whorl growth in all five ammonites suggests a return to a nektobenthic mode of life for some individuals and/or a movement nearshore for others. Our data also strongly support the occasional, perhaps seasonal, development of strong water-column thermohaline stratification in the WIS (e.g., Kump and Slingerland Reference Kump and Slingerland1999; Petersen et al. Reference Petersen, Tabor, Lohmann, Poulsen, Meyer, Carpenter, Erickson, Matsunaga, Smith and Sheldon2016). Future SIMS studies of embryonic ammonite shell and environmental context from foraminifera or benthic mollusks will have the potential to determine the prevalence of complex water-column occupation strategies during early ontogeny.
These data show variability in both habitat occupied and seasonal timing of development of several individuals from the same ammonite species that lived at nearly the same time. Similar patterns of seasonally protracted spawning are known from modern organisms, but it is important to appreciate this variability when attempting to understand proximal causes of extinction based on patterns in the fossil record. Scaphites were one of the few short-term survivors at the K/Pg boundary (Landman et al. Reference Landman, Goolaerts, Jagt, Jagt-Yazykova, Machalski and Yacobucci2014), and perhaps it was this breadth of developmental timing and environment that promoted both wide geographic distribution and survival.
Acknowledgments
We thank B. Hess for sample preparation; P. Gopon, Z. D. Michels, and J. Fournelle for assistance with SEM analysis; A. C. Denny and J. N. Cammack for development of QGIS workflow; and G. L. Wolfe, M. Baddouh, J. Wycech, S. K. McMullen, and D. C. Kelly for discussion of this project. We also wish to thank K. De Baets and two anonymous reviewers for their comments on this article. This work was supported by a Geological Society of America Graduate Student Research Grant, the Norman Newell Fund at the American Museum of Natural History, and the Department of Geoscience at the University of Wisconsin–Madison. WiscSIMS is supported by the National Science Foundation (EAR16-58823) and the University of Wisconsin–Madison.
Supplementary Material
Data available from the Dryad Digital Repository: https://doi.org/10.5061/dryad.pq70h50