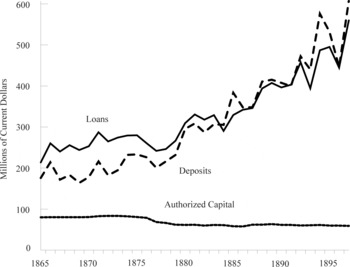
By any standard, the spread of deposit banking in New York City over the three decades following the Civil War was nothing short of remarkable. With $90 million of capital available in 1866 to support $200 million in individual deposits, the members of the New York Clearing House Association tripled their deposits by 1897, while capital fell to $72 million. As Figure 1 depicts, a surge in lending activity accompanied the fresh deposits. The aggregate balance sheet figures for the entire United States are even more striking. Richard Sylla, John A. James, and Peter L. Rousseau and Paul Wachtel have emphasized their implications for growth in real per capita incomes, which averaged 1.7 percent over the period from 1866 to 1897.Footnote 1 In this article, I examine how prices discovered in a surprisingly well-developed dealer market for bank stocks were associated with the observed expansion of deposits in New York City—the nation's nineteenth-century financial center.
LOANS, INDIVIDUAL DEPOSITS, AND AUTHORIZED CAPITAL OF TRADED NEW YORK CITY BANKS, 1866–1897

In an article on the permanent effects of financial innovation, I offer one explanation for the expansion of deposits: improvements in screening and monitoring of bank loans after 1870 lowered interest rates on loans and raised interest rates on deposits in New York City's increasingly competitive banking sector, which in turn increased financial throughput by attracting loan applications and new deposits.Footnote 2 This article points to the complementary explanation that an increasingly informative financial market in New York raised confidence in bank stock prices as signals and caused the public to use deposits more, and offers hard evidence that these prices influenced the distribution of the growing deposit base across banks. Specifically, I propose that the market for bank shares contributed to unbalanced deposit growth across New York banks by signaling individual depositors about the condition of particular institutions. Further, depositors looked to these price signals more than balance sheet items such as surplus and undivided profits when deciding where to lodge their excess balances.Footnote 3
Bank stock prices were indeed the only published signals available to depositors whenever the New York Clearinghouse Association resorted to issuing “loan certificates” as an inside money for clearing interbank balances, which occurred during the panics of 1873, 1884, 1890, and 1893, because the financial press did not report on the condition of individual banks at these times.Footnote 4
The proposition implies that the trading of common stocks had become such an integral part of New York's postbellum landscape that individuals who did not invest directly in bank stocks could access price information from the press. These stock prices offered direct and indirect information about the opinions held by the city's growing community of finance professionals about the soundness of the banks. Richard Sylla and I argue that this was certainly the case in New York City, where the practice of stock trading had developed rapidly since the 1790s, with bank stocks leading the way.Footnote 5
Charles W. Calomiris and Charles M. Kahn describe the emergence of demandable debt in the United States early in the nineteenth century and how it possessed the desirable feature of aligning the interests of bankers and less-informed depositors through a threat of liquidation.Footnote 6 Its slow adoption likely resulted from informational frictions that remained severe prior to the Civil War, yet institutional changes among New York City banks after 1870, including moves toward greater efficiency and transparency, increased public confidence in the safety of demand deposits. I argue that at this time—when bank stock prices were trending upward but varied widely across individual banks—confidence in their informational content became instrumental in generating a stock price elasticity of deposits large enough to influence the path of the expansion.
Fritz Redlich was convinced of the informational content of bank stock prices over this period, presenting a sample of published newspaper quotations and stating that “of course the earning capacity of the leading banks was reflected in the quotations of bank stocks.”Footnote 7 Roger W. Babson, writing in 1914 about how a potential depositor might select a bank, concluded that “when picking out a bank in which to deposit, it is well to obtain the bid price of the stock and compare this price with the book value.”Footnote 8 Kriebel and Co. in Principles of Profitable Investing state in 1920 that “to the average reader, a bank statement is meaningless. The bank you select should enjoy the confidence of the community. One indication of a bank's standing is the continuous gain in deposits without having to offer any special inducement. Another indication of a bank's standing is the price of its stock.”Footnote 9
To facilitate testing, I construct a new bank-level data set containing annual prices, dividends, and balance sheet quantities from the Commercial and Financial Chronicle, the New York Times, and the Annual Report of the Comptroller of the Currency. The data, which cover 1866 through 1897—the period of most rapid deposit growth—allow construction of price indexes and dividend yields for New York City's traded banks. More importantly, they offer an opportunity to trace and compare the dynamic responses of deposits to fluctuations in bank stock prices and dividends as well as to various accounting measures of bank performance.
The empirical analysis uses the generalized method of moments techniques developed by Douglas Holtz-Eakin, Whitney Newey, and Harvey S. Rosen and by Manuel Arellano and Stephen Bond to estimate dynamic panel models of deposit adjustment.10 The results show that individuals did place their funds in banks with strong price performance. At the same time, institutional depositors, who likely had better information about the soundness of potential correspondent banks, relied less upon prices. Neither type of depositor seems to have responded strongly to signals that were regularly available from published balance sheets, such as a bank's surplus and undivided profits.
My emphasis on the association of stock market prices with the rise of deposit banking in New York City is somewhat removed from traditional legislative explanations for the general rise of deposits in the nation as a whole. For example, when Congress announced a prohibitive 10 percent tax on the notes of state-chartered banks to take effect on 1 July 1866, state banks were left to choose between exiting the industry altogether, converting to national charters—with which they could continue to issue notes—or relying on deposits as an alternative means of funding earning assets. Deposits did not rise immediately at the national level, however, because many state banks converted to national charters.Footnote 11 But a prohibition on mortgage lending included in the National Banking Acts and decreasing profitability of note issue due to rising prices of collateral bonds led to a resurgence of state banks by 1880. At the same time, deposits expanded as individuals grew more accustomed to check money and to the liquidity and transactions services that deposit accounts could provide.Footnote 12
But legislative factors were much less at play in New York City where the clearinghouse banks had converted to national charters by 1865 and the return of state banking seen elsewhere after 1880 did not materialize. As the nation's only central reserve city under the National Banking laws until 1887, New York did of course see large inflows of interbank deposits from elsewhere in the nation, but the evidence presented below suggests that these deposits were much less stock price elastic than those placed by individuals.
THE MARKET FOR BANKING EQUITIES IN NEW YORK CITY
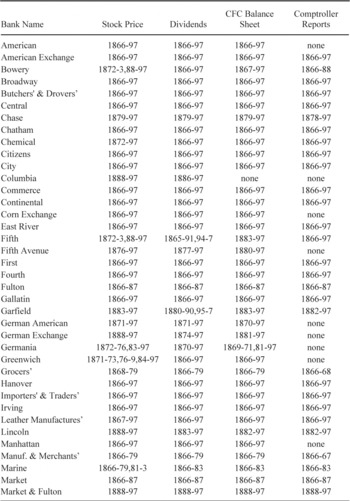
The market for U.S. bank stocks made a strong start in 1791 with the initial public offering of stock in the First Bank of the United States. As individual states proceeded to grant special charters to more than 800 banks over the next five decades, the transfer of bank shares became familiar transactions in the money centers of New York, Boston, Philadelphia, and Baltimore. In New York City alone, the number of banks with price quotations in the local newspapers rose from only three in 1800 to 25 in 1825 and 36 by 1850.Footnote 13 Issues of the Commercial and Financial Chronicle show that the number of listings of New York banks continued to grow through the end of the century, rising to 46 by 1866, 50 by 1880, and 79 by 1897. Appendix Table 1, which lists the banks in my sample and the years of coverage for the key data items, indicates that the rise in listings was driven primarily by entrants joining the existing banks in the clearinghouse, and by a few preexisting banks that began to see their common shares quoted in the Chronicle.Footnote 14
Banks were among the more frequently quoted stocks in the early years of the New York Stock Exchange (NYSE) and comprised more than 50 percent of total listings as late as 1856, but the stock market itself remained relatively small. By 1870, however, investment bankers had become less interested in bank stocks, a large portion of which were held by institutional investors, in favor of riskier but higher-return railroad securities. Trades of bank stocks on the NYSE continued to appear in the official daily listings throughout the 1866–1897 period, but their volume on the exchange had slowed considerably by 1880.
It was not that trading in bank stocks had ceased. Rather, banking equities had attracted the interest of a different class of brokers and dealers who traded among themselves and with the public in their offices and at open-air auctions. This over-the-counter market for bank stocks was sufficiently active to yield regular brokers’ price quotations, which appeared several times per week in the financial press under the category of “local securities,” along with utilities, insurance companies, city debt issues, and other miscellaneous securities. And though it is not possible to estimate the volume of trades in bank stocks that took place in this market by the end of the century, the regular publication of brokers’ quotations and actual sales suggests that there was considerable public interest in their price and dividend records.Footnote 15 The usual positioning of price quotations in the New York Times and the Chronicle immediately following the periodic report on banking conditions in the city is also consistent with the view that they contained information relevant to the condition of individual banks.
Dividends and Prices
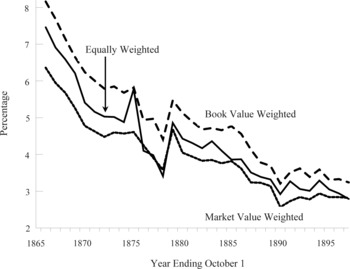
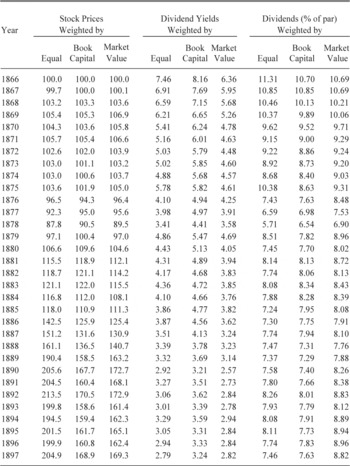
Figure 2 presents average annual dividend yields for all New York City banks listed in the Chronicle between 1866 and 1897. Appendix Table 2 presents these new data series in tabular form along with the price indexes constructed in this section. The dividend yields combine the averages of brokers’ bid and ask prices published closest to 1 October with any dividends paid over the subsequent one-year period.Footnote 16 A bank qualifies for inclusion in the index by having both a dividend and price reported in a given year. Since par and book capital are available for all banks with price observations, the series weighted by book and market values have the same coverage as the equally weighted yields.Footnote 17
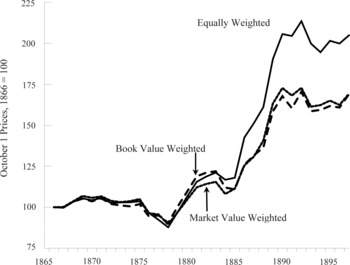
The striking feature of Figure 2 is the steady decline in dividend yields from more than 6 percent in the years immediately following the Civil War to about 3 percent by the 1890s. At first glance, this simply seems to reflect the general decline in dividends for stocks traded on the NYSE at this time. Unlike other NYSE stocks, however, the sharp decline in bank dividend yields between 1877 and 1890 was due to a sustained rise in bank stock prices rather than any dramatic change in dividend policy.Footnote 18 This rise is evident in Figure 3, which shows equal and value-weighted stock price indexes for traded New York City banks. Following a decade with no significant advance at the start of the sample, bank stock prices rose more than 65 percent between 1877 and 1890 on both an equal and book-weighted basis, and nearly doubled when weighted by market capitalization.Footnote 19 Since this was a time of gradual price deflation in the United States, the rise in bank values is even more dramatic in real terms. This stands in contrast to movements in the general level of NYSE stock prices, for which the index in Alfred Cowles and Associates shows no signs of advance between 1880 and 1900.Footnote 20
DIVIDEND YIELDS FOR TRADED NEW YORK CITY BANKS, 1866–1897

STOCK PRICES INDEXES FOR TRADED NEW YORK CITY BANKS, 1866–1897

The reluctance of most banks to raise dividends to reflect increases in their stock prices indicates either uncertainty among bankers about the sustainability of higher dividends or a shift in the New York market for bank equities that rendered dividends less important for distributing earnings and signaling future firm prospects. The latter explanation is more likely if prices were informative and investors came to expect a deepening equity market to facilitate the liquidation of assets at prices that reflected their intrinsic valuations. In this case, shareholders might prefer choosing when to take larger-than-usual profits or losses rather than insisting that banks signal their condition through more variable dividend distributions. Moreover, given that bank stocks had become quite profitable investments by the 1880s, with returns outperforming NYSE stocks by an average of more than 2.8 percent per year in that decade, owners would not wish to alarm depositors, who had became the main source of the higher earnings, by reducing par dividends.
Innovation and Sources of Depositor Confidence
There were a number of new and innovative practices adopted by the banks in New York City in the late nineteenth century that encouraged deposit growth, despite the period's typical characterization as one of inefficiency and excessive regulation.Footnote 21 By 1866, for example, the clearinghouse, which had been established in 1853, was actively arranging for interbank clearances between member banks and their correspondents. The expanded use of clearing facilities reduced balances in the process of collection and allowed banks to make more productive use of their funds. New York's banks had also accumulated a large share of the nation's interbank balances. This made membership in the clearing house all the more important, and nearly all of the city's banks had joined by 1870. Membership may have also sent a positive signal of operational soundness to potential depositors and those who traded banking equities because member banks were regularly listed on the stock exchange and in over-the-counter markets. Since the financial press published weekly balance sheet statements for clearing house members, there was also a good deal of other public information about their condition that was not as readily obtained for nonmembers and banks outside of the city.
As Sylla has shown, the rise of a market after 1880 for call loans, which were short-term loans made by banks to brokers to finance stock purchases and payable on demand, presented opportunities for the growing deposit base to fund screened, monitored, and easily liquidated loans to intermediaries that in turn facilitated the transfer of balances from the short-term to the long-term capital market.Footnote 22 Call loans made by New York banks grew from $56 million in 1875 to more than $200 million by 1897, with their share in total loans rising from one-third to more than one-half over the same period.Footnote 23
New York banks also turned to the market for commercial paper with increasing frequency to make investments for themselves and for their correspondents.Footnote 24 The market was encouraged by a shift away from insisting upon two-name paper in favor of accepting single-name paper, which grew in popularity as screening improved and greater diversification of bank portfolios made banks less hesitant to demand payment or forgo renewals upon maturity. Although the commercial paper market was still developing in 1880, by 1895 the increased diversification of bank portfolios associated with it made banks less vulnerable to defaults caused by calling back loans and forcing borrowers to liquidate assets quickly.Footnote 25
Along with commercial paper came the creation of credit departments within New York banks to advise correspondents and individual clients about direct investments in commercial enterprises. The Importers’ and Traders’ Bank was the first to establish such a department in 1880 and others quickly followed. Credit departments established more objective means for evaluating the condition of loan recipients to promote more efficient deployment of their available funds. By 1894 borrowers were in most cases required to provide a statement of condition with their applications. Since commercial loans were often renewed, monitoring long-term customer relationships became particularly important for anticipating financial difficulties and improving recovery rates through planned liquidations and restructuring.
In 1880 only about half of the national banks in New York City paid interest on deposits, but this percentage rose rapidly over the next five years so that by 1886 all clearinghouse banks did. This provided direct motivation for more individuals to place their excess funds with banks.
The establishment of the New York Clearinghouse Association in 1853 and its increased usage as the century progressed represents another important efficiency improvement for both its members and those banks that participated through a member agent. The gains came from the ability of a centralized facility to establish and settle the net positions of its members against each other on a daily basis, eliminating the need to send messengers with stacks of checks in crisscrossing routes from one bank to the next demanding a settlement of payments. This allowed banks to concentrate more on the business of offering lending and other services, and made them less vulnerable to shortages of cash brought about by variations in the speed with which accounts were collected across banks.Footnote 26
The innovations described above became important features of the banking terrain in New York. But the extent to which individual banks adopted them and put them to proficient use was difficult for individual depositors to discern. Prices, on the other hand, could potentially convey information about these more subtle sources of profitability that might elude the casual reader of a bank's balance sheet. This is especially true if equity holders were better informed than the public about the condition of individual banks and traded on this information. Given that holders of bank stocks in New York had been liable for losses up to double the par value of their shares since 1846, and that double liability tended to make ownership more dispersed to share the heightened risk, stockholders had a strong incentive to monitor their investments carefully.Footnote 27 This would allow individual depositors in effect to treat the stock price as a sufficient statistic for bank soundness.
DYNAMICS OF INFORMATION TRANSFER AND DEPOSIT GROWTH
The preceding narrative points to a process of dynamic adjustment through which individual depositors gained confidence in banks by observing medium-term stock price fluctuations and then made deposits based upon these signals. Evidence that changes in the prices of individual bank stocks from one year to the next influenced the time path of deposits for individual banks would offer support for this proposition. Items on bank balance sheets that reflected sound management and a record of profitability, such as large surpluses and undivided profits, might send similar signals to potential depositors. If depositors did not have ready access to balance sheets or were unable to interpret fluctuations therein from week to week, or if balance sheets failed to reflect innovative activities pursued by individual banks, the sheets themselves would be less important than price signals in attracting deposits. This is even more likely if depositors recognized that the balance sheets were susceptible to manipulation or “window dressing.”Footnote 28 Finally, though deposit growth in a bank could affect its stock price due to scale economies in lending or some other reason, an inability to identify feedback of this type in the data would bolster support for stock prices as a driving force behind the deposit expansion.
To model this process, I begin by examining dynamic interactions in multivariate systems that include the logarithms of total deposits (both individual and interbank), the sum of surplus and undivided profits, and stock price. Because surplus and undivided profits are available at the bank level from the annual Comptroller's Reports only for nationally chartered banks and only at the call date closest to 1 October, the annual observations for prices and deposits are sampled at approximately the same time.
A finding that price fluctuations were associated with the expansion of total deposits by itself would not shed light on whether individuals or institutions were the primary users of these signals. Such a distinction would be particularly important to draw given that balances “due to other banks” grew from $84 million in 1872 to $140 million in 1885 to an astounding $288 million by 1897 for the national banks in New York City. These three figures represent 32 percent, 41 percent, and 44 percent of total deposits.Footnote 29 Further, institutional investors would have had better access to both inside information and other less readily obtained public information about the soundness of a bank than the typical depositor, and would have been in a better position to monitor the performance of a bank's assets, particularly under a banking system where excess balances were often placed as call loans on the stock market. This suggests that individual deposits should have been more sensitive to stock price changes than interbank deposits. For this reason, I expand the dynamic systems to alternately include individual deposits and balances due to other banks.
Figures 2 and 3 show that New York's clearinghouse banks had been allowing their stock prices to rise rather than increasing dividends by the 1870s. This move suggests that much of the dividends’ informational content had already been muted, rendering them less important than stock prices in building confidence among depositors. This runs counter to the common belief that the stability of dividend streams and fixed par values led nineteenth-century equities to function essentially like bonds.Footnote 30 For this reason, I next consider the possibility that dividends still contained information about a bank's condition beyond that conveyed by price in a second set of dynamic systems that use dividend yields in place of surplus and undivided profits.
The investigation employs a series of vector autoregressive models using panel data. I estimate these systems using the generalized method of moments (GMM) technique.Footnote 31 The approach begins with a dynamic specification in levels and then differences it to eliminate bank-specific effects that by virtue of their likely correlation with the included system variables would otherwise contribute to omitted-variable bias. To the extent that prices and balance sheet items are related, collinearity among regressors may reduce the apparent impact of stock prices from what might be expected in simpler models. The findings thus offer conservative estimates of the importance of price discovery in deposit growth. After reporting the directions of timing relationships in the VARs with F-tests for block exogeneity, I evaluate the relative size of these effects over time by computing the impulse response functions.
Estimation
In a panel of N banks over T years, the dynamic systems have the form:


where, in the first system discussed below, di,t is deposits of bank i at time t, si,t is the sum of surplus and undivided profits, pi,t is the average of the bid and ask prices for the bank's stock, Φi is a vector of bank-specific fixed effects, Φt is a vector of time effects, and ∊i,t is a random disturbance whose distribution approximates the normal.
The specification of equations 1a, 1b, and 1c as a set of projection equations implies that the error terms ∊i,t are orthogonal to the fixed and time effects as well as lagged values of the endogenous variables. The model also includes the standard assumptions that the errors have a positive variance and are uncorrelated across cross-sectional units and time. A fixed-effects specification is preferable to a random effects alternative because the ηi are likely to represent omitted bank-specific characteristics that are correlated with the other explanatory variables, and the generalized least squares estimator for the random effects model under these conditions will be biased. The time effects allow for national shocks, such as those to income and prices, which may affect the system variables.
And the least squares dummy variable (LSDV) estimator is known to produce biased coefficient estimates when applied to equations with lagged values of the dependent variable and fixed effects in a data set with a small time dimension, the fixed effects are first removed by differencing.Footnote 32 The first equation of the VAR (1a) then becomes

with the other equations of the system defined similarly. The form of equation 2 makes clear the bias that may result from least squares estimation due to the possible correlation between the lags of the endogenous variables and the errors. I therefore use the predetermined lagged levels of the system variables as instruments to exploit a potentially large set of overidentifying restrictions and deliver consistent coefficient estimates. The technique also permits processing of an unbalanced panel. The VAR models take the form


where  and
 are first differences, and the errors of the transformed equations satisfy the orthogonality conditions
![\[
\begin{array}{c}
\mathrm{E}\left[d_{i,\thinspace r},\Bar{\varepsilon }_{i,t} \right]=\thinspace \mathrm{E}\left[s_{i,r},\Bar{\varepsilon }_{i,t} \right]=\mathrm{E}\left[p_{i,r},\Bar{\varepsilon }_{i,t} \right]=0\thinspace \thinspace \thinspace \thinspace \thinspace \thinspace \thinspace \mathrm{r}\left(\mathrm{t-1} \right)\thinspace
\end{array}
\](https://static.cambridge.org/binary/version/id/urn:cambridge.org:id:binary:20160921005858766-0085:S002205071100221X:S002205071100221X_eqn4.gif?pub-status=live)
These conditions imply that under the assumption of serially uncorrelated errors, the vector of instrumental variables available to identify the parameters of equation 3a has the form
![\[
\begin{array}{c}
z_{i,\thinspace t}=\thinspace \left[d_{i,\thinspace t-2},\mathellipsis, d_{i,1},s_{i,\thinspace t-2},\mathellipsis, s_{i,1},p_{i,\thinspace t-2},\mathellipsis, p_{i,\thinspace 1} \right]\thinspace
\end{array}
\](https://static.cambridge.org/binary/version/id/urn:cambridge.org:id:binary:20160921005858766-0085:S002205071100221X:S002205071100221X_eqn5.gif?pub-status=live)
Define Zi * as a block diagonal matrix whose rth block is given by equation 5 for r = 1,…T−2. Then the matrix of instrumental variables for each equation of the VAR is Z = (Z 1*,…,ZN *). Define X as the N(T−k−1) q design matrix stacked by cross-sectional unit with typical row
![\[
\begin{array}{c}
\Bar{x}_{i,\thinspace t}=\thinspace \left[\Bar{d}_{i,t-1},\mathellipsis, \Bar{d}_{i,t-k},\Bar{s}_{i,\thinspace t-1},\mathellipsis, \Bar{s}_{i,t-k},\Bar{p}_{i,\thinspace t-1},\mathellipsis, \Bar{p}_{i,t-k},\thinspace \varphi_{t} \right]\thinspace \thinspace \thinspace \thinspace \thinspace
\end{array}
\](https://static.cambridge.org/binary/version/id/urn:cambridge.org:id:binary:20160921005858766-0085:S002205071100221X:S002205071100221X_eqn6.gif?pub-status=live)
The GMM estimator for the coefficient vector [α1,..,αk,β1,..βk,γ1,..,γk,φ1,..φT] is then

where Y is a (T-lag-1)N × 1 vector of the stacked i dependent variables.
AN is given by

where H is a T−2 square matrix with twos in the main diagonals, minus ones in the first subdiagonals, and zeros otherwise.Footnote 33
Granger-causal patterns that may arise among the system variables are of particular interest. To facilitate this analysis, I construct F-tests for block exclusion based on the difference in criterion functions for the restricted and unrestricted models of the form
![\[
\begin{array}{c}
\thinspace \thinspace \thinspace \thinspace \thinspace \thinspace \thinspace \thinspace \thinspace \thinspace \thinspace \thinspace F\left(r,\thinspace obs-q \right)=\frac{\left[\left(\mathrm{e}_{\mathrm{R}}\mathrm{Z}\mathrm{A}_{\mathrm{N}}\mathrm{Z}^{\mathrm{'}}\mathrm{e}_{\mathrm{R}} \right)-\left(\mathrm{e}_{\mathrm{U}}\mathrm{Z}\mathrm{A}_{\mathrm{N}}\mathrm{Z}^{\mathrm{'}}\mathrm{e}_{\mathrm{U}} \right) \right]/r}{\mathrm{e}_{\mathrm{R}}^{\mathrm{'}}\mathrm{e}_{\mathrm{R}}/(obs-q)}\thinspace \thinspace
\end{array}
\](https://static.cambridge.org/binary/version/id/urn:cambridge.org:id:binary:20160921005858766-0085:S002205071100221X:S002205071100221X_eqn9.gif?pub-status=live)
where eR and eU are the residuals from the restricted and unrestricted models respectively, r is the number of restrictions, and obs is the number of observations in the panel.
RESULTS AND DISCUSSION
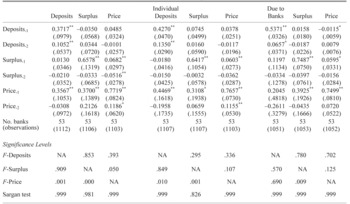
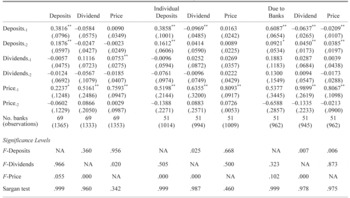
Table 1 presents estimates from the first set of panel VARs, which include bank stock prices along with the sum of surplus and undivided profits (hereafter referred to as simply “surplus”) in the baseline. Total deposits and their components—individual deposits and balances due to other banks—alternate as the third variable for the systems in the left, center, and right panels, respectively. Significance levels of F-tests for the exclusion of each variable block appear in the lower part of the table. The likelihood ratio tests described in Holtz-Eakin, Newey, and Rosen lead me to select models with a lag order of two.
The F-tests indicate that bank stock prices Granger-cause total deposits and individual deposits but not balances due other banks. Surplus does not Granger-cause deposits. Sargan tests for overidentification do not reject the validity of the instrument set for any of the VAR equations.
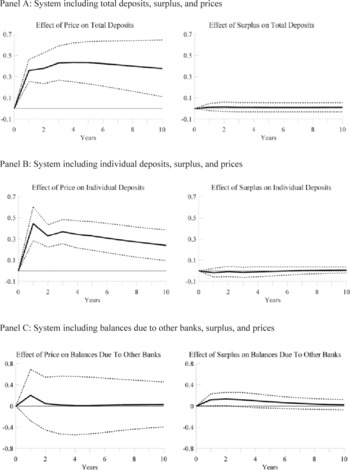
Figure 4 presents and compares the cumulative responses of the log of deposits and their components over a ten-year horizon to onetime shocks to the logs of bank stock prices (left) and surplus (right) in all three systems. Using Monte Carlo integration, the thick solid lines plot the mean impulse responses that result from 5,000 random draws from the estimated distributions of the coefficients shown in Table 1. The dashed lines are one standard error bands.
As suggested by the F-tests, total deposits and individual deposits have lasting responses to price signals that are economically important. For example, Panel A relates an increase in stock price of 1 percent, or about $1 per share for a typical bank stock with a par value of $100, to increases of about 0.4 percent in total deposits after five years. For the average bank in the sample, which had $5.4 million in total deposits and $0.6 million in surplus and undivided profits, a $10 change in the stock price would thus imply an increase of $220,000 million in total deposits after five years. The responses for the system with individual deposits on the left side of Panel B are similar to those in Panel A, although the initial response of individual deposits to a price shock is sharper. Panel C, on the other hand, shows small and statistically insignificant effects of price shocks on balances due to banks. This is perhaps not surprising given that interbank balances depended largely on excess balances of banks outside of New York City. Consistent with the Granger-causality tests in Table 1, the impulse responses of all three deposit variables to fluctuations in surplus are small and have lower one standard error bands that do not cross the horizontal “zero” line.
PANEL GMM ESTIMATES OF VAR SYSTEMS WITH DEPOSITS, SURPLUS AND PRICES OF BANKS TRADED IN THE NEW YORK STOCK MARKET, 1866–1897

* denotes statistical significance at the 10 percent level.
** denotes statistical significance at the 5 percent level.
Notes:
The table reports GMM estimates from VARs corresponding to equations 3a–3c in the text that use two lags of the system variables with robust standard errors in parentheses. Year effects are included in the equations but not reported. The system in the left panel includes total deposits, surplus, and stock price, while the center and right panels replace total deposits with individual deposits and balances due to other banks, respectively. The significance levels of F-statistics for block exclusion and Sargan tests of the overidentifying restrictions are reported in the lower part of the table.
In Table 2, annual dividends replace surplus in each system. Dividends do not Granger-cause total deposits or either of its components, although bank stock prices do Granger-cause dividends at the one percent level in all three systems. The relationships between stock prices and deposits are similar to those shown in Table 1, with bank stock prices Granger-causing total deposits in the left panel and individual deposits in the center panel at the 5 percent level, while balances due to other banks are only marginally and negatively responsive to prices in the right panel. Interbank balances also have a negative overall impact on dividends, suggesting that inflows of the nineteenth century equivalent of “hot money” were not necessarily conducive to strong bank performance.Footnote 34
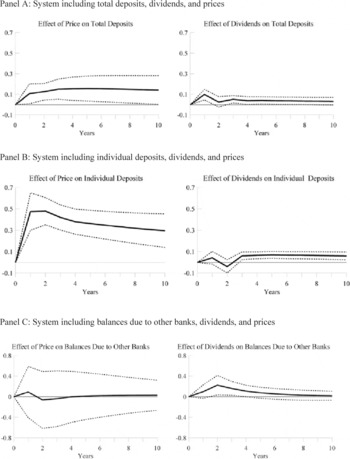
The impulse responses in Figure 5 compare the effects of bank stock prices and dividends on deposits. Specifically, the responses of total and individual deposits to price shocks are much sharper, persistent, and precisely estimated than the response of interbank balances. The size of the effects on individual deposits shown in Panel B are roughly the same as those obtained for the systems in Figure 4, while the effects on total deposits, though still positive and persistent, are somewhat smaller. The impulse responses of total and individual deposits to dividends are much smaller than their responses to stock prices.
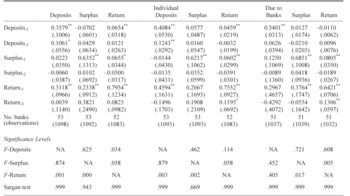
As a robustness check, Table 3 considers dynamic systems with deposits, surplus, and total returns on bank stocks to determine whether their behavior is consistent with the findings for systems with bank prices and dividends. As is apparent from Table 3, bank stock returns affect all three deposit measures in a manner similar to that of bank stock prices alone, confirming my finding that the appreciation of bank stock prices rather than dividends are the key component of returns that is associated with fluctuations in total and individual deposits.
IMPULSE RESPONSES OF DEPOSITS TO BANK PRICES AND SURPLUS

PANEL GMM ESTIMATES OF VAR SYSTEMS WITH DEPOSITS, DIVIDENDS, AND PRICES OF BANKS TRADED IN THE NEW YORK STOCK MARKET, 1866–1897

Notes:
See the notes to Table 1.
IMPULSE RESPONSES OF DEPOSITS TO BANK PRICES AND DIVIDENDS

PANEL GMM ESTIMATES OF VAR SYSTEMS WITH DEPOSITS, SURPLUS AND RETURNS OF BANKS TRADED IN THE NEW YORK STOCK MARKET, 1866–1897

Notes:
See the notes to Table 1.
CONCLUSION
The rise of deposit banking in the late-nineteenth-century United States is often viewed as a response to legislative actions and the release of pent-up demand for transactions services. The emphasis on deposits stands in contrast with the “wildcat” and free banking of the antebellum period when risky portfolio decisions, fraud, and outright defalcation by bank officers forced banks to rely largely on equity capital to fund their assets. I propose that an important shift in banking practices occurred during the first three decades of the National Banking period that increased public confidence in deposits and encouraged individuals to place their surplus balances with banks.
Given the pure form of the Modigliani-Miller theory and its “no magic in leverage” result, it is natural to ask how a shift in the composition of bank liabilities could affect the value of bank equities.Footnote 35 Yet we know that this result rests upon an assumption that all agents have equal access to the capital market and that there are no transactions costs, both of which were violated for the New York banks in the second half of the nineteenth century. In particular, double liability for bank shareholders and the inside nature of the dealer market, where dealers were informally responsible for keeping less sophisticated investors away, combined to create powerful frictions that made it difficult for banks to fund the needs of a growing economy through fresh equity issues alone. Deposits were thus the answer in an age when the profitability of note issue had been compromised through rules that required large amounts of bonds be held to back them.
The innovation of deposits, once the public could be convinced of their usefulness and provided with information about the quality of the institutions that they were considering, became an obvious way for banks to capitalize on their growing opportunities for funding productive investments, and the returns to deposits would be reflected in the prices of their own equities. This would have been particularly true for banks that made prudent loan decisions and monitored effectively after the loan. We often also think of taxes as a factor that would distort the basic Modigliani-Miller result, yet virtually all of the New York clearinghouse banks that I consider had taken national charters before the tax on state bank notes took effect on 1 October 1866; therefore there would have been no cross-sectional differences in the effects of taxes across banks over the period of my analysis.
The banks of New York City were leaders in a new and more professional form of banking, and ushered it in with a series of innovations that promised more efficient use of resources and a safer haven for accumulated wealth. With this professionalism came a leap in the information content of the market for bank stocks. Although not traded as actively on the New York Stock Exchange as they had been in the past, there remained enough interest in these securities in the over-the-counter market for the local newspapers to quote bank stock prices on a regular basis. The prices revealed in this market became sources of information about the condition of these institutions to which ordinary depositors could respond by placing their deposits with more successful ones. It is therefore not surprising that Moses King (King's Handbook of New York City, p. 665) wrote in 1892 that the stock of the Chemical National Bank “commands a greater price in proportion to its par value than any other bank stock in the world. It has the greatest surplus and undivided profits, with a single exception, of any bank in the country. It has by far the largest amount of individual deposits.” Nor was the correlation lost on W. Martin Swift, editor of the “Investment Department” section of Moody's Magazine, who in offering advice on picking bank stocks, wrote in 1912 that “in the first place the rate of growth in deposits, especially individual deposits, should be carefully observed since it is through this growth that earnings are increased.”
The emergence of a significant stock price elasticity of bank deposits, as demonstrated by the evidence, suggests that the New York equity market had finally come of age by the 1880s. One need not look very far back in recent history to see that this elasticity is still at work even in the presence of government-backed deposit insurance. An active market for industrial equities was soon to follow by the end of the nineteenth century with strong effects on growth in the manufacturing sector. To the extent that the deposit base fueled commercial loans and investments in this newer class of industrial securities, the New York market for bank stocks can be viewed even more broadly as a key component of the vigorous growth experienced by the nation as the century drew to a close.
Appendix
SAMPLE COVERAGE FOR NEW YORK CITY BANKS

Note:
Coverage for individual banks is based upon information contained in various issues of the Commercial and Financial Chronicle and U.S. Comptroller of the Currency, Annual Reports.