INTRODUCTION
One way of investigating how words are cognitively represented is to study the timecourse of vocabulary development in infants. There are several well-known findings: words that occur frequently tend to be learned earlier, as do words with fewer phonemes (see, for example, Storkel, Reference Storkel2004, Reference Storkel, Rickheit and Strohner2008, Reference Storkel2009; Storkel & Lee, Reference Storkel and Lee2011). Words containing frequently occurring phoneme sequences are also learned earlier (for example, Storkel, Reference Storkel2009). In this paper we focus on a property of words called neighbourhood density (ND), which has also been shown to be correlated with age of acquisition. Informally, words which have many ‘phonological neighbours’ are learned earlier than those with fewer neighbours. This is true for infants of all abilities, and continues to be true right across the lifespan (see Vitevich & Storkel, Reference Vitevich and Storkel2012, for a review). The ND of a word is a powerful indication of its learnability. For instance, from age 2;0 to 2;6 ND accounts for more of the variance in vocabulary size than word length and word frequency. Stokes and colleagues found that during this period ND accounts for 39%, 47%, and 53% of the variance in spoken lexicon size in English (Stokes, Reference Stokes2010, Reference Stokes2014), French (Stokes, Kern & dos Santos, Reference Stokes, Kern and dos Santos2012), and Danish (Stokes, Bleses, Basbøll & Lambertsen, Reference Stokes, Bleses, Basbøll and Lambertsen2012), respectively. In addition, the effect of ND on age of acquisition is particularly strong for a group of children termed late talkers — a group that makes up the slowest 10–20% of word learners. While most English-speaking children have learned an average of approximately 300 words by their second birthday (Stokes & Klee, Reference Stokes and Klee2009), the late talkers say fewer than 50 words by this age (Moyle, Stokes & Klee, Reference Moyle, Stokes and Klee2011). Stokes and colleagues (Stokes, Reference Stokes2010; Stokes, Kern & dos Santos, Reference Stokes, Kern and dos Santos2012; Stokes, Reference Stokes2014) showed that the ND effect is heightened for this group of children. In summary, both for theoretical and practical reasons, the ND effect is an intriguing source of evidence for models of vocabulary development.
At the same time, the origin and nature of the ND effect is still the subject of much debate. One issue is that ND partially correlates with many other measures of word learnability. For instance, words containing common phoneme sequences also have a higher-than-average ND, because the common sequences are likely to occur in other words. Short words also have higher average ND, because the space of possible neighbours for these words is smaller than for other words. In any explanation of the role of ND in vocabulary development, it is important to isolate the effect of ND from related effects such as these. Furthermore, if there is an isolable effect of ND, it is important to explain what it is about cognitive word representations that leads to this effect. There are several informal explanations of the advantage of high-ND words in language development. The basic idea behind most accounts is that new words are easier to learn if they are phonologically similar to known words, because their phonological representations can be encoded as modifications of existing representations, rather than having to be built from scratch (see, e.g. Storkel & Lee, Reference Storkel and Lee2011). However, it is important to express any such explanation formally, so it can be properly assessed.
In this paper, we present an account of the ND effect in the context of a computational model of vocabulary development: specifically, a neural network model. Methodologically, a computational model allows some novel ways for isolating the ND effect from other related effects on word learnability. And, if there is an isolable effect, it also provides a platform for a detailed explanation of the origin of the effect.
In fact, a number of existing network models of vocabulary learning have addressed issues related to ND. For instance, Dell, Juliano, and Godvinje (Reference Dell, Juliano and Govindjee1993), in a discussion of their early network model of phonological learning, proposed that frequently occurring phoneme sequences create ‘well-worn paths’ in the space of their network's phonological representations, which can participate in the representations of several distinct neighbouring words. But there are many outstanding questions. What exactly is a ‘well-worn path’? And do well-worn paths provide an advantage for words with high ND that is distinct from the advantages due to commonly occurring words or phoneme sequences?
A recent connectionist model by Vitevich and Storkel (Reference Vitevich and Storkel2012) set out explicitly to provide a detailed computational explanation of the ND effect. Vitevich and Storkel's model is an autoassociative network, with an input layer, an output layer, and one hidden layer. It is given a short sequence of three phonemes in its input layer, and learns to reproduce this same sequence in its output layer, via an intermediate hidden layer. The input and output layers represent phoneme sequences in a sparse parallel scheme: distinct groups of units represent the first, second, and third phonemes, respectively. The hidden layer is considerably smaller; during training, the network learns to represent phoneme sequences efficiently in this layer. The network shows a clear ND effect, learning high ND words better than low ND words. Moreover, this effect is also observed when the number of units in the hidden layer is reduced, to simulate learners with fewer processing resources. The observed ND effects cannot be attributed to word length or word frequency, as the training words all have the same length and are all presented with the same frequency: the networks are deliberately trained on an artificial lexicon, controlling for these variables.
Vitevich and Storkel (Reference Vitevich and Storkel2012) explain the effect of ND on learnability by appealing to the well-known conspiracy effect in neural network training (Rumelhart, McClelland & the PDP research group, Reference Rumelhart and McClelland1986). To store a training item, a training algorithm must make changes to the network's weights, but these must not cause it to forget other training items: algorithms therefore make small changes to all network weights in response to a given item, which conspire to bias it towards the right behaviour for this particular item, while minimally impacting its behaviour for other items. Crucially, if two training items share similarities of any kind, as in the case of phonological neighbours, the set of changes made for one item overlap with those made for the other, so learning one item indirectly helps to learn the other, meaning they are particularly easy to learn as a pair.
In the current paper, we present a new neural network model of vocabulary development, which extends Vitevich and Storkel's (Reference Vitevich and Storkel2012) account of the origin of the ND effect. Our model addresses four issues in Vitevich and Storkel's account.
First, Vitevich and Storkel's (Reference Vitevich and Storkel2012) model is trained on a set of artificial phonological word forms, rather than on naturally occurring words. Their decision to use artificial words is a deliberate one: by choosing training words that all have the same length and frequency, they are able to study the ND effect in isolation from effects due to these factors. But at the same time, it means that the model's training data is very different from that received by child language learners. Our model is trained on real words, containing variable numbers of phonemes, and occurring with their natural frequencies. This means that its performance is more directly comparable with that of infant language learners. We separate word-frequency and word-length effects from ND effects using regression methods, rather than by artificially holding these measures constant.
Second, while Vitevich and Storkel (Reference Vitevich and Storkel2012) control for the frequency of whole words, they do not control for the frequency of phoneme sequences within words. As already mentioned, words containing common phoneme sequences also tend to have higher ND, so the effects they attribute to high-ND words could also possibly be due to common phoneme sequences within words rather than to neighbourhood effects. In our regression analysis we separate out effects due to ND and to the frequency of within-word phoneme sequences.
Third, Vitevich and Storkel (Reference Vitevich and Storkel2012) do not consider the role of word meanings in their model of phonological development. Our network learns phonological representations of word forms, but it also learns to map word meanings onto these word forms. (Our model of ‘known word meanings’ is also based on actual infant data, as we will describe in the next section.) In our analysis, we find that an important component of the ND effect is due to the way the mapping between word meanings and word forms is learned. This raises the possibility that word meanings might play a role in the ND effect as it occurs in infants, and suggests some new ways of measuring the effect in infants, which we will discuss at the end of the paper.
Finally, the differences between ‘normal word learners’ and ‘late talkers’ in Vitevich and Storkel's (Reference Vitevich and Storkel2012) model are not quite the same as those found in children. As already mentioned, in children, the influence of ND on word learnability is stronger for late talkers than for normal word learners (Stokes, Reference Stokes2014). But in Vitevich and Storkel's (Reference Vitevich and Storkel2012) model, the ND effect is more pronounced for normal word learners than for late talkers (see, e.g. in Figure 3 of Vitevich & Storkel, Reference Vitevich and Storkel2012).
In the next section, we introduce our network model, describe its architecture and training regime, and show that it displays ND effects which are separable from several other factors which contribute to the learnability of words: word length, word frequency, and the frequency of biphones within words. We also show that these effects are very similar to the ND effects that have been found in children. In the section after that, we give a detailed explanation of how these ND effects arise during the model's training. We find that the circuit which learns how to map word meanings onto word forms plays an important role in making high-ND words more learnable. In the final section, we consider to what extent our explanation of the ND effects shown in the SRN may extend to those shown by children.
EXPERIMENT: WORD LEARNING WITH AN SRN MODEL
Model architecture and input/output representations
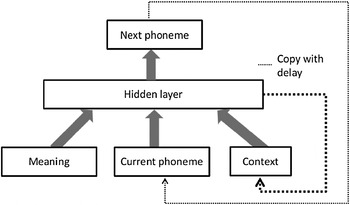
Our model of phonological/lexical learning takes the form of a simple recurrent network (SRN: Elman, Reference Elman1990). This differs from Vitevich and Storkel's (Reference Vitevich and Storkel2012) architecture: while their network represents the phonemes of each incoming training word in parallel, in spatially separate positions in its input layer, our network receives the phonemes of each word one at a time, in the same input medium. Our use of a recurrent architecture makes it somewhat easier to process words of arbitrary length, but we do not want to dwell too much on our choice of a recurrent architecture: there are long traditions of modelling word-processing mechanisms using both recurrent architectures (e.g. Dell et al., Reference Dell, Juliano and Govindjee1993; Cottrell & Plunkett, Reference Cottrell and Plunkett1994; Gaskell & Marslen-Wilson, Reference Gaskell and Marslen-Wilson1997; Christiansen, Allen & Seidenberg, Reference Christiansen, Allen and Seidenberg1998; Shillcock, Cairns, Chater & Levy, Reference Shillcock, Cairns, Chater, Levy, Broeder and Murre2000; Sibley, Kello, Plaut & Elman, Reference Sibley, Kello, Plaut and Elman2008) and non-recurrent architectures (e.g. Miikkulainen, Reference Miikkulainen1997; Li & MacWhinney, Reference Li and MacWhinney2002), and in fact it is quite likely the brain uses a mixture of parallel and recurrent methods to encode phoneme sequences, as it does when encoding prepared sensorimotor sequences more generally (see Takac & Knott, Reference Takac and Knott.2015, for a review). The architecture of our network is shown in Figure 1.
Architecture of our model of word production. Thick arrows represent full connectivity between layers.

The network takes as input a word meaning (Meaning), plus representations of the phoneme most recently produced and of the current context (Current phoneme and Context), both initialized to conventional values; it outputs a representation of the next phoneme to be produced (Next phoneme). Phonemes in the network are represented using a localist scheme: the current and next phoneme layers contain forty-eight units each: forty-seven English phonemes and one word boundary (WB) unit. We also use a localist scheme to code word meanings, so each word meaning is represented with a single unit in the network's meaning layer. (We could also use the term ‘lemma’ for our meaning units, since they are semantic representations that stand in 1:1 correspondence with specific words.) We use simple localist representations of meaning for two reasons. First, our aim is not to model how word meanings themselves are learned (e.g,. how the concept [dog] is acquired) but rather to model how associations between meanings and word forms are learned (e.g. how the mature concept [dog] comes to be associated with the word form dog). Second, using localist representations makes it easier to analyze the network's learning, as we will discuss later.
The next phoneme is predicted through an intermediate hidden layer of units, whose activities are copied to the context layer at the next time-point. In an SRN, the hidden layer learns to encode common sequences of phonemes encountered during training: a given pattern of activity in the hidden layer biases the network towards certain phoneme sequences. The capacity of the SRN to store sequences is determined by the number of units in the hidden layer. In our experiments, we use networks with different numbers of units in the hidden layer (5, 10, 15, or 20) to model word learners with different storage capacities.
Altering the size of the hidden layer is not the only way to vary the capacity of an SRN; in fact it reduces its representational capacity as well as its storage capacity. A way of reducing storage capacity by itself would be to add noise to the activity of the network's neurons, or to its weights; however, it is not clear which of these methods provides the best model of late talkers. Vitevich and Storkel (Reference Vitevich and Storkel2012) model capacity differences by varying the size of the hidden layer, so minimally our decision allows for comparisons with their model. (We also conducted some preliminary experiments reducing the capacity of the 20-hidden-unit network by adding noise rather than removing hidden units. We identified noise levels that produced learning curves comparable to the 15- and 10-hidden-unit networks. The age of acquisition of CDI words in these noise-contaminated networks correlated moderately well with the age of acquisition in their hidden-unit analogues, with correlation coefficients of 0·78 and 0·46, respectively, so the two manipulations have at least broadly similar effects.)
Our network is trained on a sample of monosyllabic words from an actual language (English). Each word is represented as a sequence of phonemes; there are 2,588 distinct words. We assume that the child can learn phonotactic patterns from all of these words, even without knowing their meaning. At the same time, we want to model the way learning word meanings interacts with learning phonotactics. We assume that the child can represent the meanings of some (small) proportion of the words it hears, and for these words, is in a position to learn a mapping from meanings to phonological sequences. We use the MacArthur-Bates Communicative Development Inventory (CDI) of English words (Fenson et al., Reference Fenson, Dale, Reznick, Thal, Bates, Hartung and Reilly1994), British English version (Klee & Harrison, Reference Klee and Harrison2001), as a simple estimate of the number of word meanings to include in our model. The inventory includes 672 words, including 268 monosyllables. In Fenson et al.,'s (Reference Fenson, Dale, Reznick, Thal, Bates, Hartung and Reilly1994) normed study, children in the 50th percentile of vocabulary size can produce around 600 of the words in the complete inventory by age 30 months. We estimate that most children at this age can produce all 268 monosyllables in the inventory, and therefore provide our model with meaning representations for these 268 words. During training, if the word form presented is one of the CDI words, the appropriate unit in the meaning layer is activated; for other words, there is no activity in the meaning layer. In summary, our network receives a stream of phonemes, in some cases associated with word meanings, and learns to predict the next phoneme in a word from the currently active phoneme (and meaning, if any).
The network's input units are fully connected to its hidden units, which are in turn fully connected to its output units. The hidden units have a sigmoid activation function; the output units are linear, and their activations are constrained to sum to 1 (by a softmax function), so they can be interpreted as representing a probability distribution of possible next phonemes. The context layer has the same number of units as the hidden layer and provides recurrence via copying values of the hidden units and providing them back as input with a time lag of one step.
Training regime and training data
The network is trained by the backpropagation-through-time algorithm (Werbos, Reference Werbos1990) with time-window 4 gradually reducing the error between its actual and desired output (target) for each input–target pair in the training set. The training set consists of phoneme sequences corresponding to English word forms, sometimes accompanied by meaning representations. During training on a CDI word, the meaning unit representing the word's meaning is turned on, the current phoneme unit is initialized to WB, and the network is trained to produce a sequence of input
 $ \to $
output pairs. Thus for the CDI word dog (phonologically /d/, /a/, /g/), the meaning unit representing the concept [dog] is turned on and the network is trained on the sequence ([dog],WB
 $ \to $
/d/), ([dog],/d/
 $ \to $
/a/), ([dog],/a/
 $ \to $
/g/), ([dog],/g/
 $ \to $
WB). (We use De Cara & Goswami's, Reference De Cara and Goswami2002, transcription system for phonemes.) While the network is training, the output phonemes are assumed to be produced covertly rather than overtly – they represent the network's tacit predictions about expected upcoming phonemes. If those predictions are wrong, the network adjusts its weights responsible for generated predictions. In this way, the backpropagation procedure relies on its own internal feedback signal rather than an external one. This technique is common to most SRN-based models of language learning, as discussed in Chang, Dell, and Bock (Reference Chang, Dell and Bock2006). Training proceeds in batches, which means the suggested error-driven weight changes are accumulated after each phoneme, but the actual weights are updated only after the complete word was presented. For a non-CDI word like ale (/e/, /l/), the sequence would be ([ ],WB
 $ \to $
/e/), ([ ],/e/
 $ \to $
/l/), ([ ],/l/
 $ \to $
WB) with no meaning unit activated. Of course, in this case the network cannot make perfect predictions, but recall that at this point the network is being trained, and is only generating covert predictions. Words with unknown meanings still provide opportunities to learn about the phonotactics of the language, and about word forms. In summary, the network's training mechanism means that for CDI words, both links from meanings to the hidden layer (embodying word-specific phonotactics) and from current phoneme to the hidden layer (embodying general phonotactics) are modified, while non-CDI words only result in modification of general phonotactics.
We based the training input to our network on the reference database of 2,588 English monosyllables (De Cara & Goswami, Reference De Cara and Goswami2002) obtained from all monosyllabic words found in the 17·9-million-word CELEX corpus (Baayen, Piepenbrock & van Rijn, Reference Baayen, Piepenbrock and van Rijn1995), excluding homophones, homographs, and abbreviations. (De Cara and Goswami's, Reference De Cara and Goswami2002, database in fact contains 4,086 monosyllables, but 1,498 of these are so rare they are listed as having ‘zero frequency’ in the corpus; we excluded these rare words.) In order to approximate a real language environment, we made the probability of a word appearing in our training set proportional to its frequency in the CELEX corpus (more precisely, the probability of a word with frequency WF in CELEX is proportional to log(WF + 1)). From these word types we stochastically generated 20,000 tokens that formed our training set. Out of the ambient 2,588 monosyllables, 268 word types were found in the CDI; their tokens were paired with appropriate meanings in the training set.
The network was repetitively exposed to the same training set for a certain number of epochs. (The order of the words was shuffled randomly in each epoch and the context layer was reset after each word to eliminate the effect of previous words.) Changes in the network during training are interpreted as developmental changes over time; the network at a given epoch is analogous to a child at a given age. To explore the influence of processing capacity, we created four groups of neural networks named by the number of units in their hidden layers: H5, H10, H15, H20. Each group consisted of ten ‘participants’ – different instances of the network with different randomly initialized connection weights. We stochastically generated ten different training sets, so that the ten ‘participants’ in each group could be matched by training set (i.e. the first subjects from each group were trained on set 1, the second subjects on set 2, and so on).
Training went on for 100 epochs. The learning rate parameter of the backpropagation process was set to linearly anneal from 0·04 in epoch 0 to 0·01 in epoch 50 (and to be constant thereafter), to prevent oscillations in learning. After each epoch, each network's connection weights were temporarily frozen and the networks were tested in a word production task, in which a sequence of phonemes was produced for each of the 268 CDI words. (These sequences can be understood as being overtly rather than covertly produced, since there is an associated meaning for each CDI word.) For each word, the network was prompted with a meaning and a ‘word boundary’ signal (e.g. [dog], WB). (The word boundary signal is a neutral initial phonological signal that is the same for all words.) The activity in the network was propagated through the hidden to the output layer; then the most active output unit was fed back as the current phoneme in the next step (while the meaning unit stayed active), and so on. Word generation finished when the network predicted WB, or when a preset limit of ten phonemes was reached.
We should emphasize that while our network is trained to generate sequences of phonemes, it is not only a model of word production. Its predictions about the next phoneme express general phonotactic constraints it has learned about the exposure language and knowledge of the forms of specific words, as well as knowledge of the mapping from meanings to word forms; these types of knowledge inform its predictions even when the network is not given a word meaning as input. When the network is given a word meaning, it does function as a simple model of word production, but we are not attempting to model the production process in any detail; we are not interested in reproducing patterns of error, timing data, priming effects, and so on. When we ask our model to produce word forms from meanings, our interest is mainly in examining how well it can combine its general knowledge of phonotactics with its specific knowledge of word forms to encode a mapping from meanings to word forms.
Results: factors influencing vocabulary learning in the SRN
To summarize the ability of each simulated ‘participant’ at each epoch to generate the phonetic form of CDI words from their meaning representations, we constructed a matrix participant × epoch × data, where data comprised actually generated phonetic sequences for all 268 CDI words. From this matrix, we computed for each participant the age of acquisition of each word: the first epoch in which the word was correctly produced for a particular meaning. We also computed the vocabulary size for each participant in each epoch, defined as the number of all words that the subject produced correctly from their meanings at that epoch. Finally, for each participant and epoch, we computed a number of measures for each word in its vocabulary at that epoch. For each word we computed its overall word frequency (WF), defined as the logarithm of the word's frequency as experienced by the learner.
We also computed the ND of each word. There are several possible measures of neighbourhood density: counts of neighbouring (i.e. different in a single phoneme) word types (ND), word tokens (frequency-weighted ND), or word tokens starting with the same onset (frequency-weighted cohort density; as in Magnuson, Dixon, Tanenhaus & Aslin, Reference Magnuson, Dixon, Tanenhaus and Aslin2007). We tried our regression analysis with models based on each of these: the frequency-weighted ND yielded the same results as ND – in fact, the two measures were highly correlated (r = ·96). Type- and token-based variants of cohort density made the model worse. Hence, in this paper we report results using the type-based definition of ND. There are also two ways of defining the neighbourhood of a word. It is normally defined over the complete ambient language to which a learner is exposed. However, it may be preferable to define it over the set of words that are actually known by the learner, because these are the words whose representations are most likely to be helpful. Accordingly we measured the exposed language ND of each word (henceforth simply exposed ND), defined as the number of neighbours the word has in the complete ambient language experienced by the learner, and the known ND of each word, defined as the number of neighbours the word has in the set of CDI words (i.e. in the set of words whose meanings are assumed to be already known). We also computed a measure of the frequency of the biphones contained in each word. Again, we computed two measures: a word's exposed biphone frequency was defined as the sum of the log frequencies of all the word's biphones in the training corpus, divided by the length of the word, and its known biphone frequency was defined as the sum of the log frequencies of the word's biphones in the set of CDI words, divided by the length of the word. In addition to these measures, we also calculated frequencies, NDs, and biphone frequencies over the whole CELEX corpus, rather than the subset to which the learner had been exposed. Not surprisingly, these general measures tended to be correlated with the more local predictors, but somewhat less effective at predicting the model's behaviour.
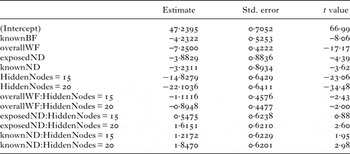
We excluded networks with a Hidden Node size of 5, as very little learning occurred in that group. We also converted all variables to z-scores (i.e. they were scaled and centred). We then fitted a linear mixed effects regression model over all remaining data, where each word was included in the dataset once for each participant modelled. The dependent variable being modelled was the age of acquisition of the word (i.e. the epoch in which it was acquired by the learner). The ‘participant’ and the word identity were included as random effects in the model. Significant predictors were overall word frequency, known biphone frequency, hidden node size, exposed ND, and known ND. We also tested for interactions with hidden node size, and found significant interactions between hidden node size and word frequency, hidden node size and exposed ND, and hidden node size and known ND. Word length was tested in the model but was not significant.
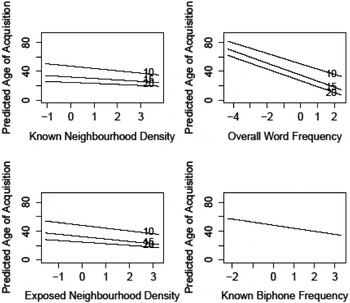
The model estimates are shown in Table 1. The model intercept provides a baseline estimate of age of acquisition. The adjustments to this for each factor are given in the estimate column. These values provide an estimate of the effect of each predictor on the dependent variable, when all other predictors are held constant. The calculation of these estimates is not sensitive to the order in which the predictors are entered into the model. For continuous predictors, the estimate shows how much age of acquisition is predicted to change per unit of change of the independent predictor. The only categorical predictor is hidden node size. A hidden node size of 10 is chosen as the default (i.e. it receives an estimate of 0). The estimates for hidden node sizes of 15 and 20 show the predicted effect on the model of hidden nodes of these sizes, as compared to the default of 10. The estimates for the interactions show the added adjustments to the predicted age of acquisition caused by the combined effect of the two interacting factors. All main effects show t-values considerably above the oft-agreed upon metric of |t| >2 for significance. Model selection proceeded via direct model comparison, guided by Akaike's and Bayesian Information Criteria (AIC and BIC; Dziak, Coffman, Lanza, & Li, Reference Dziak, Coffman, Lanza and Li2012). This procedure justified retention of all factors retained in the final model. The model predictions are shown in Figure 2.
The effects of known (top left) and exposed (bottom left) Neighbourhood Density; Word Frequency (top right) and known Biphone Frequency (bottom right) upon predicted Age of Acquisition (all variables on the x axes were converted to z-scores). For factors which interact with Hidden Node Size, separate predictions are shown for Hidden Node sizes of 10, 15, and 20.

Mixed effects linear regression model, predicting age of acquisition of words

notes: BF = biphone frequency; WF = word frequency; ND = neighbourhood density.
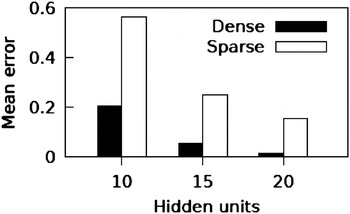
Unsurprisingly, learning occurs earlier if there are more hidden nodes. The number of hidden nodes interacts both with word frequency and both types of ND. The leftmost panels in Figure 2 show the effects of Neighbourhood Density, as calculated over all words the learner is exposed to (bottom left), and just those words which are explicitly known (top left). Both of these factors have separate contributions. While they are correlated with one another, the model does not contain problematic levels of co-linearity. If we attempt to residualize one upon the other, essentially the same model is returned, with significant effects of both values. In both cases, the effect of Neighbourhood Density is more pronounced at smaller Hidden Node sizes than larger ones. Or, put differently, the effect of ND is particularly pronounced for the slower learner. This is in line with data from infants; recall that late talkers have a larger proportion of high-ND words in their vocabularies than normal learners (Stokes, Reference Stokes2014). On the other hand, in Vitevich and Storkel's (Reference Vitevich and Storkel2012) model, the effect of Neighbourhood Density on learnability is more pronounced for ‘normal learners’ than for ‘impaired learners’ – an effect that runs in the opposite direction. For ease of comparison, we analyzed our data using a similar method to that of Vitevich and Storkel in their Experiment 3: we identified two groups of words with ‘sparse’ and ‘dense’ neighbourhoods. (Because meaning was not represented in Vitevich and Storkel's model, we used exposed ND to define these neighbourhoods: the ‘sparse’ group contained words with exposed ND less than the mean (15·4) minus one standard deviation (10·2); the ‘dense’ group contained words with ND more than the mean plus one standard deviation. However, the obtained result was very robust and did not change for different density thresholds or even when known ND was used.) For each group we measured the mean error in generation by networks with different numbers of hidden nodes, at a particular epoch of training (epoch 50). As before, we excluded the network with 5 hidden nodes, as very little learning happened in that network. The ANOVA showed the same significant main effects of neighbourhood density and number of hidden units as in Vitevich and Storkel, and a significant interaction between the ND effect and the number of hidden nodes in the opposite direction – see Figure 3, which is directly comparable to Figure 3 of Vitevich and Storkel: as network capacity increases, networks make fewer errors overall, but the effect is greater for sparse words than for dense words (F(2, 2496) = 37.6, p <.001).
Mean proportion of errors for ‘sparse’ and ‘dense’ words in networks with different capacities at epoch 50. Sparse words are those with 0–5 neighbours in the exposure language (on average 40 words); dense words are those with 26–50 neighbours (on average 43 words). The error is measured as the proportion of incorrectly pronounced phonemes in a word, averaged across all words in a sparse/dense group and all 10 networks with the same hidden layer size.

The top right panel of Figure 2 shows the effect of word frequency. Unsurprisingly, higher-frequency words are learned earlier. This also interacts very slightly with Hidden Node Size, though in this case, the effect of Word Frequency is marginally larger for higher Hidden Node Sizes. Finally, the bottom right panel shows the main effect of biphone frequency. Words with higher biphone frequency – as calculated across known words – are learned earlier. Biphone frequency over all exposed words does not have as much explanatory power – a fact we will return to later. It is significant only in a model that excludes Known Biphone Frequency, and that model is inferior to the one reported here. Exposed Biphone Frequency does not contribute to the current model, either in its untransformed state, or when residualized against Known Biphone Frequency.
This model demonstrates clearly that there is an effect of ND on the model's word acquisition patterns. The model considers individual words, and when they are learned, but does not directly track the vocabulary size of the ‘learners’, and how this might be predicted by various factors. To do this, we calculated the total vocabulary size of each learner, at each point at which a new word was added to its vocabulary. We also calculated the average ND of the vocabulary at each point. We were interested in directly testing the question of whether the average ND at any point in a learner's development could be predicted by that learner's vocabulary size. To ask this question, we fitted three separate models, considering the three hidden node sizes separately. The individual learner was a random effect in the model. For the purposes of this exploration, we used a canonical definition of ND – simply taking the ND of each word, with reference to the CELEX lexical database, a value we refer to as Average CELEX ND. The rationale for taking this approach is that ND calculations in the experimental literature are not conducted locally – largely because it would be impractical to assess the actual vocabulary of any given speaker or learner. Rather, what has been shown in the literature is overall correlations between an independently calculated ND, and factors such as age of acquisition or vocabulary (Stokes, Reference Stokes2014). We were interested in assessing whether such broad correlations would also hold in our own, simulated, data.
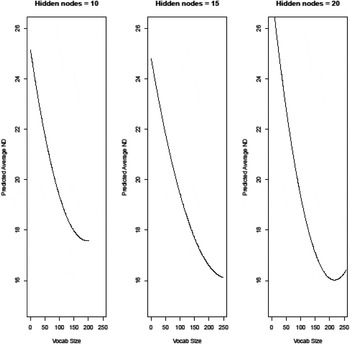
For all three models, vocabulary size was a significant, and non-linear, predictor of Average CELEX ND (p <.0001 for both components of the quadratic, in all three models). The model effects are shown in Figure 4. What can be seen is that for all hidden node sizes, there is a relationship between vocabulary size and Average CELEX ND. When there is a hidden node size of 10, the system plateaus at a vocabulary size of about 200, and an Average CELEX ND of about 18. For the larger hidden node sizes, the vocabulary grows larger, and the average ND grows smaller.
Predicted effect of vocabulary size on Average ND, across slow, medium, and fast learners.

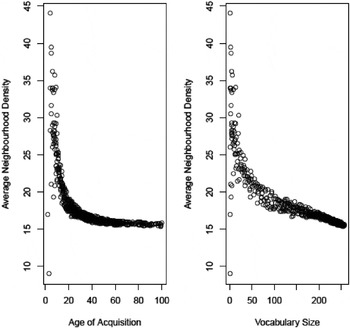
Similar results can be obtained if we consider the relationship between Average CELEX ND and age of acquisition. This is because age of acquisition and vocabulary size at time of acquisition are so highly correlated. To illustrate the relationship, we plot, in Figure 5, the raw data for learners with 20 hidden nodes. On the left we see the relationship between the age of acquisition of vocabulary items and the Average CELEX ND at time of acquisition. On the right we see the relationship between different vocabulary sizes and Average CELEX ND (as modelled above). Visual inspection of these graphs reveals that age of acquisition is predictive of average CELEX ND only in the initial stages (for the first 20 words or so), but total vocabulary size continues to have some relationship with ND throughout the period we are modelling.
Scatterplots of the relationship between average CELEX ND and age of acquisition and vocabulary size for SRN learners with 20 hidden nodes.

In sum, there is clear and robust evidence in this simulation for a relationship between average ND and vocabulary size / age of acquisition, over and above the effects of word length, word frequency, and word biphone frequency. Words which are acquired earlier, and by learners with small vocabularies, have higher ND, and the early stages of acquisition are thus characterized by high average ND. These results extend the results of Vitevich and Storkel (Reference Vitevich and Storkel2012), in that they are obtained using a naturalistic set of training words, with variable lengths and frequencies, and in that they show an effect of ND that is separable from the effect of biphone frequency. The model of age of acquisition of particular words shows that this is driven by local characteristics of words that the learner has been exposed to, and knows. However, because these local ND figures are highly correlated with ND as calculated over the ambient language, broad correlations between age of acquisition / vocabulary size and ND, as calculated over the CELEX lexical database, emerge as strong and significant.
Comparisons with child language data
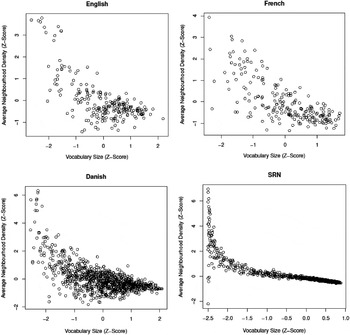
Since our network's training words are modelled on the words actually encountered by children, we can make certain direct comparisons between the performance of our trained models and that of children. The relationship between average ND and lexicon size found in our SRN simulations reflects a result consistently found in children's productive lexicons. As noted in the ‘Introduction’, in hierarchical multiple regression studies of English, French, and Danish children, average ND consistently accounted for a significant portion of the variance in expressive lexicon size (Stokes, Reference Stokes2010, Reference Stokes2014; Stokes, Bleses et al., Reference Stokes, Bleses, Basbøll and Lambertsen2012; Stokes, Kern & dos Santos, Reference Stokes, Kern and dos Santos2012). Scatterplots of ND against lexicon size for English, French, and Danish children in the data obtained by Stokes and colleagues are similar to those generated by SRN models, as shown in Figure 6. Note that the ND calculations in these empirical reports are necessarily not local to the speakers, but rather derive their values from overall vocabularies, such as CELEX. (Note that, for the child data, lexicons smaller than 20 words were excluded to avoid heteroscedasticity of the distributions.) There is a clear trend from high to low average ND as vocabulary size increases, in both the child and SRN data. (Recall that in Vitevich and Storkel's, Reference Vitevich and Storkel2012, model the trend is in the opposite direction: ND has a greater impact on word learnability for higher-capacity learners.) In our simulation there is also a clear trend from high to low variance in average ND as vocabulary size increases, which again matches the trend in the child data. The overall variance in average ND is certainly lower in our simulations than in children. This may be because children have a wider range of memory capacities than are modelled in the simulations. It may also reflect the fact that the SRN scatterplots are derived from only ten individuals sampled at different times, while each point in the child scatterplots comes from a separate child.
Scatterplots of ND against lexicon size. English children (top left), French children (top right), Danish children (bottom left), and the SRN simulations (bottom right), all using Average CELEX ND.

AN EXPLANATION OF THE ND EFFECT IN THE NETWORK'S WORD LEARNING
In this section we provide a formal explanation of why high ND words are learned earlier in our SRN model. As background, we first show empirically that the model's learning starts with predominantly phonological learning and we analyze the relation between learning from known and unknown words. We then describe the network's computations formally, as the application of a set of geometric transformations. Finally, we show that word meanings are learned as biases on these transformations, and show how the ND effect emerges from this fact.
A coarse-grained analysis of the network's learning
Recall from our regression analysis that significant predictors of the age of acquisition of a word are its frequency, its biphone frequency with respect to known/CDI words and its ND with respect both to known words and to the whole training set. In this section we focus on the relation between learning general phonotactics, i.e. phoneme transition probabilities learned from a group of words, and learning word-specific transitions.
Since the network's output layer can be interpreted as holding a probability distribution for the next phoneme (as we discussed in the ‘Model architecture’ section), its performance can be compared directly to that of a traditional probabilistic model. Hidden Markov models (HMMs) are a natural choice of probabilistic model for time series data. A useful way of roughly charting the network's learning is to compare its predictions at each epoch to those of a range of different HMMs, to find which model fits best.
All HMMs were trained on the same training set as a randomly chosen SRN in the H20 group (i.e. one with the highest memory capacity of 20 hidden neurons), and recorded next phoneme transition frequencies/probabilities for given information such as n previous phonemes in the presence/absence of a meaning.
HMMs in the first class (referred to as Gen_n) do not record transitions for individual meanings separately, i.e. they learn to predict the next phoneme from bigrams, trigrams, tetragrams, etc. of the set of words they were exposed to. More formally, Gen_n models predict the next phoneme c(t) at time t based solely on the n previous phonemes. The predicted phoneme c i is the one that maximizes the probability:
 $$Pr\left( {{c_i}\; \vert \;c(t - 1), \ldots, c(t - n)} \right)\;.$$
HMMs in the second class (M_n) are similar to Gen_n models, but additionally include the word meaning M. The predicted phoneme c i is the one that maximizes the probability:
 $$Pr\left( {{c_i}\; \vert \;c(t - 1), \ldots, c(t - n), M} \right)\;.$$
To compare predictions of the SRN with those of the HMMs, we took the phoneme sequences generated by the SRN for each of the 268 CDI words after each epoch of training and compared them with those generated by each trained HMM, computing the proportion of matching phonemes.
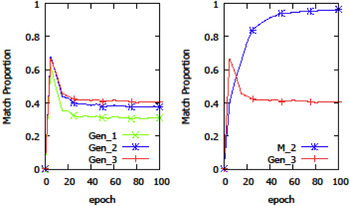
Early in training, around epoch 5, the HMMs that most closely match the SRN's predictions are those that make no reference to word meaning (see Figure 7 left). As training proceeds, HMMs learn to predict from gradually longer histories, but around epoch 10 the HMMs that incorporate word meaning provide a progressively better fit (see Figure 7 right). The best of these make reference to the previous two phonemes. (Adding histories longer than three preceding phonemes – not shown in the graph – did not improve the result.) From this same point, the role of general phonology in predicting the next phoneme actually reduces somewhat, as word meanings take over responsibility for predicting the next phoneme.
Proportion of matching phonemes between the SRN predictions after different amount of training and predictions of probabilistic models. Left: Ngram-based models with no meaning input. Right: Comparison of a tetragram model (Gen_3) with a meaning-based trigram model (M_2).

In summary, the SRN's learning happens in two overlapping stages. It begins by predicting the next phoneme using just several preceding phonemes. At this stage it is mainly learning about the phonotactics of the exposure language. At around epoch 10 it starts to use the word's meaning to supplement its phonotactic learning.
Note that it is at the point when the network is transitioning between the models based on general phonology and models using meaning-specific knowledge (around epochs 10–15; see Figure 7 right) that the strongest ND effect is observed (as can be seen in Figure 5 left). At this intermediate point, general phonology still has a strong enough influence to drive the system towards generation of frequently occurring phoneme sequences, but at the same time, meanings have enough of a role to bias the generation towards phonemes correct for a particular word.
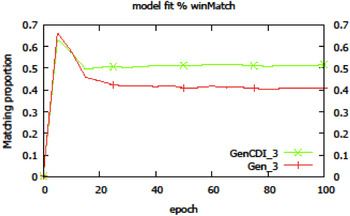
The results from our regression analysis show that the biphone frequency (BF) with respect to known/CDI words is a better age-of-acquisition predictor than the BF computed from all words in the training set. It looks as if the SRN gave transitions within known/CDI words more weight than those within unknown ambient words. To test this, we trained another class of HMMs and compared it with the SRN in the same way as described in the previous section. The new class GenCDI_n is similar to Gen_n class in learning transitions from previous n phonemes collectively for a group of words, but this time ignoring all non-CDI words in the training set. Figure 8 shows that with more training the new model gradually fits the behaviour of the SRN better that the model trained on all the words.
Proportion of matching phonemes between the SRN predictions after different amount of training and predictions of probabilistic models. Comparison of a tetragram model trained on the whole training set (Gen_3) with a tetragram model ignoring unknown words (GenCDI_3).

What makes CDI words special? Recall that CDI words in our training set represent the words with known meaning: each time such a word is presented as a sequence of ‘current phoneme
 $ \to $
next phoneme’ transitions, a particular meaning unit is activated and stays active during the whole sequence presentation, while non-CDI words are presented just as phoneme transitions without any activity in the meaning layer.
The backpropagation learning rule only modifies weights of connections from currently active units, so even though the training algorithm minimizes the error evenly over the whole training set (in fact frequently occurring transitions have stronger influence), in the case of known words it has extra parameters to use for fine-tuning – the connections from the active meaning unit to the hidden layer.
The network learns from transitions both in known words and in unknown ones. However, weight changes for ambient words can cancel or weaken each other. For example, when trained on the first transition of the ambient word beast, the network adjusts its weights closer to generating ([ ],WB
 $ \to $
/b/), while when trained on the first transition of the ambient word sound, the network adjusts its weights closer to generating ([ ],WB
 $ \to $
/s/). There is nothing in the input to differentiate these two cases from each other, so the network has to learn from two conflicting transitions. (For later positions in the word, there is some information differentiating the cases in the context vector encoding the history of previous transitions.)
In contrast with this, for known words there is an extra part of the input to differentiate transitions – the meaning. For example ([bed],WB
 $ \to $
/b/) and ([snow],WB
 $ \to $
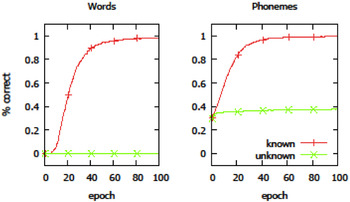
/s/) are no longer conflicting because of different meanings. Hence the training input is noisier for unknown words and the network learns transitions in known words more effectively. To confirm this, we monitored the network's predictions about the next phoneme while it was training, for words with meanings and for words without meanings. (Recall that these predictions are made ‘covertly’, and are not part of actual word production.) The results are summarized in Figure 9. The left graph ‘Words’ compares percentages of successfully generated known and unknown words. We see that the network completely fails to learn whole unknown words – mostly because it fails to generate the first phoneme in the absence of meaning information. The right graph ‘Phonemes’ compares percentages of correctly generated phonemes. We see that, after training, the network gets about 40% of unknown-words transitions right, and almost all known-words transitions.
Proportion of correctly generated words (left) and phonemes (right) during training evaluated separately for words with meaning (known) and without meaning (unknown).

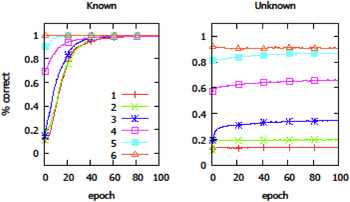
It is interesting to measure the prediction success for each position within a word separately (Figure 10). We see that for known words, the position does not make much difference as long as the meaning is present. For unknown words, the prediction gets gradually better with the number of phonemes seen (as a long enough fragment can uniquely identify the word to be generated).
Proportion of correctly generated phonemes during training evaluated separately for each phoneme position within a word. Left: words with meaning (known). Right: words without meaning (unknown).

In summary, the network is more effective in learning transitions from words with known meaning, i.e. in a word learning context, than from unknown words that are perceived as streams of phonemes. In the following sections we will focus on the neighbourhood density effect. While BF relates to individual transitions, ND relates to whole words. Our explanation of the ND effect is based on the idea that general phonotactics defines ‘well-worn paths’, as discussed in the ‘Introduction’; the effect of meaning is to provide a bias able to deviate from a highway just enough to generate a specific word correctly. We will express this idea more formally as geometric transformations in the hidden layer vector space in the following two sections.
A geometric analysis of the network's computations
The computations the SRN performs in order to convert its input to its output have a well-known geometric interpretation. We consider first the hidden layer. If there are n neurons in the hidden layer, we can think of any static pattern of activity in this layer as a point in an n-dimensional space. This point is defined by an n-dimensional vector: we will term this vector the hidden state vector, and the n-dimensional space of hidden units the hidden space. Each output neuron (representing one particular phoneme) is connected to the n hidden neurons by n connections. Since there is one connection from each hidden neuron, the connections to each output neuron can also be thought of as forming a vector in the n-dimensional hidden space; we will term this vector the output weight vector. All the output neurons are linear, i.e. their activities are computed as a scalar product of the hidden state vector and their weight vector. These scalar products can be interpreted as projections of the weights vectors on the hidden state vector. This means that for a given hidden state vector, the lengths of all the output weight vector projections directly specify a probability distribution of possible next phonemes, and thus determine the phoneme that will be produced – namely, the one whose output neuron has the longest projection. (See the ‘Appendix’ for mathematical details.)
Geometrically, it is useful to think of the SRN's current hidden state vector as indicating a point on an n-dimensional hypersphere. The output weight vectors effectively partition the surface of this sphere into regions, each associated with a single phoneme. The region to which the hidden state vector points at a given iteration indicates which phoneme will be produced at that iteration. Over a sequence of iterations, the hidden state vector moves through a trajectory of points on the hypersphere, resulting in a sequence of associated phonemes. These trajectories are a formal way of thinking about the ‘paths’ in the space of hidden unit activities discussed by Dell et al. (Reference Dell, Juliano and Govindjee1993) in their informal explanation of the density effect.
An explanation of the network's learning and the ND effect
We now consider the process by which the network learns. Its task is to learn the correct probability distribution for each possible position in each possible word so that the error summed over the whole training set is minimized. The network does this by adjusting both the hidden state vectors (by modifying connections from input to hidden neurons) and the output weight vectors (the connections from hidden to output neurons).
We have shown in the previous sections that early in training the behaviour of the network resembles a probabilistic model based on general phonotactics. This is mostly because the network ‘hears’ many more words than it ‘understands’: most words presented during training are simply phonological sequences, with no active meaning representation. Only words in the CDI set have associated meanings, and these words make up only 15% of all training words – a fairly realistic approximation of the training data to which CDI-aged children are exposed, as already discussed. In fact, given that the backpropagation rule only modifies connections from units with non-zero activity, for non-CDI training words there are no changes made at all to the connections from semantic units to hidden units: so the connections from the current phoneme and context units to the hidden units, and those from the hidden units to the next phoneme units, are modified without any reference to semantics fully 85% of the time; only 15% of their learning is done with reference to meaning, but as we have shown in the previous section, the presence of meaning creates less noisy data and makes also learning of general phonology of known words more effective.
Let's focus on the means that the network has to use meaning information. Given that most of the system's learning is purely phonological, its learning about how to map specific word meanings onto specific phoneme sequences involves making modifications to its general phonological learning. These modifications can involve changes to connections from all input layers to the hidden layer, since learning from CDI words allows adaptations in all these connections.
But, clearly, the most obvious modifications to make are to the connections from meaning units to hidden units. Meaning units are the only ones that can store information about specific words. And we know that these connections play an important role in an explanation of the ND effect because, as we discuss in our regression analysis, a word's ND is a better predictor of its learnability if neighbourhood is defined over the set of CDI words with known meanings than over the full set of ambient words.
Each meaning unit has an n-dimensional vector of connections linking it to the n hidden units. Using the terminology introduced earlier, we will term this vector the meaning weight vector. As just discussed, the network must store information about specific words ‘on top of’ its information about general phonology. In the geometric terms introduced earlier, the primary role of the meaning weight vector for a given meaning unit must be to rotate or bias the hidden state vector so that the resulting projections of the output weight vector reflect phoneme transition probabilities conditional on the currently active meaning. For instance, the network's general phonological learning includes the fact that the most probable first phoneme in English monosyllables is /s/, but when the word meaning [dog] is presented, the first phoneme should be /d/; the meaning weight vector should therefore rotate the hidden state vector, so that it points to a region of the hypersphere associated with /d/ rather than /s/.
The meaning weight vector is held constant throughout the presentation of a known word. The bias it exerts on the hidden state vector while the word is generated has two components: a static and a dynamic one. The static one is the constant meaning weight vector itself; the dynamic one is a changing context vector that reflects the history of past hidden state vectors. (As the past hidden state vectors themselves were influenced by the meaning weight vector, the autonomous dynamics of the unfolding context can contain traces of meaning too.) Setting the bias correctly therefore involves satisfying multiple simultaneous constraints: it must exert the right influence on the hidden state vector both directly and through the context for each phoneme transition in the word. Recall that in the geometric interpretation introduced earlier, the network's activity in successive iterations describes a trajectory of points on an n-dimensional hypersphere, partitioned into discrete regions associated with different output phonemes. The network's general phonological knowledge can be thought of as defining a set of trajectories on the surface of this sphere. The function of a given meaning weight vector is to exert a bias on these trajectories, so as to produce a particular phoneme sequence.
Note that a bias will only change the network's output if it results in points on the trajectory crossing boundaries between regions on the hypersphere. This allows for subtle biases that preserve common phonological sequences when appropriate, and deviate only when necessary. The use of small analogue changes to achieve appropriate discrete effects in the output of SRNs is known in the literature, and often called shading (Servan-Schreiber, Cleeremans & McClelland, Reference Servan-Schreiber, Cleeremans and McClelland1991).
Finding a meaning weight vector that delivers an appropriate bias can be a difficult task. In fact, the difficulty of the task is determined by the size of the hidden layer: if the dimensionality of the hidden space is large, the simultaneous constraints become easier to solve. (For instance, a ‘spare’ dimension can be recruited to hold a bias specific to the given meaning, or several dimensions can ‘conspire’ to hold a bias that does not affect the network's other computations.) The problem of finding a suitable bias is analogous to the problem of placing n points in a t-dimensional space so that their mutual distances monotonically preserve their dissimilarities. Kruskal's (Reference Kruskal1964) work on multidimensional scaling showed that the higher thet, the better the solution – and that a perfect solution preserving all the relations always exists for t = n − 1. (Whether backpropagation would always find this solution is another matter.)
Even so, regardless of the size of the hidden layer, the task of finding an appropriate meaning weight vector is easier in some cases than others. For one thing, it is easier to the extent that a word conforms to general phonological rules. The role of the meaning weight vector is then to maintain the hidden state vector in areas preserving general phoneme transition probabilities while biasing it away in areas which require word-specific transitions. But, separately to this, and more relevantly for our current concerns, it is easier to find a suitable meaning weight vector for a word if the SRN already knows a phonologically similar word.
If a bias has already been found that creates a particular phonological trajectory, then it is likely that a similar bias can be found, which deviates just enough from the first one to produce the different phonemes in the word while retaining the similar ones. (Again, always assuming the dimensionality of the hidden space is high enough.) In summary, the increased learnability of words with high ND can be attributed to the fact that they apply similar biases to the trajectories encoding general phonological rules within the network. The heightened advantage for high ND words when word meanings first start to be learned (during epochs 5–10) can be attributed to the fact that it is at this stage of learning that meaning weight vectors rely most strongly on general phonological knowledge.
If the above analysis is correct, this leads to a prediction: the more phonological similarities there are between two CDI words, the more similar their meaning weight vectors will be. In particular, the meaning weight vectors of neighbouring words should on average be closer to each other than those of non-neighbours. We tested this prediction for each of the fully trained H20 networks by computing the Euclidean distances between the meaning weight vectors of 30 randomly selected pairs of neighbouring words (sample A) and 30 randomly selected pairs of non-neighbouring words (sample B). In each case, the mean distance between pairs in sample A was significantly smaller than that between pairs in sample B. (Results for a typical network: sample A mean = 5·184917; sample B mean = 7·265130; t = –6·1259, d.f. = 49·199, p < 10–7, difference in means > 1·510937 with 95% confidence.) To examine the relation between meaning weight vector similarity and phonological similarity in more detail, we also performed a hierarchical clustering analysis on the meaning weight vectors for each CDI word in each trained H20 network. Figure 11 shows the leaves of a hierarchical clustering diagram (dendrogram) for one network: adjacent words in the diagram are those which cluster together. (For space reasons, we only show leaves of the dendrogram. Clustering is hierarchical, hence adjacent words very often form a lowest-level cluster, but sometimes they belong to different lowest-level clusters and only cluster together on a hierarchically higher level.)
Fragment of the dendrogram of meaning weight vectors (connections from meaning to hidden units) for CDI words in a fully trained model with twenty hidden neurons.

We can see that adjacent words are frequently phonological neighbours. Notice that it is not just a particular type of neighbour, e.g. a common prefix or a common suffix, but all different kinds, e.g. talk, walk, and work. (In fact we also see phonologically similar words that are not strictly neighbours: for instance hen and help, or break and grape. It is somewhat artificial to only consider words that differ in exactly one phoneme – it is often more fruitful to talk about a degree of neighbourship.) Needless to say, this organization is not always perfect; we do not claim that if two words are neighbours, their meaning weight vectors are always close to each other. The network is trying to find a global compromise solution for a multiple constraint satisfaction problem by making local modifications – it may in principle be more economical to recycle a single region of the hidden space for representing a given transition in many similar words, but sometimes the network happens to learn to use more than one region for that purpose. However, the hypothesis that meaning weight vectors of phonological neighbours are in general closer than those of non-neighbours is strongly supported. This in turn corroborates our explanation of why CDI words with high ND are more learnable in the network.
Note that our geometric account of learning also explains why networks with fewer hidden neurons can altogether fail to learn some low-ND words. Learning these words involves finding meaning weight vectors that produce highly idiosyncratic biases on the trajectories established by general phonological learning – biases that are unlike any other bias. As we explained above, the higher the dimensionality of the hidden space, the easier it is to find such biases. Networks with fewer hidden neurons might simply not have enough capacity for creating regions with all idiosyncrasies in low-ND words.
Our explanation would also be valid for the alternative method of reducing working memory (WM) capacity by adding noise to the context connection weights: if learning words correctly requires the ability to represent subtle deviations from typical paths/trajectories in the network's hidden space, the presence of noise would destroy these fine differences; however, the noisy hull around the original path would still be within the limits for common (high-ND) transitions, hence we should observe a similar ND effect.
DISCUSSION
In this paper we used an SRN-based neural network model of phonological development and early word learning as a platform for studying the effect of ND on language acquisition in children. The network's training data were derived from a sample of English: word frequencies (and thus phonotactics) were taken from a large corpus of mature spoken English, and words were paired with meanings in line with normed data about children's productive vocabularies. When trained on this data, our network model clearly demonstrated a preference for high-ND words, which was shown to be distinct from preferences for frequent words, and words with frequent biphones. This ND effect is comparable to the effect found in children in several ways. It is strongest at the point when the first word meanings are learned; it continues to have an impact on vocabulary size as learning proceeds; and the effect is stronger in learners with lower phonological working memory capacities, mimicking the stronger ND effect found in late talkers.
The current study extends a recent study by Vitevich and Storkel (Reference Vitevich and Storkel2012) that also uses a neural network model to investigate the ND effect. There are several differences. One is technical: our SRN model can learn phoneme sequences of arbitrary length, while Vitevich and Storkel’ s autoassociative model encodes phoneme sequences with fixed-length vectors of units active in parallel. As noted in the ‘Introduction’, it is likely that the brain uses a mixture of recurrent and parallel schemes to encode phonological sequences, so both models arguably reflect a component of the brain's phonological representations. A second difference relates to how the ND effect is isolated from other factors that influence word learnability. While Vitevich and Storkel's study isolated the ND effect by using artificial training words with uniform length frequency, we used actual English words with varying lengths and frequencies, and isolated the ND effect in a regression analysis. This also allowed us to isolate the ND effect from the effect of biphone frequency – a factor not considered by Vitevich and Storkel. A third difference is that while Vitevich and Storkel's model just learned phonology, our model learned both phonology and form–meaning associations. The latter two differences mean that our model's learning can be more directly compared to that of actual children. A fourth difference is that our model reproduces the finding in children that the ND effect is more pronounced in late talkers than it is in normal learners, while Vitevich and Storkel's model does not. A final difference concerns the way the ND effect is explained. Vitevich and Storkel explain the effect by referring to the way backpropagation causes multiple weights to ‘conspire’ to generate the desired output, with phonologically similar words profiting from overlapping conspiracy effects. Our explanation uses a geometric interpretation of an SRN's activity, expressed in terms of the n-dimensional space of the network's hidden units. This is helpful in thinking about the conspiracy effect geometrically, in relation to the problem of multidimensional scaling. But it also allowed us identify a new component of the ND effect, relating to the mechanism that maps from word meanings to word forms. We showed that, in our network, links from word meanings to phonology are learned as biases on the hidden-space trajectories that encode general phonological knowledge, and that it is easier to learn biases for phonologically related words. This fact also explains why the ND effect is larger for late talkers in our model. The task of learning biases is also easier in higher n-dimensional spaces, and this facilitation interacts with the one due to phonologically related words.
The two separable components of the ND effect can also be identified in the regression analysis of our model's learning. Our analysis found independent effects of ND calculated over all words the network was exposed to during training, and ND calculated over known words only. The former effect can be seen as due to ‘conspiracy’ of words with similar phonology, without any reference to word meaning, in accordance with Vitevich and Storkel's (Reference Vitevich and Storkel2012) explanation. But the latter effect has to make reference to word meanings. This is the effect we explained in terms of word-specific biases stored in meaning-to-phonology connection weights. In fact, in our regression analysis, the effect of ND calculated over known words is much stronger than the effect calculated over all words, which suggests that the main effect of ND is due to the biasing influence of word meanings.
Our regression analysis also identifies another role that meaning vectors play in phonological development, one that is not directly related to ND effects. Recall that, in our regression analysis, biphone frequency is a much stronger predictor of word learnability if it is calculated just over ‘known words’ (i.e. words with known meanings) than if calculated over all words in the exposure language (see Figure 2 and associated discussion). This indicates that the regions of hidden-unit activation space where phonotactic frequency effects are most helpful in learning words are those ‘pointed to’ by meaning vectors.
If we take our computational model as a model of phonological/lexical learning in children, these considerations allow us to make some novel predictions about ND effects as they occur in children. (Of course, our model only addresses certain selected aspects of children's learning mechanisms, so these predictions are narrowly focused on ND effects, rather than other aspects of learning or performance.) The key prediction stems from our finding that word meanings play an important role in the ND effect. From this fact, we predict that if ND is calculated over ‘known words’ for children, rather than over all words in their exposure language, the observed effect of ND on learnability will be stronger. That is to say: there will be a stronger relationship between words’ ND and their age of acquisition if ND is measured over known words rather than over the whole exposure language. (How experimentalists should estimate the words a child knows is, of course, a hard problem, but approximating by using the CDI norms, as we do in our model, should provide at least an approximate solution.)
Our analysis of the factors influencing our model's learning also leads us to a second prediction, that is not directly relevant to ND effects, but relates to the role of word meanings nonetheless. As just summarized, biphone frequency is a much stronger predictor of word learnability in our model if it is calculated over words with known meanings than if it is calculated over all words in the exposure language. We predict that the same will be found in children: in other words that the influence of phonotactic frequency on age of acquisition will be found to be stronger if frequency is measured just over ‘known words’ rather than over all words in the ambient language. This prediction is certainly in accord with the literature on adult phonotactic well-formedness intuitions, which always assumes that phonotactic representations are generalizations over known words (rather than being extracted from ambient speech; Frisch, Large & Pisoni, Reference Frisch, Large and Pisoni2000; Hay, Pierrehumbert & Beckman, Reference Hay, Pierrehumbert, Beckman, Local, Ogden and Temple2003).
Our ultimate aim in this paper is to propose an explanation of the ND effect found in children, which sheds light on how they learn words, and on how their word-learning processes may be delayed. We stated our explanation formally, with reference to a computational model of word learning whose internal representations could be studied in detail. Our model is very simple; naturally, it can only be thought of as a very crude model of the circuitry actually responsible for word learning. However, it does reproduce several aspects of the ND effects found in children: in particular, the fact that the effect is stronger in late talkers. And our analysis does isolate the ND effect more clearly than other computational models, by distinguishing it from a general phonotactic frequency effect. Perhaps most importantly, our analysis also suggests a new component of the ND effect, that stems from the role of word meanings in biasing phonological representations. This suggestion leads to some testable predictions about how ND effects should be measured. If these predictions are borne out, it could also lead to some novel ideas about therapies for late talkers. For instance, a therapy might attempt to improve phonological word representations indirectly, by working on consolidating word meanings, rather than directly, by working on phonology per se.
APPENDIX
Here we present mathematical details of some SRN computations.
Activity of linear output neurons is computed as a scalar product
 ${o_i} = {\vec w_{{o_i}}} \cdot {\vec h}$
, where o
i
is the activity of the i-th output neuron,
 ${\vec w_{{o_i}}}$
is the vector of connection weights from all hidden units to the i-th output unit and
 $\vec h$
is the vector of activities of the hidden neurons – the so-called hidden state vector. The scalar projection
 ${comp_{\vec h}}{\vec w_{{o_i}}}$
is computed as:
 $${comp_{\vec h}} {{\vec w}_{o_{i}}} = \displaystyle{{{{\vec w}_{o_{i}}} \cdot {\vec h}} \over {{\Vert {\vec h} \Vert}}} = \displaystyle{{{o_i}} \over {{\Vert {\vec h} \Vert}}}\;;$$
hence each output unit's activity is proportional to the scalar projection of its weight vector on
 $\vec h$
:
 $${o_i} = \Vert {\vec h} \Vert \cdot {comp_{\vec h}}{\vec w_{{o_i}}}\;.$$
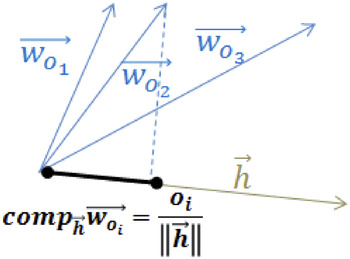
(see Figure 12).
Activity of the i-th output neuron o
i
is proportional to scalar projection
 $com{p_{\vec h}}{\vec w_{{o_i}}}$
of the corresponding weight vector
 ${\vec w_{{o_i}}}$
onto the hidden state vector
 $\vec h$
. The neuron with the longest projection becomes a winner and the corresponding phoneme is predicted.

The softmax combination does not change the order of activities, so which phoneme will be generated is effectively determined by lengths of the weight vector projections.
The hidden state vector
 $\vec h$
is computed as a sigmoidal squashing function f of a scalar product of inputs and corresponding weights, which can be rewritten as:
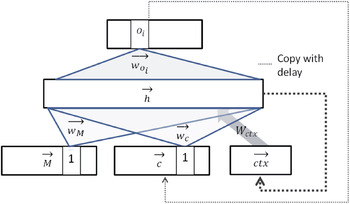
 $$\vec h = f\left( {{W_M} \cdot \vec M + {W_c} \cdot \vec c + {W_{ctx}} \cdot \overleftarrow {ctx}} \right) = f\left( {{{\vec w}_M} + {{\vec w}_c} + {W_{ctx}} \cdot \overleftarrow {ctx}} \right)\;,$$
where
 $\vec M$
is the meaning part of the input,
 $\vec c$
is the current phoneme part of the input, and
 $\overleftarrow {ctx} $
is the context vector (a copy of
 $\vec h$
from the previous time step), W
M
, W
c
, and W
ctx
are matrices of connection weights between the respective parts of the input layer and the hidden layer (Figure 13).
The model architecture with labelled weights and inputs.

Thanks to 1-hot coding (one unit in each of the meaning and current phoneme blocks equal to 1, all the others 0) used in the meaning and current phoneme input parts, the first two scalar products reduce to vectors of weights coming out from the active meaning/phoneme unit. The vector of weights from an example meaning unit (termed the meaning weight vector in our earlier discussion) is shown as
 ${\vec w_M}$
in Figure 13, and the vector of weights from an example current phoneme unit is shown as
 ${\vec w_c}$
. For non-CDI words, the
 ${\vec w_M}$
is zero vector, hence most of the time the network is trained on general phonology. The task of the meaning weight vector
 ${\vec w_M}$
is to shift/bias the hidden state vector
 $\vec h$
to a part of the hidden space where its mutual configuration with the output weight vectors generate a probability distribution (or at least its winner) appropriate to a particular word, not just general phonology. Meaning is also reflected in the context influence
 ${W_{ctx}} \cdot \overleftarrow {ctx} $
, because the context is the copy of the previous hidden state.