Introduction
Cost on wound healing treatment is reported to be over $25 million every year in the world [Reference Ida, Okamoto, Matsuka, Hagiwara and Ishihara1]. The wound dressing is necessary for the wound treatment and provides an ideal environment for wound healing. However, shortcomings of dressings in market, such as lack of porosity and adhesion onto the wound surface [Reference Kumar, Lakshmanan, Anilkumar, Ramya, Reshmi and Unnikrishnan2], are challenges to wound care. Economical and versatile alternatives to traditional dressings should be exploited. Currently, there are hundreds of dressings on the market aiding in wound management, including films [Reference Dhivya, Padma and Santhini3, Reference Rakel, Bermel, Abbott, Baumler, Burger and Dawson4], hydrogels [Reference Dhivya, Padma and Santhini3, Reference Coats, Edwards, Newton and Staun5, Reference Martin, Wilson, Koosha, Tetley, Gray and Senel6], hydrocolloids [Reference Dhivya, Padma and Santhini3, Reference Dumville, Deshpande, O’Meara and Speak7, Reference Pott, Meier, Stocco, Crozeta and Ribas8], alginates [Reference Dhivya, Padma and Santhini3, Reference Dumville, O’Meara, Deshpande and Speak9, Reference Thomas10], and foams [Reference Dhivya, Padma and Santhini3, Reference O’Meara and Martyn-St James11, Reference Ramos-e-Silva and Ribeiro de Castro12]. To treat the wound effectively, dressings are required to be applied on the wound during the healing process. It has been known that the wound healing process can be divided into five stages: hemostasis, inflammation, cellular migration and proliferation, protein synthesis and wound contraction, and remodeling [Reference Ida, Okamoto, Matsuka, Hagiwara and Ishihara1, Reference Dreifke, Jayasuriya and Jayasuriya13]. Different types of wounds have different characteristics during the wound healing process, so that one type of dressing may be only applicable for one specific wound type. For example, diabetic foot ulcers require a humid environment to help the healing process, which could be provided by hydrogels [Reference Coats, Edwards, Newton and Staun5, Reference Martin, Wilson, Koosha, Tetley, Gray and Senel6]. While for inflammation and bleeding wounds, such as stress ulcers and traumatic ulcers, whose treatment focuses on hemostasis and inflammation reduction, a combination of multiple dressings with both wound exudate absorption ability and hemostatic properties is required [Reference Dreifke, Jayasuriya and Jayasuriya13]. So far, lack of porosity and adhesion onto the wound surface are big challenges for wound dressings [Reference Kumar, Lakshmanan, Anilkumar, Ramya, Reshmi and Unnikrishnan2]. Therefore, economical and versatile alternatives to traditional dressings are requisite to be exploited for wound healing.
Carbon materials, such as carbon fibers [Reference Wright, Freeman, Sing, Jackson and Smith14, Reference Lin, Lin, Wang, Ko and Tseng15, Reference Wang, Song, Chen and Lou16] and graphene [Reference Quan, Li, Luan, Yuan, Tao and Wang17, Reference Quan, Li, Tao, Xie, Yuan and Wang18], have been applied in wound dressings for potential functional modification ability and unique optical and electronic properties [Reference Quan, Li, Luan, Yuan, Tao and Wang17]. Recently, Wang et al. [Reference Quan, Li, Luan, Yuan, Tao and Wang17, Reference Quan, Li, Tao, Xie, Yuan and Wang18] used graphene as the raw material to prepare a sponge dressing with good hemostatic efficiency. However, nanotoxicity of graphene was shown to be a disadvantage by some researchers [Reference Seabra, Paula, de Lima, Alves and Duran19], besides the problem of its high cost. As a kind of cheap and porous carbon material, expanded graphite (EG) has been widely used in the adsorption field because of its large pore volume and surface area [Reference Lutfullin, Shornikova and Dunaev20, Reference Li, Xiang and Qian21, Reference Krzesinska, Celzard and Mareche22]. However, little attention has been paid to its application in wound dressings. Kang [Reference Zheng, Wang, Kang, Wang and Inagaki23, Reference Kang, Zheng, Zhao, Wang, Wang and Shen24] and Shen et al. [Reference Shen, Wen, Cao, Zheng, Zhou and Liu25] once studied the adsorption of biological fluids and proteins by EG prepared by small graphite flakes (50 mesh). The interconnected porous structures and large specific surface areas provided EG with good gas transparency and exudate absorption capacity, which exhibited its promising potential in wound dressing. However, the nonpolar EG surface limited its adsorption capacity of proteins. Moreover, the small size of the graphite flakes caused abscission of small EG particles from the spongy dressings. This had to be avoided by unexpected cross-linking agents, which will decrease the biocompatibility of the dressing.
Herein, we report a novel and facile dressing prepared based on large EG worms. The raw material of the EG-based dressing is a rarely large graphite flake (9 mesh) recently found in Inner Mongolia, China. Its expanded volume is 50–100 times that of ordinary graphite, which provides a possibility of producing EG dressings without cross-linking agents. After EG worms were prepared using an easy oxidative intercalation and thermal expansion method, chitosan was grafted onto the surface of EG by chemical modification to improve protein adsorption. Stable CS-EG sponge dressings were then obtained by compressing a number of CS-EG worms. The protein adsorption capacity and coagulation capacity were evaluated to demonstrate its strong exudate adsorption ability and excellent hemostatic property. Inspired by the integrated performance of its adsorption ability and hemostatic property, as well as the simple preparation process, CS-EG is expected to act as a promising wound dressing material, especially for inflammation and bleeding wounds such as stress ulcers and traumatic ulcers.
Results
Material characterization
Characteristics of EG
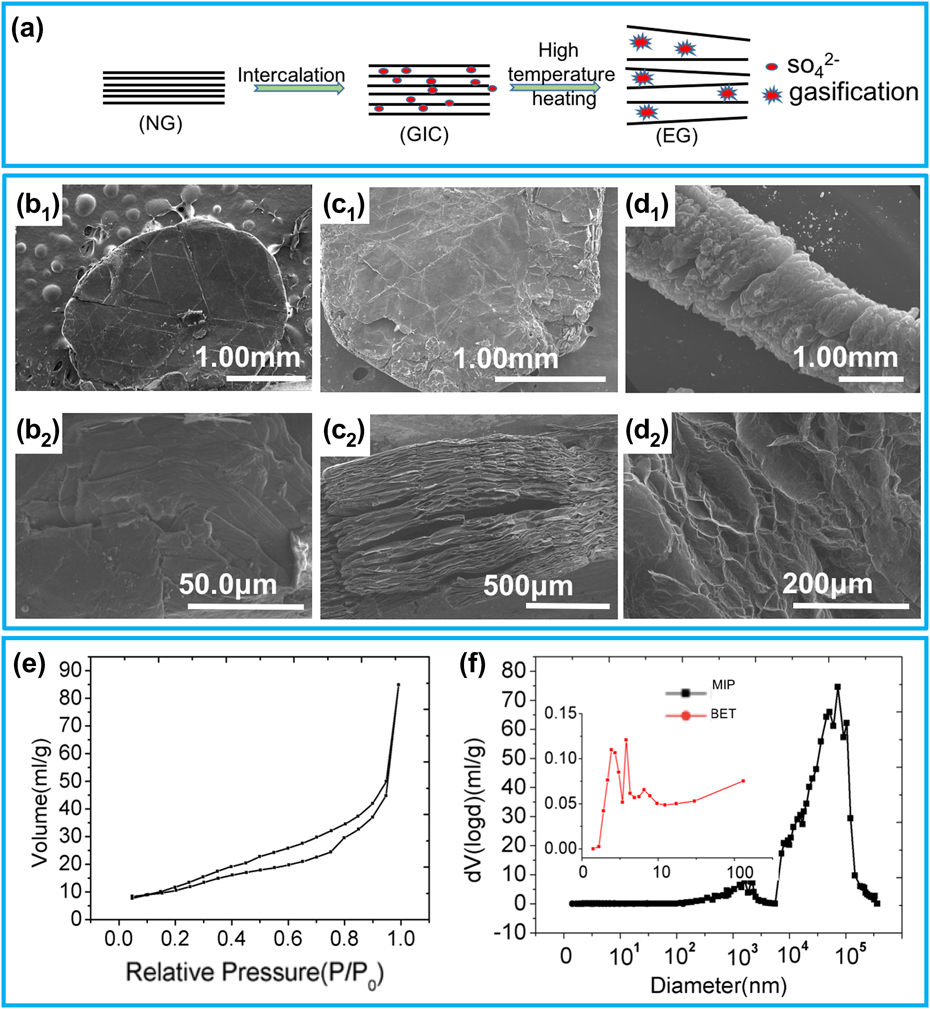
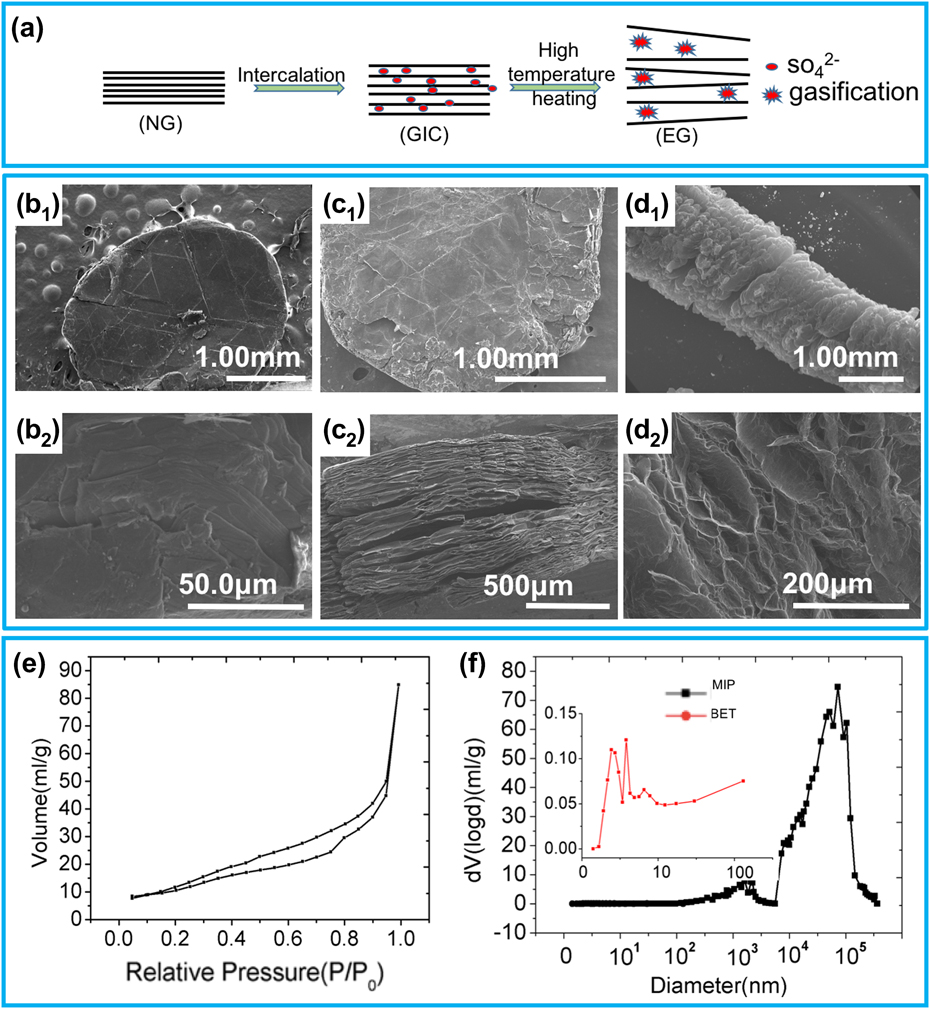
The preparation of EG, including the processes of oxidative intercalation and high-temperature thermal expansion, is illustrated in Fig. 1(a). The images of the three typical stages during the EG preparation process are shown in Figs. 1(b)–1(d). Figures 1(b2) and 1(c2) are the side views of NG and GIC, respectively. It is clearly shown that the NG flake is significantly thickened after interaction, and obvious layered structure appeared. Figure 1(d1) is the SEM image of EG, and Fig. 1(d2) is the magnified image of EG surface structure. It can be seen that its surface is highly porous and the pores are oval and slit shaped, which is also confirmed by the N2 adsorption–desorption isotherm in Fig. 1(e). According to the IUPAC classification, the curve in Fig. 1(e) is characterized as type IV with a H4 hysteresis loop at a relative pressure P/P 0 ranging from 0.2 to 0.9, indicating slit-shaped pores formed by lamellar structure. The specific surface area of EG is measured to be 45 m2/g, which ensured its strong adsorption performance. As shown in Fig. 1(f), the pore size of EG ranges from several nanometers to hundreds of micrometers and is mainly between 10 and 100 μm. The multipeak curve indicates that EG exhibits a hierarchical porous structure, which is consistent with the morphology shown in Fig. 1(d2). The porosity and pore volume are 88.9% and 63.4 mL/g, respectively, measured by mercury intrusion method. NG used in this EG preparation process is a rarely large graphite flake (9 mesh). Therefore, the expansion volume of EG is extremely large, even though a simple preparation method is conducted. And thanks to the large volume of individual graphite worm, dressings of the desired shape can be prepared by simple pressing without extra cross-linking agent in the sponge.
Characterization of EG. (a) Schematic of the synthesis of EG. (b1, c1, and d1) SEM image of vertical view of NG, GIC, and EG, respectively. (b2 and c2) Side image of NG and GIC. (d2) Magnified image of EG surface. (e) N2 adsorption–desorption isotherm of the CGS. (f) Pore size distribution of EG.
Characteristics of CS-EG
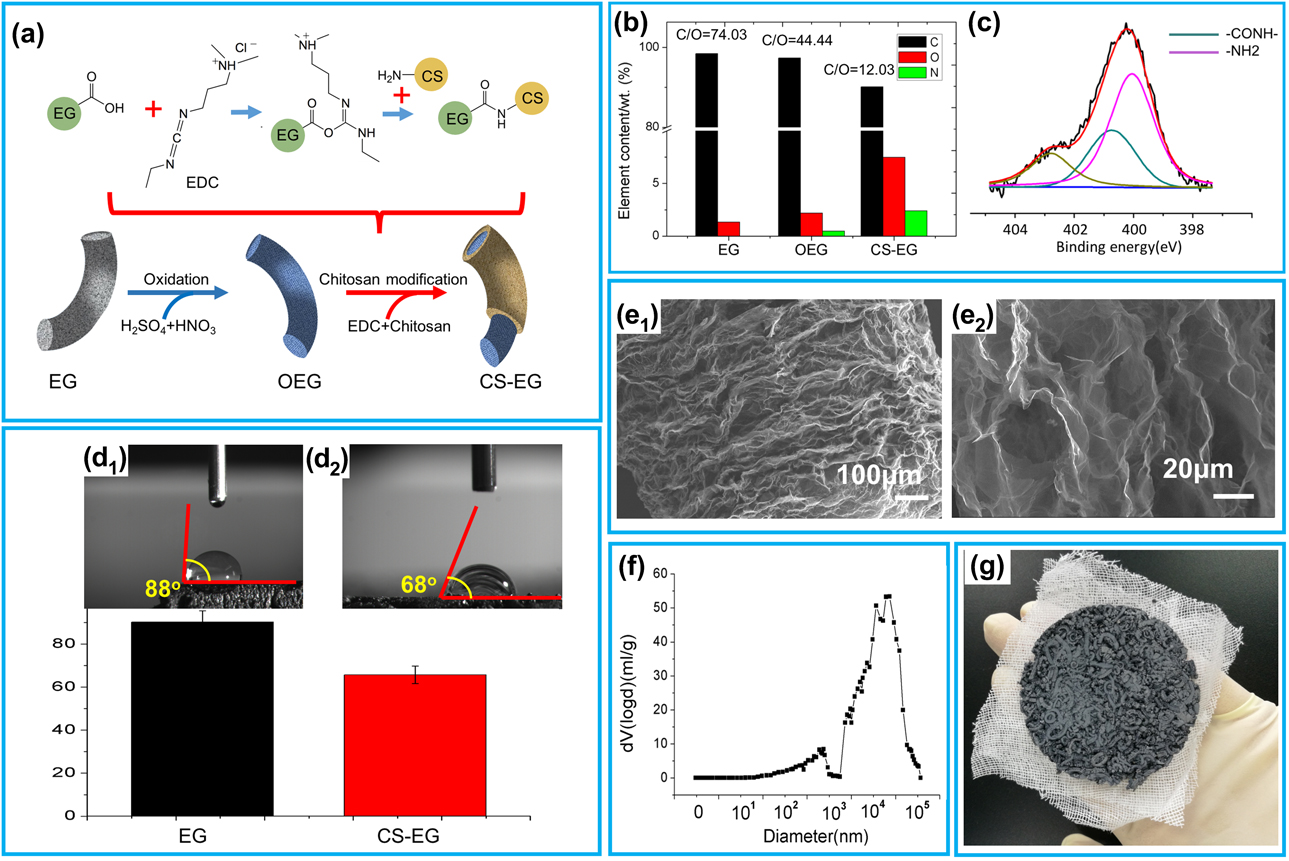
Figure 2(a) shows the schematic of CS-EG synthesis process. First, strong oxidizing agents are used to introduce oxygen-containing groups, including carboxyl group, on the surface of EG (OEG). Then, the chitosan is modified on the EG by the EDC reaction. Figure 2(b) shows the results of XPS elemental analysis. Obvious changes have taken place in the elemental content of EG and CS-EG. The contents of oxygen and nitrogen increase significantly, indicating that the chitosan is modified to EG surface. Figure 2(c) shows the results of curve fitting of N 1s peak and functional groups of –NH2 and –CONH–, which confirms that the modification process is caused by the reaction between carboxyl group on EG and amino group of chitosan.
Characterization of CS-EG. (a) Schematic of CS-EG synthesis process. (b) Elemental analysis of EG, OEG and CS-EG. (c) N 1s peak (XPS) of CS-EG. (d1 and d2) Contact angle schematic of EG and CS-EG. (e1 and e2) SEM images of CS-EG surface and internal structure, respectively. (f) Pore size distribution of CS-EG. (g) Image of CS-EG dressing.
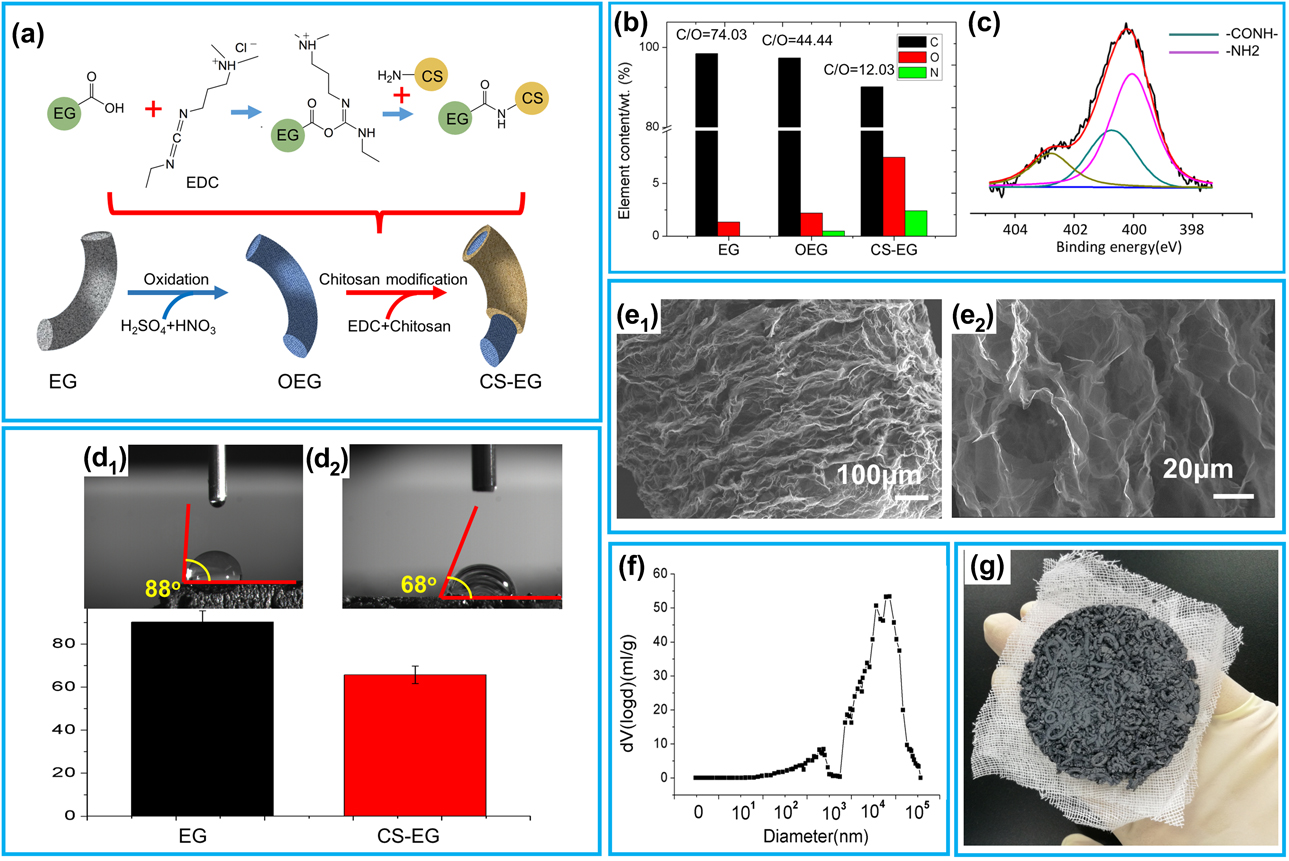
Figures 2(d1) and 2(d2) demonstrate the fact that contact angle with water reduced after EG is modified with chitosan. The modification of chitosan increases the content of polar groups on EG surface, which enhances the hydrophilicity of EG. Figures 2(e1) and 2(e2) are SEM images of CS-EG surface and internal structure, respectively. It can be seen that the modification of chitosan has a slight influence on the surface morphology of EG so that the amount of large pores on the EG surface is decreased. However, the internal porous structure remains unchanged, which was also demonstrated by the similar pore size distribution curves in Fig. 2(f) compared with Fig. 1(f). The image of CS-EG sponge on gauze [Fig. 2(g)] illustrated the stable shape of the dressing prepared by the simple pressing process.
SWE absorption capacity
Wound exudate is one of the critical factors in inflammation, which delays wound healing by inhibiting the growth of fibroblasts [Reference Mickelson, Mans and Colopy29, Reference Tanaka, Ase, Okuda, Okumura and Nogimori30]. Meanwhile, the pathogenic microorganisms in wound exudate leads to further tissue damage [Reference Oluwatosin31, Reference Lozano-Platonoff, Mejia-Mendoza, Ibanez-Doria and Contreras-Ruiz32]. So the crucial point for a wound dressing is to have great absorption ability on wound exudates, especially on the protein in wound exudates.
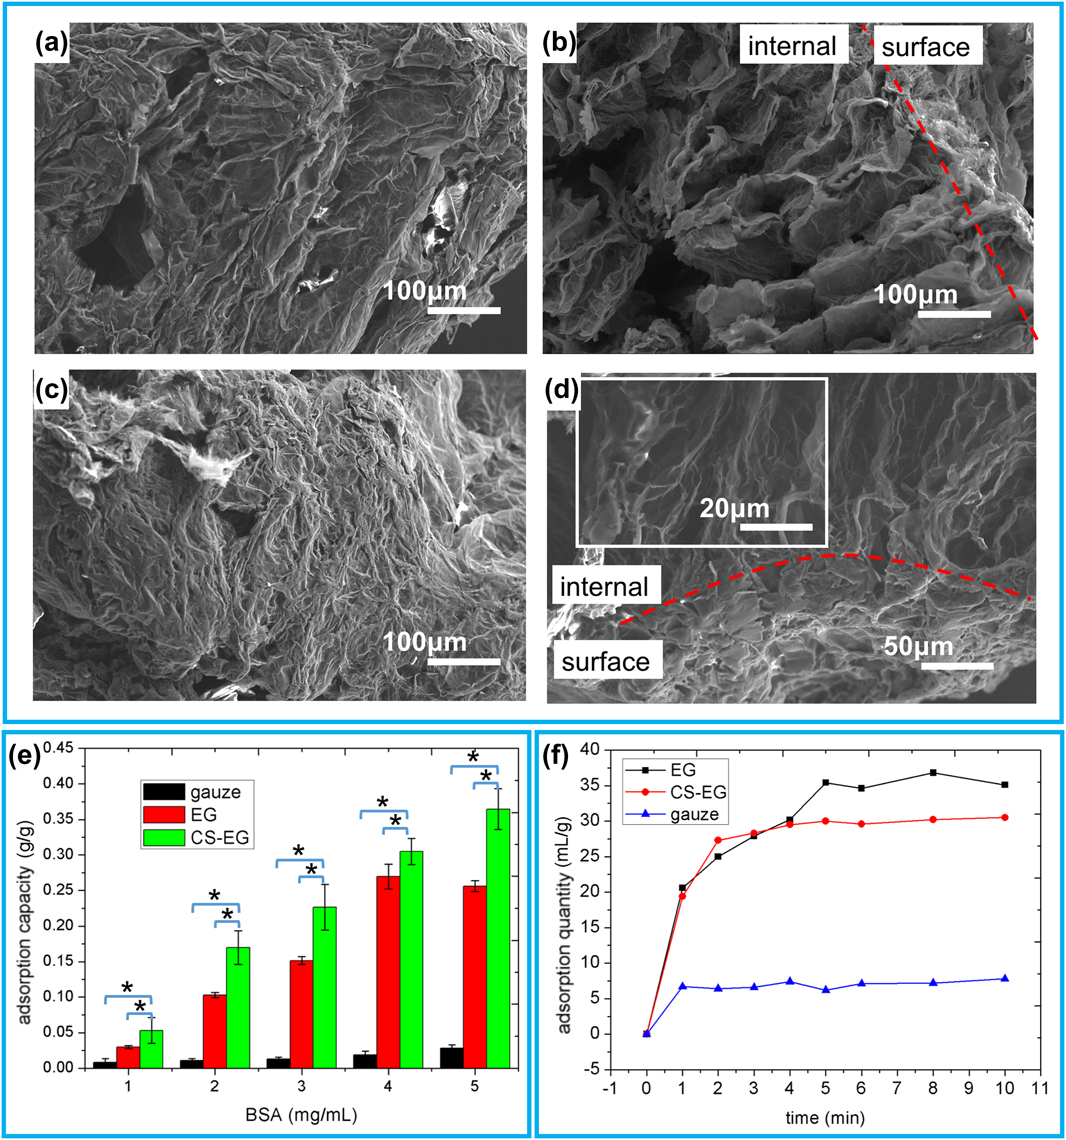
The SEM images of EG and CS-EG after saturated adsorption for 12 h are shown in Figs. 3(a)–3(d). It can be seen that the pores on the CS-EG surface are covered by a significantly thickened protein layer [Fig. 3(c)] compared with those on EG [Fig. 3(a)]. Figure 3(e) shows the quantitative adsorption capacity for the protein in SWE with various protein concentrations. Compared with the gauze control group, EG has a significantly greater saturated adsorption capacity of the protein under any of the tested concentrations. More interestingly, adsorption capacity of protein by CS-EG is further enhanced compared with EG due to the increase in polar groups on EG surfaces. In addition, the remaining internal pores in EG [Fig. 3(b)] and CS-EG [Fig. 3(d)] ensure their high saturated adsorption capacity of SWE solution within 5 min as illustrated in Fig. 3(f). The adsorption capacity of EG and CS-EG is about 35 mL/g and 30 mL/g, respectively, which are 6–7 times greater than that of gauze (5 mL/g). The slight decrease in SWE solution adsorption by CS-EG could be due to the slight decrease in pores on CS-EG surface after chitosan modification, which is observed in Figs. 2(e1) and 2(e2).
(a) SEM image of EG surface after saturation adsorption. (b) SEM image of EG interface after saturation adsorption. (c) SEM image of CS-EG surface after saturation adsorption. (d) SEM image of CS-EG interface after saturation adsorption. (e) Protein absorption capacity of EG and CS-EG compared with gauze with the same weight. Data values corresponded to mean ± SD (n = 6). * represents significant difference between the samples (p < 0.05). (f) Adsorption curve of SWE solutions by EG and CS-EG compared with gauze with the same weight.

Hemostatic performance
Generally, the healing of wounds can be divided into five stages: hemostasis, inflammation, cellular migration and proliferation, protein synthesis and wound contraction, and remodeling [Reference Singh, Saraf, Vyas, Jain and Singh33, Reference Edmonds34]. The first phase of hemostasis involves reducing blood loss and promoting blood clotting, which will prepare for and influence the next 4 stages of wound healing. Therefore, hemostasis is particularly critical for wound healing and special attention should be paid to this property of the wound dressings.
Evaluation of hemostatic performance
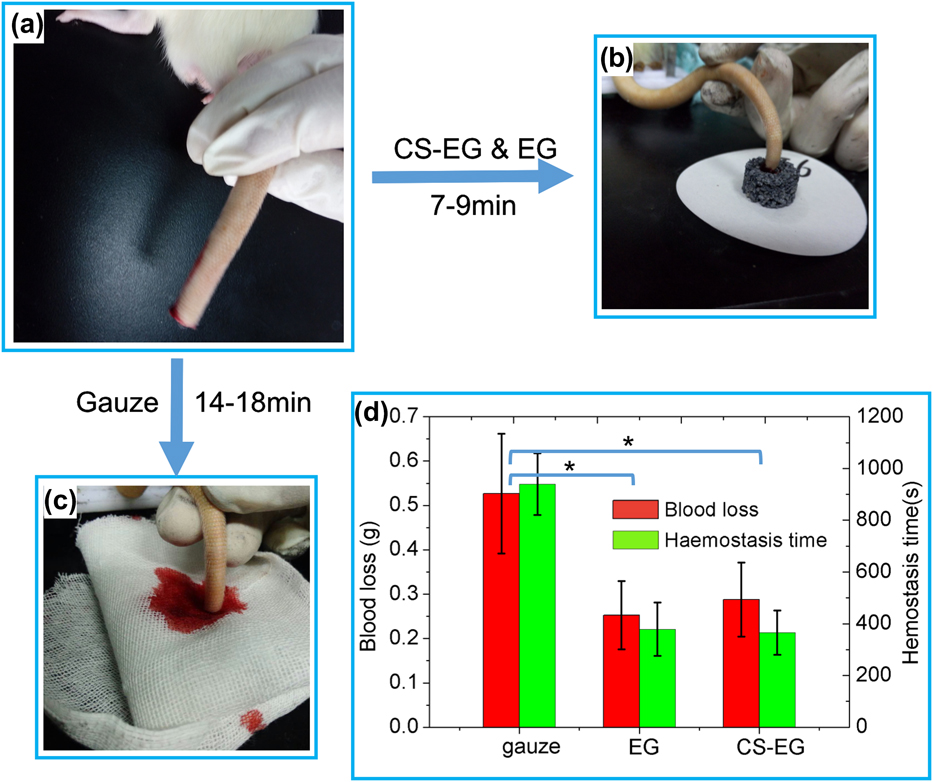
The hemostatic performance of EG and CS-EG sponges (diameter 2 cm, thickness 1.5 cm) is evaluated by a rat tail cutting experiment. As shown in Fig. 4, hemostatic time and blood loss of EG and CS-EG are significantly reduced, compared with the conventional hemostatic gauze. The hemostatic time of EG and CS-EG is 378.7 ± 103.6 s and 365.5 ± 85.4 s respectively, which is only about 40% of that in gauze (939.6 ± 118.9 s). The blood loss of EG and CS-EG was 0.253 ± 0.076 g and 0.287 ± 0.083 g, respectively, while the that of gauze is 0.527 ± 0.135 g. These results confirmed that EG and CS-EG have a better hemostatic effect in shortening the bleeding time and reducing the bleeding volume compared with gauze with the same weight. The good hemostatic performance of EG and CS-EG indicates their potential application in wound healing when there is blood bleeding. To elucidate the effect of the hemostatic performance of EG and CS-EG sponges, adsorption of blood cells and clotting of whole blood were evaluated.
Evaluation of the hemostatic performance of EG and CS-EG. (a–c) Hemostatic effect of the EG and CS-EG sponge. (d) Hemostasis time and blood loss of different samples; mean ± SD (n = 6).

Adsorption of blood cells on materials
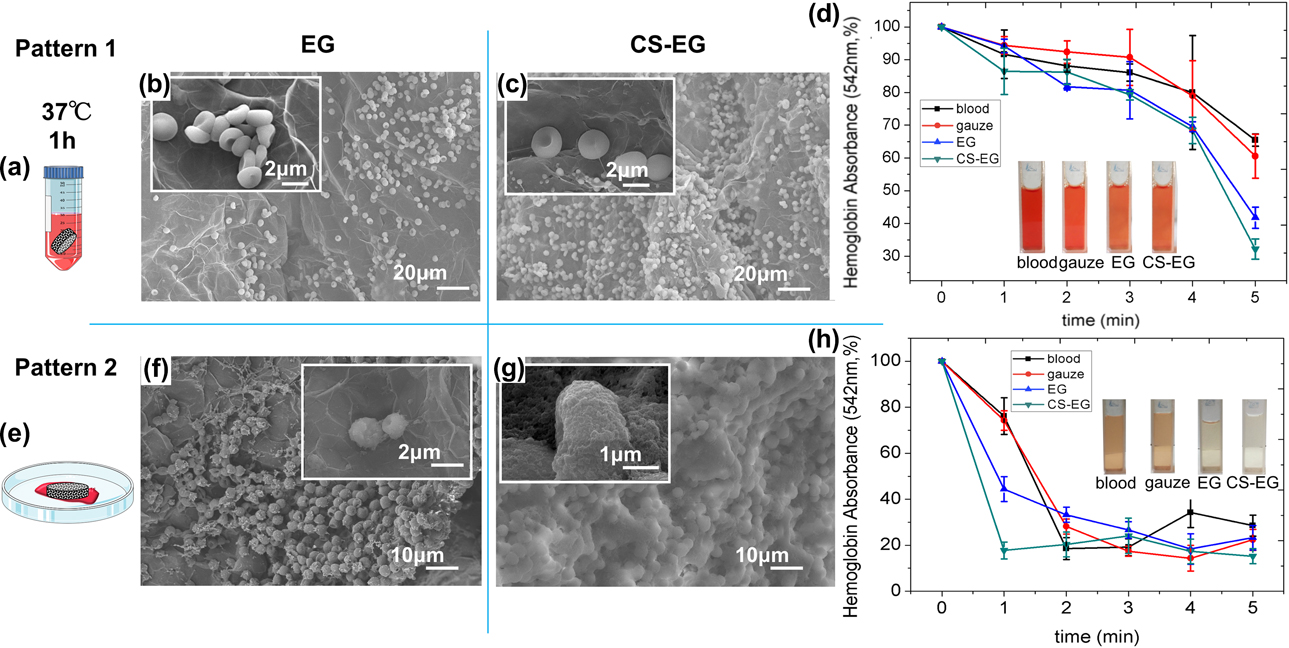
As erythrocytes are the majority of the total blood cells, aggregation of erythrocytes on dressings becomes a necessary condition for the material to have coagulation property [Reference Rembe, Bohm, Fromm-Dornieden, Schafer, Maegele and Frohlich35]. As shown in Pattern 1, Figs. 5(a)–5(d), after EG and CS-EG are immersed in diluted blood (1:20) for 2 h, a large number of erythrocytes are found to attach to the surface of the materials [Figs. 5(b) and 5(c)]. Obviously, the cell density on the CS-EG surface is greater than that on EG, indicating a higher capability for erythrocytes aggregation on CS-EG. Figure 5(d) shows the absorbance value of blood dilution versus time. Compared with gauze with the same weight, the hemoglobin absorbance of blood dilution by EG and CS-EG decreases faster, and it is much lower than that of the control group in five minutes. As shown in the inset image in Fig. 5(d), the color of the blood dilution adsorbed by EG and CS-EG is significantly lighter than the other groups, which corresponds to the absorbance test. The quick and capable adsorption of blood cells on CS-EG provides its coagulation property of blood as a dressing material.
(a) Schematic illustration of Pattern 1 evaluation model. (b and c) SEM images showing erythrocytes adhered to EG and CS-EG in Pattern 1. Inset images are magnified ones. (d) Erythrocyte absorption capability of EG and CS-EG. Data values correspond to mean ± SD (n = 6). Inset photographs are the images of the corresponding solutions. (e) Schematic illustration of Pattern 2 evaluation model. (f and g) SEM images of EG and CS-EG surface morphology in Pattern 2. Inset images are magnified ones. (h) In vitro dynamic whole-blood clotting evaluation of EG and CS-EG; mean ± SD (n = 6). Inset photographs are the images of corresponding solutions.

In vitro whole blood clotting
It is well known that besides blood cells, proteins in the blood also play an important role in the coagulation process. For example, fibrin can promote platelet aggregation, increase blood viscosity, and promote erythrocyte aggregation so that it plays an important role in the final part of hemostasis clotting process [Reference Laurens, Koolwijk and de Maat36, Reference Lorand37]. As confirmed in Fig. 3, EG and CS-EG have excellent protein adsorption properties, which can promote the accumulation of proteins on the material surface. Coupled with the good adsorption of erythrocytes, EG and CS-EG are believed to have good blood clotting performances. To test the clotting effect of whole blood by EG and CS-EG sponges, we simulate the application of dressings in practice as shown in Pattern 2, Fig. 5(e). Blood coagulated on EG and CS-EG surfaces is no longer erythrocytes themselves. Instead, the erythrocytes are covered with protein, forming a thick layer on the surface of EG and CS-EG [Figs. 5(f) and 5(g)]. The protein layer on CS-EG is even denser than that on EG. As shown in Fig. 5(h), the hemoglobin absorbance of CS-EG reaches the lowest value among all the samples and that of EG is significantly lower than that of the gauze control group in 1 min, although the absorbance of all samples decreases to the same level and remains unchanged after 2 min. Correspondingly, the color of the dissolved blood clotted by EG and CS-EG is significantly lighter than that clotted by gauze in 1 min [Fig. 5(g)]. This test has suggested that EG and CS-EG can promote blood coagulation quickly and effectively compared with gauze.
It is elucidated from the experimental results above that EG and CS-EG can accelerate the blood coagulation process by the immobilization of blood cells and adsorption of proteins on the material surface to exhibit promising hemostatic performance.
Cytotoxicity evaluation
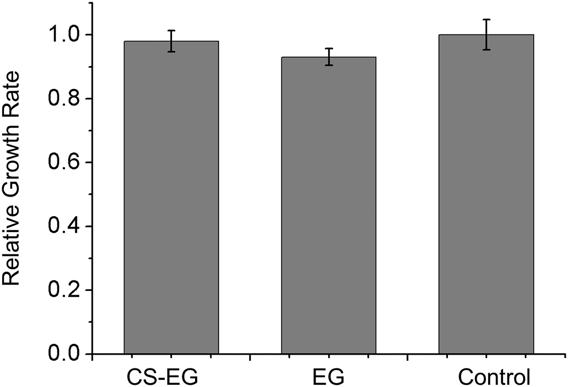
The cytotoxicity result evaluated by a CCK-8 assay is shown in Fig. 6; the RGR of CS-EG and EG is 98.0 ± 3.3% and 93.0 ± 2.6%, respectively. According to the USP toxicity rating, CS-EG and EG were rated as grade 1, indicating that CS-EG and EG have good biocompatibility and noncytotoxicity. It is safe as a wound dressing material.
Results of the CCK-8 assay among CS-EG and EG. Data values correspond to mean ± SD (n = 6, p < 0.05).

Conclusions
In summary, we developed a novel and facile dressing material prepared based on EG. Due to the porous structure and large specific surface area, the produced CS-EG sponges exhibit good adsorption capacity for wound exudate. The CS-EG absorbs blood cells and proteins rapidly and efficiently on the wound surface, thus promoting blood coagulation. In conclusion, excellent wound exudate adsorption capacity, good hemostatic performance, and simple preparation process make CS-EG a potential dressing material for inflammation and bleeding wounds.
Materials and methods
Materials
Natural graphite flake (NG, carbon content 99.6%, 9 mesh, Bayannur, Inner Mongolia, China). Sulfuric acid (H2SO4, 98%), potassium permanganate (KMnO4, 99.9%), nitric acid (HNO3, 68%), bovine serum albumin (BSA, 95.0%), 1-[3-(dimethyl-amino)propyl]-3-ethylcarbodiimide (EDCHCl, 99%), 2-(N-morpholino)ethane sulfonic acid (MES, 99%), glutaraldehyde aqueous solution (25%), and simulated body fluid (SBF) were purchased from Sigma-Aldrich Company (Shanghai, China), medical glue was purchased from Shanghai Vision Cement Materials Co., Ltd. (Shanghai, China), and other reagents were purchased from Sinopharm Chemical Reagent Co., Ltd (Beijing, China). All chemicals were of analytical grade and used without further purification.
Preparation of EG
As shown in Fig. 1(a), the preparation of EG can be divided into two processes: oxidative intercalation and high-temperature thermal expansion. In the intercalation stage, 1 g graphite flakes was added to 10 mL sulfuric acid (70 wt%), followed by the addition of 0.08 g KMnO4. The reaction was carried out under slow mechanical stirring for 1 h. The products were filtered and washed with deionized water to remove the excess reactants. Graphite intercalation compound (GIC) was then obtained when the products were dried in a 70 °C oven. In the subsequent high-temperature expansion process, GIC was rapidly heated to 1000 °C in the muffle furnace within 10 s. After keeping for 60 s at 1000 °C, the worm-like EG was obtained.
Synthesis of CS-EG
Before 0.5 g EG was added, 100 mL sulfuric acid (98%) and 50 mL nitric acid (68%) were mixed in a beaker. After reacting for 1 h, the mixture was washed with deionized water until pH 6 to obtain expanded graphite oxide (EGO).
0.5 g EGO was added to 200 mL MES buffer (0.1 M, pH 4.5–5.0), before 10 g chitosan was dissolved in the buffer. Subsequently, 1 g EDC dissolved in 20 mL ultrapure water was immediately added to the buffer solution mentioned above. Mechanical stirring was carried out for 24 h at room temperature, and CS-EG was obtained after filtration and drying.
Worm-like EG and CS-EG particles were compressed to sponges (20 mg/cm3, 10 cm diameter, 0.5 cm thickness) for the investigation of their hemostatic performances. A prototype of the spongy dressing can be obtained by bonding the pressed sponges on a piece of gauze with medical glue.
Characterization of EG and CS-EG
Scanning electron microscopy (SEM; S-4700 Hitachi) was used to observe the surface and internal microstructure of the samples. The preparation of fractured cross-section of worm-like EG has been reported in the literature [Reference Inagaki and Suwa26]. Mercury intrusion porosimetry (MIP; Auto Pore IV 9510) and nitrogen gas adsorption method (ASAP2010) were used to determine the specific surface area, pore distribution, and pore volume of the samples. The surface element content of the EG, EGO, and CS-EG was detected by X-ray photoelectron spectroscopy (XPS; PHI Quantro SXM).
Evaluation of absorption capacity of SWEs
Exudate of wounds contains a high content of proteins [Reference Dowsett27, Reference Vowden, Bond and Meuleneire28]. Therefore, bovine serum albumin (BSA) was added to normal SBF to simulate the wound exudate. Absorption capacity of EG and CS-EG for both simulated wound exudates (SWEs) solution and proteins in SWE was evaluated. For SWE solution adsorption study, 250 mg BSA was dissolved in 50 mL SBF to prepare the SWE solution. Worm-like EG and CS-EG particles were compressed to sponges (20 mg/cm3, 2 cm diameter, 1.5 cm thickness). The EG and CS-EG sponges were immersed in the SWE solution for a certain different time (1–10 min), respectively, and the weight was measured after the samples were taken out. The solution adsorption quantity was calculated according to the increase in samples’ weight as shown in Eq. (1). This experiment was repeated 6 times under the same condition. Gauze of same weight was used as the control group.
 $$\Delta {m_1} = {m_2} - {m_1}\quad ,$$
where Δm 1 is the weight of the solution adsorbed by the samples, m 1 is the weight of the sample before adsorption, and m 2 is the weight of the sample after adsorption.
For protein adsorption study, 50 mg, 100 mg, 150 mg, 200 mg, and 250 mg BSA were dissolved in 50 mL SBF solution, respectively. EG and CS-EG sponges mentioned above were immersed in these SWE solutions for 12 h. The samples were dried in a 70 °C oven and cut in the axial direction for SEM observation and were measured by an ultraviolet spectrophotometer (MAPADA UV-1100 spectrophotometer, Shanghai Mapada Instruments Co., Ltd., Shanghai, China) at 280 nm before and after the sponges were immersed. The protein concentration can be read from the standard curve of protein absorbance. The weight of BSA adsorbed by the sponges can be calculated using Eq. (2). This experiment was repeated 6 times under the same condition. Gauze of same weight was used as the control group.
 $$\Delta {m_2} = {V_1}{\rho _1} - {V_2}{\rho _2}\quad ,$$
where Δm 2 is the weight of BSA adsorbed by the sponges, V 1 is the volume of the solution before adsorption, V 2 is the volume of the solution after adsorption, ρ1 and ρ2 are the protein concentrations of the solution before and after adsorption, respectively, tested by a ultraviolet spectrophotometer.
Evaluation of hemostatic capacity
The hemostatic performance of EG and CS-EG sponges (diameter 2 cm, thickness 1.5 cm) was evaluated by a rat tail cutting experiment. Animal models were healthy male Sprague-Dawley rats (250 ± 20 g, 7 weeks of age, Vital (Charles) River Laboratory, Beijing, China). Animals were treated and cared for in accordance with the National Research Council’s Guide for the care and use of laboratory animals. All rats were anesthetized with 1.25 mL 10% chloral hydrate (0.5 mL per 100 g). Each rat tail was cut at 6 cm from the tip. The wound section was covered with sample sponges with slight pressing. During the hemostatic process, the data of bleeding time and blood loss were recorded. As a control, the hemostatic performance of gauze of same weight was tested and each group was repeated 6 times.
To elucidate the effect of the hemostatic performance of EG and CS-EG sponges, adsorption of blood cells and clotting of whole blood were evaluated referring to the reported literature [Reference Quan, Li, Tao, Xie, Yuan and Wang18].
To test the adsorption of blood cells, whole blood was added into phosphate buffered saline (PBS) by the volume ratio of 1:20 to get diluted blood solution. Ten milligrams of worm-like EG and CS-EG was added into the diluted blood solution after they were immersed in PBS for 2 h at 37 °C. After incubation in a 37 °C incubator for 1 h, the samples were rinsed with PBS to remove free cells and then immobilized with 2.5% glutaraldehyde solution for 2 h. The samples were dehydrated with 30%, 50%, 70%, 90%, 95%, and 100% ethanol, respectively, each for 5 min. Freeze-drying and gold spraying were conducted on the samples before the cells’ morphology was observed by SEM. The diluted blood solution was measured once every minute by an ultraviolet spectrophotometer (MAPADA UV-1100 spectrophotometer) at 542 nm to calculate the amounts of blood cells in the solution [Reference Quan, Li, Tao, Xie, Yuan and Wang18]. The adsorption capacity of gauze with the same weight as EG or CS-EG sponges was used as a control. This experiment was repeated 6 times under the same condition.
To test the clotting effect of whole blood by EG sponges, we simulated the application of the dressing in the actual situation. 200 μL recalcified whole blood solution (8 μL CaCl2, 0.2 M) was added to a Petri dish to form a thin layer of blood. EG and CS-EG sponges (diameter 2 cm, thickness 1.5 cm) were gently pressed on the blood surface and incubated in a 37 °C incubator for 1–5 min. After taking out the sponges from the Petri dish, 10 mL distilled water was added slowly without disturbing the clotted blood. The supernatants absorbance was measured by an ultraviolet spectrophotometer at 542 nm to detect the concentration of free erythrocytes (red blood cells) in the solution. As a negative control, the absorbance value of recalcified whole blood without sponges was measured. This parallel experiment was repeated 6 times under the same condition. Sponges incubated for 3 min were treated with the above-mentioned method before SEM observation.
Cytotoxicity evaluation
A CCK-8 assay was used to evaluate the cell cytotoxicity of CS-EG and EG. First, L929 mouse fibroblast cells (purchased from Cell Resource Center, IBMS, CAMS/PUMC, Beijing, China) in a logarithmic growth phase were added in complete medium (CM) which was being mixed with 90% RPMI-1640 medium, 10% fetal bovine serum (FBS), and 1% antibiotics (100 units/mL penicillin and 100 units/mL streptomycin). Then, the mixture was incubated for 24 h at 37 °C in a humidified air condition of 5% CO2. At the same time, 5 mL RPMI-1640 medium added into materials(CS-EG and EG) and another 5 mL RPMI-1640 medium without materials were incubated for 24 h; then, the impregnating solution of CS-EG and EG removed to the corresponding CM as test group, the empty RPMI-1640 medium as control group. After another 48-h incubation, cell viability was determined by a CCK-8 assay kit and was measured at 450 nm with an ultraviolet spectrophotometer (MAPADA UV-1100 spectrophotometer). The relative growth rate (RGR) of the cells was calculated according to the formula: RGR = Abstest/Abscontrol × 100%. Finally, the toxicity grade of each material was assessed based on the RGR.
Funding
This work was supported by the National Key Research and Development Program of China [2016YFB0700802]; Intergovernmental cooperation in science and technology [2016YFE0125300]; and the Fund of Key Laboratory of Advanced Materials of Ministry of Education [2017AML12].