By the time they are typically detected, attention-deficit/hyperactivity disorder (ADHD)—characterized by developmentally inappropriate levels of inattention-disorganization and/or hyperactivity-impulsivity—and autism spectrum disorder (ASD)—characterized by social communication difficulties and the presence of restricted interests and repetitive behaviors—are challenging to treat. These difficulties are increasingly prevalent, emerge early in childhood, and are associated with significant long-term impairment (Dalsgaard, Østergaard, Leckman, Mortensen, & Pedersen, Reference Dalsgaard, Østergaard, Leckman, Mortensen and Pedersen2015; Howlin, Moss, Savage, & Rutter, Reference Howlin, Moss, Savage and Rutter2013; Howse, Calkins, Anastopoulos, Keane, & Shelton, Reference Howse, Calkins, Anastopoulos, Keane and Shelton2003; Kuriyan et al., Reference Kuriyan, Pelham, Molina, Waschbusch, Gnagy, Sibley and Kent2013; Moffitt et al., Reference Moffitt, Arseneault, Belsky, Dickson, Hancox, Harrington and Caspi2011). The associated economic burden resulting from elevated healthcare costs, costs to families, and costs associated with lost work represents a significant public health concern (Lavelle et al., Reference Lavelle, Weinstein, Newhouse, Munir, Kuhlthau, Prosser and Newschaffer2014; Matza, Paramore, & Prasad, Reference Matza, Paramore and Prasad2005).
Various lines of inquiry have suggested that ASD and ADHD, and their constituent symptoms, may share causal mechanisms, evidenced by shared heritability (Miller et al., Reference Miller, Musser, Young, Olson, Steiner and Nigg2019a; Musser et al., Reference Musser, Hawkey, Kachan-Liu, Lees, Roullet, Goddard and Nigg2014; Rommelse, Franke, Geurts, Hartman, & Buitelaar, Reference Rommelse, Franke, Geurts, Hartman and Buitelaar2010; Rommelse, Geurts, Franke, Buitelaar, & Hartman, Reference Rommelse, Geurts, Franke, Buitelaar and Hartman2011; Ronald, Simonoff, Kuntsi, Asherson, & Plomin, Reference Ronald, Simonoff, Kuntsi, Asherson and Plomin2008; Stergiakouli et al., Reference Stergiakouli, Davey Smith, Martin, Skuse, Viechtbauer, Ring and St Pourcain2017; Taylor, Charman, & Ronald, Reference Taylor, Charman and Ronald2015) and genetic underpinnings (Ronald et al., Reference Ronald, Simonoff, Kuntsi, Asherson and Plomin2008; Stergiakouli et al., Reference Stergiakouli, Davey Smith, Martin, Skuse, Viechtbauer, Ring and St Pourcain2017). Twin studies in children and adolescents have also demonstrated a large degree of overlap in ASD and ADHD symptomatology (Ronald, Larsson, Anckarsäter, & Lichtenstein, Reference Ronald, Larsson, Anckarsäter and Lichtenstein2014; Ronald et al., Reference Ronald, Simonoff, Kuntsi, Asherson and Plomin2008). The potential for shared biological underpinnings between ASD and ADHD suggests the possibility that early risk markers may also overlap and serve as general indices of atypical development that could be leveraged for transdiagnostic—or cross-disorder—treatment efforts. Indeed, studies have implicated general developmental factors (e.g., motor development), attention, temperament and affect regulation, and even social behavior as potential overlapping early risk markers of both ASD and ADHD (reviewed in Johnson, Gliga, Jones, & Charman, Reference Johnson, Gliga, Jones and Charman2015), though examining these features within a sample that includes infants at risk for both conditions warrants further study. Critical questions remain regarding the identification, in infancy, of early markers and the ways in which these sets of challenges are related. Addressing this is imperative to enhancing early detection efforts, delineating mechanisms underlying symptom development, and identifying ideal targets and time points for prevention and intervention.
A useful strategy for investigating early markers and the longitudinal course of symptom dimensions associated with highly heritable disorders like ASD (heritability of 0.9; Freitag, Reference Freitag2007; Freitag, Rohde, Lempp, & Romanos, Reference Freitag, Rohde, Lempp and Romanos2010) and ADHD (heritability of 0.7–0.8; Willcutt et al., Reference Willcutt, Pennington, Duncan, Smith, Keenan, Wadsworth and Olson2010) is to study samples at elevated familial risk for relevant symptoms, such as infants with a diagnosed first-degree relative. These samples permit repeated assessments prior to overt symptom onset and are enriched for a wide range of phenotypic variation, from normative to diagnostic levels of relevant behaviors. This makes such samples well suited to studying developmental mechanisms underlying the emergence of core symptoms in a dimensional fashion (Cuthbert, Reference Cuthbert2014). Indeed, it has been shown that siblings and family members of individuals with ASD or ADHD who do not meet diagnostic criteria themselves display intermediate levels of symptoms and associated impairments, including subclinical inattention, self-regulation problems, social and peer relationship difficulties, and affect dysregulation (Miller et al., Reference Miller, Iosif, Young, Bell, Schwichtenberg, Hutman and Ozonoff2019b; Ozonoff et al., Reference Ozonoff, Young, Belding, Hill, Hill, Hutman and Iosif2014; Uebel et al., Reference Uebel, Albrecht, Asherson, Börger, Butler, Chen and Banaschewski2010).
Although ASD can be reliably diagnosed as early as 18 months of age and certainly by 36 months of age (Ozonoff et al., Reference Ozonoff, Young, Landa, Brian, Bryson, Charman and Iosif2015), the average age of diagnosis in the community is around 4 years of age (Maenner et al., Reference Maenner, Shaw, Baio, Washington, Patrick, DiRienzo and Dietz2020). ADHD, on the other hand, tends to be diagnosed substantially later—around age 7 years (Visser et al., Reference Visser, Danielson, Bitsko, Holbrook, Kogan, Ghandour and Blumberg2014). Thus, transdiagnostic studies that focus on the early development of these conditions may benefit from a dimensional approach, as most children with eventual diagnoses of ADHD will not meet full criteria until after the age of 3 years. A developmental psychopathology framework is ideally suited to exploring these complex issues. Younger siblings of children with ASD are not only at elevated risk for ASD (Ozonoff et al., Reference Ozonoff, Young, Carter, Messinger, Yirmiya, Zwaigenbaum and Stone2011), but also for ADHD (Miller et al., Reference Miller, Iosif, Young, Hill, Phelps Hanzel, Hutman and Ozonoff2016; Miller et al., Reference Miller, Musser, Young, Olson, Steiner and Nigg2019a); likewise, younger siblings of children with ADHD appear to be at elevated risk for ADHD but also for ASD (Miller et al., Reference Miller, Musser, Young, Olson, Steiner and Nigg2019a). This illustrates the core developmental psychopathology concepts of multifinality—that multiple different outcomes can arise from the same risk factor (e.g., family history of ASD)—and equifinality—that different initial risk factors (e.g., familial risk for ASD or ADHD) can result in a common outcome (e.g., a diagnosis of ASD) (Hinshaw, Reference Hinshaw2015). Person-centered research designs, also key to the developmental psychopathology framework, are critical to understanding the complex interactions and overlap among symptom dimensions of ASD and ADHD. The majority of studies have relied on clinically defined groups, most often through use of the DSM criteria, but a key limitation therein is the tendency to separate conditions with potentially shared underlying mechanisms into distinct categories. Person-centered approaches better recognize the overlap of symptoms and may help explain some of the heterogeneity inherent to clinical classification systems (Fusar-Poli et al., Reference Fusar-Poli, Solmi, Brondino, Davies, Chae, Politi and McGuire2019). Finally, transdiagnostic approaches—in which factors are investigated across those with or at risk for various conditions—particularly within a developmental framework, are also well-aligned with the developmental psychopathology perspective and may illuminate inflection points in development revealing ideal time periods for the application of prevention or intervention programs.
In this study, we sought to examine shared and distinct developmental pathways to ASD and ADHD symptomatology in infants at familial risk for each condition. We asked the following research questions: (a) Using person-centered (latent profile) approaches in a sample of infants enriched for ASD and ADHD, how many distinct groups of 3-year-old children emerge based on ADHD and ASD symptomatology, and (b) which infant behaviors are uniquely associated with ASD- versus ADHD-like latent classes, and which serve as shared early indicators of both?
Method
Overview of procedure
This study utilizes data from a prospective longitudinal investigation of infants at familial risk for ASD (ASD-risk), familial risk for ADHD (ADHD-risk), or low risk for both (low-risk) and was conducted under the approval of the University of California, Davis Institutional Review Board. Informed consent was obtained from parents prior to conducting assessments. Infants/toddlers were assessed by Masters- or PhD-level examiners unaware of risk group membership. Stringent administration and scoring fidelity procedures were in place to ensure minimal cross-examiner differences. The primary measures of interest for this study were obtained at the 12-, 18-, 24-, and 36-month assessments.
Participants
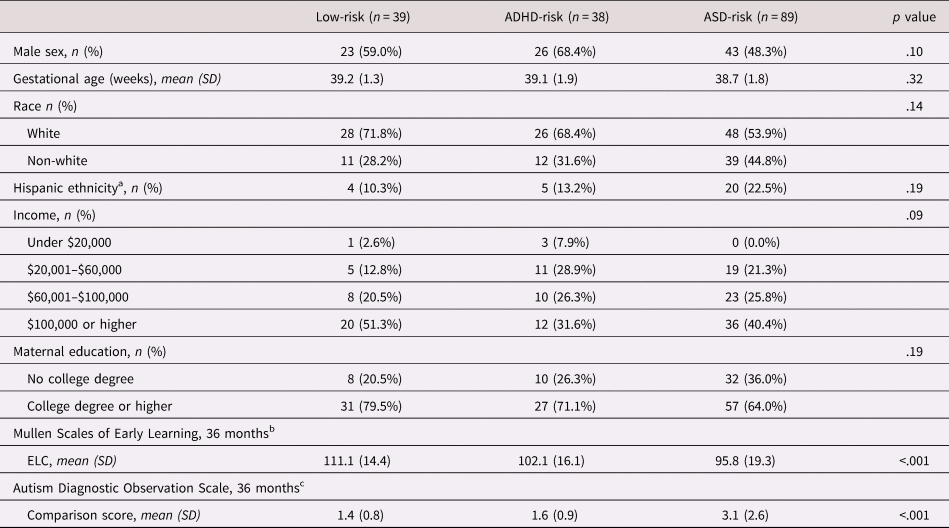
At study enrollment, participants were recruited into one of three familial risk groups: ASD-risk, ADHD-risk, or low-risk group. All were enrolled by 18 months of age, with 94% of the sample having completed their first assessment by 9 months of age. Table 1 displays characteristics of the sample by familial risk group.
Participant characteristics by recruitment group

Note. ADHD = attention-deficit/hyperactivity disorder; ASD = autism spectrum disorder; ELC = Early Learning Composite.
Overall group differences assessed using χ2 test for sex, race, ethnicity, and maternal education, and Fisher's Exact test for income, and one-way analysis of variance for continuous measures.
Missing for: a1 low-risk, 3 ADHD-risk, and 3 ASD-risk participants; b2 low-risk and 8 ASD-risk participants; c1 Low-risk and 1 ASD-risk participant.
The primary inclusion criterion for the ASD-risk group was status as a younger sibling of a child with ASD, with older sibling (proband) diagnosis confirmed using the Autism Diagnostic Observation Schedule, 2nd Edition (ADOS-2; Lord et al., Reference Lord, Rutter, DiLavore, Risi, Gotham and Bishop2012) and the Social Communication Questionnaire (Rutter, Bailey, & Lord, Reference Rutter, Bailey and Lord2003). ASD-risk group exclusion criteria included birth before 32 weeks of gestation and a known genetic disorder in the proband. Comorbid ADHD in the proband was permitted.
The primary inclusion criterion for the ADHD-risk group was status as a first-degree relative of someone with ADHD (i.e., older sibling or parent). Proband ADHD diagnoses were confirmed with an intake screener (Diagnostic and Statistical Manual, 5th Edition checklist for ADHD) and clinician documentation of diagnosis and treatment for ADHD via medical record. For sibling probands, if medical records were unavailable, the study team conducted a diagnostic evaluation including parent- and teacher-completed ADHD symptom rating scales and behavioral observation during cognitive testing. For parent probands, if medical records were not available, eligibility was based on self-report of prior ADHD diagnosis and a T-score ≥65 on the ADHD Index from the Conners Adult ADHD Rating Scale (CAARS; Conners, Erhardt, & Sparrow, Reference Conners, Erhardt and Sparrow1998), rated by partner/spouse. One parent proband with a self-reported prior diagnosis of ADHD had a T-score of 59 on the CAARS ADHD Index, but moderately elevated T-scores of 61 and 63 on the inattention/memory problems and hyperactivity/Restlessness subscales, respectively. We chose to include this family in analyses. ADHD-risk group exclusion criteria included birth before 32-weeks’ gestation; ASD in first-, second-, or third-degree relatives; or a known genetic disorder in the proband.
The primary inclusion criterion for the low-risk group was status as a younger sibling of a child with typical development. Exclusion criteria for the low-risk group were birth before 36 weeks of gestation; developmental, learning, or medical conditions in any older sibling; and ASD or ADHD in any first-, second-, or third-degree relative.
The final analyzed sample of 166 included n = 39 infants in the low-risk group, n = 89 infants in the ASD-risk group, and n = 38 infants in the ADHD-risk group.
Measures
Latent class identification measures at 36 months
Measures for latent class identification were selected to represent direct observation and parent perceptions of both ASD and ADHD symptomatology, and were acquired at the 36-month visit.
Autism Diagnostic Observation Scale, 2nd Edition (ADOS-2) (Lord et al., Reference Lord, Rutter, DiLavore, Risi, Gotham and Bishop2012). This semistructured interaction and observation measures symptoms of autism. It was administered at 18, 24, and 36 months of age by examiners trained to reliability and unaware of the child's risk status or history. Psychometric studies report high inter-rater reliability and agreement in diagnostic classification. The overall total (social affect + restricted and repetitive behavior) comparison score contributed to latent profile analysis (LPA) analysis.
Social Communication Questionnaire (SCQ)—Current (Rutter et al., Reference Rutter, Bailey and Lord2003). The SCQ is a parent report questionnaire that evaluates social and communication skills. Originally developed for children 4 years and older, studies have also supported its use in younger children (Corsello et al., Reference Corsello, Hus, Pickles, Risi, Cook, Leventhal and Lord2007). Total scores contributed to the LPA analysis.
Behavior Rating Inventory for Children (BRIC) (Gopin, Healey, Castelli, Marks, & Halperin, Reference Gopin, Healey, Castelli, Marks and Halperin2010). The BRIC is a clinician-rated measure originally developed to identify ADHD in preschoolers, and includes 5-point Likert scales ranging from 1 to 5 for each of three dimensions: Attention, activity, and impulsivity. Higher scores represent more problematic behavior. Anchors for each dimension were slightly modified to be appropriate for infants/toddlers. Examiners with Masters- or PhD-level training completed these ratings after administration of structured table testing. A total composite score of the three subscales ranging from 3 to 15 contributed to the LPA analysis.
Attention-Deficit/Hyperactivity Disorder Rating Scale, Preschool Version (ADHD-RS) (McGoey, DuPaul, Haley, & Shelton, Reference McGoey, DuPaul, Haley and Shelton2007). This parent report version of the ADHD Rating Scale has been modified for use with preschool children (McGoey et al., Reference McGoey, DuPaul, Haley and Shelton2007). Parents rate 18 inattentive and hyperactive-impulsive behaviors on a scale of 0 (never or rarely) to 3 (very often). Continuous scores can be obtained by summing the item-level scores; symptom counts can also be derived by tallying the number of items endorsed as “often” or “very often.” Parents completed this questionnaire about their child at 36 months of age; teacher/daycare provider ratings were also collected when available. McGoey et al. (Reference McGoey, DuPaul, Haley and Shelton2007) provide normative and reliability/validity data in preschoolers. Similar adaptations have been used in 24-month-old children (Gimpel & Kuhn, Reference Gimpel and Kuhn2000). The total parent-rated continuous (summed) score of inattention and hyperactivity-impulsivity, ranging from 0–54, contributed to the LPA analysis.
Infant behaviors associated with latent class membership
We examined differences in trajectories of the LPA classes on the following independent measures collected from 12 to 36 months of age. These variables spanned several domains designed to capture behaviors hypothesized to be shared versus unique early markers of ASD and ADHD: General developmental, attention, activity level, inhibitory control/impulsivity, social communication, and negative affect. We also examined, descriptively, the relation between LPA class membership and familial risk status, as well as clinical best estimate outcomes ascertained at the 36-month visit.
Clinical Best Estimate (CBE) outcome classification
At 36 months of age, participants were algorithmically classified into one of three outcome groups: ASD, ADHD Concerns, or Non-ASD/Non-ADHD Concerns. Those classified with ASD met Diagnostic and Statistical Manual of Mental Disorders, 5th edition (DSM-5) diagnostic criteria for ASD and had ADOS-2 Total Comparison Scores ≥4. Classification of the ADHD Concerns outcome group was designed to capture children who, given their young age, did not necessarily meet diagnostic criteria for ADHD, but who exhibited clinically relevant levels of ADHD symptoms that may reflect increased propensity for developing the full phenotype over time. Children in this outcome group met three criteria: (a) obtained a clinical best estimate outcome of “ADHD Concerns” based on examiner observation; (b) demonstrated at least four DSM-5 ADHD symptoms within any one symptom category (i.e., inattention or hyperactivity-impulsivity) or at least five DSM-5 symptoms across symptom categories (i.e., inattentive and hyperactive-impulsive combined) and raters (examiner, parent, teacher); and (c) had at least one symptom endorsed by a parent or teacher on the ADHD Rating Scale, Preschool Version (McGoey et al., Reference McGoey, DuPaul, Haley and Shelton2007). Diagnosis of ASD and completion of the DSM-5 ADHD checklist was conducted by, or under supervision of, a licensed psychologist. All other children were classified into the Non-ASD/Non-ADHD Concerns outcome group.
General development
The Mullen Scales of Early Learning (MSEL) (Mullen, Reference Mullen1995) was administered as a measure of general development. This standardized developmental test for children birth to 68 months was used to evaluate cognitive functioning. Four subscales were administered: Fine motor, visual reception, expressive language, and receptive language. Raw scores can be converted to T-scores and an overall composite score of all four subscales, the Early Learning Composite (ELC), can be obtained using published normative data. MSEL subscales have excellent internal consistency (median 0.91) and test–retest reliability (median 0.84). It was administered at each study visit. Composite scores reflecting nonverbal (visual reception, fine motor) and verbal (receptive and expressive language) skills were computed based on averaged raw scores and examined as general developmental predictors of LPA group membership.
Behavioral coding of attention, activity level, and impulsivity/inhibitory control
Videos recorded during the assessment session were coded in real time using BORIS behavioral observation software (Friard & Gamba, Reference Friard and Gamba2016). Behavior was coded during the first 5 minutes of the MSEL (Mullen, Reference Mullen1995) fine motor subtest at each visit. This context was selected because (a) it was assessed at each visit, (b) the tasks require attention and cooperation in the context of a structured assessment during which the infant/toddler is expected to remain seated, and (c) the tasks involve toys and objects thought to be of interest to infants/toddlers. If the fine motor subtest was completed in less than 5 minutes, the remaining time was coded from the visual reception subtest, resulting in a full 5 minutes of coded behavior for each participant at each of the three visit ages. In rare instances, parts or all of the fine motor and visual reception subscales could not be coded owing to skipped or nonstandard administration (e.g., on the floor and out of the view of the camera); in these cases, behavior was coded from video of any available MSEL subscale. Across all visits, 80.2% of coded videos consisted of fine motor only, 18.0% consisted of a combination of fine motor and visual reception, and 1.8% consisted of any Mullen subscale. Frequencies of each behavior were analyzed.
The code development process was iterative and initially involved review of filmed developmental assessments from an independent sample of infants as well as review of the literature utilizing similar methods in older children (e.g., DeWolfe, Byrne, & Bawden, Reference DeWolfe, Byrne and Bawden2000). Codes were then applied to an additional independent sample and refined as needed before establishing reliability. Coders unaware of child history or familial risk status were initially trained to 70% agreement on all codes, as measured by intraclass correlation coefficients (ICCs). Average ICCs across all coders were in the good-to-excellent range for frequencies of all codes (Cicchetti, Reference Cicchetti1994; Mitchell, Reference Mitchell1979): Inattention 0.82, out-of-seat 0.96, and grab 0.84. Twenty percent of data were double-coded to maintain ongoing reliability.
Inattention was defined as any instance of inattentive/bored/distracted behavior (e.g., looking away from test materials or examiner, or engaging in an off-task behavior, to an extent that requires the examiner to request that the child return to the task; clear refusals of task materials and/or refusals to participate in the task). Activity level/hyperactivity was measured via the frequency of “out-of-seat” behavior. Briefly, this code is described as any instance in which, in a clear attempt to get free, contact between the infant/child's bottom is severed from the parent's lap or chair, and/or clear attempts to get out of seat/parent's lap or chair even if contact is not severed. Impulsive behavior was indexed by coding the frequency of grabbing behavior during the behavioral coding process, described as attempts (successful or unsuccessful) to obtain objects intrusively and/or when it is inappropriate to do so (descriptions available in Supplemental Table 1).
Social behavior
After each visit, examiners rated the child's behavior using an experimenter rating of social behavior previously shown to distinguish infants developing ASD from those developing typically (Ozonoff et al., Reference Ozonoff, Iosif, Baguio, Cook, Hill, Hutman and Young2010). Three items were rated using a 5-point scale, with higher scores reflecting higher frequencies of the social behavior in question: (a) frequency of eye contact, (b) frequency of shared affect, and (c) overall social responsiveness. These three scores were summed to create a social engagement composite score ranging from 3 to 15. This metric has been shown to be correlated with behavior coded from video (gaze to face, social smiles) (Ozonoff et al., Reference Ozonoff, Iosif, Baguio, Cook, Hill, Hutman and Young2010).
Behavioral coding of negative affect
In addition to inattentive, hyperactive, and impulsive behavior, the same segment of the MSEL was coded for negative affect, described as facial expressions, vocalizations, or behavior indicating sadness, anger, or frustration, including (but not limited to) frowns, crying, grimaces, whimpering, whining, and pouting. As with the other behavioral codes, coders unaware of child history or familial risk status were initially trained to 70% agreement, as measured by ICCs, and 20% of data were double-coded to maintain ongoing reliability. The average ICC across all coders for frequency of negative affect behavior was 0.87. Negative affect specifically was selected because it has been implicated in both ASD and ADHD and the presence of high levels of negative affect has been suggested as a potential transdiagnostic risk factor in infancy/early childhood (Johnson et al., Reference Johnson, Gliga, Jones and Charman2015).
Statistical analysis
Using LPA, we first sought to identify distinct patterns of ADHD and ASD symptomatology based on 36-month ADOS Total Comparison Score, SCQ total score, ADHD-RS total score, and BRIC total score. Children were required to have at least one ASD-related measure (i.e., ADOS or SCQ) and one ADHD-related measure (i.e., ADHD-RS or BRIC); the majority of children (85%) had all four measures. The ADOS Total Comparison Score had a large number of observations clustered at the lower limit of the distribution (i.e., one) and was treated as a censored normal variable in the LPA analysis. Two- through five-class LPA models were compared. In addition to statistical goodness-of-fit criteria, we considered whether the classes captured clinically meaningful features and the proportion of participants represented in the classes (Nylund, Asparouhov, & Muthén, Reference Nylund, Asparouhov and Muthén2007). Goodness-of-fit criteria included Bayesian information criterion (BIC) and sample-size adjusted BIC, Akaike Information Criterion (AIC), entropy, and Vu–Lo–Mendell–Rubin, Lo–Mendell–Rubin adjusted, and Parametric Bootstrapped likelihood ratio tests (Lo, Mendell, & Rubin, Reference Lo, Mendell and Rubin2001; Nylund et al., Reference Nylund, Asparouhov and Muthén2007). Smaller AIC and BIC values indicate better fit and entropy values closer to 1 indicate better classification quality. The likelihood ratio tests compare the fit of the specified class solution to models with one less class, and a significant p value indicates the specified model is preferred. The local maximum problem was addressed by using a large number of starting points (up to 500) to replicate each model.
Each LPA model provides two important pieces of information: it identifies the number of latent subgroups within the overall sample and estimates posterior probabilities for each participant's assignment to each latent subgroup. For descriptive analyses, the highest posterior probability from the best fitting model was used to assign each child to the most likely subgroup. For analyses examining differences in trajectories of infant behaviors across latent classes, multiple pseudo-class draws were utilized to reduce bias by accounting for the uncertainty in class assignments (Bandeen-roche, Miglioretti, Zeger, & Rathouz, Reference Bandeen-roche, Miglioretti, Zeger and Rathouz1997). Children were randomly classified into latent classes 100 times based on their distribution of posterior probabilities from the best fitting LPA model. The subsequent analyses were performed 100 times (i.e., for each draw) and results were combined across draws using standard methods for multiple imputation for missing data (Rubin, Reference Rubin1987).
Next, we assessed behavioral and general development differences among the latent classes from 12 to 36 months. These analyses were conducted within a generalized linear mixed-effects models framework (McCulloch, Searle, & Neuhaus, Reference McCulloch, Searle and Neuhaus2008) because it can accommodate both dependent variables that are normally distributed (e.g., MSEL subscales, examiner ratings) and counts (behavior code frequencies). An advantage of this approach is the ability to account for the correlated structure of the data owing to repeated assessments over time and to produce valid inference under the assumption that data were missing at random. We used identity link and a normal variance function for MSEL, and examiner-rated social engagement data and a log link and Poisson variance function to model the frequencies of coded behavior. For all measures collected longitudinally (MSEL, coded behavior, examiner ratings of social engagement), we first fitted models that included fixed effects for latent class group and child age in years (centered at 12 months), including linear, quadratic, and cubic effects for child age, as well as age by latent class group interactions. We then examined the higher order age effects and their interactions with group, and terms were sequentially removed unless they contributed significantly to the model. Owing to the centering, the intercept in the models provides an estimate of the mean level in the reference group at baseline (12 months). The models also included random effects for intercept and linear effect of age to account for the within-child dependence. Following significant overall tests for the interaction between latent class group and age, we examined pairwise differences between latent class groups at each visit age.
LPA was performed in Mplus version 8.0 (Muthén & Muthén, Reference Muthén and Muthén2017). All other analyses were implemented using SAS Version 9.4 (SAS Institute Inc., Cary, NC). All tests were two-sided, and p values < .05 were considered statistically significant.
Results
Latent class results
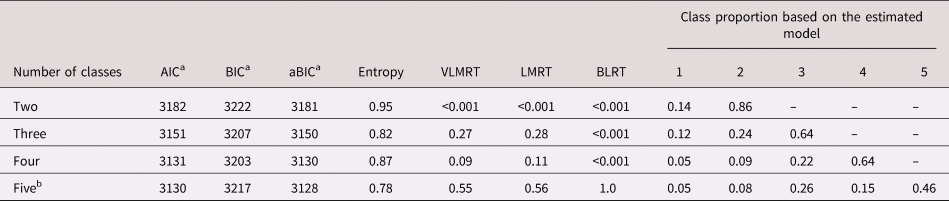
Fit indices for two-class to five-class solutions are summarized in Table 2.
Model fit statistics and estimated class proportions for latent profile models with two to five classes
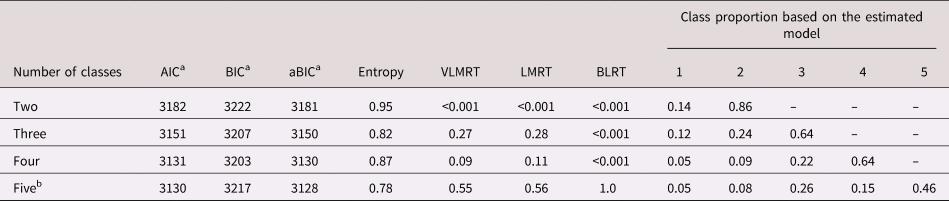
a Lower numbers indicate more optimal model fit. bReported model did not replicate after 10,000 random starts.
Note. AIC = Akaike Information Criterion; BIC = Bayesian Information Criterion; aBIC = Sample Adjusted Bayesian Information Criterion; VLMRT = Vo–Lo–Mendell–Rubin Likelihood Ratio Test; LMRT = Lo–Mendell–Rubin Adjusted Likelihood Ratio Test; BLRT = parametric bootstrapped likelihood ratio test.
Small p values of the VLMRT, LMRT, and BLRT tests indicate that the model with a greater number of classes fits the data better than the previous model. Entropy closer to 1 indicates the children are well categorized into classes.
The five-class model did not replicate, despite using 10,000 random starts. Three- and four-class solutions provided similar classification quality (entropy 0.82 and 0.87, respectively); BIC and AIC indices suggested that a four-class solution was better, although the BIC values were similar in the three- and four-class models. However, the four-class model identified a class that included less than 5% of the sample. Thus, we chose a three-profile solution as this model provided the most clinically meaningful distribution of classes. Based on the pattern of ADHD and ASD symptom measures, the three classes were named “Typically Developing (TD)” (low symptom scores on all measures), “ADHD” (elevated ADHD-RS and BRIC, low SCQ and ADOS), and “ASD” (elevated SCQ and ADOS, elevated ADHD-RS and BRIC). There was no class with high ASD symptoms that did not also have elevated ADHD symptoms. The highest posterior probability was used to assign each child to one of these three groups; 108 (65.1%) were assigned to the TD class, 39 (23.5%) to the ADHD class, and 19 (11.4%) to the ASD class (average assignment probabilities for the classes were .95, .86, and .93, respectively).
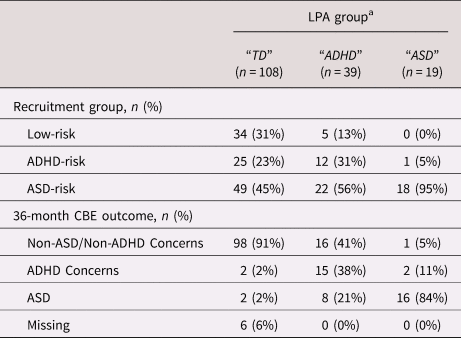
Next, we examined associations of familial risk groupings and clinical outcome classifications with the latent subgroup membership (Table 3). Using the highest probability assignment, of the 89 participants in the ASD-risk group, 49 (55.1%) were classified into the TD class, 22 (24.7%) into the ADHD class, and 18 (20.2%) into the ASD class. Of the 38 ADHD-risk participants, 25 (65.8%) were classified into the TD class, 12 (31.6%) into the ADHD class, and 1 (2.6%) into the ASD class. Of the 39 participants in the low-risk group, 34 (87.2%) were classified into the TD class and 5 (12.8%) were classified into the ADHD class; none were classified into the ASD class. We also examined the mapping of 36-month CBE outcome ratings to LPA classifications. Children with ASD outcomes were primarily classified into the ASD class (61.5%), followed by the ADHD class (30.8%). Children with ADHD Concerns outcomes were primarily classified into the ADHD class (78.9%), followed by the ASD class (10.5%). Children with Non-ASD/Non-ADHD Concerns outcomes were primarily classified into the TD class (85.2%), followed by the ADHD class (13.9%).
Recruitment group and 36-month clinical best estimate outcome classifications stratified by latent profile group

Note. TD = typically developing; ADHD = attention-deficit/hyperactivity disorder; ASD = autism spectrum disorder; LPA = latent profile analysis; CBE = clinical best estimate. Owing to rounding, percentages may not sum exactly to 100.
a Children were assigned to LPA groups using highest posterior probability.
Trajectories of infant behaviors and associations with latent class membership
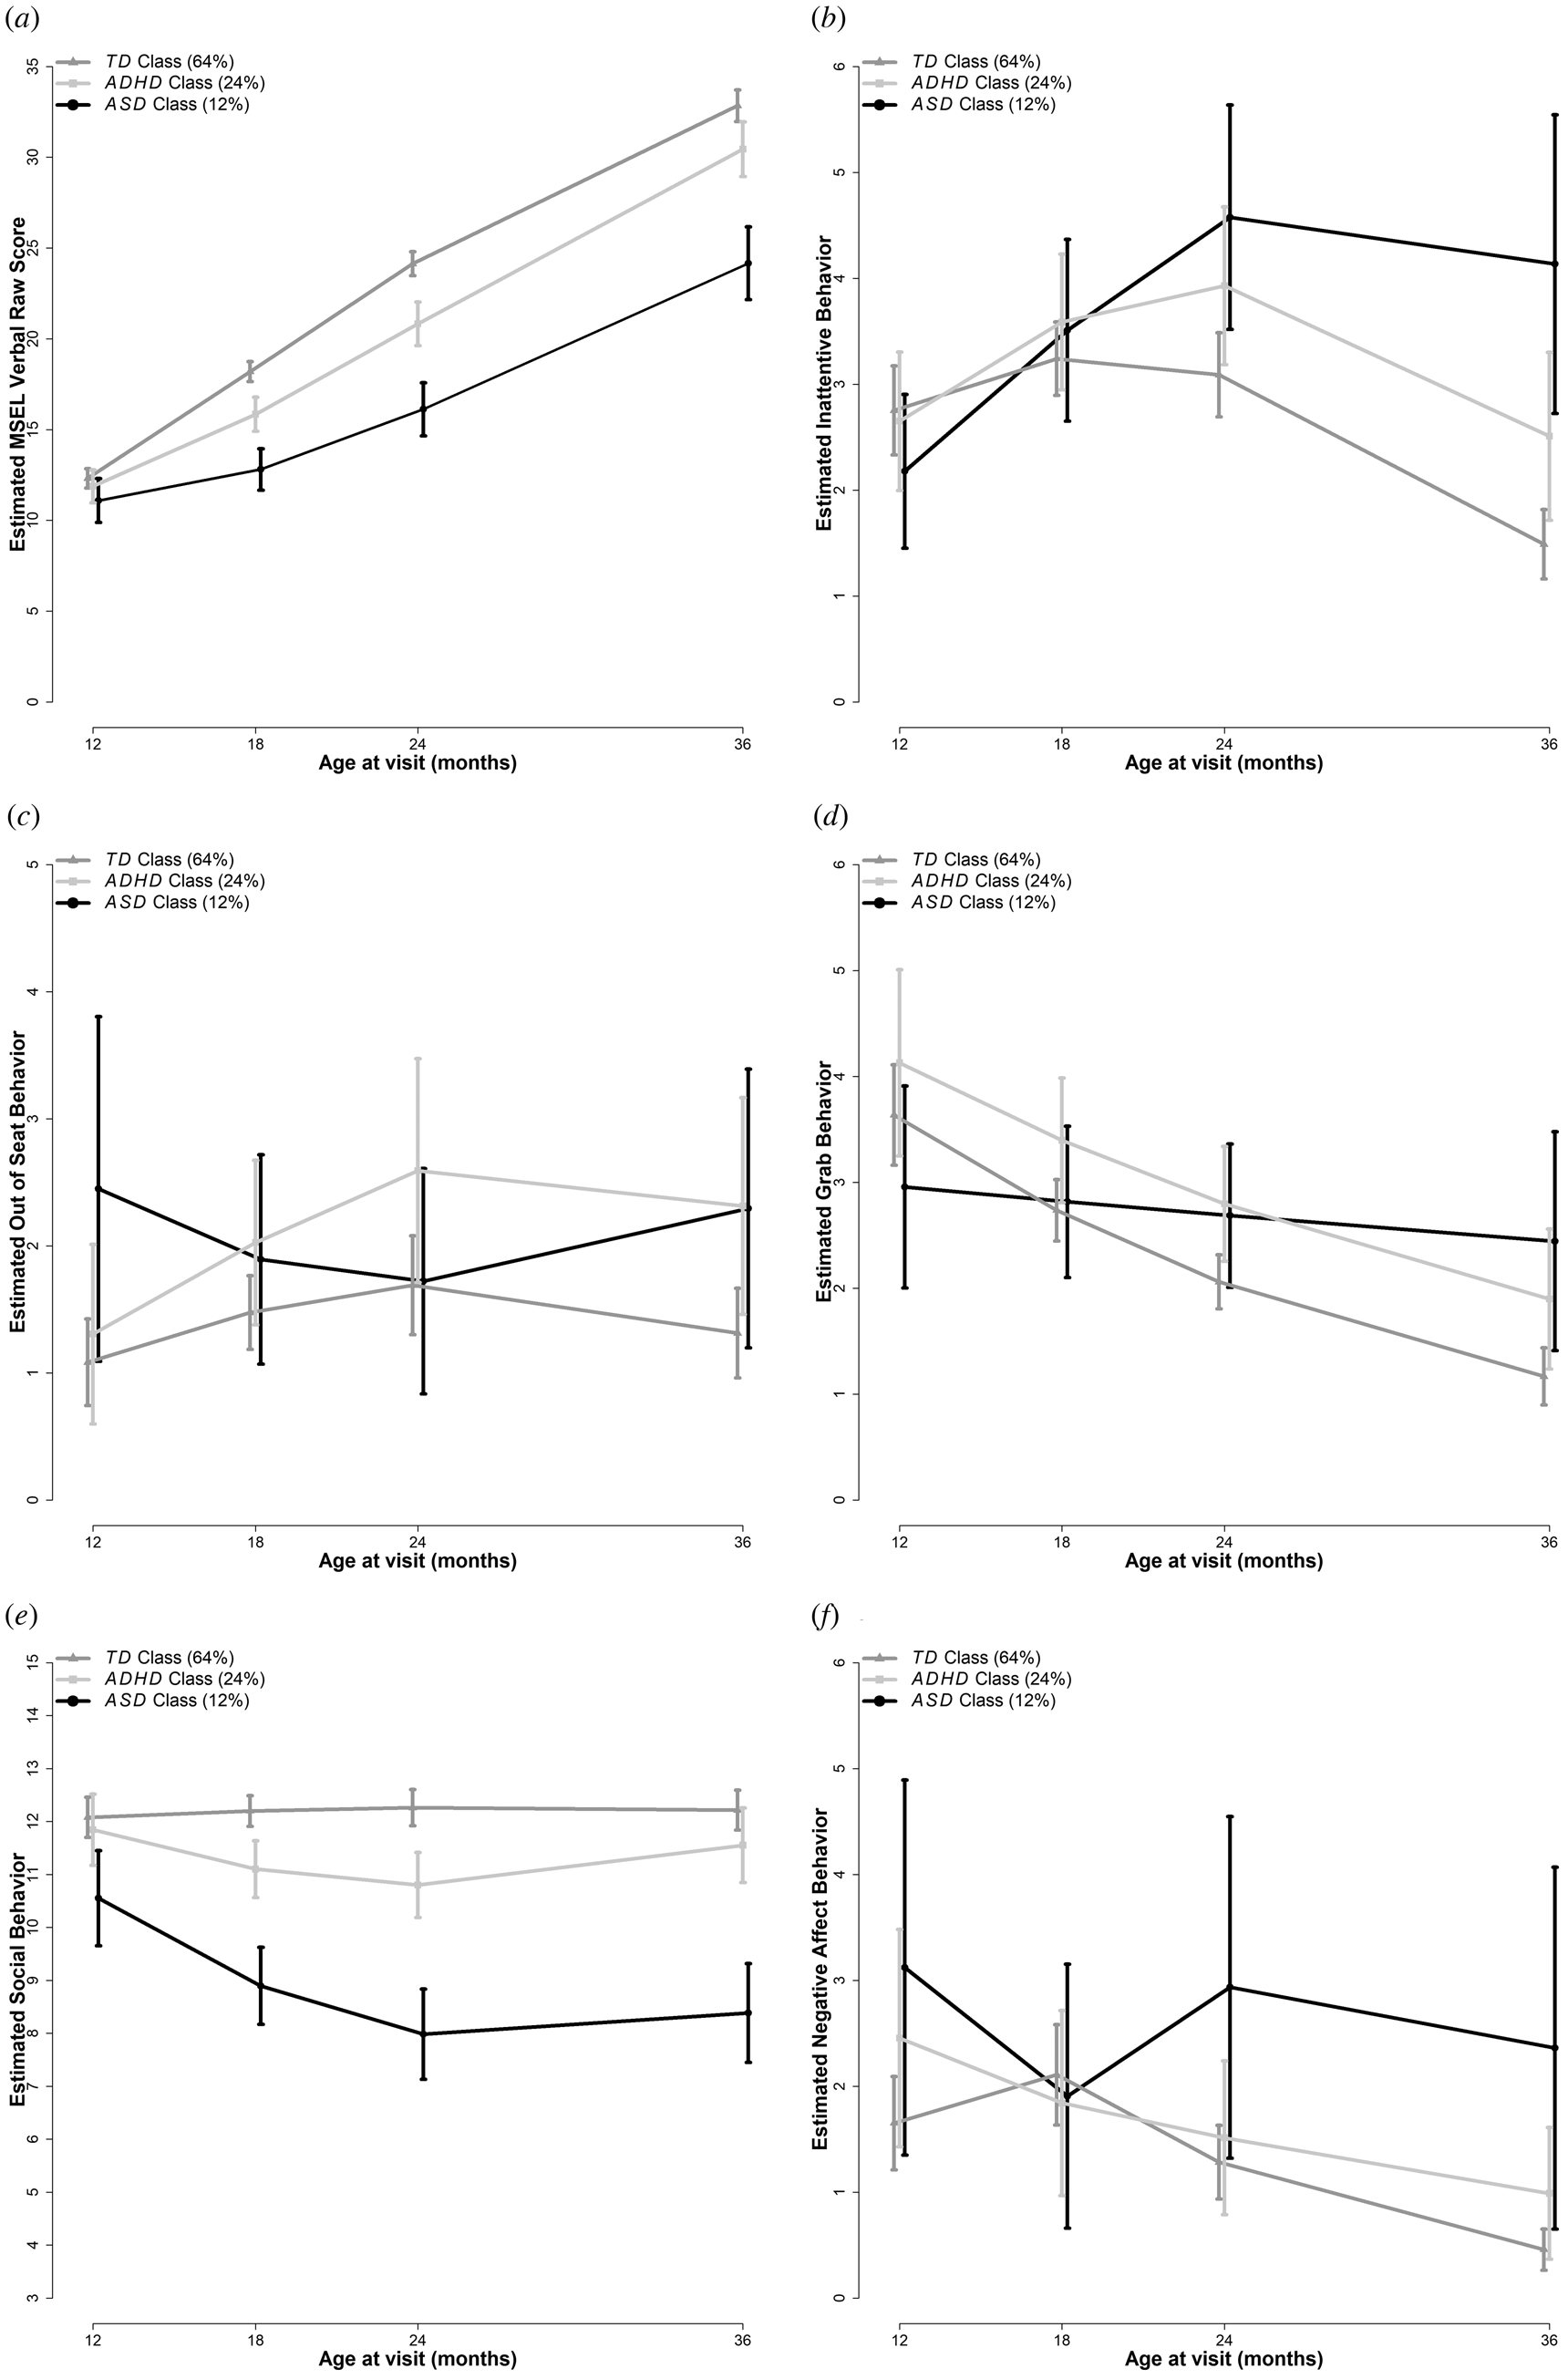
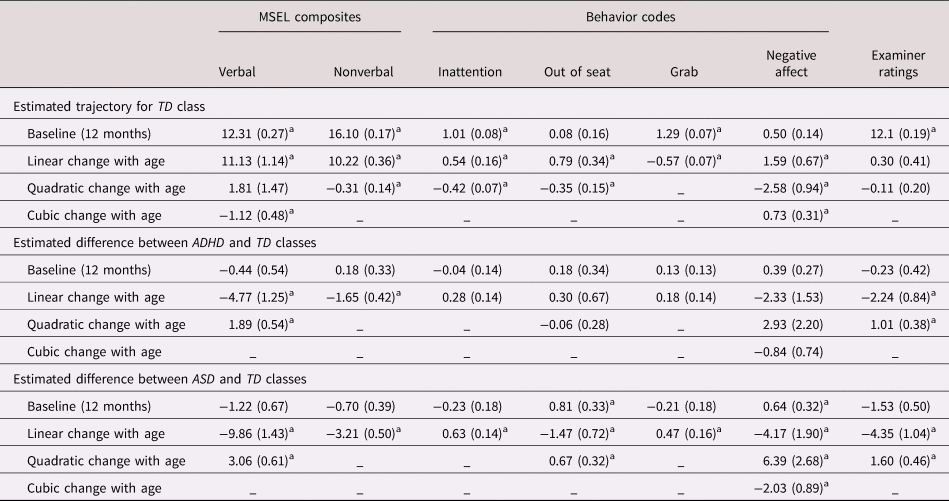
Results from analyses focused on identifying trajectories of infant behaviors associated with LPA membership are summarized in Table 4, Supplemental Table 2, and Figure 1.
Trajectories of infant behaviors among the TD, ADHD, and ASD classes from 12 to 36 months of age. Error bars represent 95% Confidence Intervals. (a) Mullen Scales of Early Learning verbal raw scores. The three groups significantly differed by 18 months, which continued through 36 months of age. The ASD class exhibited the lowest scores, the TD class had the highest scores, and the ADHD class showed intermediate scores. (b) Coded frequency of inattentive behavior. The ASD and ADHD classes exhibited significantly higher levels compared with the TD class at 24 and 36 months but did not differ themselves; the ASD class also demonstrated significantly higher levels than the ADHD class at 36 months. (c) Coded frequency of out-of-seat behavior. The ASD class exhibited significantly higher levels compared with the TD class at 12 and 36 months of age. The ADHD class also demonstrated significantly higher levels than the TD class at 36 months of age and did not differ from the ASD class. (d) Coded frequency of grabbing behavior. The ADHD class demonstrated significantly higher levels compared with the TD class from 18 to 36 months of age. The ASD class exhibited significantly higher levels than the TD class at 36 months of age only. (e) Examiner-rated social engagement. The ASD class exhibited significantly lower scores compared with both other groups from 12 to 36 months of age. At 18 and 24 months, the ADHD class also had significantly lower scores than the TD class, resolving by 36 months. (f) Coded frequency of negative affect. The ASD class demonstrated significantly higher levels than the TD class at 12, 24, and 36 months of age but did not differ from the ADHD class, which also did not differ from the TD class.

Parameter estimates (SE) from the generalized linear mixed-effects models predicting Mullen Scales of Early Learning composite scores, behavior codes, and examiner ratings

Note. ap < .05. MSEL = Mullen Scales of Early Learning; SE = standard error. Age was measured in years. Mixed-effects linear regression models were used for Mullen Scales of Early Learning composites and examiner ratings and mixed-effects Poisson regression models for behavior codes. To account for the uncertainty in class assignments in analysis, we used 100 pseudo-class draws to randomly classify children into latent classes 100 times based on their distribution of posterior probabilities from the best fitting LPA model, performed the analyses 100 times (i.e., for each draw), and combined results across draws using standard methods for multiple imputation for missing data.
General development
At 12 months of age, the three groups did not differ significantly from one another. However, the TD class had significantly higher rates of linear growth than the other two classes, for both verbal and nonverbal composites. This pattern resulted in the three classes differing from each other from 18 to 36 months, with the ASD class having the lowest scores followed by the ADHD class.
Behavioral coding of attention, activity level, and impulsivity/inhibitory control
Table 4 presents the results (on the log scale) of the Poisson mixed-effects models fitted to the behaviors measured via behavioral coding. To ease interpretation, we calculated estimates and 95% confidence intervals (CI) on the original scale (see Supplemental Table 1). Children in the three classes were indistinguishable from each other at 12 months of age based on inattentive behavior. The interactions between the quadratic effect of age and group were statistically significant; all groups had an initial increase in behavior, but the TD class had a decrease in inattentive behavior between 18 and 36 months of age. The ADHD class demonstrated a slower decline in behavior after 18 months and the ASD class continued to display increases in inattentive behavior until 24 months of age. This pattern resulted in the ASD and ADHD classes having higher frequencies of inattention than the TD class at 24 months, and all three groups differing from each other at 36 months, with the ASD class exhibiting the highest level of this behavior, followed by the ADHD class, and then the TD class.
In terms of hyperactive behavior, at 12 months of age, the ASD class exhibited 125% more behaviorally coded out-of-seat behavior than the TD class (p = .01). The frequency of out-of-seat behavior declined across subsequent 18–24-month visits in the ASD class, while the ADHD class demonstrated a sharp increase in this behavior at 18 months and continued to exhibit high levels throughout 36 months of age. In contrast, the TD class showed modest changes from 12 to 36 months of age. Significant differences between the TD class and both the ASD and ADHD classes were evident at 36 months of age, with the ASD class exhibiting 75% more, and ADHD class 76% more, out-of-seat behaviors than the TD class (p = .047 and .02, respectively).
With respect to the frequency of grabbing behavior, at 12 months of age, there were no significant group differences. However, the three groups demonstrated different patterns of behavior over time. While the ASD class exhibited relatively stable levels of grabbing over time, the other two groups showed decreases through 36 months of age. The ADHD class demonstrated significantly higher levels compared with the TD class from 18 to 36 months of age. At 36 months of age, the ASD class exhibited 121% more, and the ADHD class exhibited 62% more, grabbing behavior than the TD class (p = .003 and .03, respectively).
Social behavior
At 12 months of age, examiner ratings of social engagement were significantly lower for the ASD class than both the ADHD (estimated difference (est.) = −1.3, p = .03) and TD classes (est. = −1.5, p = .002), which persisted through 36 months of age. The interactions between group and both the linear and quadratic effect of age were significant. The TD class had stable levels of social engagement behavior between 12 and 36 months. In contrast, the level of social engagement for the ASD class decreased through the 24-month visit and continued to be low at 36 months. The ADHD class experienced a small decline from the baseline levels (about 1-point lower at 18 and 24 months) and differed significantly from the TD class at 18 and 24 months of age, but returned to values similar to baseline by 36 months.
Behavioral coding of negative affect
At 12 months of age, the ASD class exhibited 90% more negative affect behavior, as measured by second-by-second behavioral coding, than the TD class (p = .047). These high levels of negative affect generally persisted in the ASD class through the 36-month visit, with 129% more negative affect behaviors at 24 months and 415% more negative affect behaviors at 36 months (p = .008 and < .001, respectively) than the TD class. In contrast, negative affect levels for both ADHD and TD classes declined through 36 months of age, with the TD class experiencing a sharper decline after first showing a small increase at 18 months. The ADHD and TD classes did not differ at any age.
Discussion
In this study, we took a developmental psychopathology approach to understanding shared and distinct developmental pathways to ASD and ADHD symptoms in a high-risk sample. We used person-centered methods, allowing the data to inform participant groupings based on examiner- and parent-rated ADHD and ASD symptom profiles at 36 months of age, potentially addressing heterogeneity inherent to categorical/clinically defined diagnostic approaches.
In this sample, we did not find a distinct group of children with high ASD symptomatology who did not also have high levels of parent-/examiner-rated ADHD symptoms. It is possible that with a larger sample, more classes may have been detected. However, the three classes were quite distinct on the LPA classification measures, with Cohen's ds greater than 0.92 in most cases (examiner-rated ADHD behavior on the BRIC was the one exception, with a medium-sized effect of d = 0.54 for the ADHD vs. ASD class contrast). If replicated in a larger sample, this may suggest that elevated ASD symptoms frequently co-occur with elevated symptom ratings of attention and behavior dysregulation in the preschool period.
These findings do not imply that all young children with ASD have comorbid ADHD symptoms or diagnoses. Indeed, there are a number of reasons ADHD symptom ratings might be elevated in ASD, and in the preschool period in general. The ADHD measures we used have not been validated in young children with ASD. Existing ADHD symptom measures likely do not capture qualitative differences in the behaviors of interest (e.g., ASD-like social inattention vs. ADHD-like distractibility), and superficial similarities in the behaviors may lead to higher informant ratings for a variety of different reasons. Indeed, these behaviors may have been difficult for both parents and examiners to rate since relatively higher levels of inattention, hyperactivity, and impulsivity are normative during the preschool period. It also remains unclear whether high ratings of inattention, hyperactivity, and/or impulsivity in the context of elevated ASD symptoms reflect the same constructs as they do in the absence of ASD symptoms. For example, high observer-rated activity levels could reflect aimless wandering and difficulty sitting in a chair secondary to social or communication challenges in one child (e.g., reduced interest in people and task materials, reduced responsiveness to social reinforcement, and language deficits), and frank motor overactivity in another. Similarly, inattention in the context of ASD symptoms may not index the same quality of inattentiveness and distractibility as would be expected in ADHD, but may instead reflect alternate interests (e.g., in sensory stimuli) or lack of cooperation with examiner requests (i.e., social inattention) that is conceptually distinct. Notably, despite examiners providing high ratings on a measure of inattention, hyperactivity, and impulsivity, as well as objective video coding documenting high frequencies of these behaviors in the session, examiners rarely ascribed secondary clinical outcomes of “ADHD Concerns” to children diagnosed with ASD (only 5 of the 26 children with ASD diagnoses received secondary outcomes of “ADHD Concerns”), suggesting that elevated informant-rated ADHD symptoms do not translate into comorbid diagnoses of ADHD in all preschool-aged children with ASD. Ultimately, we do not yet have a robust understanding of the meaning of elevated ADHD symptom ratings in the context of early ASD.
Nevertheless, while surprising and not predicted a priori, our finding that the majority of the children with ASD fell in classes with high levels of informant-rated inattention, hyperactivity, and impulsivity is consistent with work conducted in older children and adolescents and the high rates of comorbidity between the two disorders (Mayes, Calhoun, Mayes, & Molitoris, Reference Mayes, Calhoun, Mayes and Molitoris2012; reviewed in Antshel, Zhang-James, Wagner, Ledesma, & Faraone, Reference Antshel, Zhang-James, Wagner, Ledesma and Faraone2016). For example, in a large, population-based sample (n = 644), van der Meer and colleagues utilized a latent class approach based on ASD and ADHD symptoms finding five distinct classes, two of which did not evidence symptom elevations, one that exhibited high levels of ADHD symptoms but low ASD symptoms, and two that were characterized by high levels of both ASD and ADHD symptoms—there was no class characterized by high ASD symptoms in the absence of elevated ADHD symptoms (Van Der Meer et al., Reference Van Der Meer, Oerlemans, Van Steijn, Lappenschaar, De Sonneville, Buitelaar and Rommelse2012). This study relied only on parent report of symptoms (SCQ, Conners Parent Rating Scale); in an effort to address concerns about rater effects, we also included metrics rated by examiners who were unaware of the child's family history or prior testing, resulting in a relatively similar pattern of findings in a preschool sample. Taken together, these findings may mean that when ASD and ADHD phenotypes are examined dimensionally, they overlap far more than they do when examined categorically. On the other hand, eight of the children with CBE outcomes of ASD in our sample were classified into the ADHD class; this appears to have been driven by relatively lower SCQ scores but similar ADOS scores compared with the children with ASD outcomes who were not classified into the ADHD class.
The fact that the ASD class not only had elevated levels of ASD symptoms but also elevated ADHD symptoms makes it difficult to determine whether any similarities in patterns of infant behaviors between the ASD and ADHD LPA classes are due to the presence of ADHD symptoms in the ASD class versus reflecting partially shared underlying mechanisms between ASD and ADHD. Future, larger studies may be better powered to uncover a class of children with ASD symptoms who do not also have elevated ADHD symptom ratings, which may provide clarification on these points.
In this study, we examined both putative nonspecific (i.e., general development, negative affect) and ASD-/ADHD-specific factors. With respect to the hypothesized nonspecific factors of verbal and nonverbal developmental functioning, some similarities and differences emerged between the ASD and ADHD classes. Results reflected the greatest impairment in the ASD class, followed by the ADHD class beginning at 18 months of age and persisting through 36 months of age, but the two groups both performed worse than the TD class at these timepoints. These findings suggest that a difference in degree of impairment, rather than type, best distinguished eventual ADHD- versus ASD-like profiles early in life. We also examined negative affect as a nonspecific factor since it has been suggested as a potential transdiagnostic marker of ASD and ADHD in the first several years of life (Johnson et al., Reference Johnson, Gliga, Jones and Charman2015; Sullivan et al., Reference Sullivan, Holton, Nousen, Barling, Sullivan, Propper and Nigg2015). However, our findings suggest that high levels of negative affect may be specific to infants developing elevated ASD symptomatology. The ADHD class did not show differences from the TD class at any timepoint, but the ASD class exhibited higher levels of negative affect at 12, 24, and 36 months of age compared with the TD class.
Despite the overlap in ADHD symptomatology between the ASD and ADHD classes, some differences did emerge with respect to domains closely linked to the core ASD and ADHD phenotypes. In terms of attention skills measured via behavioral coding, both the ASD and ADHD classes demonstrated differences from the TD class at 24 and 36 months of age. Children classified into the ASD class also exhibited higher levels of coded inattention than the ADHD class at 36 months of age. This is consistent with prior work showing that toddlers with ASD exhibit high levels of ADHD-like inattentive behavior (Konst, Matson, Goldin, & Rieske, Reference Konst, Matson, Goldin and Rieske2014), and suggests that problems with attention may be present in preschoolers with high ADHD symptoms earlier than originally thought. Disruptions in the ability to sustain attention may be a transdiagnostic indicator of both ASD- and ADHD-like symptoms by 24 months of age.
In terms of activity level/hyperactivity, the ASD and ADHD classes showed similarly high levels of out-of-seat behavior at 36 months of age compared with those in the TD class, but early trajectories again differed, with the ASD class showing early differences from the TD class (at 12 months of age), which resolved and then re-emerged at 36 months of age, whereas the ADHD class had similar levels to TD class at 12 months, but exhibited an increase in out-of-seat behavior at 18 and 24 months, resulting in statistically significant differences from the TD class at the 36-month visit. These patterns are at least partly consistent with the concept of equifinality, implying differing trajectories leading to a similar outcome of high levels of activity by 3 years of age.
More clearly distinct patterns were evident with respect to trajectories of impulsivity/inhibitory control, as measured via the frequency of grabbing behavior during structured testing. Here, the ASD class exhibited similar levels from 12 to 36 months of age, whereas the ADHD and TD classes showed distinct declines over time. However, both the ASD and ADHD classes exhibited higher levels of impulsive behavior at 36 months of age compared with the TD class. The lack of change in the ASD class between 12 and 36 months in our sample is of interest, and could reflect a lack of social learning over time given the socially inappropriate nature of grabbing behavior. That is, the lack of developmental improvement in the ASD class could be related to problems integrating awareness of social rules, consistent with prior work, demonstrating a relationship between inhibitory control and social cognition (Ames & White, Reference Ames and White2011). Our findings of early differences in activity level and impulsive behavior in the ASD class is in contrast to prior work showing that increased activity level and impulsivity were related to eventual ADHD, but not ASD, symptoms (Shephard et al., Reference Shephard, Bedford, Milosavljevic, Gliga, Jones, Pickles and Charman2019), although this study focused only on a sample of infants at risk for ASD.
Differences in patterns of social behavior were measured via examiner ratings of the frequency of social engagement behaviors (i.e., eye gaze, social smiles, overall level of initiations/responses). In this domain, the ASD class exhibited the greatest and earliest impairment, by 12 months of age and persisting through 36 months of age, consistent with prior work in infants developing clinical ASD diagnoses (Ozonoff et al., Reference Ozonoff, Iosif, Baguio, Cook, Hill, Hutman and Young2010). However, the ADHD class—which was characterized by low levels of ASD symptomatology at 36 months—also exhibited lower levels of social engagement behavior than the TD class at interim ages (18 and 24 months), not differing from the ASD class. This suggests that there may be periods of development during which it is more difficult to determine the predictive value of lower social engagement with respect to distinguishing eventual ASD versus ADHD symptomatology while symptoms are still in the process of emerging. However, 56% of the children classified into the ADHD class had a family history of ASD, and therefore this finding may alternatively reflect a manifestation of the broader autism phenotype (Ozonoff et al., Reference Ozonoff, Young, Belding, Hill, Hill, Hutman and Iosif2014).
Our study had several strengths including the inclusion of a group of infants at familial risk for ADHD, a population that has rarely been studied (but see Auerbach et al., Reference Auerbach, Berger, Atzaba-Poria, Arbelle, Cypin, Friedman and Landau2008; Goodwin et al., Reference Goodwin, Salomone, Bolton, Charman, Jones, Pickles and Johnson2016; Sullivan et al., Reference Sullivan, Holton, Nousen, Barling, Sullivan, Propper and Nigg2015), the use of a person-centered approach, and careful behavioral characterization of the constructs of interest. However, it is not without limitations. Our sample is small for latent class approaches and it may be possible to detect a subgroup of children with high ASD symptoms but without high ADHD symptoms in a larger sample. Entropy values, although higher than 0.80, were below 0.90, suggesting slightly less distinct classes. Empirically derived classifications based on measures that reflect putative transdiagnostic processes (e.g., self-regulation, executive functioning) and/or objective measurement of hypothesized underlying mechanisms and processes (e.g., eye-tracking metrics of sustained and social attention, accelerometer-derived metrics of activity level), rather than those that may capture superficial similarities in behaviors (i.e., symptom measures), may be valuable and help to avoid challenges both parents and examiners may face when attempting to describe inattentive and hyperactive-impulsive behavior in children who also experience ASD symptoms. This could also help better disentangle underlying mechanisms.
Overall, our findings are mostly suggestive of a gradient pattern of differences over the first 3 years of life among children with ASD- and ADHD-like symptomatology by age 3. In general, across measures spanning key domains relevant to ASD and ADHD, we found the greatest impairment within the ASD class, followed by the ADHD class. This raises a broader conceptual question: How similar must profiles of putative early markers be in order to be considered shared or transdiagnostic? That is, if two “clinical” groups differ from a TD comparison group, both exhibiting a deficit in a particular domain, but also differ from each other, can this still be considered a shared deficit? Our perspective is that it can, so long as there is overlap in the timing, direction, and nature of the differences (e.g., gradient profiles of lower cognitive functioning). However, it cannot be assumed that the mechanisms underlying such differences are equivalent.
Ultimately, although we did not identify a class of children with high ASD symptoms in the absence of high ADHD symptom ratings, we caution against interpreting the present data as implying that ASD and ADHD cannot be distinguished in preschool, that all children with ASD also have ADHD, or that ASD and ADHD represent a single disorder. The present findings suggest a mixture of overlapping and distinct early indicators of ASD- and ADHD-like profiles that can be difficult to disentangle early in life, and suggest that the development or refinement of measures of ADHD symptoms in the context of both early childhood and ASD symptoms are warranted.
Supplementary material
The supplementary material for this article can be found at https://doi.org/10.1017/S0954579420000735.
Acknowledgments
We gratefully acknowledge the families who have participated in our ongoing longitudinal investigation and the behavioral coders who contributed to the project: Laura Bell, Anne Donegan, Alexander Farquhar-Leicester, Caitlin Ferguson, Natalie Finnegan, Summer Mostafa, Tiffany Nguyen, and Makayla Soller.
Financial support
This study was supported by grants from the National Institute of Mental Health R00 MH106642 (Miller) and R01 MH068398 (Ozonoff), and the National Institute of Child Health and Human Development Intellectual and Developmental Disabilities Research Center U54 HD079125 (Abbeduto).
Conflict of interest
Mr. Austin is an employee of Expanesthetics, Inc.; his work on this project is unrelated to his employment and was completed as part of his graduate studies at UC Davis.