




No CrossRef data available.
Measuring National Income: A Critical Assessment
Published online by Cambridge University Press: 31 January 2005
Extract
Recent studies of trends in world income inequalities show that results differ significantly depending on whether income is measured through Purchasing Power Parities (PPP)- or exchange rate (FX)-based data. Korzeniewicz and Moran (1997), for example, relying on FX-based national income data, argue that world income inequalities rose during the 1980s. Firebaugh (1999), on the other hand, using PPP-based national income data, counters that world income inequalities declined through the same period. Both sets of authors subsequently have acknowledged and continued to debate the relative impact of PPP- and FX-based data in the assessment of world income inequalities (Firebaugh 2000; Korzeniewicz and Moran 2000).
Information
- Type
- Research Article
- Information
- Copyright
- © 2004 Society for Comparative Study of Society and History
Recent studies of trends in world income inequalities show that results differ significantly depending on whether income is measured through Purchasing Power Parities (PPP)- or exchange rate (FX)-based data. Korzeniewicz and Moran (1997), for example, relying on FX-based national income data, argue that world income inequalities rose during the 1980s. Firebaugh (1999), on the other hand, using PPP-based national income data, counters that world income inequalities declined through the same period. Both sets of authors subsequently have acknowledged and continued to debate the relative impact of PPP- and FX-based data in the assessment of world income inequalities (Firebaugh 2000; Korzeniewicz and Moran 2000).
For the most part, these debates have ignored a significant and fundamental contrast in the methodological and institutional trajectories of the collaborative projects through which the relevant indicators are constructed. While the methods used to collect FX-based national income data gained rapid legitimacy among policy-makers and developed a strong national and international institutional foundation after their original design in the 1930s and 1940s, the methodological procedures used to make PPP adjustments have never gained an equivalent acceptance after their initial development in the 1960s, and the PPP project as a whole has failed to construct a stable institutional niche in the international policy-making arena (albeit these adjustments are used more widely, but rather uncritically, by social science scholars). In fact, the PPP data collection effort today stands on the verge of institutional collapse.
One purpose of this article is to describe and explain the divergent trajectories of FX-based national income data and the PPP project by locating both efforts within the longer history of the “modern fact” (Poovey 1998), in particular the production of knowledge about “the economy” in the contemporary world. Such insights obviously are relevant to specialists who use such measures, but they are also pertinent to those working in the field of development, and to scholars interested more broadly on the production and reproduction of social scientific knowledge. Hence, this article reconstructs the institutional trajectories of the FX-based national income and PPP data collection efforts in order to contribute to a critical line of social inquiry emphasizing the need to move from a focus on pre-given objects to the processes through which such objects emerge (Hopkins 1977), and from the salient aspects of bureaucratic organization to the invisible work that bureaucracies do (Bowker and Star 2000). Such institutional trajectories of knowledge production delimit both how and what we can know (Wallerstein 1996), for ways of knowing are co-constructed with the means for data collection and validation (Bowker and Star 2000:48). This article, then, not only considers the theoretical assumptions and implications of FX- and PPP-based data, but also examines the hidden practices through which knowledge about “economies” is produced.
At the same time, by exploring and explaining the divergent methodological and institutional paths of the two measures, we hope to contribute to a better understanding of the complex implications of the choice of PPP- and FX-based data. Social scientists generally choose among these indicators by relying on the availability of data, established practices, or common sense, with little acknowledgment of what might be measured and not measured by each set of data. To provide a more rigorous basis for such choices, this article identifies the key methodological procedures and particular biases that characterize each set of adjustments. We expect that this evaluation will allow researchers to make a more informed decision about the appropriateness of PPP- and FX-based data for different types of social inquiry.
The article is organized in three sections. Discussing each measure in turn, the first two sections identify the key procedures used to construct FX- and PPP-based national income data, and review the major accuracy and reliability problems affecting both types of data. The major conclusion offered in these two initial sections is that there is a stark contrast between the institutional success of the System of National Accounts (SNA) and the comparative failure of the PPP data collection effort. The third section explains the divergent trajectories of the two projects as outcomes of the organizational and methodological characteristics of each effort. Drawing on recent contributions to the sociology of knowledge (Poovey 1998; Porter 1985; Shapin and Schaffer 1985), we argue that the methodological procedures and the specific forms of international collaboration required for the construction of PPP data, in contrast to the SNA effort, challenge the status of PPP-based data as “disinterested facts,” curtailing both improvements in data quality and the institutional consolidation of the project producing such data.
FX-Based National Income Data: A Stylized Account
In this section we argue that the emergence of national income accounting after the late 1920s was driven by a symbiotic relationship between economists, statisticians, and national and international policy-makers, all of whom contributed to a growing consensus that national accounting could be used to address economic problems more systematically, and thus more effectively.1
While systematic national accounting only developed over the last 50 years, the history of national income as an indicator of economic ’success' goes back to at least the late seventeenth century. The first known estimate of national income, in England, was conducted to guide policy-making (e.g., to prove mathematically that a certain taxation scheme would be more effective in helping the state raise more money), and to demonstrate the military and commercial strength of England versus other states (e.g., Holland or France) (Studenski 1958:26). Over the next two centuries, governments in different countries (e.g. Russia, Germany) would occasionally assess national income to conduct similar international comparisons, with the aim of rallying support for policies designed to consolidate national superiority or counter national inferiority.
The work of some individuals was particularly key to the development of national accounting. Clearly, although efforts to develop a comparable system of national accounts had begun with the League of Nations, John Maynard Keynes provided a crucial theoretical framework for the systematic implementation of national income accounting. In his work, Keynes (1936) assigned a key role to aggregate real income and national income, focused attention on disaggregating the expenditures of consumers and investors, and emphasized the importance of intersectoral economic relations (Anderson 1999:17; Ruggles 1999: 56–69). Keynes' clear depiction of the role of specific variables in shaping national income prompted governments to collect disaggregated information for the measures in his equations; these equations, then, both specified and provided relevance for the data to be collected in national accounting (Anderson 1991:16–18).
In the United States, where systematic work on national accounts begun in the 1920s, an important advocate for national accounting was Simon Kuznets, who headed the National Bureau of Economic Research in 1931, and in 1933 was called upon by the Department of Commerce to direct the preparation of national income estimates (Ruggles 1999). Kuznets' first report (1934), National Income, 1929–1934, demonstrated that production in the United States had fallen precipitously since 1929, and his findings prompted the Department of Commerce to establish the National Income Division in the late 1930s, to prepare current income estimates on a regular basis (Ruggles 1999).
Work on national income accounting was accelerated by the onset of World War II (Ruggles 1956 and 1968), producing the basic framework that continues to be used today. In How to Pay for the War (1940) Keynes outlined a system of five accounts to analyze the needs of wartime planning and management: aggregate production, formation income, private sector income and outlay, government sector income and outlay, and aggregate capital formation. Under the guidance of Keynes, and with the explicit aim to enhance wartime planning, Richard Stone and J. Meade developed an analysis of national income expenditures that operationalized the concepts in Keynes' General Theory (Ruggles 1999:70–90).2
When the League of Nations conjoined its Committee of Statistical Experts to the ongoing statistical efforts in 1929, it chose British accounting expert Richard Stone as chair of the Committee (McNeely 1995:76–86). In the late 1930s, Stone worked in England with Keynes in the Central Statistical Office (Ruggles 1968:1–13).
Studenski (1958) argues that this was the first time the Treasury went beyond confining itself to “known” information, and actually based its policy decisions on statistical estimates or inferences. The significance of these actions is foreshadowed by the reaction they received: even at this early stage, the nations of Sweden, Norway and Australia quickly followed suit (Studenski, 1958: 153). Stone would remain in charge of the UK national accounts throughout the war (Ruggles 1999: 135–36).
The rapid success of national accounting in England and the United States was an outcome of its effective use in policy-making. During the war, the national accounting framework was used by policy-makers to determine the resources available for armament production and civilian consumption, and to assess potential impacts of changes in prices, income, taxation, borrowing, incentive payments, price controls, and rationing (Ruggles 1949). By the end of the war, national income accounting had emerged as an “essential tool in the formulation of economic policy . . . a framework for portraying the current operation of different sectors in the economy” (Ruggles 1949:8). National accounting came to be seen by policy-makers and specialists as a fundamental institutional innovation that provided a methodological framework for systematically formulating economic strategies more effectively.
As new agencies began to implement the system and look to successful practitioners (other organizations but also individuals) for precedent and guidance, the work on national accounts in different organizations converged towards similar methodological and institutional procedures. To facilitate greater convergence, the United States, United Kingdom, and Canada set up a committee in 1944, chaired by Stone, to create a common national accounting system. A year later, the League of Nations convened a Committee of Statistical Experts, again chaired by Stone, to produce standard guidelines for national accounting.4
This committee produced a 1947 report entitled Measurement of National Income and the Construction of Social Accounts, primarily authored by Stone, that influenced all subsequent international work on national accounts (McNeely 1995).
The importance of key individuals was also manifested in other parallel collaborations after World War II. The executive committee of the Conference on Research in Income and Wealth, held immediately after the war by the United States, United Kingdom, and Canada held to work on standardizing national accounting, included Morris Copeland, Milton Gilbert and Simon Kuznets. Morris Copeland was simultaneously publishing theoretical work on money flows, which would be quite influential in the U.S. Federal Reserve Board. Milton Gilbert had collaborated with Simon Kuznets on national accounts, and also was Chairman of the OEEC. In 1947, the International Association for Research in Income and Wealth was established in Washington, D.C. to hold regular conferences, bring together different statisticians working on such topics, and publish a series. In 1949, Yale-based Richard and Nancy Ruggles, who had collaborated with Milton Gilbert and George Jaszi (director of the National Income Division of the U.S. Department of Commerce) to produce a college textbook on national income, assisted the efforts of the National Accounts Research Unit in its development and training functions, traveling to various statistical offices of participating countries (Ruggles 1999:vii).
Under Stone's guidance, the United Nations (1953) published A System of National Accounts and Supporting Tables, to provide a general framework to member countries for the implementation of the SNA (Ruggles 1999). A questionnaire was developed and sent out to member countries to collect national accounting data. With this information, the UN started publishing the Yearbook of National Accounts Statistics in the late 1950s (Ruggles 1999). Guided by the UN accounting framework, member countries began to use national income statistics for economic planning and budgeting (Ruggles 1968:1–13). Of course, to the extent that the development of the SNA drew on the experience of countries that had already compiled such information, UN member countries ended up adopting definitions and concepts largely shaped by the experience of England and the United States (McNeely 1995:76–86). From this point of view, the consolidation of the SNA was itself an indicator of the influence of the latter countries in providing order to the postwar world.
Conceptually, the “objective of national accounting is to record economic flows between two dates and the resulting stocks” (Duncan 1994:3), or, in other words, to capture the extent and structure of economic activities linked to market processes. To record such flows, the SNA has always considered transactions of goods and services (origin and use of goods and services); distributed transactions (how the value added by production is distributed into labor, capital and government, as well as through taxes and transfers); transactions and financial assets (the net acquisition of financial assets or the net incurrence of liabilities); and other accumulation entries (transactions not included elsewhere that change the value of assets and liabilities). (Appendix A provides a more detailed discussion of the assumptions guiding SNA accounting, as well as of some of the methods used for compiling the source data on which national accounting is based.) Totals for sectors of either balancing items or particular transactions that measure the result of economic activity are termed aggregates. GDP is an example of such an aggregate, and is defined as the “sum of the gross value added of all producer units plus any taxes, less subsidies, on products that have not been included in the valuation of output” (Duncan 1994:6).
Ideal sources of data and methods of compilation, as delineated in various SNA handbooks, outline a five-step process. First, micro-data are collected from industry and sectoral sources (agricultural and industrial censuses and surveys, household surveys, local, state, and central government budgets, financial statements or profit and loss accounts of private and public enterprises, banks, and insurance companies). Second, the micro-data are edited for consistency, and then aggregated to an intermediate level, whereupon individual data are combined to yield industry-wide and sectoral data. Third, these aggregated intermediate data on economic agents are adjusted for conversion into a national accounts format. Fourth, these adjustments result in a reconciliation of the SNA data, or an internally consistent dataset. (This reconciliation may include several steps, including integration within the sector and industry accounts, and the reconciliation of different independent sources of information, ideally taking into account a maximum number of data checks to produce optimal reliability.) Finally, in the fifth step of the process, the SNA data are ready for analytical presentation and for analysis.6
The 1993 SNA recommends that countries synchronize their cycle of national accounts compilation with their cycle of data collection. Benchmark compilations are to provide the most comprehensive data for a particular year as well as a base year to which the consecutive recurrent annual compilations at current and constant prices are linked. These should be followed by short-term cycles of recurrent annual national accounts compilations over a number of years.
The collection and processing of SNA data are supposed to be supported by adequate data-processing facilities, by a sufficiently trained statistical organization, and by appropriate training and technical cooperation activities. In fact, countries vary significantly in the detail and scope of their individual national accounts compilation projects.
For example, depending on the organization of the statistical apparatus in a particular country, the exact dividing line between ‘micro data editing and aggregation’ and the ‘national accounts data conversion and reconciliation’ outlined in the five-step process of national accounts compilation above may vary significantly. Furthermore, although the cycle of national accounts compilation is to be simultaneous with the cycle of micro-data collection as mentioned above, most national governments do not or cannot follow this recommendation. National governments also have particular trouble collecting data for the non-financial corporations and household sectors, for often very incomplete survey information is available for selected years, upon which estimates for the Integrated Economic Accounts (IEA) (see Appendix A) have to be based.
Another area in which many deviations abound is that of sectorization. The 1993 SNA suggests a certain sectorization for the economy; for example, the non-financial sector is typically broken down at least by public and private. Some examples of adaptations are Vietnam, where a further distinction was made between “central state industry,” “local state industry,” and “cooperatives,” and China, where a sector called “joint venture enterprises” was introduced. A special sector, the International Technical Cooperation Projects sector, lies outside the basic SNA sector classification, but was distinguished in the Equatorial Guinea system because of its relative importance for the country.
National governments can also vary in terms of how they compile the Cross Classification by Industry and Sectors (CCIS) (see Appendix A). Generally, most state agencies start with the Supply and Use Table (SUT): given the production vector of a certain economic activity, an attempt is made to estimate its allocation to the different institutional sectors in the IEAs. However, because the availability and the formats of the SUTs have varied considerably between country projects—no SUT in the Thailand and Malaysia projects, no product detail in Mexico's, no industry detail in Equatorial Guinea's, sixteen industries in the Dominican Republic's, 100 industries in Pakistan's—the design of the linkage between industry and sector data has had to be resolved individually for every country (United Nations 1999).
Finally, statistical agencies in different countries vary in terms of which elements of the SNA (accounts, tables, classifications) are given priority in data compilation, and on specific methodologies (e.g., procedures of data collection, estimation techniques, and data processing). We detail some of these differences in Appendix A. But the crux of the SNA system is that common standards are followed in the final preparation and presentation of the accounts and tables.7
These standards include data checks which indicate how far the compilation and reconciliation process has progressed, and the level of sophistication of a country's national accounts compilation process can be characterized according to the extent to which it is able to conduct such data checks.
The diffusion and standardization of the system of accounts was not a straightforward process. The 1953 SNA paid scant attention to the procedural problems of compiling and measuring the items to be entered into the accounts, and this problem was of particular consequence for developing countries, many of which lacked the very bureaucratic machinery necessary for the compilation of such data. Hence, while an informal network of specialists was important in the original construction of national accounting, the standardization and diffusion of the relevant procedures entailed a growing importance for a second level of actors: statisticians who assisted at a local level in developing the practical procedures and institutionalization of national income accounting. To guide these technical specialists, the United Nations provided general instructions, definitions, classifications, and supporting tables to be used as “guidelines for countries to follow in gathering data on national accounts statistics” (McNeely 1995: 79–80). The ongoing construction of a bureaucratic structure associated with national income accounts, as well as the growing specialization of the technical knowledge and skills involved in the construction of such accounts, entailed an expansion of the formal community of national accounts practitioners, embodied in national statistical agencies operating throughout the world. (See Appendix B for a current list of the national statistical agencies that are responsible for collecting national income-related data in over 100 countries.)
To facilitate standardization, the UN Statistical Commission has conducted several cycles of implementation, feedback, and revision over the past four decades, complemented by additional conferences, meetings, reports, and provision of technical assistance on the part of the growing formal community of national accounts practitioners (particularly statisticians). Periodically, the organization has reviewed all major economic and statistical concepts and compilation methods used by country input-output practitioners (see, for example, UN Economic and Social Council 1976). The UN also has provided technical support to those countries that had negligible statistical systems in place, and to those that requested such assistance (UN Economic and Social Council, 1963; UN Department of Economic and Social Affairs 1977; United Nations 1986 and 1987). Based on the feedback received from member countries, the SNA was modified in 1960, 1964 (to improve its consistency with the IMF's Balance of Payments Manual); in 1968 (introducing more flexible standards for the level of aggregation of reported income estimates); and in 1993 (UN Statistical Office 1960; UN 1993; Economic Growth Center, 1965). While 80 countries were submitting information in the early 1960s, the number increased to 120 by the early 1970s (United Nations 1993). SNA data were quickly embraced by policy-makers and scholars alike as the single most important indicator of economic progress.
As in the initial formulation of the SNA, crosscutting the institutional pattern of implementation, feedback, and revision was the overlapping and exchange of key institutional and intellectual actors.8
For example, Yale-based Nancy and Richard Ruggles straddled both policy-making and academics. They were called upon in the late 1950s to assist George Jaszi and the Department of Commerce in developing the national account system in the United States. In 1962, Nancy Ruggles became Secretary of the International Association for Research in Income and Wealth, a post from which she routinely considered issues related to the United Nations' SNA. From 1975 through 1980, she served as director of the UN Statistical Office. After 1980, she remained a consultant and wrote numerous manuals for the UN. And through these decades, both Nancy and Richard Ruggles published frequent academic papers that had a significant impact in the standardization of the SNA.
While the SNA emerged over the last half of the twentieth century as the international standard for monitoring, analysis, and evaluation of the performance of national economies, its application also has generated several criticisms. For example, some participants observe that developing countries often struggle with the resource and training requirements necessary for producing reliable and high-quality national income statistics. In spite of “specific activities designed to promote the steady and speedy implementation of the SNA in member countries . . . activities [that] have to do with training, development and dissemination of manuals and software, ad-hoc research activities aimed at resolving practical and conceptual problems and technical cooperation projects” (UN-ECA 1996, No. 2), the implementation of the SNA in the 1990s continues to be hampered by logistical difficulties (particularly in the Africa and the East and Southeast Asia Regions).9
Various UN documents and newsletters note the wide variation among countries in implementation of the formal definitions and procedures outlined in the revised SNA 1993 and the lack of certainty among users as to what has or has not been included in specific countries (see, for example, UNIFEM Bangkok News, No. 2, March—April 1997). Not least due to limited management autonomy and staffing resources, particularly in a number of African countries, the 1993 SNA revisions thus are still in the process of institutionalization (UN-ECA 1996, No. 2).
More to the point, some criticisms are directed against the major assumptions underlying SNA work. Since the SNA focuses primarily on “goods and services purchased in ‘the market’” (OECD 2000),10
Citing activities like production of agricultural goods, foodstuff and clothing, construction of dwellings, etc. by household enterprises for own consumption, the OECD Technical Paper (2000, No. 1.21) clarifies: “All of these activities are productive in an economic sense. However, inclusion in the System is not simply a matter of estimating monetary values for the outputs of these activities. If values are assigned to outputs, values have also to be assigned to the incomes generated by their production and the consumption of the output. It is clear that the economic significance of these flows is very different from that of monetary flows. For example, the incomes generated are automatically tied to the consumption of the goods and services produced; they have little relevance for the analysis of inflation or deflation or other disequilibria within the economy. The inclusion of large non-monetary flows of this kind in the accounts together with monetary flows can obscure what is happening on markets and reduce the analytic usefulness of the data.”
Interestingly, it has not always been that obvious that non-market work is ‘unproductive’. “Norway's national accounts for the period 1935–1943 and 1946–1949 included estimates of the value of unpaid household work. National income estimates in other Scandinavian countries similarly included the value of housework. However, the introduction of the first international standard for national accounts by the United Nations (UNSNA) caused Norway to omit the value of unpaid labor from 1950 in the interests if internationally comparable national account figures (UNIFEM Bangkok: Gender Issues Fact Sheet No. 1, ND).
As Boserup (1970: 163) points out, “the present system of under-reporting subsistence activities ... makes their [underdeveloped countries] rate of economic growth appear in a more favorable light than the fact warrant, since economic development entails a gradual replacement of the omitted subsistence activities by the creation of income in the non-subsistence sector which is recorded more correctly.”
As the OECD Technical Note frames the issue, “pressures have built to extend the national accounts to include other interesting (our emphasis) aspects such as the impact of economic activity on the environment. A major difficulty in doing so is that, because such factors are not part of ’the market' in a country, it is impossible to directly put a monetary value on them. The solution proposed in SNA93 is to produce such estimates in the form of satellite accounts, which are accounting statements consistent with, but compiled and presented separately from, the main (or core) accounts.... Another area for which satellite accounts could be produced is unpaid household work” (OECD 2000). Indeed, in the 1993 SNA revisions, “countries [were] encouraged to adapt the SNA to their particular needs and abilities. [They could] vary emphasis by using the System's classifications of sectors, industries, products, transactions and sequence of accounts at varying levels of detail; using different methods of valuation; using different priorities and frequencies; rearranging results; or introducing additional elements” (Duncan 1994:7).
The exclusion of unpaid work has not been the only focus of criticism over the years. Other opponents have argued that national income accounts pay insufficient attention to deteriorating environmental conditions or to quality of life issues (for example, as related to changes in the distribution of income) (Ruggles 1999:70–90). For the most part, however, researchers raising this line of criticism put increasing effort into developing various “social indicators” in conjunction with, yet separate from the SNA. Most significant among these efforts has been the Human Development Index (HDI).14
There are other efforts. Stone, along with the UN Statistical Office, formulated the System of Social and Demographic Indicators (SDSS). Similarly, the World Bank aimed to analyze social and demographic information in addition to that provided by national accounts for development planning, and hence constructed its social accounting matrices (SAMS) (Ruggles 1999:70–90).
According to 1998 Nobel Laureate in economics Amartya Sen, it is “one of the major sources of information and understanding of the social and economic world” (cited in Castles n.d.). For its advocates, “[t]he HDI offers an alternative to GDP for measuring the relative socio-economic progress of nations. It enables people and their governments to evaluate progress over time—and to determine priorities for policy intervention. It also permits instructive comparisons of the experiences in different countries” (Human Development Report Office 1997).
A final line of criticism focuses on the use of exchange rates as a means of producing comparable data. Given the growing hegemony of the U.S. dollar as international currency after the 1950s, analysts engaging in cross-national and inter-temporal comparisons of SNA data relied on exchange rates and the U.S. dollar to convert national data expressed into comparable units. In the 1950s such procedures were already being criticized for subjecting estimates of national production to the distortions inherent in fluctuating foreign exchange markets, and for overestimating the gap between the incomes and levels of economic well-being in poor and rich countries (Usher 1968). There have been two main institutional responses to these criticisms. In one response, the World Bank in the 1990s attempted to control for short-term fluctuations by introducing the Atlas method, averaging a country's exchange rate for a given year with the previous two years, and adjusting for the difference between the rates of inflation in the country under consideration and in the G-5 countries (World Bank 2001:331). In a more drastic challenge, a PPP-based recalculation of national income has been advanced as an alternative to conventional FX-based income data (these procedures are examined in the next section).
But in spite of these different lines of criticism, FX-based Gross National Product (GNP) and Gross Domestic Product (GDP) measures, produced by national statistical offices following SNA guidelines, rapidly became standard measures of development after World War II (we summarize the major characteristics of this measure in Table 1). Over the past fifty years, the SNA has reached a high degree of institutionalization that protects the measure from doubts about the reliability of the data. Neither operational difficulties in compiling and statistically manipulating source data, nor fundamental criticisms of assumptions underlying the definition of the ‘production boundary’ or of the insufficiency of national income data to capture the level of ‘human development,’ have diminished the status of national income measures as a major tool for economic analysis and policy formulation. Continuing work on the SNA focuses on improving accuracy and comparability, but leaves its basic methodology in place. In the terminology developed in the social study of science, the “black boxes” containing possible controversies about the inner workings of the SNA have been closed over the course of periodic updates and revisions, allowing SNA methodology to ‘move on’ and resolve newly emerging debates without fundamentally reworking old ones (Latour 1987).

The cumulative knowledge created through classification systems such as the SNA always bears the traces of their historical construction by specific communities of practice. The evolution of the SNA, as manifested by the constant revisions introduced in handbooks, manuals, and documented debates, entails the construction of a large-scale information infrastructure (Bowker and Star 1999). This has produced not merely data, but a new categorical understanding of the world. Information infrastructures (such as the one entailed by the SNA) are constitutive of the usually unexamined backdrop for the categories that enable an ordering of the world. It is by way of this articulation of categorical knowledge through shared practice that the SNA can be said to have contributed to the construction of the modern state.
The Purchasing Power Parities Project
The differences between PPP- and FX-based data are often misrepresented. Even the World Bank (2001:318), for example, erroneously indicates that “GNP measured at PPP is GNP converted to international dollars by the PPP exchange rate.” Such a statement makes it seem as if the only difference between PPP- and FX-based data involves a simple conversion factor, when in fact PPP-based data involve a more substantive recalculation of the SNA data. Ironically, the legitimacy of PPP-based data desired by those invested in their construction thus explicitly draws on the prestige and perceived accuracy of SNA data. And yet, as we will show in this section, the procedures used to carry out the PPP recalculation require radically different sets of methodological procedures and organizational arrangements than those entailed in the SNA. In the process of discussing the main features of PPP data collection we also describe the institutional actors involved in this project, arguing that the PPP project has not been able to establish a decentralized community of practitioners (as in SNA practice), and that this has contributed to the failure to obtain the institutional support necessary for continued PPP data improvement.
The basic premise of the PPP project is that to accurately compare the national product of countries, that is, to ascertain “real” volumes of production of goods and services, observers must adjust the relevant data to take into account the variance in the purchasing power of different currencies.16
We should note that PPP-based income data do not provide an indicator of welfare. Gilbert and Kravis (1954:74) themselves observed that in making PPP adjustments, “if one country has more government employees per capita than another, this ratio will affect the real product comparison in favor of the former country. It does not tell us, however, whether the higher level of government employees results in more services rendered to the population, or simply in a more wasteful use of manpower.” And also, “real product comparisons are not concerned with the relative state of happiness of the populations of two countries, or their relative welfare in some quasi-philosophical sense. It is only concerned with the relative quantities of goods and services flowing to the two populations” (Gilbert and Kravis 1954:76). In a recent article, Heston and Summers suggest that an indicator of welfare can be constructed by dropping investment from their RGDP calculations.
Many PPP studies illustrate the relevance of such adjustments by calling attention to the inordinate growth of Japan's GDP (relative to the United States) in the 1980s suggested by FX-based data but corrected by PPP adjustments (see, for example, Ahmad 1997; United Nations 1992).
Hence, in 1995 estimates, for example, PPP adjustments increased Atlas estimates by an average ratio of 4.6 for low income nations and 2.1 for middle income nations, while reducing estimates for high income nations by an average ratio of 0.9 (Ahmad 1997:8). Most of the adjustment comes from pronounced price differences in nontradables. Hence, “[i]n 1970 for the lowest-income countries, for example, the average exchange-rate-deviation index for commodities is 1.87, whereas that for services is 5.43” (Kravis et al. 1978:23). Given the overall increase in the income of poorer nations, with PPP adjustments, “the distribution of incomes of nations appears less skewed than exchange rates would indicate” (World Bank 1993:8).
It is important to emphasize that the PPP recalculation seeks to adjust existing SNA aggregate data. PPP recalculations challenge the validity of FX-based SNA figures as a measure of the value of production, but not the reliability of such data to calculate (with an appropriate valuation) volumes of output. Hence, critiques of the PPP project regarding distortions in FX-based income data do not extend to the basic quality of such data in estimating volumes of output (as opposed to how these volumes should be priced).
While independent scholars have called for PPP adjustments since the 1950s, the policy-making appeal of PPP-based measures of production was enhanced among some circles in the 1960s and 1970s by wild currency fluctuations (particularly following the introduction of floating exchange rates after the early 1970s) that evidently affected FX-based measures of production. Official efforts to develop a systematic comparison of PPPs can be traced to the 1965 meeting of the United Nations Statistical Commission, with a preliminary study conducted in 1967, and reported in 1968 (Kravis et al. 1975).19
An initial series of PPP studies conducted in the 1950s aimed to establish real levels (or volumes) of output (Gilbert and Kravis 1954). Similar concerns were manifested in subsequent studies establishing PPPs (Kravis, Kenessey, Heston, and Summers 1975), but the emphasis gradually shifted to prices and a comparison of the purchasing power parities of composites of GDP and expenditures.
Due to a lack of available resources at the UN, original support for the ICP came from the Ford Foundation through a grant to the University of Pennsylvania (the home institution of the Director of the Project, Irving Kravis, and of one of the two units coordinating the project), a special contribution of the Government of the Netherlands to the UN's Trust Fund for Development Planning and Projections, and additional support from the World Bank and the United States Agency for International Development, as well as the statistical offices of supporting countries (United Nations 1992; Kravis et al. 1975).
As in the case of national accounting, advocacy for the PPP adjustments was facilitated by the existence of a close network of scholars working on the topic, who could provide both the expertise to operationalize the complex procedures that would come to characterize the ICP, and the leadership to promote and raise funds for the alternative measure among interested organizations. Centered on the Department of Economics at the University of Pennsylvania, this network of scholars conducted the first two benchmark studies in 1967 and 1970. These scholars also developed strong personal linkages in the UN and the World Bank.21
For example, the work on the third benchmark study (1975) was conducted by Professor Alan Heston while on leave from the University of Pennsylvania, at the Statistical Division of the UN, and Sultan Ahmad, until recently in charge of PPP comparisons at the World Bank, was a graduate of the Department of Economics at the University of Pennsylvania, where he wrote a dissertation on shortcut methods for calculating PPPs (Ahmad 1978).
The ICP conducted benchmark studies on PPPs for a limited but growing set of countries. The results of Phase I included 1967 and 1970 data for ten countries (Kravis et al. 1975). Phase II, published shortly thereafter, presented 1970 and 1973 results for sixteen countries (Kravis, Heston, and Summers 1978). Thereafter, beginning with Phase III to be completed in 1975, the ICP was supposed to be regularly conducted every five years, with a progressive increase in the number of countries involved, from thirty-four in Phase III, to sixty in Phase IV (1980), and sixty-four in Phase V (1985). The most recent Phase (1993 and 1996), as yet unpublished, purportedly covers 120 countries and 89 percent of the world population (or 70 percent if a limited price survey in China is excluded from the sample).
Organizations such as the OECD and EUROSTAT have incorporated the collection of PPP data into their regular statistical efforts. The United Nations and World Bank are regularly reporting PPP-adjusted national income data in their respective yearly development reports.22
The most recent World Development Report, for example, reports PPP-adjusted national income data, even though the results of the last round of price estimates have not been officially published due to severe data problems (World Bank 2001).
There is a debate over whether it is welfare or productivity that should be measured. Castles (1997) indicates that this was a debate already in the 1950s. In fact, Summers and Heston (1995) propose a measure of welfare that excludes investment.
PPP adjustments are very complex and require a considerable amount of centralized statistical work. The basic aim is to ascertain domestic prices to recalculate the “real value” of SNA-reported levels of production of goods and services. A given poor country (for it is in poor countries that PPP adjustments are most significant) might report that its enterprises produced US$ 100 worth of shoes, but if shoes in that country are sold in local markets for a quarter of the price similar shoes command in the United States, the actual value of shoe production might be four times larger than conveyed by FX-based national product data. Likewise, while the same country might report that its health services produces US$ 100 worth of medical care, if doctors and nurses in that country are paid a tenth of what they are paid in the United States, the actual value of the medical care produced might be ten times higher than revealed by FX-based national product data. The basic purpose of PPP adjustment is to recalculate national income by using price estimates to readjust SNA data.
Such an effort constitutes a monumental task (in Appendix C we provide a condensed account of the procedures involved). Collecting “price information” on a worldwide basis would be difficult even if all goods were easily comparable—but they are not. The most basic of commodities (bread, rice, milk) differ considerably in quality and mode of marketing, introducing difficult comparability issues. The problems escalate exponentially when dealing with more complex goods, such as machinery or consumer durables (how easy is it to ascertain the comparative price of “an automobile” or “a textile weaving machine”?) or with services (how do we establish the comparative price of housing units in Szechuan, Santiago del Estero, and Beverly Hills?). In fact, for many goods (such as machinery) and services (such as housing), PPP adjustments are derived not primarily from direct observation of prices, but through complex statistical extrapolations estimated through hedonistic regressions. And in the case of services (such as education and health) that are not priced in the market (for example, because they are often provided in part or wholly by government), price comparisons are derived indirectly through estimated input prices (estimated, for example, as a function of the number of teachers or health personnel).
Furthermore, the collection of “price information” creates severe methodological problems, and the relevant national price estimates have to be centrally processed by the offices involved in the PPP program (so as to come up with the relevant comparative price estimates for the PPP adjustment). This represents a significant difference with the SNA process of data collection. As indicated in the previous section, the SNA established standards that national statistical offices follow independently to compile and organize national income data. In contrast, virtually all of the actual production of national PPP data takes place in the central ICP offices—national governments merely submit price information for selected goods and services.24
“The input provided by the country statistical offices to the ICP, thus, are expenditures at the basic heading level and prices of items representing the corresponding basic heading for that country. This is the first and most basic step in moving from national data to international comparisons of real volumes and purchasing power parities.” (World Bank n.d.a: n.p.).
But beyond such organizational issues, the process of using local “price information” to “readjust” national income data presents formidable calculation problems. First, “taking into account all of the prices supplied by all of the countries in a group” (United Nations 1992:7, our emphasis), the prices for individual items must be averaged (usually, unweighted) to produce parities for each basic heading of goods and services. Second, price data are combined with GDP data (although depending on whether the GDP data are derived from income, production, or expenditure estimates, PPP adjustments can produce substantially different results) (Ahmad 1997:5f). Third, in order to arrive at comparable aggregate estimates of PPPs, the respective price ratios for all basic headings of goods and services are aggregated at various levels, up to GDP at expenditure weights (to carry out this aggregation, analysts have to choose among weighting mechanisms, to take into account differences among countries in their price structure).
Largely as a consequence of the extreme complexity in producing the relevant data, the PPP project experienced pronounced delays in meeting scheduled deadlines for the preparation of ICP results. Reports on the two first Phases of the ICP were published roughly five years after the data collection. Phase III, reporting on the 1975 data collection, was published seven years later, in 1982. Phase IV, originally scheduled for 1980, was published in 1988. And Phase V, originally scheduled for 1985, was published in 1991. In 1995, participants were “informed that the world report with 1993 results was expected to become available by early 1997” (Economic and Social Commission for Asia and the Pacific 1995: 5), but in 1999 the results had not yet been published, and in 2002 the coordinators of the PPP project indicated that the 1993 results were being discarded due to their unreliability.25
Personal communication.
Partly linked to such irregularities in the production of data, the PPP program has been affected by considerable instability in administration and funding.26
Changes within this network have been closely linked to organizational transformations of the ICP. Due to the retirement of Robert Summers and the incipient retirement of Alan Heston from the International Center for Comparisons and the University of Pennsylvania, it is expected that the entire work on the ICP Programme (including the Penn Tables) will move to the World Bank in the near future.
Limited funding for most developing countries in the most recent Phase VI benchmark studies (1993 and 1996) came predominantly from the World Bank, with some additional funds provided by the International Monetary Fund (IMF) and the EBRD. The OECD-EUROSTAT PPP Program has provided the funding and the organization for the OECD regional comparisons since 1992.
At the World Bank, however, the “overall management and supervision of the global ICP exercise . . . draws on rapidly dwindling special trust fund reserves” and “the ICP remains . . . significantly underfunded” (World Bank 1999a:6).28
There are reports that greater support will be forthcoming by the OECD in response to Castles (OECD 1999), but support continues to decline from sponsoring agencies in Asia (Ryten 1998).
Hence, for example, “[i]nsufficient financial resources were mentioned by several countries as a serious impediment to collecting the full range of price data required by the ICP” (Economic and Social Commission for Asia and the Pacific 1995:3).
A series of critical studies in the 1990s came to call into question the very survival of the PPP program. Reports from both the OECD (Castles 1997, focusing on OECD countries) and the United Nations Statistical Commission (Ryten 1998, focusing primarily on non-OECD countries, in a study sponsored by the United Nations, the International Monetary Fund, and the World Bank) highlighted major problems with existing data.30
Ryten (1998:9), for example, asks “[a]re ICP estimates credible?,” and he answers to his own question “[t]hey are not and therein lies most of the Programme's problem.” Overall, both reports endorsed continued data collection on PPPs, but called for substantial reforms in the ICP.
This dire evaluation is linked to the methodological complexities surrounding the ICP project. To begin, there are important problems affecting direct price comparisons. As indicated by Sultan Ahmad (1997:14), until recently the main coordinator of ICP work at the World Bank, “[p]otentially, the most important source of error in comparison is the difficulty of comparing like with like . . . Since items are to be of lower quality in poorer countries, failure to match quality would underestimate PPP and over-estimate real quantity in these countries.”31
Regarding this issue, Kravis et al. (1975:31), acknowledge “many deficiencies in our price comparisons, in terms both of doubtful matches of qualities and, more important, of inadequate samples of items within detailed categories.”
Problems of comparability are particularly important in regard to capital goods. In many cases, product specifications are difficult to match with ICP representative profiles, as when a country's capital good industry is protected and thus not based on imports of standardized machinery and equipment. In such cases, capital equipment specifications are bound to be country-specific and difficult to compare across nations. Ryten (1998:51) reports many statistical officers in Africa observing that items “related to capital formation and particularly to machinery and equipment were deemed to be either very difficult or impossible to price.” More broadly, the OECD calls the estimates for capital expenditure among “the least reliable of the PPPs estimated by the OECD PPP Programme” (OECD 1999).32
Furthermore, in direct price comparisons, the ICP benchmark studies provide no measure of “international differences in [the] provision” of goods, even though the PWT authors recognize that “[f]or a given aggregate of goods, it is more advantageous to the population to have conveniently located, well-stocked stores with courteous and efficient sales personnel than to be forced to search for supplies and to queue up for service. A similar point applies to such ancillary services as credit, delivery, the right to return merchandise, and repairs and adjustments. Generally, a greater variety of goods also is to be preferred to a lesser variety.. A retail distribution system that provides all these conveniences and services is more expensive and absorbs more real resources than one that does not” (Kravis et al. 1982:30).
According to Castles (1997:19), participating OECD national statistical offices are “emphatic in dissenting from the view that the overall reliability of the data is . . . high.”33
In this regard, Ryten (1998:9) comments that “[i]n the past too much attention has been paid to how to aggregate basic data once those data become available but insufficient attention has been given to how they should be collected in the first place.”
Some of the organizations in question have rejected many of the criticisms. For example, the World Bank (1999a:5) indicates that “[w]ith only one important exception, the Bank has been unable to find any clear case of consistent bias either across countries or with respect to any specific item which is priced in ICP. Independent research backs up these findings.”
Furthermore, the indirect price comparisons conducted in the ICP for services and non-tradables have been criticized for including either no or very rough adjustments for productivity differences. For example, in ICP Phases I and II, and following on Gilbert and Kravis (1954), education, health services, and government employment were measured in terms of input (e.g., number of teachers, doctors, or government employees), with virtually no adjustments made for productivity.35
Except for “extremely rough” corrections for the availability of capital equipment—but not quality of training—in the case of medical care, and for years of education of teachers and government employees—but not plant and equipment—in the other two cases. The authors recognized that the assumption of equal productivity “is not warranted,” but indicated that “it would take a special effort, backed up by considerable financial and technical resources, to calibrate the differences” (Kravis et al. 1975:95).
The United Nations' Handbook of the ICP is rather vague on the topic, but its section on medical services indicates that “[w]age and salary comparisons are carried out for specific occupations, for example, physicians, lab technicians, nurses, orderlies, or maintenance workers, where it may be assumed that there is no or some (sic) objectively estimated productivity differential in these workers across countries” (United Nations 1992:44), and similar assumptions appear to have been made for education and government services.
Personal interview with S. Ahmad and Y. Biru at the World Bank, 22 Dec. 1999.
For example, see The Economist, 18 Mar. 1995, “Survey China,” p. 4.
Hence, official reports have expressed great skepticism about the ability of the ICP to produce adequate data on comparison-resistant services.39
Individual participating countries have noted difficulties in matching quality of goods, particularly regarding such areas as producer durables and construction (Economic and Social Commission for Asia and the Pacific 1995:3).
OECD (1999) reports that studies are being launched to investigate each of these inconsistencies, although the observations by Castles appear to have highlighted examples rather than the only problem areas.
In the current context, even the ICP program managers at the World Bank, while reiterating that PPPs are 'observed,' notes that “PPP rates are based upon a limited set of observations.... Although efforts are made to correct for quality differences, ICP faces the problem of matching like with like' which, in some areas like services maybe difficult.... Consequently, more caution should be exercised when interpreting PPPs for services.” (World Bank n.d.b: n.p.)
This choice has been justified by claiming that a study from four decades ago (Gilbert and Kravis 1954) indicated that such adjustments produce no significant differences in final results—although the cited study restricted its sample to a rather homogenous sample of relatively high income nations.
The weighting procedures used to establish a common price structure also have been criticized. Depending on the choice of the weighting mechanism, results can differ substantially, especially in regions with wide economic disparity among countries (as this disparity usually entails concomitant differences in price structures). Regarding these weighting procedures, as Ahmad (1997:14) indicates, “there is no unique and universally accepted method of doing the calculations,” so “the available [ICP] benchmark data are a mixture of results based on [the GK and EKS] aggregation methods.” A move towards regionalization has been observed to have diminished the tendency of the GK method of aggregation to underestimate PPP for lower-income countries (see Appendix C, Note 2, for an explanation of the GK and EKS methods).43
In regard to aggregation methods, the uncertainty is around 10 percent (Kravis et al. 1975: 79).
Strong discrepancies have been found between the rates of growth implied by PPP-adjusted output estimates and those inherent in national accounts (Summers and Heston 1988:3). Evaluating their own results in regards to temporal data, the authors concluded that “[i]n the present state of our knowledge it appears that national growth rates should be used for growth comparisons over time and the benchmark results for place-to-place comparisons in a given year where available” (Kravis et al. 1982:327). Also, Summers and Heston (1991:344) note that care should be exercised in using their RGDP data for intertemporal comparisons, as “RGDP suffers from the Laspeyres fixed-base problem: after a while, relative prices change, and the base year weights become less and less appropriate.”44
There are also doubts about the accuracy of the population data used in Penn 5 to generate alternative RGDPC indicators (controlling for the size of the adult and working populations) (see Appendix B for sources of data).
Temporal extrapolations by the World Bank similarly reveal an internally inconsistent assumption about the relationship between PPP estimates and GNP measures. The extrapolations, based on rates of growth as derived from national account data, assume the PPP-based and the Atlas-based income measures to be linearly related, an assumption the World Bank is very careful not to make in its spatial extrapolations. (The World Bank's spatial extrapolations are based on the regression of the logarithm of the PPP estimate on to the logarithm of Atlas-based GNP data and the logarithm of secondary education: the regression model assumes no linear relationship between GNP and PPP but rather a linear relationship between the logarithms of the measures in question.)
More importantly, we should note that whereas the ICP seeks to capture a share of goods and services that might not be reflected in official statistics, inter-temporal PPP-based data, as currently available in sources such as the PWT or the World Bank, are not derived from observation of temporal changes in the magnitude of this share, but from the use of growth-rate data (ultimately derived from national account data) to extrapolate these estimates from (usually) a single benchmark study. With virtually no exceptions, PPP-based data provide no independent assessment of the evolution or change of what the ICP purportedly excels at measuring, namely, the share of goods and services that might not be reflected in available statistics.
Despite these major problems, recent Phases of the ICP have engaged less and less in a critical evaluation, as was done in the earlier phases, of potential errors of short-cut estimates.45
There are exceptions. Ahmad (1997:17) indicates that “the estimates are useful for analytical purposes; for individual countries, however, the estimates can have large residual errors. These errors are usually large for developing countries. Without more recent and more uniform coverage of countries, these shortcut estimates are likely to become increasingly unreliable.” And in regard to more disaggregated RGDP data, the World Bank (1999a:1) claims “a fair degree of confidence” for data on private consumption, but recognizes that “[o]n questions of capital formation and public consumption.. there is more scope for potential error and bias.”
A move towards greater transparency has been reported by the OECD (1999). For example, there is now greater sharing of data (although this has led to “basic data being changed and revised results being calculated” (OECD 1999:3) again suggesting instability of results).
Ryten's allusion to the “black box” of PPP data construction is illuminating regarding the background of analyses that highlight the organizational practices on which scientific ‘progress’ depends. Actor-network theorists like Bruno Latour (1987) and Michel Callon (1980) emphasize the need to displace fundamental criticisms by enrolling earlier black boxes (controversies that have already been settled) as ‘actants’ in the effort to achieve methodological closure and concentrate on quality improvements within the practical space so created. Hence, while the source data necessary for national accounting are subject to uncertainties about their accuracy (given the difficulty of compiling comprehensive economic data and the extensive use of statistical procedures to estimate the components of national income), the SNA project has successfully displaced fundamental doubts onto the plane of debates about what additional data should or should not be included in national accounting (we summarize the major characteristics of PPP adjustments in Table 2). In the next section, we turn to explaining why the SNA project was able to close this black box, appealing to the legitimacy of accounting procedures and the status of statistics achieved prior to the rise of the SNA, while the ICP failed to achieve the closure necessary for improving PPP methodology or allowing the institutional consolidation of the PPP project.

The Divergent Trajectory: A Stylized Interpretation
The considerable institutional success of the SNA project was associated with two crucial characteristics: the development of a standard methodology, and the adoption of a flexible and rather decentralized institutional structure based on a community of practitioners connected by standard methodological procedures. By contrast, the PPP data-collection effort suffers from persistent confusion and debate over its methodology, and requires a highly centralized organizational structure (that never became quite institutionalized and was always affected by limited funding).47
The statistical officers in charge of the ICP at the World Bank (1999a:6) attribute many of these problems to the lack of institutional commitment to the project, and complain that “the international statistical community now needs to move forward and agree on a more systematic approach. It must decide how to set up a strong central management for ICP that will wield effective control over basic data quality.”
Beyond the concerns about reliability discussed in the previous section, and in contrast to national income data produced rather autonomously by national statistical agencies, the compilation of PPP data, grounded as these data are in international price comparisons, requires more extensive collaboration across borders and a relative surrender of national sovereignty over income data.48
Since Phase IV, this collaboration has involved the compilation of basic price data by national statistical agencies, the initial elaboration of these data by statistical agencies at the regional level, and the subsequent production of world PPP data by the central agency in charge of the ICP project.
To facilitate data collection, the World Bank reports that it is producing appropriate software to facilitate price data collection for distribution to national statistical agencies, as well as implementing new methods deriving data with reduced information (Economic and Social Commission for Asia and the Pacific 1995; World Bank 1999a).
Ryten (1998) favors the sharing of responsibility of results of PPP Programme between NSOs and international agencies to increase transparency, while Castles (1997) argues that the ICP should be the exclusive responsibility of international agencies. The OECD (1999) favors Ryten's view. But efforts to involve local agencies more directly are often resisted, as some national statistical agencies do not want to share responsibility in results, “as individual country results are dependent on the inputs from other countries” (Australian Bureau of Statistics 1999:8).
The organizational complexity of the effort generates numerous opportunities for tension or conflict. For example, each central agency, all of which are located primarily in high-income nations, follows a separate set of procedures, generating difficulties in ensuring coordination.51
Thus, in the 1980s, OECD undertook periodic collection of PPP data for EU and OECD member countries, introducing “its own methodology, timetable and raison d'être,” and with its results being used by the ICP program of the United Nations (Castles 1997:4).
The Australian Bureau of Statistics (1999:8) attribute the “perceived diffidence” of national statistical agencies to “the lack of interest in the data by national users and a lack of clarity concerning the agencies' responsibilities.”
For example, Ryten (1998:51) reports many interviews in Africa with officers who expressed many problems associated with the interaction between national statistical offices and the coordinating agencies in Europe.
Lack of communication becomes important even at the most basic levels of data collection because “[u]nder existing procedures, weaknesses in the detailed estimation function at the country level can only be fully discovered and evaluated at a higher level of aggregation because it is here, that, of necessity, one country's micro-data sets must be compared with those of other countries at a similar stage of development” (World Bank 1999a:5).
All these problems are exacerbated by the fact that PPP data are collected in cycles. Combined with the administrative instability of the ICP, and its weak institutionalization at the level of national statistical offices, such characteristics have prevented the reproduction of organizational memory from one cycle to the next. Thus, Ryten (1998:16) indicates that “[t]here is no continuous flow of information related to PPPs in the way there is in connection with exchange rates and with the CPI. The planning of the PPP as a worldwide exercise only one every so many years is the single most important factor that detracts from its importance in the eyes of users and producers.” These constraints illustrate prevailing arguments in theories of organizational learning that the creation and maintenance of information infrastructures exceed formal organizational structures, and are highly dependent on stable communities of practice able to bridge the complexities and controversies surrounding the production of facts (Bowker and Star 1999).
Partly as a consequence of these organizational difficulties, while GDP statistics adjusted by exchange rates quickly came to be seen by practitioners as essential to more effective policy-making, PPP-based data are generally perceived as being largely irrelevant to policy-making.55
Ryten (1998:47) highlights this lack of timeliness and argues that “it is not acceptable to live in a situation in which official results appear less often than twice every decade, and then only with a lag of three or more years.” Likewise, Ahmad (1997:13) acknowledges that some statistical offices, particularly in poorer countries, “find it difficult to assign high enough priority and to find resources” for the ICP because the project is viewed “as an expensive operation which benefit international organizations and are of limited use for country policies.”
This creates an important quandary. Clearly, on the one hand, the long delays and the poor perceived quality of PPP data prevent the effective use of this indicator for policy-making on a day-to-day basis. On the other hand, without such effective use, organizations are less willing to depart from limited resources, and this in turn prevents ICP participants from substantially upgrading the quality of their data.56
Hence, along similar lines, the World Bank (1993:24) indicates that “it will be difficult to expand coverage if policy relevance of the numbers is not demonstrated, and a precondition of policy use is availability of the numbers continuously and in a timely manner.”
Furthermore, while the institutional success of FX-based SNA data has been accompanied by a normative acceptance of such data for policy-making, several key agents have grown wary of the potential policy implications of PPP data. While demonstrated relevance for policy-making is crucial for institutional support for the ICP, there are considerable worries, particularly among the representatives from poorer countries, but also among country directors in organizations such as the World Bank, that use of PPP-based data might diminish their share of international aid resources.57
While acknowledging these fears, Ahmad (1997:13) argues that “such fears are, however, unfounded because if these numbers are ever used to determine aid eligibility, the various thresholds are to be raised commensurate with the new scale of measure.” Even the World Bank cautions that “there are a number of areas where the use of PPP-based estimates will not be appropriate. In ICP, PPPs reflect what money can buy in local rather than in an international market. PPP based conversion factors should not be used for measuring share of international trade and capital movements across borders. Also, users of PPP must be aware that PPP estimates do no approximate equilibrium exchange rates nor are they intended to do so. This means the calculated PPPs cannot be relied upon as indicators of overvaluation or undervaluation of currencies for foreign trade analysis. In matters related to international trade and capital movement, exchange rates should be used” (World Bank n.d.b: n.p.).
However, even early studies were explicit in recognizing that the PPP exercise was of potential use to international organizations in the allocation of resources (Gilbert and Kravis 1954). Hence, Kravis et al. (1975:1) indicate that “an appreciation of the differences in the level of income is important in the allocation of aid and in the judgment of its efficacy. It is relevant as well to international burden sharing, whether for current costs of international bodies or for developmental or military objectives.” More explicitly, Ryten (1998:5) indicates that one of the uses of PPP data is to allow for “[t]he rational allocation of scarce entitlements such as IMF quotas or drawing rights.”
The inconsistency in the level of data production and data consumption in the ICP, combined with the limited participation of national statistical offices in the actual construction of comparable PPP data, thus is bound to create considerable doubts about the very status of such data as uninterested facts. With this interpretation, we refer to parallels in the “probabilistic revolution” of the nineteenth century, when the increasing use of aggregate measures in the emerging science of political economy engendered far-reaching debates about the nature of observed particulars and the status of theory (Porter 1986). The statistical “law of large numbers” on which aggregate measures are based triggered controversies about the relationship between ‘natural laws’ and ‘free will’ (also in the sense of governmental intervention) that seemed to be curtailed in the light of the statistical laws governing social behavior. Following Poovey (1998), this problem of induction, as she calls it, could be settled only (though always precariously) by re-working the relationship between observed particulars and general laws. Above all, it required the generation of statistical data to be separated from the appearance of being ruled by interests. Statisticians thus increasingly emphasized that they “seek only to collect, arrange, and compare” instead of “discuss causes or reason upon probable effects” (Porter 1986:36).59
In seeming contradiction, however, it also required to re-articulate theory as based on testing hypotheses that would limit the role that observed particulars and their aggregates play in articulating general laws. In this re-formulation, statistical data came to figure as tendencies at the aggregate level rather than as themselves laws. But “[e]mpirical laws in this state are evidently unverified inductions, and are to be received and reasoned on with the utmost reserve. No confidence can ever be placed in them beyond the limits of the data from which they are derived; and even within those limits they require a special and severe scrutiny to examine how nearly they do represent the observed facts.... When so carefully examined, they become ... most valuable.... On the other hand, when empirical laws are unduly relied on beyond the limits of the observations from which they were deduced, there is no more fertile source of fatal mistakes” (John Herschel, Preliminary Discourse on the Study of Natural Philosophy, 1830, cited in Poovey 1998:321).
In this sense, the pursuit of national income accounts became a symbolic marker of development and of modernity (McNeely 1995:76–86). The perception of rationality and accuracy that such numerical data could confer on governmental efforts at enhancing calculation and administration was a crucial, and yet far from obvious achievement. National income data promised to separate ‘uninterested’ facts from the interests of vested social groups, hence providing statistical data as an objective tool for understanding “the economy” (Poovey 1998; Porter 1985; Shapin and Schaffer 1985). Hence, while the construction of national accounting methods was guided by the hands of economic theorists and practitioners, the prestige of SNA data was derived from its promise of independence from particularistic interests and/or theory. Of course, as it became legitimate, the collection of SNA data involved the constitution of relevant national and international actors with vested interests of their own.
By contrast, the ICP was unable to separate PPP data construction from the appearance of being driven by interests, and thus unable to secure institutional support for continued data improvement. For example, as indicated earlier, PPP data are perceived by many relevant actors (particularly in peripheral and semi-peripheral countries) as interested constructions that run counter to the interests of national policy-makers in maintaining autonomy over the production of knowledge. The relative lack of participation of national statistical offices in constructing internationally comparable PPP estimates thus has proved to be fatal for the ICP.
Thus, while FX-based data continue to be perceived as relevant, albeit perhaps in need of being supplemented with additional indicators, this is not the case with PPP-based data (Figure 1 summarizes the major contrasts between the two measures). Paradoxically, the very thrust of the ICP effort might have contributed in some ways to its current crisis. The argument made by ICP advocates regarding the need to distinguish more carefully how PPP differ from one nation to another can be easily extrapolated to apply to particular regions or social strata within a given country. Yet, in conjunction with a shift in interest towards targeting poor groups more precisely, there has been declining demand for the type of aggregate data represented by PPPs.60
The Human Development Report Office at the UN argues that “[n]ational averages can conceal much. The best solution would be to create separate HDIs for the most significant groups: by gender, for example, or by income group, geographical region, race or ethnic group. Separate HDIs would reveal a more detailed profile of human deprivation in each country” (Human Development Report Office 1997). However, almost a decade later, there is little research to show along these lines. Yonas Biru, the present coordinator of ICP work at the World Bank, has attempted to argue that PPP data disaggregated by income groups would be most appropriate for the World Bank's new emphasis on poverty eradication, and notes that targeting poor groups would require household-level data (personal interview). While borrowing countries are required to use ICP-type data for poverty assessments as a precondition for loan applications, it seems unlikely in the present state of the ICP Programme that funding would be available for efforts to collect PPP data at the household level.
This doubt about the relevance of PPP data as a tool for national policy-making also extends into the opposite direction. Whereas development paradigms in the 1960s and even 1970s emphasized the importance of national strategies of growth, with many national economies perceived to be largely isolated from international prices, the new perceived importance of globalization has shifted attention to processes that integrate nations to the global economy. This shift has clear and direct implications for PPP-based indicators, since it tends to call for greater attention to measures that are better able to trace change in the relative share of tradables and non-tradables (as well as the relative share of market and non-market economic activities more broadly). From this perspective, and while the issue is not always articulated explicitly in the debates surrounding the ‘crisis’ of the ICP, the organizational tensions surrounding the Programme can themselves be seen as a reflection of tensions between different development paradigms, and between different views of the role that supranational organizations like the World Bank should play in the global economy.
We should note a paradox: Despite its overall institutional failure and the reluctance of policy-makers to adopt the measure, the PPP program has been much more successful in promoting the use of its data within the academic community. PPP researchers made their data easily available to scholars through the Penn World Tables. Computer diskettes with the PPP-based dataset were distributed with Phase IV results in the journal where the data were introduced, and free access to the data was offered to interested parties. The data were also made easily accessible through the Internet in each subsequent benchmark study. Such a promotional strategy certainly made the use of PPP-adjusted data convenient for use by social science scholars. Even the name “Real GDP” contributed to generating and perpetuating a sense of legitimacy for the data, as it helped to suggest that such data came closer to a direct observation of actual levels of production (that is, less distorted by either exchange rate fluctuations or the price structure of wealthy countries). Hence, PPP data did come to attain the apparent status of “disinterested facts” in the academic community. But such status has been attained and maintained, at the very least, by minimal critical interest on the part of the scholarly community to explore and assess the actual quality and assumptions of PPP adjustments; at worse, the willingness to ignore such issues and the appeal of PPP adjustments might be the outcome of a more “interested” commitment to data that in effect reduce perceived income gaps between wealthy and poor countries.

Figure 1. The Varying Success of the SNA and ICP Projects
Conclusion
National income accounts in the twentieth century were transformed from a primarily private enterprise to an essential function of governments across the world (Studenski 1958:142). The emergence of a system of international relationships between an emergent technical elite and national and international bureaucratic organizations—particularly around the events of World War II—was the primary mechanism for the institutionalization of national income accounts on a global scale. National accounts ascended through a process that was, in Weberian terms, at once both formally and substantively rational. Initially, economists, statisticians and policy-makers advocated the use of national accounts as an efficient technology for the analysis of national income. Over time, such formal rationality became a symbolic marker itself, as national accounts came to signify the modern or modernizing state, and FX-based national income data became the single most important measure of development and economic growth.
By contrast, the institutional failure of PPP-collection efforts are related to the methodological and organizational difficulties encountered by the ICP. Squeezed from above by globalization, and from below by the growing demand for more disaggregated data that can help target aid more directly to the truly needed, the International Comparison Programme producing PPPs has not found it easy to respond with sufficient flexibility and timeliness. Simultaneously, the ICP is institutionally constrained by international organizations that are unable or not willing to commit their resources to such a collection of data, and national statistical offices that view efforts to collect such data as either an infringement on their turf or a potential threat to the existing allocation of resources.61
Surprisingly, considering that international agencies have always assured participating countries that PPP measures would not be used for policy decisions, the recent response to the Ryten report by the World Bank (1999a:5) indicates that “the Bank is analysing the use, relevance and potential of PPP-adjusted GNP numbers as a basis for determining its resource allocation decisions. Already, at the level of poverty reduction and alleviation, PPPs are used to drive policy and development assistance decisions.”
These divergent trajectories, and a focus on the hidden practices used to construct FX-based national income data and PPP adjustments, helps reveal “the politics of science in action” (Bowker and Starr 2000:48). We suggest that such tensions provide a unique opportunity for future sociological inquiry, as they provide key insights and opportunities for intervention into recent shifts in the political construction of development, the organizational tensions that accompany the process of globalization, and the conflicts that shape the distribution of information and power among policy-making agencies and scholars in poor and wealthy nations.
Appendix A: National Income Accounting in the 1993 SNA
National income accounts provide a framework for portraying the current operation of the different sectors in the economy in much the same way that business financial statements provide a framework for portraying the current operations of an individual enterprise. Accounts are set up to show the current activity and interrelation of various parts of the economy, and every current transaction is shown both as an allocation and as a receipt. Some common accounts are accounts for the producing sector, the consuming sector, the government sector, the rest of the world (which is treated as a sector), and a gross savings and investment sector (Ruggles and Ruggles, 1999).
The basic structure of the 1993 SNA includes three segments that can be represented as part of one table: a Supply and Use Table (SUT) is presented in the upper panel of the table and the Integrated Economic Accounts (IEAs) is represented in the lower panel of the table. The Cross-Classification by Industries and Sectors (CCIS) of the common elements of the SUT and IEAs is presented in the middle of the table. The SUT includes output and imports in the row of supply, and intermediate consumption, final consumption, capital formation and exports, along with a number of adjustments, in the row of uses. The difference between output and intermediate uses represents value added. Intermediate consumption and value added are classified by industry groups, and the unit of classification for industries is establishments. The IEAs are SNA accounts for institutional sectors. Five major sectors are the non-financial corporations, financial corporations, general government, households, and non-profit institutions serving households. There are additionally columns for the total economy and the rest of the world. For each sector, there are accounts on production, accounts that record income and use of income, capital and financial accounts, and balance sheets. The unit for classification in the IEAs is the enterprise or institutional unit. The CCIS attempts to integrate the SUT and IEAs by cross-classifying the common elements between the two by industry and institutional sectors.
Ideal sources of data and methods of compilation, as delineated in the 1993 SNA and various subsequent handbooks, outline a five-step process. First, micro-data are collected from industry and sectoral sources (agricultural and industrial censuses and surveys, household surveys, local, state, and central government budgets, financial statements or profit and loss accounts of private and public enterprises, banks, insurance companies, etc.). The micro-data obtained from census and survey questionnaires and those based on administrative records may have to be edited in order to eliminate internal consistencies, before being aggregated to intermediate meso-data. Second, this data are then aggregated to an intermediate level, whereupon establishment data are combined to yield industry data and institutional units are grouped into institutional sectors. The aim of this stage of the compilation process is to obtain data from a maximum number of independent sources of information. Third, these aggregated intermediate data on economic agents are converted into a national accounts format, and this conversion includes adjustments needed to reflect SNA imputations, adjustments for undercoverage, timing, and the like. Fourth, these adjustments result in a reconciliation of the SNA data, or an internally consistent data set. This reconciliation may include several steps. If different data sources are used for different accounts of a sector, the data need to be integrated within the sector accounts. Industry data also need to be integrated and reconciled with corresponding sector data. Data also need to be integrated and reconciled within industries and within sectors. If data in the second stage do indeed come from a maximum number of independent sources of information, the final reconciliation that takes place here will take into account a maximum number of data checks and thus produce optimal reliability of the final national accounts estimates. Finally, in the fifth step of the process, the SNA data are ready for analytical presentation and for analysis.
Ideally, countries should synchronize their cycle of national accounts compilation with their cycle of data collection. The data collection is to occur in three phases. First, the accounts are to be based on benchmark compilations, which provide the largest representative censuses and surveys and form the base year to which the consecutive recurrent annual compilations at current and constant prices are linked. Second, there should follow short-term cycles of recurrent annual national accounts compilations over a period of a number of years. In this phase, provisional national accounts estimates of a more limited scope and detail would become available three months before the accounting year has elapsed; then, these estimates would be revised systematically and would thus improve gradually over time in scope, detail and reliability; and at the end of the multi-year report, final estimates would be published. The final phase of national accounts compilation should be used for special extensions which serve as a basis for satellite and other studies.
One of the hallmarks of the 1993 SNA is the extent to which the system is readily adaptable to differing needs and resources of countries. Countries differ in their level of statistical development, state of social and economic development, and how the SNA data are used for policy analysis. Thus, the first step required for a country in the process of SNA implementation is to make a country-specific decision on (1) which elements of the SNA (accounts, tables, classifications) are to be given priority in the compilation; and (2) how the resulting framework is to be compiled/realized (what mechanisms of data collection, estimation techniques, data processing, and the like are to be used). A handbook for implementation that accompanies the 1993 SNA also offers a number of compilation options—with multiple additional alternatives possible—for countries with differing needs and abilities.
The most important feature of the national accounting approach outlined in the 1993 SNA is that certain identities hold in the final presentation of the accounts and tables. These identities constitute data checks, which indicate how far the compilation and reconciliation process has progressed. These potential data checks are incorporated explicitly in the compilation process in the form of statistical discrepancies that need to be eliminated. The level of sophistication of a country's national accounts compilation process can be characterized, then, according to the extent to which it is able to conduct such data checks and eliminate such discrepancies.
The UN Department of Economic and Social Affairs Statistical Division groups present country practices into three broad categories: production-expenditure-income approaches, commodity flow approaches, and integrated accounting approaches. These three categories represent a hierarchy of increasing comprehensiveness concerning the scope and reliability of national accounts (as the number of independent data-reconciliation checks increases with each category). The first set of approaches constitute the most basic and most frequently used way of compiling national accounts. These focus on the production account, or estimating GDP and its alternative breakdowns, and provide the minimum set of data required by the Harrod-Domar type of macro-growth models of economic theory. These represent a few blocks, mainly goods-producing industries, in the SUT. Data sources include surveys and censuses (from agriculture, industry, etc.), business accounts of public and private enterprises, and administrative records concerning government revenues and expenditures. Initial estimates may be further adjusted for output of households for own consumption, imputations for the output of financial intermediaries and insurance, etc. If comprehensive data are not directly available for one or more years, estimates are generally restricted to value added only. The value-added estimates may be obtained by extrapolating benchmark data with production volume indices and by applying appropriate price indices.
Next, adding to the data elements above, the commodity flow approaches include output and intermediate consumption for all industries and introduce a systematic breakdown of the supply and use rows by products, as well as by including data on labor inputs per industry. This approach is influenced by the Leontieff input-output models, which are a further breakdown and extension of the Harrod-Domar growth models. Statistical sources here are similar to those above with the additional requirement of a detailed product (goods and services) breakdown. These provide a higher number of independent data checks compared to the first set of approaches. As it is costly for many countries to compile all necessary information for a fully detailed SUT, they may compile a part of the data indirectly (particularly for estimates of changes in inventories and for final consumption and gross fixed capital formation) through the commodity flow approach. Only a few countries apply this method for the whole economy; rather, many countries use the commodity flow approach as a data check for a limited number of products for which independent estimates of supply and use are available. In all other instances, countries use the commodity flow method to derive, in an indirect manner, estimates of supply or use elements on which no direct data are available.
Finally, the third set of approaches are the integrated accounting approaches. Including all the SUT elements above, these also add limited institutional sector accounts of the IEAs. This more comprehensive category of approaches, then, requires data not only for industries, but also for institutional units (corporations, households, government units), and the implications for statistical data are quite costly. For this method, countries require costly changes in the content of surveys and survey procedures, something that prevents many from implementing this set of approaches. With sufficient resources, however, the data on output and value added can be checked for each institutional sector with independent data on income, expenditure, and financial flows. These approaches have taken on many different formats, depending on the sophistication of basic statistics development and also on the extent to which different data compilations are carried out in one institution and/or coordinated between different institutions. The number of data reconciliation checks available in this set of approaches is potentially much larger, then, than in the previous two.

Appendix C: ICP Procedures.
The Construction of PPP Comparisons. As an initial step, the ICP generates national prices in benchmark countries for a comparable basket of goods and services. For tradable goods, the ICP uses direct price comparisons (market prices). For some goods, but particularly for most services, prices are constructed from indirect comparisons.
In the case of services (such as education and health) that are not priced in the market (for example, because they are often provided in part or wholly by government), direct price comparisons are not possible, and are thus derived indirectly through estimated input prices (estimated, for example, as a function of the number of teachers or health personnel). Indirect price comparisons for non-market services create severe methodological problems, and the methods to arrive at reasonable output estimates have changed over the course of the ICP.
Formidable problems also exist in other areas of ICP price collection. Housing, accounting for a significant share of household expenditures in most countries, raises serious problems of comparability, so hedonistic regressions are used to control for some features (e.g., characteristics of bathrooms or kitchens, number of rooms, age of dwelling), but not others (e.g., location) in estimating housing prices. Since in many low-income countries building permits are not reliable or even available for estimating construction activity, price estimates in this category of consumption are based on the cost of building materials for defined standard building models or prototypes, rather than actual construction costs. Prices are also difficult to attain for capital goods due to major differences across countries in product specifications (e.g., technical characteristics like size, power, performance) that may be price-determining, so ‘price-slope adjustments’ (based on statistical relationships between equipment or product characteristics and prices) are used to arrive at estimated prices (United Nations 1992:49).
After generating basic price data, a complex set of procedures is used to aggregate and compare national data. First, the prices for individual items are averaged (usually unweighted) to produce the parity for each basic heading of goods and services, “taking into account all of the prices supplied by all of the countries in a group” (United Nations 1992:7). Second, price data are combined with SNA data. Depending on whether the SNA data are derived from income, production, or expenditure estimates, PPP adjustments can produce substantially different results (Ahmad 1997:5f). Due to extensive data requirements and methodological problems in computing PPPs based on income or production data, ICP benchmark studies have so far concentrated on the expenditure side (consumption) of GDP (United Nations 1992:5). Third, in order to arrive at comparable aggregate estimates of PPPs, the respective price ratios for all basic headings of goods and services are aggregated at various levels, up to GDP at expenditure weights. (To carry out this aggregation, analysts have to choose among weighting mechanisms, to take into account differences among countries in their price structure: We discuss the two principal weighting procedures, the Geary-Khamis (GK) and the Elteto, Koves and Szulc (EKS) methods, below.)
Since observations are too expensive to conduct on a yearly basis, both the international organizations (the UN, the World Bank) and the scholars involved in the ICP have sought to extend PPP adjustments by extrapolating data to non-benchmark years. Such procedures have been used in particular to construct the Penn World Table (PWT), a longitudinal international database produced since 1980 by the Center for International Comparisons at the University of Pennsylvania (CICP). Based on temporal and spatial extrapolations from the successive ICP benchmark studies, the PWT aims to establish a “Space-Time System of National Accounts” (Penn World Tables n.d.).
In the PWT, PPP adjustments for years other than those observed in the benchmark studies are derived from extrapolations. For example, following phase III in the ICP, 1950–1980 data were extrapolated from the 1975 benchmark data by applying United Nations' constant price series data “for consumption, gross domestic investment, government, and the net foreign balance,” and then adding the components (with “the net foreign balance [sic] exports and imports in 1975 . . . converted to dollars at current exchange rates”) to arrive at RGDP (Summers and Heston 1984:213). A similar procedure was followed to extrapolate data from Phase V (Summers and Heston 1991).
These PWT procedures differ from those followed at the World Bank. PPP-based national product data for benchmark years are projected backward and forward, as the case may be, through the use of growth rates from national account data in local currencies (rather than by using change in the components of GDP to calculate overall growth rates, as done in the PWT).
Extrapolation is required even among countries included in more than one ICP benchmark study. For these countries, benchmark years are not directly comparable to each other over time, since there is variation in the terms of trade and in the structure of prices that are used to value the quantities of goods in different countries. Also, the relevant data vary from benchmark study to benchmark study due to changing methodological procedures (e.g., in the treatment of service categories) and differences in the national accounts data series used in each phase. For all of these reasons, “[i]n many cases, a country's standings in consecutive benchmark studies—at the level of GDP or its components—imply a growth rate between the benchmark years that differs significantly from the growth rate embedded in the constant-price series of the country's national accounts” (Summers and Heston 1991:340). Furthermore, differences for a country among benchmark studies “are likely to increase as the length of time over which extrapolations are made is increased” (Ahmad 1997:16).
In constructing the PWT, these disparities were not a strong source of concern while the authors had a very limited number of countries with more than one benchmark study, but by the time they came to analyze Phase IV data it was identified as a more pressing issue. Thereafter, an error-in-variables maximum likelihood approach was developed to “consistensize” the data produced by different benchmark studies (Summers and Heston 1988 and 1991). Here again there are differences in the treatment of data by the PWT and the World Bank, as the latter chooses not to mix benchmark studies, and instead projects estimates from the latest benchmark study available, using constant national growth rate estimates calculated on the basis of local currencies.
In addition to extrapolations over time, ICP results are extrapolated across space in order to extend PPP coverage to non-benchmark countries. There are two main procedures followed to extrapolate data to other countries. A reduced information method uses survey data on prices for a limited number of items to estimate broader price levels for aggregate GDP components. This method has been used most frequently to provide approximations to price level changes in between benchmark studies (e.g., in the OECD Programme). More frequently, shortcut estimates for non-ICP countries are derived from “an estimating equation linking ICP estimates of GDP per capita and a selection of easily observable explanatory variables for countries for which ICP estimates are available” (Ahmad 1992:2). The equations used to extrapolate data for non-benchmark countries and years have changed from phase to phase, and differ among the organizations involved in producing PPP-adjusted income data (we discuss these equations further down).
Rougher estimates have been used for the case of China, a particularly important country due to the size of its population. For the most part, the PWT have used a rough PPP-based GNPPC estimate for 1975 China (12.3 percent of the United States) developed by Kravis (1981:61), who indicated that his estimates were “based on a much smaller [than the ICP] number of price comparisons gathered informally by price-collecting amateurs and on a breakdown of final expenditures on GDP that involves a great deal of plain guessing.” Another estimate was offered by Ruoen and Kai (1995:29), who nonetheless warned that their “study should ? be considered a very preliminary comparison,” providing only “possible orders of magnitude within which China's dollar per capita GDP might be.” Their own estimate of China's GDPPPC, for example, fell from $1044 to $770 when introducing the simple assumption that doctors in China have half the productivity as those in the United States (Ruoen and Kai 1995:31). The China problem persists in the more recent benchmark study: according to World Bank coordinators of the project, the 1995 preliminary estimates (based on a limited price survey covering only the prosperous regions of Guangdong and Shanghai) are still in use.
Finally, the PWT have also made use of shortcut procedures, although now focusing on quantities or shares rather than PPPs, to extrapolate estimates of expenditure shares for consumption, investment, and government for non-benchmark countries (except, generally, for centrally planned economies). For example, in constructing the PWT (Mark 5), “[a] relationship was found within the benchmark countries between each of the real shares and the level of total output and the three nominal shares (the shares based on national prices),” so “[t]he three relationships for [consumption], [investment] and [government] were then used to estimate the real shares for the non-benchmark countries” (Summers and Heston 1991:342).
Inevitably, the shift from observed data to the estimates derived from regressions introduces additional sources of error. Thus, each successive study on ICP data has identified errors and inaccuracies for both benchmark and non-benchmark countries (though particularly in non-benchmark countries), particularly for low-income nations but also for some regions (such as Africa) as a whole (Summers and Heston 1988:3). For example, analyzing the results of Phase IV, the authors noted an “average error of 48 percent” for non-benchmark African countries (Summers and Heston 1988:8). In Phase V, the authors of the Penn Tables analyzed the residuals in their regression for shortcut estimates, and concluded that “[t]he percentage accuracy, to be interpreted in 0.95 confidence interval terms, is guessed to range from 60 percent up or down for countries with GDPs per capita less than a tenth of the United States, to 19 percent up or down for countries between half and seven-tenths of the United States; and 15 percent for countries as close as seven-tenths of the United States” (Summers and Heston 1991:340).
1. Productivity Adjustments in Phase III. Different alternative output-based measures of productivity were deemed impractical due to a lack of data. Based on a limited number of countries (n = 24), the authors estimated “not a tight” regression (R2 = 0.26) where the “average difference between the direct and indirect price comparisons” for physician services were regressed against preliminary estimates of real GDP per capita. This regression was then used to derive a multiplier to make productivity corrections based on the average real GDP of groups of countries (organized according to income levels). This multiplier—drawing from limited data on physician services, derived from a loose regression, and applied to groups of nations based on average incomes—was then used as the productivity adjustment not only for physician services, but also for the other health services (dentists, nurses, and hospitals) where adequate data were not easily forthcoming.
Rough adjustments were made also to educational and government services. In the case of first- and second-level teachers (but not third-level), employment data were adjusted according to broad averages in years of education. For all teachers, these employment data were then further adjusted by average number of students in the classroom (under the assumption that higher productivity of teachers would be reflected in larger classrooms). Finally, for government employees, input data were adjusted by “an extremely rough approximation,” using a capital adjustment (observed for health care data) of “15 percent for countries with per capita income (from a preliminary ICP estimate) of 30 to 50 percent of that of the United States, and 30 percent for countries with incomes less than 30 percent of that of the United States” (Kravis et al. 1982: 159). The overall conclusion of the authors was that although productivity adjustments changed the estimated volume of services for each of the categories, such adjustments produced little difference in the final real GDP estimates—4 to 6 percent for the lower income nations in the limited (n = 16) 1970 sample.
2. Aggregation Methods. In ICP practice, two major aggregation methods are applied. The Geary-Khamis (GK) method, mostly used by the scholars producing the Penn World Tables, is based on calculating the parities of all countries in the region of comparison at a single set of average international prices. In contrast, the Elteto, Koves and Szulc (EKS) method, favored by the OECD, is based on binary price comparisons for all pairs of countries in a region, and produces parities that are more characteristic of the price structure of the individual countries. Both measures are transitive and base country invariant.
The major advantage of the GK method is its additivity: the calculated components of GDP add up to the total GDP (and this is one of the principal reasons the procedure was preferred in producing the Penn World Tables, as one of the aims of this project was to estimate “real” rates of investment and personal consumption). Yet, the major disadvantage of the GK method compared to the EKS method is that “international prices” in the former tend “to be closer to the price structure of the larger economies in the group and cause an overvaluation of the outputs of the smaller ones” (Ahmad 1997:15). To some extent, the regionalization of ICP work since 1980 has reduced this effect of the GK method by confining comparisons among countries with similar expenditure patterns (Ahmad 1997).
3. Shortcut Estimates. At the University of Pennsylvania, the results of Phase II were used to extrapolate data for 119 countries using a model regressing real GDP on GDP at exchange rates, the same measure squared, a price isolation variable (measuring the mean squared deviation between a country's and the world's implicit deflators) and a measure of openness (the share of the sum of exports and imports over GDP averaged “over several years”) (Summers, Kravis, and Heston 1980:21–22; Ahmad 1980:15–16). A similar extrapolation of data for broad regions of the world economy were presented in Phase III, although with a model that dropped the price isolation variable (Kravis, Heston, and Summers 1982). In subsequent work on Phase III data, regression models were further elaborated to provide 1950–1980 data for 124 countries: domestic absorption rather than GDP was used to estimate RGDP for non-benchmark countries, constant terms were eliminated, and the 1970 and 1975 were combined through a complex procedure “to get a single 1975 estimate in a more satisfactory way” (Summers and Heston 1984:209).
In Phase IV, the openness variable was dropped from the equations, and additional variables were introduced (a dummy variable for Africa, and “a set of international post-allowance prices collected by the United Nations International Civil Service and Economic Conditions Abroad”) (Summers and Heston 1988:23). The surveys in question are designed to allow for the salaries “of high-ranking civil servants and business executives assigned to different foreign countries” to be adjusted for differences in cost of living (Summers and Heston 1991:341). Clearly, the price surveys target a very specific set of commodities and services, appropriate to the task at hand, but Summers and Heston (1991:341) indicate that “a structural relationship was found in the benchmark countries between a country's PPP and its post-allowance PPP,” so the survey data were included in the relevant equation. The latest estimates (Penn World Table, Mark 5) use only the post-adjustment data from the United Nations and other industry sources to estimate PPPs.
Other agencies involved in estimating PPPs through short-cut estimates, such as the World Bank and the OECD, have used slightly different equations. For example, the openness variable was dropped in the later phases of the ICP, but the OECD (n.d.:9) reports that it has continued to use the variable (in conjunction with exchange-rate GDP data) to extrapolate PPPs for countries (such as Mexico and Korea) not involved in its own direct comparisons. And the World Bank uses a regression model that uses Atlas estimates of per capita GDP and secondary school enrollment as independent variables to calculate a short-cut estimate of PPP-adjusted GDP per capita (for early formulations see Isenman 1980, and Ahmad 1980; for more recent formulations, see Ahmad 1992). The two independent variables used by the World Bank “are used as rough proxies for inter-country wage differentials for unskilled [Atlas estimates of income] and skilled [secondary school enrollment] human capital,” under the rationale “that ICP and conventional estimates of GDP differ mainly because wage differentials persist among nations due to constraints on the international mobility of labor” (World Bank 1993:23). This explanation differs slightly from the one provided earlier by Ahmad (1980), who explains that many variables were tried in different equations to arrive at a best-fitting regression.
References
Abraham William
Ruggles Nancy D.
Ruggles Richard
1965
An Economic Data Reporting System for the Agency for International Development.
New Haven
Economic Growth Center at Yale University
Ahmad Sultan
1978
“Shortcut Methods of International Comparisons of Real Product and Purchasing Power of Currencies.”
Ph.D. dissertation
Philadelphia
University of Pennsylvania
Ahmad Sultan
Sept. 1980
“Approaches to Purchasing Power Parity and Real Product Comparisons Using Shortcuts and Reduced Information.”
World Bank Staff Working Paper No. 418
The World Bank
Ahmad Sultan
Aug. 1992
“Regression Estimates of Per Capita GDP Based on Purchasing Power Parities.”
Working Papers 0956
Socio-Economic Data Division, International Economics Department
The World Bank
Ahmad Sultan
1997
“International Comparison of Incomes: Why Should One Bother Using PPP Conversion?”
Unpublished paper
Anderson Victor
1991
Alternative Economic Indicators
London
Routledge
Australian Bureau of Statistics
1999
“The Future of the International Comparison Programme (ICP): Comments by the Australian Bureau of Statistics.”
www.un.org/depts/unsd/statcom
Beneria Lourdes
1999
The Enduring Debate over Unpaid Labour.
International Labour Review
138
3 (Aug.)
287
309Google Scholar
Boli, John and George Thomas, eds.
1999
Constructing World Culture: International Nongovernmental Organizations since 1875.
Stanford
Stanford University Press
Boserup Ester
1970
Women's Role in Economic Development
New York
St. Martin's Press
Bowker Geoffrey
Star Susan Leigh
2000
Sorting Things Out: Classification and Its Consequences.
Cambridge
Massachusetts Institute of Technology Press
Brown John Seely
Duguid Paul
2000
The Social Life of Information.
Boston
Harvard Business School Press
Callon Michel
1980
Struggles and Negotiations to Define what Is Problematic and what Is Not: The Socio-logic of Translationed.
The Social Process of Scientific Investigation: Sociology of the Sciences Yearbook
K. D. Knorr-Cetina, R. Krohn, and R. D. Whitley
Dordrecht
Reidel
Castles Ian
N.d.
“Damn Lies and Statistics.”
http://highered.theoz.com.au/flathtml/research/castles.html
Duncan Joseph W.
1994
A Layman's Description of the United Nations' System of National Accounts
Business Economics
29
1
50
58Google Scholar
Economic and Social Commission for Asia and the Pacific
1995
“Report of the Workshop on the Review of 1993 Comparison Programme Data.”
www.unescap.org/stat/meet/icp.htm
Firebaugh Glen
1999
Empirics of World Income Inequality.
American Journal of Sociology
104
1597–630Google Scholar
Firebaugh Glen
2000
Observed Trends in Between-Nation Income Inequality and Two Conjectures.
American Journal of Sociology
106
1
215Google Scholar
Gilbert Milton
Kravis Irving B.
1954
An International Comparison of National Products and the Purchasing Power of Currencies: A Study of the United States, the United Kingdom, France, Germany and Italy
Paris
The Organisation for European Economic Co-Operation
Hopkins Terence
1978
World Systems Analysis: Methodological Issues
Social Change in the Capitalist World Economy
Barbara Kaplan
Beverly Hills, Calif.
Sage Publications
1997
Human Development Report
New York
United Nations Development Program
Korzeniewicz Roberto Patricio
Moran Timothy Patrick
1997
World-Economic Trends in the Distribution of Income, 1965–1992.
American Journal of Sociology
102
1000–39Google Scholar
Korzeniewicz Roberto Patricio
Moran Timothy Patrick
2000
Commentary and Debate: Measuring World Income Inequalities.
American Journal of Sociology
106
1
209Google Scholar
Kravis Irving B.
Heston Alan
Summers Roberts
1978
International Comparisons of Real Product and Purchasing Power
Baltimore
Johns Hopkins University Press
Kravis Irving B.
Heston Alan
Summers Roberts
1982
World Product and Income: International Comparisons of Real Gross Product
Baltimore
Johns Hopkins University Press
Kravis Irving B.
Kenessey Zoltan
Heston Alan
Summers Robert
1975
A System of International Comparisons of Gross Product and Purchasing Power
Baltimore
Johns Hopkins University Press
Latour Bruno
1987
Science in Action: How to Follow Scientists and Engineers through Society.
Cambridge, Mass.
Harvard University Press
McNeely Connie L.
1995
Constructing the Nation-State
London
Greenwood Press
OECD
2000
“The Conceptual Framework Underlying the National Accounts.” Technical Note.
www.oecd.org/std/natechn.htm
Poovey Mary
1998
A History of the Modern Fact. Problems of Knowledge in the Science of Wealth and Society.
Chicago
Chicago University Press
Porter Theodore M.
1986
The Rise of Statistical Thinking 1820–1900.
Princeton
Princeton University Press
Ruggles Nancy D.
Ruggles Richard
1999
National Accounting and Economic Policy
Northampton
Edward Elgar Publishing
Ruggles Richard
1949
“National Income Accounting and Its Relation to Economic Policy.”
Report for the Office of the Special Representative in Europe, Economic Cooperation Administration
Paris
Ruggles Richard
Ruggles Nancy D.
1956
National Income Accounts and Income Analysis
New York
McGraw Hill
Ruggles Richard
Ruggles Nancy D.
1968
“The Evolution and Present State of National Economic Accounting.”
International Journal of Accounting
4
1
1
16Google Scholar
Ryten Jacob
1998
“The Evaluation of the International Comparison Project (ICP).”
www.un.org/Depts/unsd/sna/icp/icprep.htm
Shapin Steven
Schaffer Simon
1985
Leviathan and the Air-Pump: Hobbes, Boyle and the Experimental Life.
Princeton
Princeton University Press
Srinivasan T.N.
1994
Special Issue on “Conference on Database on Development Analysis,” held at Yale University, 15–16 May 1992.
Journal of Development Economics
44
1Google Scholar
Studenski Paul
1958
The Income of Nations: Theory, Measurement and Analysis: Past and Present
New York
New York University Press
Summers Robert
Alan Heston
1988
A New Set of International Comparisons of Real Product and Price Levels Estimates for 130 countries, 1950–1985.
The Review of Income and Wealth
34
1
1
25Google Scholar
Summers Robert
Alan Heston
1991
The Penn World Table (Mark 5): An Expanded Set of International Comparisons, 1950–1988.
Quarterly Journal of Economics
106
327–68Google Scholar
Summers Robert
Alan Heston
1995
Standard of Living: An Alternative Measure of Nations' Current Material Well-Being
CICUP
95–5
University of PennsylvaniaGoogle Scholar
UNIFEM
1997
UNIFEM Bangkok News,
No. 2, March—April
http://www.unifem-eseasia.org/Newstext/MarApr2.htm
United Nations
1953
A System of National Accounts and Supporting Tables No. 2
New York
United Nations Department of Economic Affairs, Statistical Office
United Nations
1986
National Accounts Statistics: Study of Input-Output Tables, 1970–80
New York
United Nations
United Nations
1987
National Accounts Statistics: Study of Input-Output Tables, 1970–80
New York
United Nations
United Nations
1992
Handbook of the International Comparison Programme
New York
United Nations
1993
System of National Accounts, 1993
New York
United Nations
United Nations Department of Economic and Social Affairs.
1977
Provisional International Guidelines on the National and Sectoral Balance-Sheet and Reconciliation Accounts of the System of National Accounts.
Series M., No. 60
New York
United Nations
United Nations Economic and Social Council
1963
The Use of National Accounts for Economic Analysis and Development Planning
Economic Commission for Latin America (Tenth Session). Mar del Plata
Argentina
United Nations
United Nations Economic and Social Council
1976
Economic Statistic. Price and Quantity Statistics. Draft Guidelines on Principles of a System of Price and Quantity Statistics. Report of the Secretary-General.
Statistical Commission (Nineteenth Session, New Delhi, 8–19 Nov.)
United Nations Economic and Social Council
2000
Report of the Thirty-First Session of the Statistical Commission. E/CN.3/2000
United Nations Human Development Report Office.
1997
“Analytical Tools for Human Development.”
http://www.undp.org/hdro/anatools.htm#2
United Nations Secretariat
1959
Integration of Financial Flows into a System of National Accounts
United Nations Seminar on National Accounts for Latin America (11–26 June 1959)
Rio de Janeiro, Brazil
United Nations Statistical Office
1960
A System of National Accounts and Supporting Tables
New York
United Nations
United Nations Statistical Commission and Economic Commission for Europe (with the Government of Turkey).
1971
Problems and Methods of Building a System of Demographic Statistics and Compiling the Required Data
Report on the United Nations European Seminar on Demographic Statistics (Ankara and Istanbul, 11–19 Oct.)
New York
United Nations
Usher Dan
1968
The Price Mechanism and the Meaning of National Income Statistics
Oxford
Clarendon Press
Wallerstein Immanuel
1996
Open the Social Sciences. Report of the Gulbenkian Commission on the Restructuring of the Social Sciences.
Stanford
Stanford University Press
World Bank
1993
Purchasing Power of Currencies: Comparing National Incomes Using ICP Data
Washington, D.C.
World Bank
World Bank
1999a
“Observation of the World Bank of the Report on the Evaluation of the International Comparison Programme.”
www.un.org/depts/unsd/statcom
World Bank
1999b
World Development Report 1999
Baltimore
Johns Hopkins University Press
World Bank
2001
World Development Report 2000/2001
Oxford
Oxford University Press

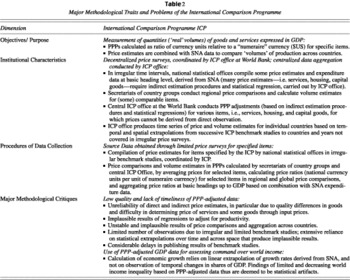

Figure 1. The Varying Success of the SNA and ICP Projects

 You have
Access
- 9
- Cited by