


Introduction
Common bean (Phaseolus vulgaris L.) is the third most important food legume in the world after soybean and peanut (Singh, Reference Singh and Singh1999; Broughton et al., Reference Broughton, Hernandez, Blair, Beebe, Gepts and Vanderleyden2003). Its high nutritional quality, elevated protein content and low cost make common bean a staple in the diet of many Latin Americans. Beans are also appealing for their diversity in seed form, colour and size; eating texture; and capacity to adapt to different climatic conditions (Kornegay and Cardona, Reference Kornegay, Cardona, Schoonhoven and Voysest1991). Molecular markers indicate two principal gene pools of common bean, whose centres of origin and domestication are in the Andes and Mesoamerica/Central America (Gepts et al., Reference Gepts, Osborn, Rashka and Bliss1986; Becerra Velásquez and Gepts, Reference Becerra-Velásquez and Gepts1994). Using morphological and biochemical characteristics, Singh et al. (Reference Singh, Gepts and Debouck1991a, Reference Singh, Gutierrez, Molina, Urrea and Geptsb) subdivided the gene pools into six races: Nueva Granada (NG), Peru (P) and Chile (Andean gene pool), and Durango, Jalisco and Mesoamerica (Mesoamerican gene pool). With molecular markers, Beebe et al. (Reference Beebe, Skroch, Tohme, Duque, Pedraza and Nienhhuis2000) also distinguished a fourth race in the Mesoamerican gene pool that they named Guatemala, which was later confirmed to be distinct from other Mesoamerican beans by Blair et al. (Reference Blair, Díaz, Buendia and Duque2009) using a larger group of genotypes. At least, three of these races (P, NG, Mesoamerica (M) and possibly Guatemala) overlap in northern South America, where a long history of bean cultivation has encouraged the creation of a diverse set of landraces (Gepts and Bliss, Reference Gepts and Bliss1986).
Among the countries of northern South America or nestled in the Andes mountains, Colombia is the largest producer of common beans, with over 120,000 ha planted per year. Beans along with maize, cassava and several native root crops form the basis of the diet, and along with coffee and fruit species, they are of utmost importance to the small-farm economy, particularly in the medium altitudes of the three ‘cordillera’ mountain ranges (Ligareto, Reference Ligareto1991). Given the wide area across which beans are grown in these mountains, Colombian landraces of beans are adapted to many altitudes and water regimes. The following departments of Colombia produce beans: Antioquia, Santander and Santander del Norte, Huila, Tolima, Boyacá, Cundinamarca and Nariño, in descending order of production (Ríos-Betancour and Quirós-Dávila, Reference Ríos-Betancour and Quirós-Dávila2002). Some reduction in bean-growing area has been observed, although per hectare yields have generally increased. During 2002–2006, production fell to around 100,000 tons due to violence in the countryside but has been higher in subsequent years according to the Ministry of Agriculture and Rural Development (FAOSTATS).
Archaeological evidence of common beans in Colombia has been found among other crop remains especially in highland regions and intervening valleys (Morcote-Ríos, Reference Morcote-Ríos2006). Pre-Colombian beans have been recorded in the Sabana de Bogotá in deposits near the University of Tunja dating from 1000 AC. Meanwhile, in the Valle del Cauca, beans may be even more ancient having been associated with the Yotocó and Calima cultures (100 BC to 1200 AC). Finally, other beans dating from 1115 AC were discovered in the Department of Risaralda. Iconography of common beans in archaeological remains is not as common as in other parts of South America where pre-Incan and Incan civilizations were predominant, but this may be due to the greater emphasis placed on animal versus plant iconography in the mega-diverse region of the Northern Andes compared to the drier and less diverse areas to the south.
Colombian landraces are highly heterogeneous for their seed form, colour and size, as well as for plant growth characteristics (Ríos-Betancour and Quirós-Dávila, Reference Ríos-Betancour and Quirós-Dávila2002). This heterogeneity probably originated from farmers' preferences in different growing regions. Along with landraces, wild accessions of P. vulgaris are also reported from the Eastern Cordillera in the Departments of Santander, Norte de Santander, Boyacá and Cundinamarca (Gepts and Bliss, Reference Gepts and Bliss1986; Tohme et al., Reference Tohme, Gonzalez, Beebe and Duque1996). Hybrid swarms of wild and weedy types are known to exist in certain forest regions of the country (Beebe et al., Reference Beebe, Toro, Gonzalez, Chacón and Debouck1997). Tohme et al. (Reference Tohme, Gonzalez, Beebe and Duque1996) analyzed the molecular structure of a core collection of wild beans using early generation molecular markers, and concluded that Colombia was a minor centre of diversity for the species along with centres in Mesoamerica, Ecuador and Northern Peru as well as in the Southern Andes. Debouck (Reference Debouck1996) argued that genes from wild beans are assimilated into intermediate forms and landraces, and suggested that many landraces may have derived in part from wild sympatric populations. Colombian diversity within the Andean gene pool was reported to be high by Blair et al. (Reference Blair, Diaz, Hidalgo, Diaz and Duque2007) with blurring between the NG and P races. Furthermore, because of its strategic location, Colombia has been a place of considerable exchange and hybridization between the two principal gene pools (Gepts and Bliss, Reference Gepts and Bliss1986).
Microsatellite markers (simple sequence repeats, SSRs) have lately been used to show that both Andean and Mesoamerican beans possess high genetic diversity (Díaz and Blair, Reference Díaz and Blair2006; Blair et al., Reference Blair, Diaz, Hidalgo, Diaz and Duque2007; Asfaw et al., Reference Asfaw, Blair and Almekinders2009; Blair et al., Reference Blair, Díaz, Buendia and Duque2009; Kwak and Gepts, Reference Kwak and Gepts2009; Rossi et al., Reference Rossi, Bitocchi, Bellucci, Nanni, Rau, Attene and Papa2009). SSRs have also been used to distinguish race Mesoamerica and the Durango–Jalisco complex of the Mesoamerican gene pool (Díaz and Blair, Reference Díaz and Blair2006), and races Chile, NG and P in the Andean pool (Blair et al., Reference Blair, Diaz, Hidalgo, Diaz and Duque2007; Becerra et al., Reference Becerra, Paredes, Rojo, Díaz and Blair2010). SSR markers can determine genetic structure more precisely than other types of markers (Liu et al., Reference Liu, Goodman, Muse, Smith, Buckler and Doebley2003). While some authors have used non-specific fluorescent dyes based on M13 labelling with common bean microsatellites (Kwak and Gepts, Reference Kwak and Gepts2009; Oblessuc et al., Reference Oblessuc, Campos, Kupper Cardoso, Augusto Sforça, Moro Baroni, Pereira de Souza and Benchimol2009), we have developed a group of specific, fluorescent dye-labelled microsatellites that have proved to be a highly efficient tool for analyzing allelic diversity in beans (Blair et al., Reference Blair, Díaz, Buendia and Duque2009), given that the estimate of allele sizes is not biased by the effect of the M13 label.
The objectives of this study, therefore, were (1) to better understand the variability present in Colombian landraces; (2) to determine the extent of inter-gene pool hybridization in the creation of Colombian landraces; (3) to evaluate the population structure found with fluorescently labelled microsatellite primers versus unlabelled primers such as those used in our previous studies of Andean or Mesoamerican genotypes from the northern Andes (Blair et al., Reference Blair, Diaz, Hidalgo, Diaz and Duque2007) and (4) to compare allele diversity for 14 microsatellites evaluated with both labelled and unlabelled primers.
Materials and methods
Genotypes and DNA extraction
As a first step in the analysis of Colombian landraces, we selected 92 genotypes from the FAO collection of common bean genotypes in the genebank held under the responsibility of the CIAT genetic resource programme (GRP) along with four control genotypes Diacol Calima, DOR364, ICA Pijao and G19833, which had been used by Blair et al. (Reference Blair, Diaz, Hidalgo, Diaz and Duque2007). These included all of the Andean genotypes evaluated by Blair et al. (Reference Blair, Diaz, Hidalgo, Diaz and Duque2007) plus a set of Mesoamerican genotypes found at http://www.generationcp.org/gcp_central_registry excluding G4550, G7314, G8160, G12702, G14644, G19142B and G21227. Seeds for the analysis were multiplied by the bean programme from a genetic stock held by the GRP, while the GRP provided passport, morphological and phaseolin data on each accession analyzed (http://isa.ciat.cgiar.org/urg). For the DNA extraction, three seeds with the same seed morphology and colour within each accession were selected for each genotype and germinated on a square of germination paper (30 × 25 cm) laid over cotton wool that was previously wetted with distilled water. The seeds were incubated for 3 or 4 d, and young trifoliate leaves were removed from each seedling. Total DNA was extracted from this leaf tissue ground in liquid nitrogen and using the cetyl trimethylammonium bromide extraction method as described by Afanador et al. (Reference Afanador, Hadley and Kelly1993). Agarose gel electrophoresis was then carried out to determine the quality of the extracted DNA. Concentrations were quantified in a DNA Quant™ 200 Fluorometer (Hoefer Pharmacia Biotech, Inc., San Francisco, CA, USA), and dilutions were made to 10 ng/ml for further use.
Fluorescent dye-labelled and unlabelled microsatellites
The allelic diversity of the genotypes was evaluated using 52 microsatellites specific to common beans, 36 of which came from a kit of fluorescent dye-labelled markers distributed in nine panels as described in Blair et al. (Reference Blair, Díaz, Buendia and Duque2009), while the other 16 microsatellites were unlabelled (Tables 1 and 2). Fourteen of the fluorescently labelled markers were also run as unlabelled markers for a total of 66 individual SSR evaluations (36 fluorescent and 30 non-fluorescent microsatellite markers). For the fluorescent markers, each SSR was placed into a fluorescent panel consisting of four markers each carrying a specific fluorescent tag of 6-FAM (blue), NED (yellow), PET (red) or VIC (green) dyes attached to the 5′ end of the forward primer according to the supplementary table in Blair et al. (Reference Blair, Díaz, Buendia and Duque2009). Of the 52 microsatellites, 31 were based on non-gene-coding sequences (genomic SSRs), and 21 were based on gene-coding regions (genic SSRs). All the microsatellites were previously selected according to their high indices of polymorphism information content (PIC), large number of alleles, even genetic diversity distribution across linkage groups in the genome and good amplification signal (Blair et al., Reference Blair, Pedraza, Buendia, Gaitán-Solis, Beebe, Gepts and Tohme2003, Reference Blair, Giraldo, Buendia, Tovar, Duque and Beebe2006, Reference Blair, Díaz, Buendia and Duque2009). PCR conditions were similar for both labelled and unlabelled microsatellites with reactions including 1 × PCR buffer (10 mM Tris–HCl, pH 8.8; 50 mM KCl; and 0.1% Triton X-100), 1.5 mM MgCl2, 0.2 mM dNTPs, 0.3 nM of each primer and 1 U of Taq polymerase (Promega Corporation, Madison, WI, USA). However, for the unlabelled SSRs, we used 0.25 mM dNTPs.
Genetic diversity summary statistics for Colombian common bean landraces using 36 labelled microsatellites

ND, linkage group not determined; N a, number of alleles; N o, number of observations made; H o, observed heterozygosity; PIC, polymorphism information content.
a Linkage group according to Blair et al. (Reference Blair, Pedraza, Buendia, Gaitán-Solis, Beebe, Gepts and Tohme2003).
b Gene diversity according to Nei and Li (Reference Nei and Li1979).
Genetic diversity summary statistics for Colombian common bean landraces using 16 unlabelled microsatellites to complement those analyzed in Table 1
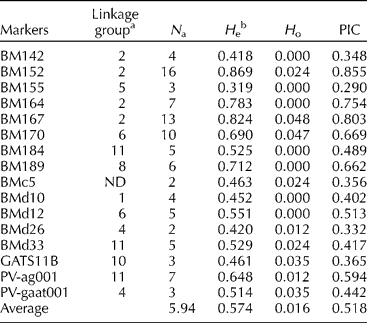
ND, linkage group not determined; N a, number of alleles; N o, number of observations made; H o, observed heterozygosity; PIC, polymorphism information content.
a Linkage group according to Blair et al. (Reference Blair, Pedraza, Buendia, Gaitán-Solis, Beebe, Gepts and Tohme2003).
b Gene diversity according to Nei and Li (Reference Nei and Li1979).
The PCRs of the labelled SSRs were carried out individually for each pair of primers. The temperatures for the cycling profile were similar for the labelled and unlabelled microsatellites. For the unlabelled ones, the programme began with 92°C for 3 min; followed by 34 cycles of denaturation at 92°C for 30 s, annealing at 50–65°C (depending on the melting temperature for each primer pair) for 30 s and extension at 72°C for 45 s. For the labelled SSRs, only 28 cycles of denaturation at 95°C for 40 s, annealing at 55°C for 40 s and extension at 72°C for 1 min were used to moderate signal strength. To visualize the amplification products, two techniques were used: namely polyacrylamide gels at 4% and silver staining for unlabelled microsatellites according to Blair et al. (Reference Blair, Giraldo, Buendia, Tovar, Duque and Beebe2006); and capillary separation on an ABI PRISM 3730 fragment analyzer (Applied Biosystems, Foster City, CA, USA) for fluorescently labelled microsatellites according to Blair et al. (Reference Blair, Díaz, Buendia and Duque2009). The PCR products of the labelled SSRs were run in the facilities of the Biotechnology Unit of Cornell University, while the unlabelled SSRs were evaluated in the Bean Genetic Characterization Laboratory of CIAT. For the labelled microsatellites, the molecular weight of the bands was estimated by comparing to an internal molecular weight standard GeneScan™ 500 LIZ® using GeneMapper® Software v.3.7 (both from Applied Biosystems), while for unlabelled markers, the allele sizes were determined through comparison to a 10-bp molecular weight standard (Invitrogen Corp., Carlsbad, CA, USA). Alleles from labelled microsatellites were binned using AlleloBin software from ICRISAT (http://www.icrisat.org/gt-bt/biometrics.htm), while unlabelled alleles were compared to those of controls Diacol Calima and G19833 (both Andean) and DOR364 and ICA Pijao (both Mesoamerican).
Data analysis
To assess the relationships between accessions, we first used a similarity index for shared alleles estimated with SAS v.9.1.3 software (SAS Institute, 1996), based on the formula:  where ‘PSi’ equals the proportion of shared alleles at locus i and ‘n’ equals the total number of loci. A principal coordinate analysis (PCoA) was then carried out with SAS v.9.1.3 as well to graph the individuals in three-dimensional space and to determine the study samples' population structure comparing this to results from STRUCTURE v.2 software (Pritchard et al., Reference Pritchard, Stehens and Donnelly2000) based on an ‘admixture model’, 50,000 burn-ins and 100,000 iterations. We also determined common parameters of genetic diversity such as the percentage of polymorphic loci; genetic diversity, which is also described as expected heterozygosity (H e); proportion of heterozygous individuals observed in the population (H o); and PIC. All these parameters were estimated using PowerMarker v.3.0 (Liu and Muse, Reference Liu and Muse2005; http://www.powerMarker.net) software and determined for each group of genotypes discovered in the genetic similarity/PCoA. Wright statistics and analysis of molecular variance (AMOVA) were calculated with Arlequin v.3.11 (http://cmpg.unibe.ch/software/) software. Linkage disequilibrium (LD) between the markers was determined for the set of non-overlapping 52 polymorphic SSRs with the dedicated procedure found in TASSEL (http://www.maizegenetics.net/) software using 1,000 permutations.
Results
Allelic polymorphism for the complete dataset
Analysis of allele polymorphism was conducted for 36 fluorescent microsatellites and 16 non-fluorescent, non-overlapping microsatellites as described in Tables 1 and 2. Of these markers, seven loci have not been assigned to linkage groups. The other 45 markers represented every linkage group of the common bean genetic map presented by Blair et al. (Reference Blair, Pedraza, Buendia, Gaitán-Solis, Beebe, Gepts and Tohme2003) with 4.1 loci/linkage group. In terms of diversity, this group of microsatellite loci revealed a total of 436 alleles with all markers polymorphic and the number of alleles ranging from 2 to 41 per locus with an average of 8.2. PIC values ranged from 0.023 to 0.914 with an average of 0.545. Meanwhile, H e ranged from 0.024 to 0.946 with an average of 0.590, and observed heterozygosity was generally low (0.000 to 0.333 with an average of 0.0474).
As might be expected, the total number of alleles found with the automated system using the labelled SSR markers was higher than that reported for the manual system using the unlabelled SSR markers (341 vs. 95). Similarly, the average number of alleles/marker (9.47 vs. 5.94 for the two marker types, respectively), H e (0.598 vs. 0.574) and PIC values (0.558 vs. 0.518) were also contrasting. This difference between the labelled markers and unlabelled marker results may be related to the number of markers used in each category or to the distribution of genomic and gene-based markers in each group of markers since both marker types were used in the study.
Among all the markers used, the highest diversity was found for PV-at001 with 41 alleles and an H e of 0.946, confirming findings by Blair et al. (Reference Blair, Díaz, Buendia and Duque2009). Markers with intermediate to high diversity included those with a number of alleles equal to or higher than 20 including BM187 (25), BM143 and BM156 (22 alleles each), BM160 (21) and BM200 (20) each with an H e that was equal or higher than 0.900. In contrast, none of the unlabelled SSRs presented H e levels above 0.900, and the best unlabelled markers were BM152 with a PIC value of 0.869 and 16 alleles or BM167 with a PIC value of 0.824 and 13 alleles. Other unlabelled SSRs that stood out were BM170 (ten alleles) and PV-ag001 (seven alleles).
Markers with a low number of alleles (two) were found with both types of SSRs, for example BMc5 and BMd26 among the unlabelled markers, and BMd2, BMd51, GATs54 and PV-at003 among the labelled markers, with BMd51 being the least informative marker in terms of H e (H e = 0.024 and PIC value = 0.023). In total, 67% of the markers analyzed had an H e level between 0.500 and 1.000. In terms of observed heterozygosity, both marker types generally detected low levels of heterogeneity or heterozygosity; however, labelled SSRs more often detected two bands from a genotype. This was especially the case for BMd01 (H o of 0.333), BMd15 (0.247) and BM187 (0.188); where BMd01 has been observed before to be a multilocus marker (Blair et al., Reference Blair, Giraldo, Buendia, Tovar, Duque and Beebe2006). In contrast, none of the unlabelled markers presented observed heterozygosity indices of more than 0.048.
Further comparison of the labelled versus the unlabelled SSRs
Among the 52 microsatellite loci that were analyzed, 14 were repeated with both techniques to establish the advantages and disadvantages of the two methodologies as indicated in Table 3. Compared to the labelled SSRs, the unlabelled SSRs presented a similar but slightly higher total (149 vs. 135) and average (10.6 vs. 9.6) number of alleles. H e was similar for both repetitions of the same markers (0.70 and 0.66, respectively) as were PIC values (0.67 and 0.63, respectively). One apparent difference was that the labelled SSRs identified higher observed heterozygosity than the unlabelled SSRs (0.06 vs. 0.03). Despite these small differences, the correlation between the number of alleles was positive with a highly significant (P < 0.000) r-value (0.908). Missing data accounted for only 2.8% of genotype-by-marker combinations for labelled SSRs and only 0.2% for silver-stained alleles.
Comparison of genetic diversity parameters of labelled SSRs with unlabelled SSRs

N a, number of alleles; N o, number of observations made; H o, observed heterozygosity; PIC, polymorphism information content.
a Gene diversity according to Nei and Li (Reference Nei and Li1979).
b t-test used with threshold of P < 0.05 for differences between the averages of labelled and unlabelled SSRs as distinguished by different letters for the same variable.
Among the individual markers, the unlabelled amplifications of BM143, BM175, BMd15, PV-ctt001, GATs54 and GATs91 presented a larger number of alleles than the corresponding labelled SSRs, probably because the interpretation of allele bands was more difficult when visualizing the alleles in silver-stained gels than with automated detection. In some cases, labelled SSRs showed a larger number of alleles than their unlabelled counterparts: as was found for BM140, BM160, BM183 and BM201. This could have been a result of the automated allele calling found in the ABI detection system, although all data from the capillary system were checked for allele differences.
Population structure and principal coordinates analysis
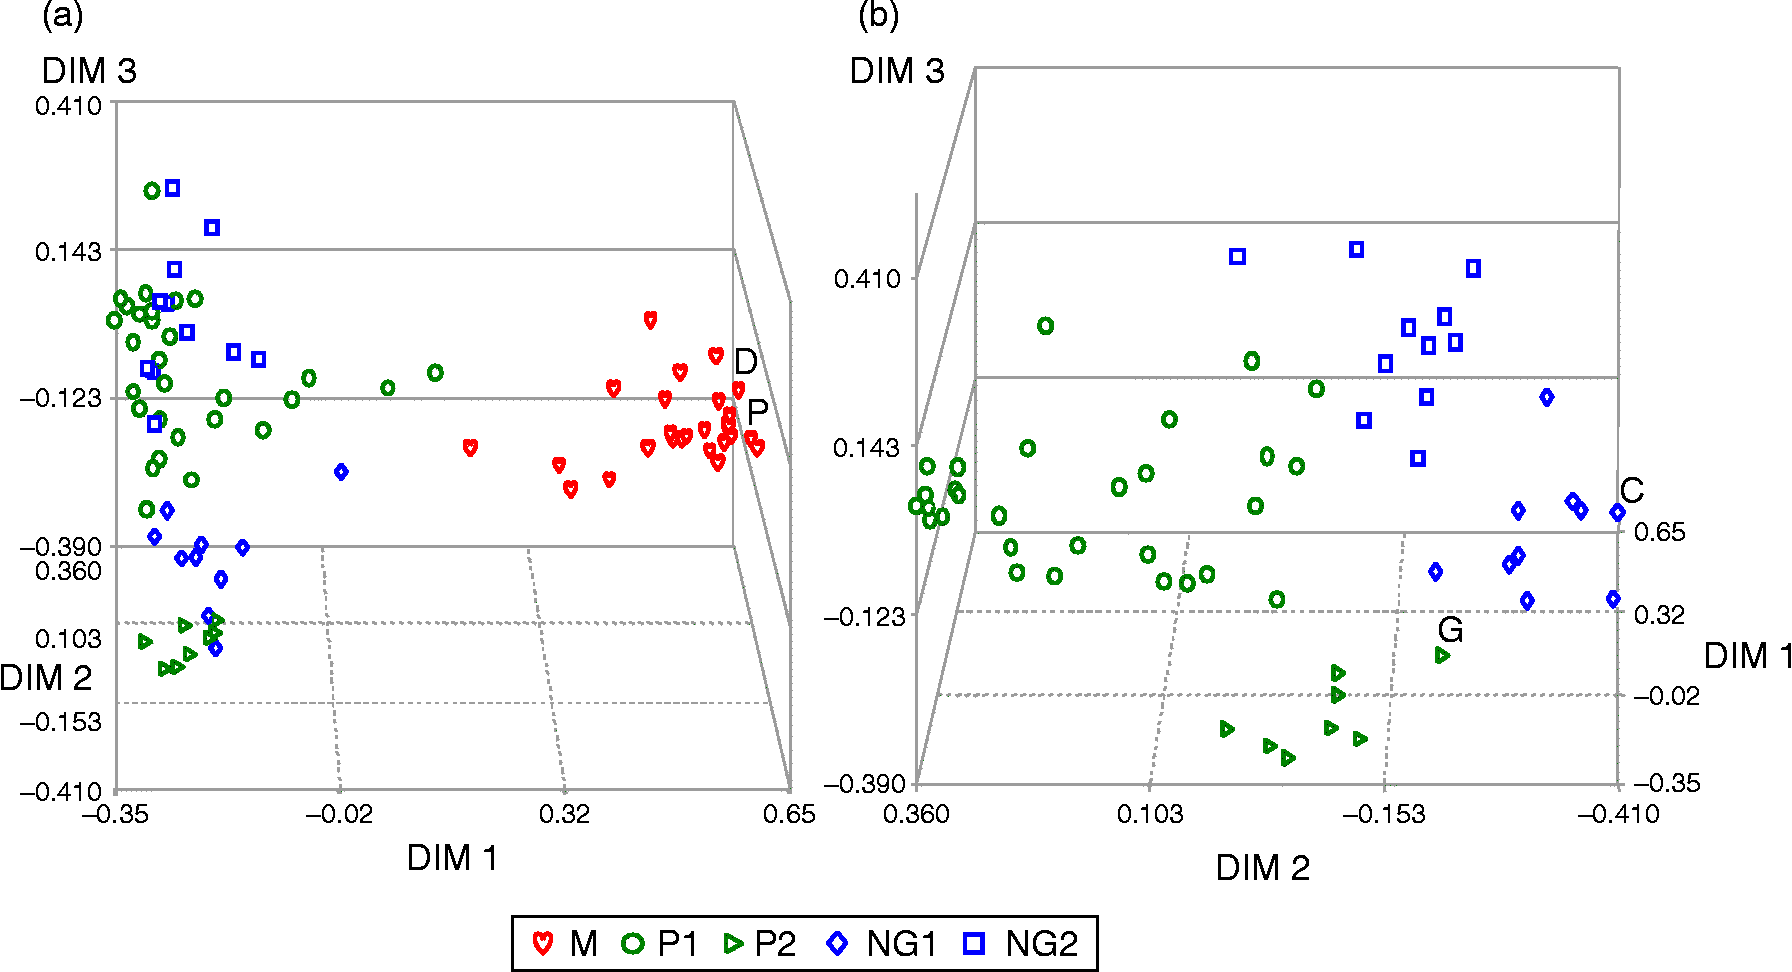
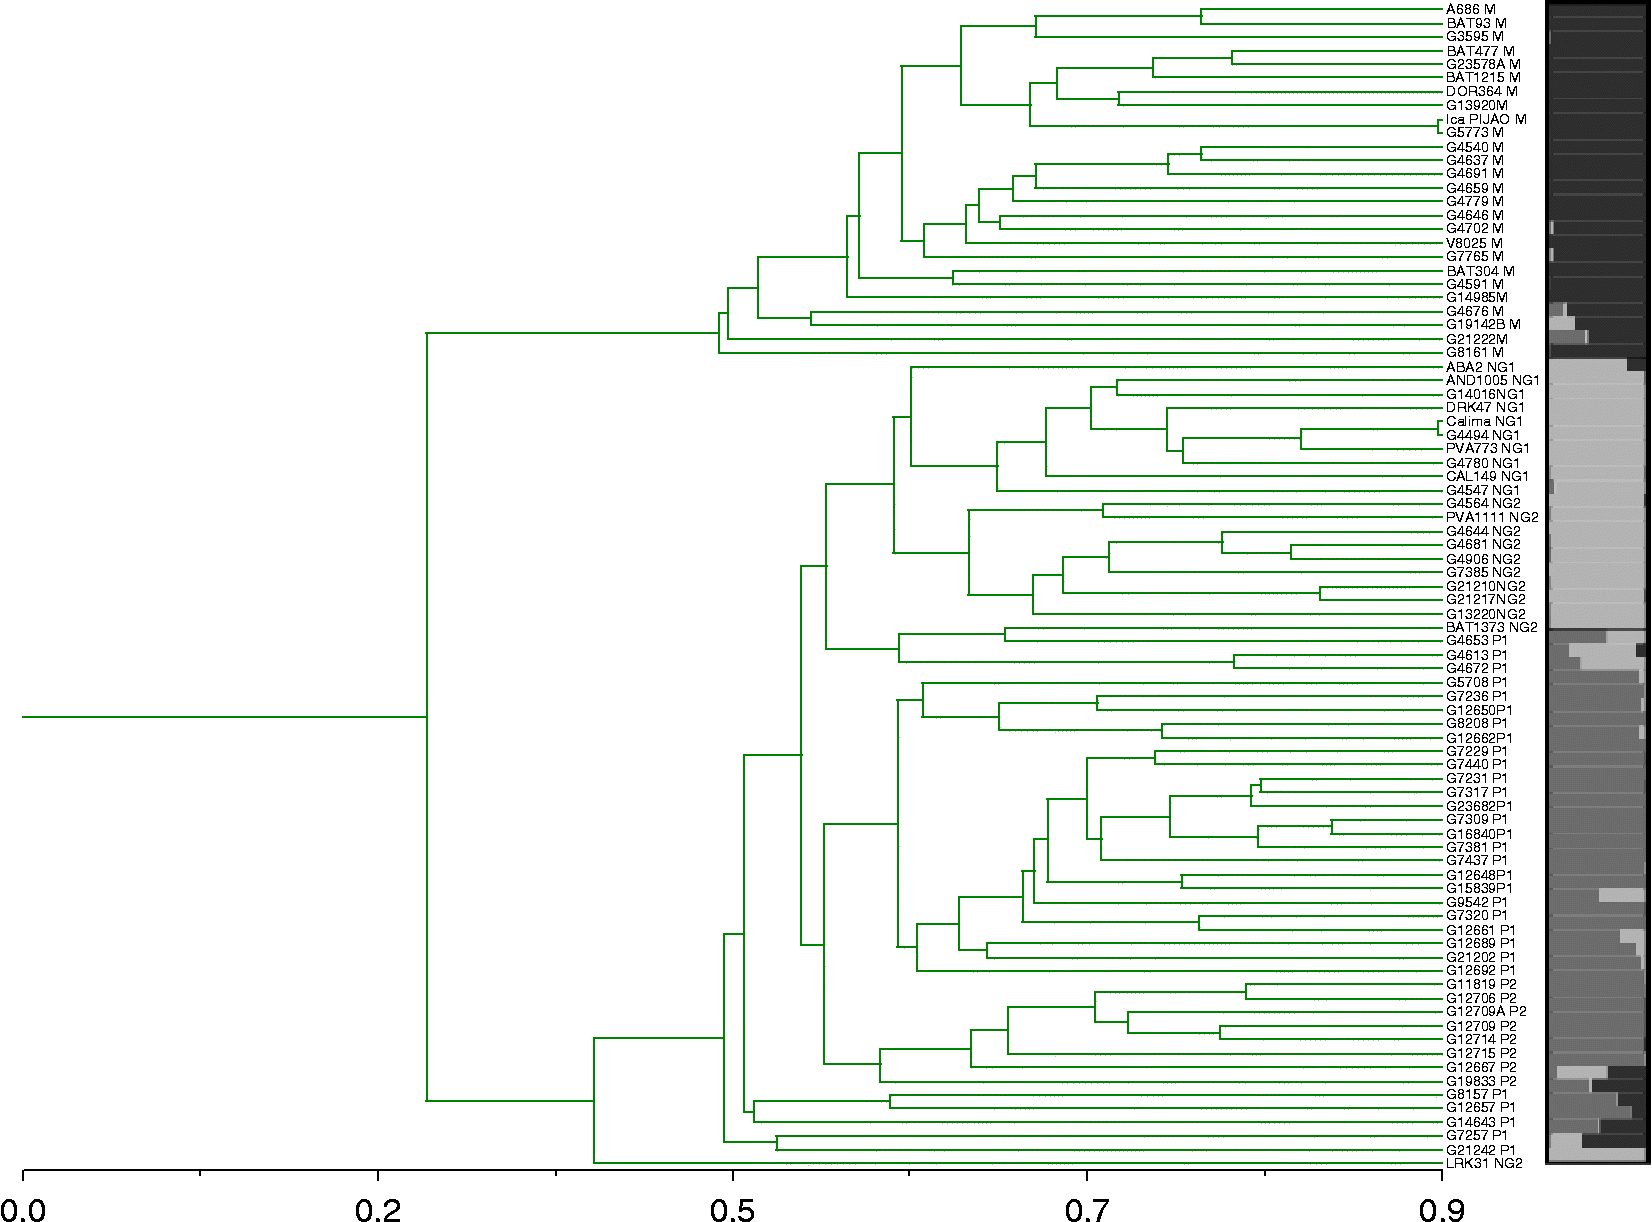
According to the results of the 52 non-overlapping SSRs and the PCoA shown in Fig. 1, the Colombian common bean landraces were classified into three principal groups. These three groups were confirmed by the dendrogram and STRUCTURE analyses at K = 3 shown in Figs 2 and 3 for both total and unlabelled versus labelled SSRs, respectively. A total of five subgroups were identified in the IML module of SAS v.9.1.3 explaining 82% of variation. The principal groups for the complete dataset included the Mesoamerican gene pool, represented by race M, and the Andean gene pool, represented by races NG and P. Both of the Andean races could be subdivided into two subgroups each (NG1, NG2, P1 and P2, respectively) resulting in a total of five subgroups, among which subgroup M contained 26 Mesoamerican accessions, while races NG and P had 21 and 38 genotypes, respectively.
Principal coordinate analysis of Colombian common bean landraces analyzed with 52 non-redundant SSRs and their division into gene pools and races. (a) Andean and Mesoamerican gene pools shown together and (b) only Andean gene pool shown alone. Identification of controls in study by initials: (G) G19833, (C) Diacol Calima, (D) DOR364 and (P) ICA Pijao. M, shown as red hearts; NG, subgroups 1 and 2 shown as blue diamonds and squares, respectively; P, subgroups 1 and 2 shown as dark green circles and isosceles triangles, respectively (A colour version of this figure can be found online at journals.cambridge.org/pgr).
Dendrogram and graph of population structure (K = 3) showing the relationship of Colombian common bean landraces. Different colours of races are shown as follows: M, top colour; NG, middle colour; and P, bottom dark colour with introgression found for certain individuals at the bottom of the dendrogram. Same colours are used for each race as indicated in Fig. 1 (A colour version of this figure can be found online at journals.cambridge.org/pgr).
Population structure of Colombian common bean landraces evaluated with 30 unlabelled SSRs and with 36 fluorescently labelled SSRs (A colour version of this figure can be found online at journals.cambridge.org/pgr).

The Mesoamerican genotypes had the characteristics typical of race M (Díaz and Blair, Reference Díaz and Blair2006), such as small (73.1%) and medium-sized (26.9%) seed; B (69.2%), S (23.1%), CH (3.9%) or CA (3.9%) phaseolin patterns and mostly type II (30.77%) and III (61.54%) growth habit with type I completely absent. There was no geographical focal point for Mesoamerican beans, as many were distributed in lower elevations sites around the country both in the northern coast (Guajira department) and mainly in the interior central and southern valleys (Departments of Antioquia, Boyaca, Cauca, Cundinamarca, Huila, Nariño, Risaralda, Tolima and Valle de Cauca).
Within the majority of Andean gene pool, we found that subgroup P1 had 30 accessions, mostly of T (40.00%) and H (36.67%) type phaseolin with a few showing introgression of S or C phaseolin. Almost 90% of the these genotypes possessed large seed size and type IV growth habit (83.33%), followed by type I (10.00%) or type III (6.67%) habits, with a total absence of type II growth habit. The accessions of this group originated mostly in the highland Departments of Antioquia, Cauca, Cundinamarca, Nariño and Boyacá, with only one genotype each from the Departments of Caldas and Huila (G7929 and G4653, respectively).
Subgroup P2, meanwhile, had eight accessions which were characterized by T (62.50%) and H (37.50%) phaseolin patterns and viny growth habits (87.50% type IV and 12.50% type III). These accessions were mainly from the Departments of Antioquia and Nariño and included G19833, which is a representative of race P (Blair et al., Reference Blair, Diaz, Hidalgo, Diaz and Duque2007). Clustering along with the subgroup were genotypes such as G12715 (Sañudo 52), G14643 (Tunia 1), G7229 (Culateno), G7381 (X15943), G7437 (Huevo de Pinché), G5708 and G7309 (both Sangretoro), and G7231 (Cargamento).
Two subgroups were also observed for race NG: with the NG1 subgroup having ten accessions, of which five were advanced lines of Andean origin developed at CIAT (ABA2, PVA 773, AND 1005, CAL 149 and DRK 47); and three were from the Departments of Antioquia or Cauca. This group was characterized by large (90%) or medium-sized (10%) seeds, T (90%) and H (10%) phaseolin patterns, and type I (60%), II (30%) and III (10%) growth habits. Also appearing in this group was Diacol Calima, a representative of race NG. Subgroup NG2 was composed of 11 genotypes, which presented Andean characteristics such as T (63.6%), CA (27.3%) and H (9.1%) phaseolin patterns, type I growth habit and large seed size. They originated from the Departments of Nariño (three), Antioquia (two), and Cundinamarca, Tolima and Valle (one accession each), while two accessions had no department ID. All the advanced lines with T phaseolin stood out for being located within race NG (both groups 1 and 2). Genotypes ABA2, PVA773, PVA1111 and LRK31 were previously classified by Voysest et al. (Reference Voysest, Valencia and Amezquita1994) within this race, although Blair et al. (Reference Blair, Diaz, Hidalgo, Diaz and Duque2007) later reported that only 75% of the advanced lines analyzed were found within this race.
Diversity between groups
Groups M and P1 presented high and similar indices of H e, number of alleles and PIC values; however, race P subgroup 1 presented higher observed heterozygosity (Table 4). Meanwhile, race M had the largest percentage of polymorphic loci (96.2% or 50 out of 52 loci). The lowest percentage of polymorphic loci was present in race P subgroup P2 (65.4%) with 18 of the 52 SSRs used monomorphic. Overall, marker PV-at001 provided high indices for all races. However, some SSRs were predominant for each given race. For example, for race P, high indices of diversity were observed for SSRs BM143, BM167 and BM156; while for race NG, GATs91, BM200 and BM141 were more highly polymorphic. For race M, the highest levels were seen for BM200 and BM187.
Genetic diversity parameters of groupings of Colombian landraces of common bean and genetic differentiation based on F ST values

N, number of landraces; P (%), percentage of polymorphic loci; N a, number of alleles; H o, observed heterozygosity; PIC, polymorphism information content; P(%), percentage polymorphism.
a Gene diversity according to Nei and Li (Reference Nei and Li1979).
Large genetic differentiation was found among the races of genotypes of Colombian origin (G ST = 0.334), with the highest effect of non-random pairing within the populations (G IS = 0.888) and very low genetic flow among populations. Among the races, the greatest genetic differentiation was found between groups M and P2 (G ST = 0.311), and the lowest between Andean groups P1 and NG2 (G ST = 0.125). Gene flow was high between those groups having low genetic differentiations with at least one individual migrating per generation. In contrast, gene flow was very low between the Andean and Mesoamerican gene pools overall.
Genetic structure was confirmed through an AMOVA with the groups established for the Colombian landraces was found to be significantly different, and most of the variation was explained by interaction between individuals within populations (data not shown).
Analysis of linkage disequilibrium
Significant LD (at P < 0.05) was found for only 7.2% of the 1378 possible pairwise combinations of 52 SSR markers used in the diversity analysis. However, when comparing pairs of markers from the same linkage group, the percentage of significant LD values was 52.2%. The range in D′ values between marker pairs ranged from 0.044 to 1.00, with an average of 0.580 and a range of r 2 between 0.000 and 0.810. LD was more highly significant for a larger number of marker comparisons in the Andean gene pool than in the Mesoamerican gene pool (Fig. 4).
Linkage disequilibrium among all pairs of 52 microsatellite loci in the (a) Andean and (b) Mesoamerican gene pools of Colombian common bean landrace (A colour version of this figure can be found online at journals.cambridge.org/pgr).

Discussion
Previous studies have reported the utility of fluorescently labelled microsatellite markers in detecting high levels of genetic diversity and well-defined population structure in common bean before both for a large set of cultivated genotypes (Blair et al., Reference Blair, Díaz, Buendia and Duque2009; Asfaw et al., Reference Asfaw, Blair and Almekinders2009; Blair et al., Reference Blair, Gonzales, Kimani and Butare2010) and for wild versus domesticated genotypes (Kwak and Gepts, Reference Kwak and Gepts2009). Advantages of microsatellite markers are self-evident in that they are highly polymorphic, co-dominant and widely distributed in the genome. This study, similar to our previous work, showed that the markers can be evaluated with various technologies giving similar results in terms of genetic differentiation (Blair et al., Reference Blair, Giraldo, Buendia, Tovar, Duque and Beebe2006, Reference Blair, Díaz, Buendia and Duque2009, Reference Blair, Gonzales, Kimani and Butare2010). An advantage of labelled microsatellites over unlabelled microsatellites was the potential for automatic detection and calling of alleles as well as the multiplexing of several markers together in a single run through the use of fluorescent panels as used here and in Blair et al. (Reference Blair, Díaz, Buendia and Duque2009). Care must be given with automated allele calling since we found that labelled SSRs were slightly higher in both observed and H e, which can indicate superior sensitivity of the ABI3730x in reading of the alleles or perhaps overcalling of distinct alleles versus those that can be distinguished manually. Silver-stained detection of unlabelled SSR alleles has been found to be highly accurate, as long as samples are run on a single gel and repeat amplification and controls are used along with several molecular weight ladders to ensure accurate allele calling. So the issues of allele calling accuracy or lack of precision in that allele calling in either system must be carefully considered by researchers in the future. Meanwhile, the issue of single base pair allele differences is found with both detection systems.
Both marker types were found to be useful for the genetic diversity analysis of the Colombian landraces validating the fluorescent microsatellite panels and silver-stained microsatellites. This study includes the highest number of microsatellite markers (66 independent runs) evaluated to date on a single sample of diversity and thus was a rich source of interpretation of marker and genotype differences. In terms of genetic diversity, our study of both types of SSR markers confirmed that the Andean genotypes of Colombian origin are highly diverse as was found by Blair et al. (Reference Blair, Diaz, Hidalgo, Diaz and Duque2007). Furthermore, the PCoA found clustering patterns that agreed with characteristics such as phaseolin, seed size and growth habit. These characteristics corresponded to races previously established by Singh et al. (Reference Singh, Gepts and Debouck1991a, Reference Singh, Gutierrez, Molina, Urrea and Geptsb).
Compared to our previous study of Colombian landraces in Blair et al. (Reference Blair, Diaz, Hidalgo, Diaz and Duque2007), here we also analyzed genotypes with Mesoamerican phaseolin patterns and found that the Mesoamerican group formed a compact cluster with characteristics of race M. The introduction of race M to Colombia may have originated from active genetic exchange through trade or hybridization with wild and weedy forms that exist in the country and may have generated genetic variability (Gepts and Bliss, Reference Gepts and Bliss1986; Beebe et al., Reference Beebe, Toro, Gonzalez, Chacón and Debouck1997). Taking into account that phaseolin B was found in Colombian genotypes of the Mesoamerican gene pool and phaseolin T was found in genotypes of the Andean pool, we may assume that the former phaseolin type is of local origin and has probably been introgressed into landraces over long periods from a wild source.
A possible hypothesis is that the Colombian genotypes inherited ancestral characteristics such as phaseolin (shared by wild and cultivated forms in the same region without being altered by domestication), which then combined with modern characteristics (modified under local selection, whether intentionally or unintentionally). Furthermore, a single genotype (G4691 or ‘Matahambre’) had the phaseolin type CH, previously found in wild beans of Colombia (Koening et al., Reference Koening, Sing and Gepts1990).
Similar results from Gepts and Bliss (Reference Gepts and Bliss1986) in their study of phaseolins of wild and cultivated common beans from Colombia suggested that domestication may also have occurred in Colombia, as well as in Mesoamerica and the southern Andes. Subsequent analysis with amplified fragment length polymorphism, α-amylase inhibitors and lectin confirmed the presence of unique alleles and atypical patterns for wild Colombian genotypes (Tohme et al., Reference Tohme, Gonzalez, Beebe and Duque1996).
In addition, several other studies have found relationships between wild and domesticated common beans (Gepts and Bliss, Reference Gepts and Bliss1986; Islam et al., Reference Islam, Basford, Redden, Gonzalez, Kroonenberg and Beebe2002) and common exchange of phaseolin alleles between gene pools (Blair et al., Reference Blair, Diaz, Hidalgo, Diaz and Duque2007, Reference Blair, Díaz, Buendia and Duque2009) from this region. For example, within each gene pool group for the Colombian landraces, we identified some genotypes with phaseolin type of the opposite gene pool. These included the Andean genotypes G19142B (Criollo), G4676 (Revoltura) and G21222 (Bola Maní Morado or Piojillo), which had B phaseolin patterns, and the Mesoamerican genotypes G14643, which had the CA phaseolin pattern.
With regards to racial identification, genotypes BAT93, BAT477, G4540, G4779, G13920, G23578A, A686, BAT1215, G3595, G4591, G4637, G14985 and V8025 clustered in the group belonging to race M, confirming the previous classification by Beebe et al. (Reference Beebe, Skroch, Tohme, Duque, Pedraza and Nienhhuis2000) and Singh et al. (Reference Singh, Gepts and Debouck1991a, Reference Singh, Gutierrez, Molina, Urrea and Geptsb). Meanwhile, genotypes G4659, G12650, G19142 and G21222, described by Beebe et al. (Reference Beebe, Skroch, Tohme, Duque, Pedraza and Nienhhuis2000) as belonging to race Guatemala, did not cluster in our figures for either geographical origin or seed size, although they all belonged to the Mesoamerican group with the exception of G12650.
Introgression and admixture were also evident in the position and Q-coefficients for several genotypes including G7257 (Boyacá 82), G8157 (Revoltura), G12657 (Cauca 35) and G21242 (DGD-1399), all of which were intermediate between the gene pools in the PCoA. These genotypes have been identified as presenting between-gene pool introgression by previous authors as well (Beebe et al., Reference Beebe, Renjifo, Gaitán-Solís, Duque and Tohme2001; Islam et al., Reference Islam, Beebe, Muñoz, Tohme, Redden and Basford2004; Blair et al., Reference Blair, Giraldo, Buendia, Tovar, Duque and Beebe2006).
The findings of introgressed materials in Colombia and that 39% of the genotypes studied presented phaseolin T strengthen the hypothesis that, in this area, the two principal gene pools of common beans came into contact, met and exchanged genes. Evidence was also present for gene flow from the southern part of the Andes, currently the countries of Argentina and Peru where CA and H phaseolin patterns are more common, respectively. In our study, the phaseolin CA was found equally in races NG and P, while phaseolin H was found almost exclusively in race P.
This study along with others showed the importance of using control genotypes for each gene pool and for the races. For example, the Andean controls Calima (G4494) and Chaucha Chuga (G19833) were found in different groups and represented races NG and P, respectively, as they had in Blair et al. (Reference Blair, Diaz, Hidalgo, Diaz and Duque2007). Dorado (DOR364) and ICA Pijao meanwhile represented the same race within the Mesoamerican gene pool and were tightly clustered with that group of landraces. This situation has been consistent for the most part in other studies by Blair et al. (Reference Blair, Díaz, Buendia and Duque2009) and Becerra et al. (Reference Becerra, Paredes, Rojo, Díaz and Blair2010) except that when larger simples are used, the race structure and position of the control genotypes can be less clear. Therefore, a larger set of control genotypes should be developed with some specificity for each regional or national collection.
In conclusions, the joint use of labelled and unlabelled molecular markers (SSRs) enabled us to verify that Colombian landraces presented a clear and well-defined genetic structure. We confirmed the existence of genotypes that agreed with the race characteristics previously reported by Singh et al. (Reference Singh, Gepts and Debouck1991a, Reference Singh, Gutierrez, Molina, Urrea and Geptsb) with type III growth habit standing out for the Mesoamerican genotypes, type I and II for race NG, and type I and IV for race P. Seed size presented the variability expected for Andean genotypes, and the pattern established was similar to that found for Andean races in Blair et al. (Reference Blair, Diaz, Hidalgo, Diaz and Duque2007). Finally, given the high diversity of phaseolin patterns among the landraces, these could represent a centre of domestication that was later influenced by beans introduced from other centres of domestication with introgression between and within the gene pools playing a significant role in landrace development.
Acknowledgements
The authors thank Claritza Muñoz (CIAT) for DNA extraction and Sharon Mitchell (Cornell) for technical assistance. We also thank Daniel Debouck of the CIAT genetic resources programme for providing germplasm and Agobardo Hoysos of the Bean Project for seed multiplication and curation. This research was supported by the Generation Challenge Programme.



