Introduction
Sex disparity is a well documented reality in India. Demographic data point out an adverse sex ratio and a strong preference for sons among Indian men and women (IIPS & ORC Macro, 2007). A rich body of literature deals with the causes and consequences of such a skewed son preference in the country (Das Gupta et al., Reference Das Gupta, Zhenghua, Bohua, Zhenming, Chung and Hwa-Ok2003; Pande & Astone, Reference Pande and Astone2007). Studies have shown that sex inequality directly translates to outcomes such as abortion, infanticide, child health care and nutrition (Arnold et al., Reference Arnold, Choe and Roy1998, Reference Arnold, Kishor and Roy2002; Mishra et al., Reference Mishra, Roy and Retherford2004). Tarozzi & Mahajan (Reference Tarozzi and Mahajan2007) pointed out that anthropometric outcomes of children are ‘affected by all of the pathways through which gender bias operates’. Moreover, anthropometric data are free from the problems of intentional misreporting and ex-post rationalization, which are major concerns in case of commonly used indicators of sex inequality based on ideal number of sons and daughters, as reported by parents (Lin & Adsera, Reference Lin and Adsera2012). However, much to the surprise of researchers, child nutrition figures for India (and other developing countries infamous for sex inequality) do not differ strikingly between boys and girls (Somerfelt & Arnold, Reference Sommerfelt and Arnold1998; Mishra et al., Reference Mishra, Lahiri and Luther1999; Arnold, Reference Arnold2001; Marcoux, Reference Marcoux2002; Mishra et al., Reference Mishra, Roy and Retherford2004). The Third National Family Health Survey (NFHS-3) report concludes that ‘…overall, girls and boys are about equally undernourished’ (IIPS & ORC Macro, 2007). Seeking to explain why evidence on female disadvantage in terms of nutritional status is inconclusive, scholars have examined child-specific household-level factors such as birth order and sex composition of older siblings.
This paper argues that beyond child-specific household-level factors, the puzzle of sex inequality needs to be understood in the context of the intersection of sexual identity with other dimensions of social identity such as religion, caste and class. To the author’s knowledge, this is the first attempt to examine sex disparity in child nutrition in India by moving out of the framework dealing with inequality along the single axis of sexual identity. The complex interactions of multiple identities have attracted scholarly attention of late, particularly within the realm of feminist studies (Collins, Reference Collins1991; Glenn, Reference Glenn1999; Whittle & Inhorn, Reference Whittle and Inhorn2001; Östlin, Reference Östlin2002; Davis, Reference Davis2008). Different axes of social power, such as gender, economic class, ethnicity and caste, are often simultaneously operative, with significant interactions among each other. Crenshaw (Reference Crenshaw1989) coined the term ‘intersectionality’ (capturing the multifaceted discriminations associated with gender and race faced by Black women) to defy the ‘single-axis framework’ that implicitly assumed all women to be White and all Blacks to be men. Sen et al. (Reference Sen, Iyer and Mukherjee2009) devised a simple and powerful methodology for quantitative analysis of the interactions of different axes of social power. Using this method, recent literature has asked important questions to analyse intersectional inequalities in health-care-seeking behaviour of individuals (Iyer et al., Reference Iyer, Sen and George2007; Sen et al., Reference Sen, Iyer and George2007, Reference Sen, Iyer and Mukherjee2009; Sen & Iyer, Reference Sen and Iyer2012).
Applying the framework of Sen et al. (Reference Sen, Iyer and Mukherjee2009), the paper asks if girls face differential treatment, and how sex disparity varies at different points of the social spectrum. For instance, does sex disparity in child nutrition operate similarly for Hindus and other religions? Within the traditional caste-based Hindu society, is there a difference in sex disparity among the poor and the non-poor? Is it the case that girls and boys belonging to certain castes do not have disparate nutritional outcomes? Do certain caste groups treat the girl child differently at different levels of household wealth?
Background
Though some of the early studies on sex inequality in India noted greater undernutrition among girls in developing countries such as India and Bangladesh (Chen et al., Reference Chen, Huq and D’Souza1981; Sen & Sengupta, Reference Sen and Sengupta1983 Abdullah & Wheeler, Reference Abdullah and Wheeler1985), most recent studies using large sample data have been inconclusive on sex bias in child nutrition (Arnold, Reference Arnold2001; Marcoux, Reference Marcoux2002; Pande, Reference Pande2003; Mishra et al., Reference Mishra, Roy and Retherford2004; Borooah, Reference Borooah2005). Mishra et al. (Reference Mishra, Roy and Retherford2004) have identified three specific reasons behind the absence of a stark sex disparity in child nutrition. First, not all girls are discriminated against. Those from households with no living son and of birth order three or more are the most vulnerable. Second, discrimination against girls when boys are in short supply and discrimination against boys when girls are in short supply offset each other to some extent. Third, some discrimination against girls (e.g. boys being exclusively breast-fed even beyond six months of age as a manifestation of greater care) work adversely for boys.
Studies that have looked at the interaction of child survival and economic status have shown little correlation between poverty and gender disparity in child health and mortality (Desai et al., Reference Desai, Rastogi and Vanneman2005). Researchers have long been pointing out that girls in poorer households face lesser discrimination than those in richer households (Miller, Reference Miller1981; Krishnaji, Reference Krishnaji1987; Muhuri & Preston, Reference Muhuri and Preston1991). Again, studies have highlighted that gender discrimination is frequently more prevalent among certain higher castes in India (Das Gupta, Reference Das Gupta1987; Anderson, Reference Anderson2003; Tarozzi & Mahajan, Reference Tarozzi and Mahajan2007). Societal norms driven by patrilineal descent often relegate women of higher castes to positions of lesser importance in family and society (Chakraborty & Kim, Reference Chakraborty and Kim2010).
Pande (Reference Pande2003), Borooah (Reference Borooah2005), Bharati et al. (Reference Bharati, Pal and Bharati2008) and Mukhopadhyay (Reference Mukhopadhyay2013) analysed the determination of child nutrition status in India. Most of these studies have found a weak link between sex and nutritional status of the child, with girls even showing better anthropometric scores than boys (Borooah, Reference Borooah2005; Mukhopadhyay, Reference Mukhopadhyay2013). Bharati et al. (Reference Bharati, Pal and Bharati2008) found that the sex difference is not very pronounced and almost disappears when the effects of age and socio-demographic variables are removed.
Sex inequality in India
The 2011 Census data report a sex ratio at birth (males per 100 females) of 106, which marks an improvement from the 2001 figure of 107. However, it also reports a child sex ratio (females per 1000 males in the age group 0–6 years) of 109, which is the lowest since independence in 1947. The corresponding figure as recorded by the 2001 Census was 108. The alarming fall in child sex ratio, in the face of stringent legislation to prevent female feticide and incentive schemes for families with the girl child, has caused much hue and cry among policymakers, demographers, social scientists and activists. The third National Family Health Survey (NFHS-3), conducted between the last two censuses, recorded a child sex ratio of 109. The NFHS-3 provided insightful and grave details regarding pregnancies for which an ultrasound test was done. All women who were pregnant at any time in the five years preceding the survey were asked whether they had undergone ultrasound testing during each pregnancy in that period and what the outcome of each such pregnancy was. The survey revealed that an ultrasound test was performed for 24% of pregnancies; 46% of such pregnancies resulted in the live birth of a male child and 39% in a female child (with the remaining 15% of pregnancies presumably ending in stillbirths or miscarriages of unspecified sex). The sex ratio of these live-born children was only 118 males per 100 females. For women with 1–3 living children at the time of pregnancy, the fewer living sons the woman had, the more likely the next birth was to be a boy. The sex ratio of the next birth was extremely low for women with two daughters and no sons (175 boys per 100 girls), women with four or more living children and one son (186), and women with three children and no sons (150). Thus the NFHS-3 clearly hinted at the use of ultrasound testing for sex determination leading to sex-selective abortions. Scholars have pointed out that selective abortion of girls in India has grown in the past two decades. While sex ratios for births after a first-born girl fell sharply, that for births after a first-born boy did not change between 1990 and 2005 (Jha et al., Reference Jha, Kesler, Kumar, Ram, Ram and Aleksandrowicz2011). The NFHS-3 also asked women (in the age range 15–49) and men (in the age range 15–54) to give a numerical response on the ideal number of children and also on the desired number of sons and daughters. One in five women and men said that they would like more sons than daughters and only 2–3% preferred more daughters to sons.
Child nutrition in India
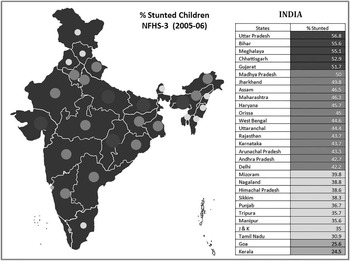
Undernutrition levels in India are among the highest in the world and even exceed the figures for some poorer and lower-growth countries of sub-Saharan Africa (UNICEF, 2013). According to the new WHO standards of 2006, 48% of Indian children below five years of age are stunted, 43% underweight and 20% wasted. For children below five years of age, 24%, 16% and 6%, respectively, suffer from severe forms of stunting, underweight and wasting (IIPS & ORC Macro, 2007). India alone shares 31% and 42% respectively of the total stunting and the total underweight burdens borne by the children of the developing world (UNICEF, 2013). The proportion of underweight and severely underweight children under three years of age decreased marginally from 43% to 40% and from 18% to 16% respectively between 1998–99 and 2005–06. This has been a cause of particular concern. As Fig. 1 shows, poor nutritional status of children is a problem throughout India, but there are considerable differences in outcomes across states.
State-wise levels of child stunting in India.

Looking at simple cross-tabulation of nutritional status of children by sex (as provided by the NFHS-3 report), it is found that nutritional outcomes are apparently similar for boys and girls. This has posed a puzzle to researchers, since other relevant indicators such as sex ratio and son preference hint at the existence of rampant sex discrimination in India. It is this finding that this paper probes deeper into, looking at the complex and simultaneous interactions of sex with caste and class in the determination of child nutritional status in India. The scheduled castes (SC) and the scheduled tribes (ST) are the two historically disadvantaged social groups of people, accorded special status by the Constitution of India. Considering the single dimension of social group affiliation, it is found that children from SC and ST households are more likely to be undernourished than those from upper caste households. The NFHS-3 report has also highlighted stark differences in nutritional outcomes of children across wealth classes. However, even among children from the wealthier households, the incidences of stunting, underweight and wasting among children are very high compared with international standards (IIPS & ORC Macro, 2007).
This paper argues that sex inequality, apparently weak for the child population as a whole, may be stark when sex is considered at its intersection with other important dimensions of social power.
Data and Methods
This paper applies the framework proposed by Sen et al. (Reference Sen, Iyer and Mukherjee2009) to analyse how sex inequalities in child nutrition intersect with religion, caste and class in India, using NFHS-3 data.
Data source
The National Family Health Surveys (NFHSs) are nationwide surveys conducted with a representative sample of households throughout the country. Until now, three such surveys have been conducted: NFHS-1 (1992–93), NFHS-2 (1998–99) and NFHS-3 (2005–06). These surveys were organized by the Ministry of Health and Family Welfare of the Government of India to develop a demographic and health database for the country. These surveys provide national and state estimates of fertility, family planning, infant and child mortality, reproductive and child health, nutrition of women and children, the quality of health and family welfare services and socioeconomic conditions. Standardized questionnaires, sample designs and field procedures are used, following the general format of Demographic and Health Surveys (DHS Programme, 2015). The urban and rural samples within each state were drawn separately using a multi-stage, systematic, stratified sampling design. The primary sampling units (villages in rural areas and wards in urban areas) were selected with probability proportional to population sampling. National- and state-level sampling weights were generated to reflect the sampling design. The NFHS-3 collected information from a nationally representative sample of 109,041 households, 124,385 women aged 15–49, and 74,369 men aged 15–54 living in all the 29 states of India. A total of 515,507 individuals who stayed in the household the night before the interview were enumerated in the 109,041 NFHS-3 sample households. Anthropometric data were collected for 46,655 children, below five years of age, who stayed in the household the night before the interview (IIPS & ORC Macro, 2007).
Methods
Sen et al. (Reference Sen, Iyer and Mukherjee2009) developed a simple and convincing quantitative method to study intersectional inequality. This method requires the creation of a set of dummy variables for each intersecting category. With two dimensions, say sexual identity and economic class (taken as a dichotomous variable, with two classes, poor and non-poor), there would be four categories in the heuristic matrix: d1=non-poor men; d2=non-poor women, d3=poor men and d4=poor women. Treating d1 (non-poor men) as the reference category, each of the dummies (d2, d3 and d4) can now be treated as a separate variable and assigned a unique identity. For example, d2=1 if non-poor and women, and 0 otherwise; d3=1 if poor and men, and 0 otherwise; d4=1 if poor and women, and 0 otherwise. Multinomial logit regressions of access to health care (categorized into continued treatment, discontinued treatment and non-treatment for long-term ailments) are then run on these dummies and other relevant control variables. The differences between the dummies are then tested statistically. An extremely useful feature of this approach is that it allows statistical testing of three types of differences. First, the significance of each dummy can be tested relative to the reference group. Second, the difference between any pair of dummies, be it at the extreme or in the middle of the social spectrum, can be tested using chi-squared tests. For instance, the significance of difference in the outcomes between non-poor women and poor men (groups with non-extreme but different positionality with respect to sex and economic class) can be tested, something that is not permissible in the standard analysis. Third, it also allows the difference in the magnitudes of different social gaps to be tested in different social settings; for example, it empowers us to ask if the sex gap among the non-poor is greater than that among the poor. It is the latter kind of enquiry that this paper pursues. The uniqueness of this approach lies in the fact that such differences can be tested without running numerous regressions with limited comparability. Moreover, the approach can be extended to study intersectionality, even with polytomous categorization of groups.
Following the Waterlow classification scheme, there are three measures of undernutrition, namely stunting or low height-for-age, underweight or low weight-for-age, and wasting or low weight-for-height. The anthropometric indicators are usually expressed in standard deviation units (z-scores) from the median of the reference population. If the z-score is below minus two standard deviations (−2SD) from the median of the reference population, the child is considered to be undernourished in that dimension. Children below minus three standard deviations (−3SD) from the median of the reference population are considered to be severely undernourished. Stunting is a cumulative or long-term indicator of nutritional deprivation from birth (or conception). It is relatively independent of current conditions, and is an indicator of permanent or chronic undernutrition. Wasting, by contrast, measures body mass in relation to body length and describes current nutritional status; it is usually taken to be an indicator of short-term or temporary undernutrition. Underweight is a comprehensive measure, capturing both long-term and short-term dimensions. While for young children, weight-for-age reflects weight-for-height, as the child grows up, it reflects height-for-age.
This paper analyses sex disparity in stunting among children below five years of age in India. Logistic regression of the indicator of long-term nutritional status (stunted or not) is done on sex of the child, religion, caste and economic class of the household and a list of covariates, drawing from the relevant literature, to see if there is evidence of sex disparity. Following the broad framework of Sen et al. (Reference Sen, Iyer and Mukherjee2009), the paper then studies if sex disparity in long-term health of a child (as reflected by stunting status) varies among religious groups. Religious groups are classified as Hindus (comprising more than 80% of the population) and ‘other’ (mainly Muslims, who comprise more than 13% of the total population). The next level of inquiry studies the intersections among three dimensions of social power, namely sex, caste and economic class, in determining child nutrition in the caste-based Hindu society. Caste is classified into four groups, i.e. SC, ST, OBC (Other Backward Caste) and upper caste Hindus; economic class is classified into two strata, i.e. poor and non-poor. (The NFHS-3 provides a household wealth index, constructed from 33 indicator variables on asset possession and housing characteristics. Households are classified into five quintiles based on the wealth index. Households from the bottom two wealth quintiles are considered poor.) Considering children from Hindu households, sex is intersected with caste and class (in the determination of stunting status of children) in separate specifications. That is, the paper asks how nutritional status of children from Hindu households varies by sex among the poor and non-poor (in an alternative specification among the caste groups). The third level of inquiry addresses the simultaneous interaction of sex, caste and economic class. Treating poor SC girls as the reference group, logit regression of nutritional status is run on covariates, now including fifteen dummies for the sex–caste–class groups of children (detailed in Table 2). Statistical testing of differences between girls and boys in each caste–class group allows sex disparity to be examined in different social settings.
Results and Discussion
Sex gap in long-term child health
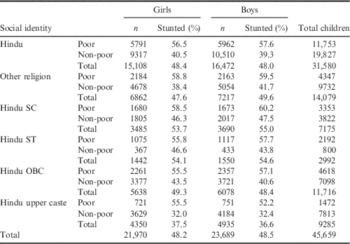
Simple cross-tabulation of data from the NFHS-3 (as reported in Table 1) reveals no apparent difference in child stunting by sex of children. In fact, compared with boys, girls have a slightly lower prevalence of stunting. Inspecting the outcomes across religious groups, no apparent sex disparity is found among Hindus. In contrast, girls from other religions show a lower incidence of stunting than boys. Considering children from the caste-based Hindu society, the incidence of stunting is found to be lower among girls from SC and ST households. However, girls have worse nutritional status than boys among OBCs and upper castes. Next, when sex inequality in stunting among Hindu children is examined at its intersection with economic class, a disadvantage for girls (by about 2%) is revealed among the non-poor. On the other hand, poor girls seem to be better nourished than poor boys for both religious groups. With further classification of Hindu children simultaneously considering their three separate identities, namely sex, economic class and caste, there are sixteen groups of children. Table 1 provides the figures on child stunting among these groups. Though sex disparity among the different caste–class groups needs to be rigorously tested (using econometric techniques that allow control of other relevant covariates), simple cross-tabulation of data shows an interesting pattern of sex disparity across social groups. Among children from poor households, girls from all caste groups (apart from upper caste Hindus) have lower incidences of stunting than boys. The relative disadvantage of girls versus boys is statistically non-significant, even among poor upper caste Hindus (see below). This relative nutritional advantage is retained by girls only within the scheduled castes when non-poor children are considered. The apparent evidence of sex disparity among non-poor ST and OBC households (in contrast to their poor counterparts) is absent when non-poor upper caste Hindu households are considered.
Prevalence of stunting among children aged 0–5 years in different social settings in India

Source: author’s calculation from NFHS-3 data (2005–06).
Note: The percentage of stunted children has been calculated using sample weights.
Covariates of child stunting
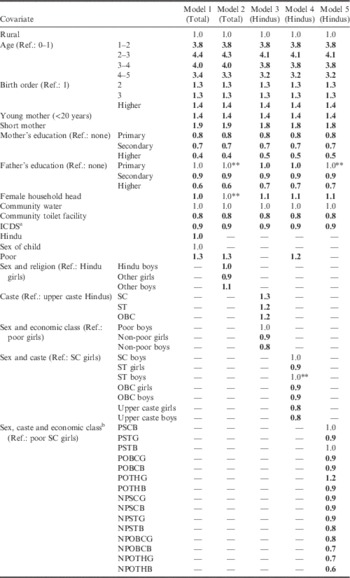
A rich volume of literature in development economics deals with the determination of child nutritional status, but this paper adopts the category-based approach, as defined by Borooah (Reference Borooah2005), using logistic regression to study the covariates of child stunting. An odds ratio exceeding one suggests a greater likelihood of child stunting as compared with the reference category. Table 2 shows the results of the logit regression of stunting status (height-for-age z-score below −2 or not) on the covariates (including child-specific, household-level and environmental factors) commonly studied in the literature. It is found that children of all age groups are more likely to be stunted than the youngest ones; that is, those in the first year of life. However, chi-squared tests show that children in the age group 2–3 years are more likely to be stunted than those in the other age groups. Long-term health status consistently improves once children pass their third birthdays. Jayachandran and Pande (Reference Jayachandran and Pande2013) classified children into three birth-order categories (first-born, second-born and those of third or higher birth order) and showed that the second and third categories have significantly lower height-for-age scores compared with the first. Those born to mothers who are young or short (indicating poor health) are more likely to be stunted. The likelihood of child stunting is significantly lower at all levels of parental education compared with no parental education. Moreover, chi-squared tests show that long-term child health consistently improves as parents move to higher levels of education. Children from households with female heads are more likely to be stunted than those from male-headed households. The likelihood of stunting is greater among those from poor (as compared with non-poor) and non-Hindu (as compared with Hindu) households. Significantly better long-term health status of children is shown to be obtained from better community infrastructure, defined in terms of toilet facilities (Spears, Reference Spears2013). However, the availability of piped water in the community emerges to be non-significant (except in one specification, where it is marginally significant). This could be because of the general low availability of the facility in rural India. The existence of an ICDS (Integrated Child Development Service) centre in the community reduces the likelihood of child stunting.
The intersection of sex with religion, caste and economic class in the determination of child stunting in India
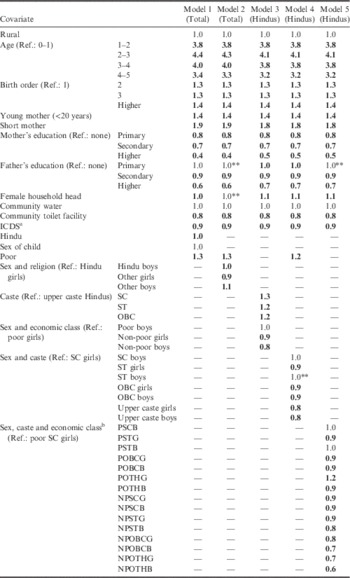
a ICDS: Integrated Child Development Service.
b Poor SC boys (PSCB), poor ST girls (PSTG), poor ST boys (PSTB), poor OBC girls (POBCG), poor OBC boys (POBCB), poor upper caste girls (POTHG), poor upper caste boys (POTHB), non-poor SC girls (NPSCG), non-poor SC boys (NPSCB), non-poor ST girls (NPSTG), non-poor ST boys (NPSTB), non-poor OBC girls (NPOBCG), non-poor OBC boys (NPOBCB), non-poor upper caste girls (NPOTHG) and non-poor upper caste boys (NPOTHB).
Source: author’s calculation (logit regression) from NFHS-3 data (2005–06).
**p<0.05; bold numbers, p<0.01.
Statistical significance of the sex gap in different social settings
The study used five models (reported in Table 2) to analyse the intersection among sex, class and caste in the determination of child nutrition. Model 1 includes sex of child, household economic status (poor or non-poor) and religion as separate covariates. Sex of the child appears to be a statistically non-significant covariate of stunting status. In order to probe deeper into this inconclusive result on sex disparity in child nutrition, the intersection of sex and religion is considered in Model 2. Treating Hindu girls as the reference group, Hindu boys and other girls are significantly less (whereas other boys are significantly more) likely to be stunted than Hindu girls. Statistical testing shows that among ‘other’ religions, boys are significantly more likely to be stunted. With evidence of sex disparity among Hindus, the paper now focuses on the set of Hindu children in the remaining models. Model 3 examines the intersection of sex inequality and economic class among Hindus. It finds that while poor girls and poor boys are equally likely to be stunted, sex disparity in stunting status is statistically significant among the non-poor. Model 4 inspects the interaction of social group affiliation (SC, ST, OBC and upper caste Hindus) and sex inequality in stunting status among Hindu children, showing an interesting pattern. While sex disparity is non-significant among SCs, ST girls have a relative advantage over ST boys in terms of stunting status. Girls are significantly more likely to be stunted among OBCs and upper caste Hindus.
The fifth and final model considers the simultaneous interaction of caste, class and sex in the determination of the long-term health status of children. No significant sex disparity in child stunting is found among poor backward caste households. Poor tribal girls are in fact significantly less likely to be stunted than their male counterparts. Girls from upper caste Hindu households are significantly more likely to be stunted than boys, irrespective of economic status. In contrast, the probability of stunting is significantly lower for girls from SC households, both poor and non-poor. However, sex disparity in child stunting operates differently by economic status for ST and OBC households. While poor ST girls are significantly better nourished than poor ST boys, non-poor ST boys are significantly better nourished than non-poor ST girls. Again, while girls and boys are equally likely to be stunted in poor OBC households, there is evidence of significant sex inequality in child stunting in non-poor OBC households.
Importance of the intersectional approach as compared with the overall analysis
Although sex appears to be a non-significant covariate in the determination of the nutritional status of children when the total population is considered, interesting patterns of sex inequality are revealed when sub-groups of the population are considered, classified according to other consequential identities such as religion, economic status and caste affiliation. Disaggregating by religion, the disadvantage faced by girls in terms of nutritional status is found to be restricted to Hindu households. Girls from non-Hindu households, both poor and non-poor, are in contrast significantly more likely to be better nourished than boys. Chakraborty and Kim (Reference Chakraborty and Kim2010) found that in India Hindus historically had a lower sex ratio than Muslims. This study found that within Hindus, sex disparity is significant among the non-poor and not so among the poor. This is consistent with previous studies dealing with discrimination against girls at the household level (Miller, Reference Miller1981; Krishnaji, Reference Krishnaji1987). Sex inequality in child health among the different castes of the Hindu society is found to be significant only among the OBCs and other upper castes. There is no evidence of sex inequality in child nutrition among the two historically backward caste groups, SCs and STs. Studies have pointed out that throughout India the higher religious or land-owning castes historically possessed the highest sex ratios, whereas the lower artisan and menial service castes had the lowest sex ratios, sex ratio being defined as males per 100 females. Women’s autonomy was also significantly greater among the lower castes in India. Women from higher castes were not allowed to work outside of the home, to initiate divorce or to take independent decisions regarding their sexual and social behaviour (Mandelbaum, Reference Mandelbaum1970; Chakraborty, 2008). This study finds that the pattern of sex inequality across castes does not change with the level of household wealth among SC and upper caste Hindus. The advantage that ST girls enjoy in poor households is reversed in non-poor households of the same caste. Some recent studies have shown that families of lower castes with high economic resources sometimes imitate the social behaviours of non-poor upper castes, particularly with respect to attitude towards girls (Agnihotri, Reference Agnihotri2000; Gaudin, Reference Gaudin2011; Lin & Adsera, Reference Lin and Adsera2012).
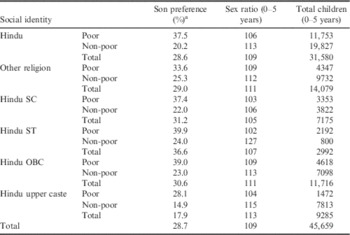
It would be contextual to mention here that the pattern of sex inequality across caste–class groups is broadly similar for the indicators of child health (stunting) and child sex ratio, with the non-poor and higher castes typically displaying greater bias in favour of the male child. The attitude towards girls (as reflected by both child sex ratio and child stunting) in ST families seems to differ starkly by economic status. Child sex ratio (males per 100 females) is highest among non-poor STs (127) in all social groups in India. However, the same pattern is not revealed from data on son preference (Table 3). Non-poor and lower caste men and women systematically report a stronger preference for sons. This reinforces the common understanding that using indicators of gender bias, based on reported preference for sons, is ridden with problems of misreporting and ex-post rationalization.
Son preference and sex ratio in different social settings in India

a Defined as the percentage of mothers (of children in the age group 0–5 years) desiring more sons than daughters.
Source: author’s calculation from NFHS-3 data (2005–06).
Note: son preference and sex ratio (males per 100 females) have been calculated using sample weights.
Conclusion
The lack of significance of sex in the determination of nutritional status of children in India, as revealed from the analysis of data from the entire population, is misleading and perplexing. Given that nutritional status of children is affected by all channels through which gender bias operates, scholars have sought to explain its inconclusive evidence. Studies have so far concentrated on child-specific household-level factors such as birth order and sex composition of surviving older siblings. This study points out that sex inequality needs to be examined in the context of its intersection with other consequential social identities such as religious membership, economic status and caste group affiliation. The analysis reveals that sex disparity in child stunting is prevalent, particularly among upper caste Hindus. While girls and boys from backward castes do not have disparate nutritional status, the advantage that poor ST girls enjoy is reversed with improvement in wealth status. It also emerges from the analysis that commonly used indicators of gender bias based on reported son preference may not move in tandem with other indicators. It might be more meaningful to examine sex disparity in anthropometric measures (that are objective outcome indicators free from the problems of misreporting and ex-post rationalization) in different social settings.
This study suggests that policymakers need to be aware of the differential way in which gender bias operates in different sub-groups of the population, classified according to religion, caste and economic class. Sex inequality deserves attention in spite of the overall non-significance of the child’s sex as a covariate of nutritional status. Moreover, children in different social settings need customized policy attention instead of a one-size-fits-all approach. For instance, non-poor ST girls deserve special attention, though they are not victims of wealth-related disadvantage. Again, though non-poor upper caste Hindu girls have better nutritional status than girls from other social settings, their situation deserves the attention of policymakers, given the bias that operates in favour of non-poor upper caste Hindu boys. However, commenting on the policy significance of inequality decompositions (where interpersonal or total inequality is additively derived from ‘between-group’ and ‘within-group’ inequalities), Kanbur (Reference Kanbur2006) observed that it would be too simplistic to set a low policy priority on group inequality whenever the contribution of the ‘between-group’ component is low. On a similar cautionary note, it is observed that this analysis does not lead to the conclusion that caste and class inequalities should receive lesser policy focus than sex inequalities. Irrespective of the significance of sex, boys from economically disadvantaged groups (among all religions and castes) have extremely high levels of undernutrition and their plight is in no way less objectionable from the policy perspective. Indeed, any difference in well-being that is attributable to religion, caste, class and sex must be normatively unacceptable, irrespective of its relative magnitude.
Acknowledgments
The author is extremely indebted to Achin Chakraborty, Director and Professor of Economics, Institute of Development Studies Kolkata (IDSK), India, for his insightful comments and suggestions on the paper. Thanks also go to Abir Sanyal for his help in preparing the map, and to an anonymous reviewer, whose suggestions have been instrumental in revising the paper.