I. INTRODUCTION
The two most important factors in the successful commercial development of photovoltaic (PV) technologies are the achieved solar cell device efficiency (on laboratory and large scale) and the costs per power unit in an industrial mass production setting. By these measures, various thin-film PV technologies already successfully compete with the current state-of-the-art Si-wafer-based solar cells. Solar cells based on the Cu-chalcopyrite alloy system [Cu(In1−XGaX)(SYSe1-Y)2] have reached efficiencies in excess of 20%Reference Repins, Contreras, Egaas, DeHart, Scharf, Perkins, To and Noufi1, Reference Jackson, Hariskos, Lotter, Paetel, Wuerz, Menner, Wischmann and Powalla2 on a laboratory scale, while for CdTe-based thin-film devices (record efficiencies around 17%Reference Wu, Keane, Dhere, Dehart, Albin, Duda, Gessert, Asher, Levi, Sheldon and McNelis3, 4) industrial large-scale manufacturing costs below 0.75 US$/Wp (Watt-peak)4 are reported. Thus thin-film PV devices are able to convert sunlight into electrical energy at the same (and potentially even higher) performance level as polycrystalline Si-wafer-based devicesReference Green, Emery, Hishikawa, Warta and Dunlop5 at potentially lower production costs. Due to the limited availability of some elements in Cu(In1−XGaX)(SYSe1-Y)2-based absorbers, concern exists that high material expenses could jeopardize the promise of lower industrial-scale production costs for this thin-film PV technology. Cu2ZnSn(S,Se)4 kesterites composed of earth-abundant elements have thus recently become the focus of significant research efforts. They not only represent a complex semiconductor materials class that, through deliberate compositional variation, allows access to a vast region of parameter space, but have also shown great promise as an alternative material system for thin-film solar cell absorbersReference Friedlmeier, Dittrich and Schock6–Reference Barkhouse, Gunawan, Gokmen, Todorov and Mitzi13—solar cell efficiencies of up to 10.1%Reference Barkhouse, Gunawan, Gokmen, Todorov and Mitzi13 have already been reported. From both perspectives (efficiency and cost), a detailed insight into the chemical and electronic structure of kesterites is necessary to rapidly reach the next level of solar cell performance. To date, various important aspects of the Cu2ZnSn(S,Se)4 materials system have only been thoroughly investigated in theoretical studies,Reference Chen, Gong, Walsh and Wei14–Reference Chen, Walsh, Yang, Gong, Sun, Yang, Chu and Wei18 while detailed experimental analyses (especially of kesterite thin films as used in solar cells) are still in their early stages. One reason for this deficit is, presumably, the complex (structural) phase diagram of the Cu-Zn-Sn-S-Se systemReference Moh19, Reference Olekseyuk, Dudchak and Piskach20 and the related problem of depositing high-quality material free of impurity and/or mixed crystal phases. This also explains why most of the characterization efforts so far have focused on x-ray and neutron diffractionReference Schorr21, Reference Katagiri, Ishigaki, Ishida and Saito22 and Raman spectroscopyReference Fernandes, Salomé and da Cunha23, Reference Fontané, Calvo-Barrio, Izquierdo-Roca, Saucedo, Pérez-Rodriguez, Morante, Berg, Dale and Siebentritt24 measurements to distinguish secondary phases from the desired Cu2ZnSn(S,Se)4 phase.
The expansion of the materials research characterization portfolio to techniques that study the electronic and chemical structure can significantly aid the development of kesterites into a material class suitable for use in high-efficiency solar cell devices (a comprehensive overview of many different characterization techniques used in thin-film photovoltaic research can be found in Ref. Reference Abou-Ras, Kirchartz and Rau25). It is the purpose of the present paper to demonstrate the power of combining different soft x-ray spectroscopies to illuminate the electronic and chemical properties of Cu2ZnSnS4 (CZTS) thin-film solar cell absorbers from a variety of different perspectives. In particular, x-ray absorption spectroscopy (XAS) is used to identify impurity phases,Reference Bär, Schubert, Wilks, Marsen, Zhang, Blum, Krause, Yang, Unold, Weinhardt, Heske, Schock, Bell, Shahedipour-Sandvik, Jones, Schaadt, Simpkins and Contreras26 x-ray emission spectroscopy (XES) is used to reveal the electronic structure of CZTS thin films,Reference Bär, Schubert, Marsen, Schorr, Wilks, Weinhardt, Pookpanratana, Blum, Krause, Zhang, Yang, Unold, Heske and Schock27 and surface-sensitive x-ray photoelectron (XPS)/x-ray-excited Auger electron (XAES) spectroscopy sheds light on the native oxidation of CZTS and its surface structure.Reference Bär, Schubert, Marsen, Krause, Pookpanratana, Unold, Weinhardt, Heske and Schock28
II. EXPERIMENTAL
The investigated polycrystalline CZTS thin films of different bulk compositions were deposited at the Helmholtz-Zentrum Berlin für Materialien und Energie GmbH (HZB) on molybdenum-coated soda lime glass (substrate temperature 550 °C) using thermal coevaporation of sulfur, copper, tin, and zinc sulfide source materials. As reference samples, commercially available powders (Alfa Aesar, purity >99%) of the respective binaries (Cu2S, ZnS, and SnS2) were investigated.
The chemical bulk composition was determined by energy-dispersive x-ray spectroscopy (EDS) using a LEO440 scanning electron microscope at the HZB. The XES and XAS measurements were conducted at Beamline 8.0.1 of the Advanced Light Source (ALS) using the soft x-ray fluorescence (SXF) endstation.Reference Jia, Callcott, Yurkas, Ellis, Himpsel, Samant, Stoehr, Ederer, Carlisle, Hudson, Terminello, Shuh and Perera29 The XPS/XAES measurements were performed at University of Nevada, Las Vegas (UNLV) using Mg K α excitation and a Specs PHOIBOS 150 MCD electron analyzer.
More details about sample preparation, measurement setup, and data evaluation can be found in Refs. Reference Bär, Schubert, Wilks, Marsen, Zhang, Blum, Krause, Yang, Unold, Weinhardt, Heske, Schock, Bell, Shahedipour-Sandvik, Jones, Schaadt, Simpkins and Contreras26–Reference Bär, Schubert, Marsen, Krause, Pookpanratana, Unold, Weinhardt, Heske and Schock28,Reference Schubert, Marsen, Cinque, Unold, Klenk, Schorr and Schock30.
III. RESULTS AND DISCUSSION
A. Secondary impurity phases
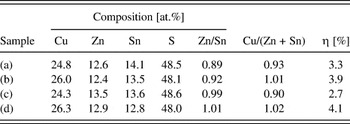
We first begin with a discussion and spectroscopic investigation of (possible) impurity phases in CZTS. For inducing the formation of such secondary phases, a series of CZTS thin-film samples was produced in which the bulk composition was deliberately varied in a range relevant for solar cell devices. Table I summarizes the bulk composition of the investigated samples as revealed by EDS. The most extreme deviation from the nominal Cu:Zn:Sn:S = 2:1:1:4 (i.e., 25:12.5:12.5:50 at.%) composition can be found for sample (a), while sample (d) is almost stoichiometric. Solar cell devices based on the CZTS absorber material represented by samples (a)—(d) result in efficiencies between 2.7 and 4.1%.Reference Bär, Schubert, Wilks, Marsen, Zhang, Blum, Krause, Yang, Unold, Weinhardt, Heske, Schock, Bell, Shahedipour-Sandvik, Jones, Schaadt, Simpkins and Contreras26
Composition of the investigated CZTS thin-film samples as derived by EDS (experimental uncertainty: ± 1.5%) and power conversion efficiencies (η, measured under standard test conditions: 25 °C, AM 1.5 g, 1000 W/m2) of corresponding thin-film solar cell devices.Reference Bär, Schubert, Wilks, Marsen, Zhang, Blum, Krause, Yang, Unold, Weinhardt, Heske, Schock, Bell, Shahedipour-Sandvik, Jones, Schaadt, Simpkins and Contreras26

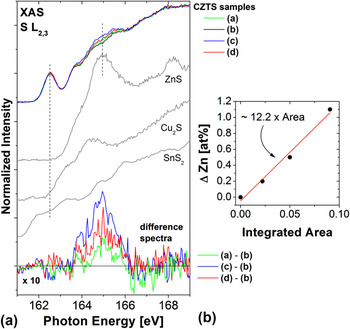
ZnS is expected to be one of the major secondary impurity phases in CZTS.Reference Moh19, Reference Olekseyuk, Dudchak and Piskach20 Due to a very similar lattice constant as that of kesterite CZTS, the two cannot be distinguished by x-ray diffraction.Reference Fontané, Calvo-Barrio, Izquierdo-Roca, Saucedo, Pérez-Rodriguez, Morante, Berg, Dale and Siebentritt24 In contrast, S L2,3 XAS measurements are indeed very sensitive to relative changes in the amount of S-Zn bonds in the CZTS material. In Fig. 1(a), the S L2,3 absorption spectra (recorded in partial fluorescence modeReference Bär, Schubert, Wilks, Marsen, Zhang, Blum, Krause, Yang, Unold, Weinhardt, Heske, Schock, Bell, Shahedipour-Sandvik, Jones, Schaadt, Simpkins and Contreras26) of the CZTS thin-film samples (a)—(d) are compared with reference spectra of the binary compounds Cu2S, ZnS, and SnS2 (this comparison is motivated by the approach to consider CZTS as aquasi ternary Cu2S-ZnS-SnS2 material systemReference Olekseyuk, Dudchak and Piskach20).
(a) S L2,3 XAS spectra of the CZTS/Mo samples (a)—(d), compared with the absorption spectra of binary compound powder references: Cu2S, ZnS, and SnS2. At the bottom, the 10-fold enlarged difference spectra are presented. (b) Change of the absolute amount of Zn in the samples [relative to the content in sample (b)] versus the area of the difference spectra (between 164 and 166 eV) shown in (a). The fit of the linear relation is also shown. (Data taken from Ref. Reference Bär, Schubert, Wilks, Marsen, Zhang, Blum, Krause, Yang, Unold, Weinhardt, Heske, Schock, Bell, Shahedipour-Sandvik, Jones, Schaadt, Simpkins and Contreras26.)

At first sight, all CZTS spectra look very similar. The prominent contribution to the CZTS S L2,3 absorption at 162.5 eV can be attributed to hybridized antibonding Sn 5s—S 3p states which dominate the bottom of the CZTS conduction band (see discussion below and Ref. Reference Bär, Schubert, Marsen, Schorr, Wilks, Weinhardt, Pookpanratana, Blum, Krause, Zhang, Yang, Unold, Heske and Schock27). Close inspection of the S L2,3 XAS spectra reveals that they deviate in the range between 164 and 166 eV. The prominent absorption features of the ZnS and Cu2S reference spectra in that energy range suggest that a varying contribution of S-Zn and/or S-Cu bonds could explain the observed intensity modulation. To analyze this in more detail, respective difference spectra are shown (10-fold enlarged) in the lower part of Fig. 1(a). The most prominent feature of all difference spectra is a broad peak centered at 165 eV that increases in intensity in the following order: (a)-(b) → (c)-(b) → (d)-(b). It energetically coincides with the most intense absorption feature of the ZnS reference spectrum, and so we attribute it to an increasing prevalence of S-Zn bonds. To verify this interpretation, the areas below the difference spectra were quantified via integration between 164 and 166 eV. Taking the absolute Zn content of sample (b) (12.4 at.%, see EDS data in Table I) as a point of reference, one can compute the absolute difference in the amount of Zn (ΔZn) in the CZTS samples (a), (c), (d) as 0.2, 1.1, and 0.5 at.%, respectively. The resulting plot of ΔZn over the quantified area of the difference spectra in Fig. 1(b) shows a linear correlation, confirming the origin of the observed intensity variation as indicative of differences in the quantity of S-Zn bonds. Hence, S L2,3 XAS measurements are shown to provide a very sensitive probe for the amount of S-Zn bonds in CZTS samples. Furthermore, as demonstrated in Ref. Reference Bär, Schubert, Wilks, Marsen, Zhang, Blum, Krause, Yang, Unold, Weinhardt, Heske, Schock, Bell, Shahedipour-Sandvik, Jones, Schaadt, Simpkins and Contreras26, XAS is also a very powerful probe for distinguishing between Cu(I) and Cu(II) species allowing for an identification of CuS phases on/within the CZTS material.
B. Electronic structure
For this study, we were able to synthesize CZTS powders and thin-film samples and to demonstrate that they consist of single-phase stoichiometric Cu2ZnSnS4 material (i.e., no impurity phases could be detected), crystallized in the kesterite structureReference Bär, Schubert, Marsen, Schorr, Wilks, Weinhardt, Pookpanratana, Blum, Krause, Zhang, Yang, Unold, Heske and Schock27, Reference Jia, Callcott, Yurkas, Ellis, Himpsel, Samant, Stoehr, Ederer, Carlisle, Hudson, Terminello, Shuh and Perera29, Reference Schorr, Weber, Honkimäki and Schock31 [note that the CZTS thin films were subjected to a KCN etch (1.5 M aqueous solution, 3 min) to ensure the removal of any Cu2-xS phases from the surface]. Since the four nearest neighbors of a S atom in a CZTS kesterite are always two Cu, one Zn, and one Sn atom,Reference Chen, Gong, Walsh and Wei14, Reference Paier, Asahi, Nagoya and Kresse15 and because of the expected hybridization of S 3p states with Zn, Sn, and Cu states,Reference Meisel, Leonhardt and Szargan32 we have used S L2,3 XES and XAS to study the electronic structure of these well-defined CZTS materials. The experimentally derived electronic structure [valence (→ XES) and conduction (→ XAS) bands] will be elucidated by comparison with the calculated density of states (DOS) taken from Ref. Reference Paier, Asahi, Nagoya and Kresse15.
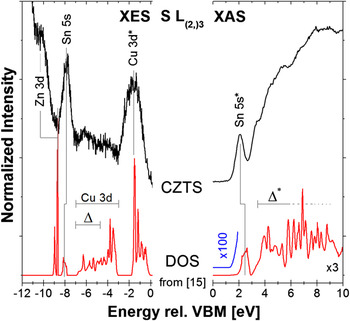
In Fig. 2, a direct comparison of results from first-principles DOS calculationsReference Paier, Asahi, Nagoya and Kresse15 (red) with experimental S L3 XES (left, black) and S L2,3 XAS (right, black) spectra of the CZTS thin-film sample is shown. Note that only the valence band region of the XES spectrum is depicted. To separate the L2 and L3 contributions to the XES spectra, we have used resonant excitation just below the S L2 edge, and thus only the L3 contribution is shown. The presented CZTS DOS was provided by Paier et al.Reference Paier, Asahi, Nagoya and Kresse15 and is the result of quasiparticle calculationsReference Shishkin and Kresse33–Reference Fuchs, Furthmüller, Bechstedt, Shishkin and Kresse35 applying the G0W0 method.Reference Hedin36 To enable a direct comparison between experiment and theory, the XES/XAS measurements are shown on the same energy scale as the DOS, i.e., the energy is given relative to the valence band maximum (VBM). Note that the calculations provide a ground-state description, while the correct description of experimental spectra would need to include a (dipole) operator describing the interaction of the electrons with the photon field (i.e., the experimental spectra are governed by transition matrix elements and dipole selection rules involving initial and final states). In consequence, the band energies (relative to VBM) of theory and experiment can be reliably compared, although the respective intensities may not be directly comparable.
Due to the well-known shortcomings of density functional theory-based calculations (in particular the difficulties to compute the correct binding energy of localized states such as Zn 3d), it is to be expected that even the G0W0-corrected energies might deviate somewhat from the experimental spectra. With this in mind, comparison of the S L3 XES spectrum of the CZTS thin-film sample with the calculated DOS allows us to ascribe the emission features at approx. 2, 8, and 10 eV below VBM to hybridized antibonding Cu 3d—S 3p (“Cu 3d*”), bonding Sn 5s—S 3p (“Sn 5s”), and Zn 3d-derived states, respectively.Reference Bär, Schubert, Marsen, Schorr, Wilks, Weinhardt, Pookpanratana, Blum, Krause, Zhang, Yang, Unold, Heske and Schock27 The DOS further suggest an additional broad band between −6 and −3 eV, consisting of hybridized bonding Cu 3d—S 3p (“Cu 3d”) states and a linear combination of Cu 4s, Zn 4s, and Sn 5p states hybridized with bonding S 3p states (“Δ”).Reference Chen, Gong, Walsh and Wei14, Reference Paier, Asahi, Nagoya and Kresse15 In contrast, the CZTS S L3 XES spectrum shows only weak emission intensity in this energy window, which we attribute to small matrix elements for the corresponding transitions. More generally, note that a significant fraction of the states in this region have p-symmetry, for which transitions into S 2p core holes are dipole-forbidden, and which are thus only observable in the corresponding spectra due to some hybridization with states of s- and/or d-symmetry.
Having discussed the valence band structure, we now focus on the conduction band. The DOS calculations suggest that the conduction band exhibits a well-defined narrow band that is significantly separated from the rest of the conduction band. Closer inspection of the region of the DOS conduction band onset [e.g., multiplying by a factor of 100, yielding the blue line in Fig. 2], shows good agreement between the position of the conduction band minimum for the theoretical and experimental data, and therefore good agreement between the theoretically (1.5 eVReference Chen, Gong, Walsh and Wei14, Reference Paier, Asahi, Nagoya and Kresse15) and experimentally (1.5 ± 0.3 eV)Reference Bär, Schubert, Marsen, Schorr, Wilks, Weinhardt, Pookpanratana, Blum, Krause, Zhang, Yang, Unold, Heske and Schock27 derived band gap energies. Note that both values also agree well with band gap values determined by ultraviolet-visible (UV-Vis) spectroscopy.Reference Tanaka, Nagatomo, Kawasaki, Nishio, Guo, Wakahara, Yoshida and Ogawa7 The comparison between calculated DOS and experimental XAS CZTS data reveals that the states at the bottom of the conduction band arise from hybridized antibonding Sn 5s—S 3p states (“Sn 5s*”).Reference Bär, Schubert, Marsen, Schorr, Wilks, Weinhardt, Pookpanratana, Blum, Krause, Zhang, Yang, Unold, Heske and Schock27 The higher states of the conduction band can be attributed to a linear combination of Cu 4s, Zn 4s, and Sn 5p orbitals, hybridized with antibonding S 3p states (“Δ*”).Reference Bär, Schubert, Marsen, Schorr, Wilks, Weinhardt, Pookpanratana, Blum, Krause, Zhang, Yang, Unold, Heske and Schock27
Calculated CZTS DOS from Ref. Reference Paier, Asahi, Nagoya and Kresse15, compared with experimental valence band and conduction band data: S L3 XES (left) and S L2,3 XAS (right) spectra, respectively. The assignment of the spectral features according to the calculated DOS is indicated. Note that the calculated conduction band DOS and its onset are magnified by a factor of three and one hundred, respectively, to allow easier comparison with the experimental data. (XES & XAS data taken from Ref. Reference Bär, Schubert, Marsen, Schorr, Wilks, Weinhardt, Pookpanratana, Blum, Krause, Zhang, Yang, Unold, Heske and Schock27.)

Altogether, we find a good agreement between experimental S L(2,)3 XES and XAS data and calculated G0W0 DOS. Hence the previously published band structure by Paier et al.Reference Paier, Asahi, Nagoya and Kresse15 is supported by the here-presented S L(2,)3 XES and XAS measurements, and allows us to gain deeper insights into the origin of the various spectral features of the experimental results.
C. Native oxidation
To optimize real-world thin-film solar cells (or any other electronic device), it is important to not only rely on fundamental studies of well-defined, academic model systems (e.g., single crystals or epitaxial layers), but rather to study the relevant materials as they were (empirically) optimized for the device. We have therefore studied the surface and bulk structure of a CZTS thin film directly taken from HZB’s manufacturing setup. The sample was stored in an N2-purged desiccator between preparation/EDS analysis at HZB and photoemission characterization at UNLV, but, due to handling of other samples, repeatedly exposed to ambient air in the four months of storage. Thus, the sample is considered “air-exposed” for all practical purposes. After recording initial (“as-received”) surface-sensitive XPS/XAES measurements, the sample surface was thus cleaned by subsequent Ar+ treatment steps using low ion energies. Such treatment steps result in a very mild surface cleaning: For Cu(In1-XGaX)(SYSe1-Y)2, for example, we found that using 50 eV Ar+ ions does not affect the surface structure even after an extended treatment time.Reference Bär, Nishiwaki, Weinhardt, Pookpanratana, Fuchs, Blum, Yang, Denlinger, Shafarman and Heske37 In contrast, at 500 eV, Ar+ treatment times exceeding 30 min lead to clear spectral evidence for the sputter-induced formation of metallic species.Reference Morkel, Weinhardt, Lohmüller, Heske, Umbach, Riedl, Zweigart and Karg38, Reference Weinhardt, Morkel, Gleim, Zweigart, Karg, Heske and Umbach39 In the following, the sample will be identified as (i) for the as-received state, and (ii)—(iv) after Ar+ -treatment with the following treatment time/ion energy: (ii) 5 min/50 eV, (iii) 5 min/100 eV, and (iv) 10 min/100 eV. Note that, using the latter parameters, no artificial alteration of the initial CZTS surface structure was observed.Reference Bär, Schubert, Marsen, Krause, Pookpanratana, Unold, Weinhardt, Heske and Schock28
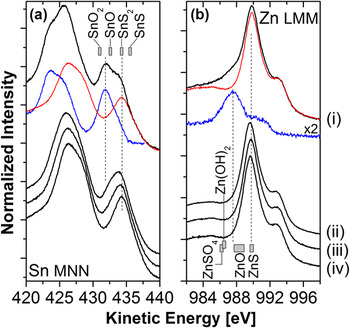
Figure 3 shows the detail spectra of (a) the Sn MNN and (b) the Zn LMM Auger lines. The Sn MNN spectrum of the as-deposited CZTS clearly shows contributions from (at least) two different chemical species. However, already the first Ar+ treatment step reduces the second contribution (which is responsible for additional intensity in the dip between the M4N45N45 and the M5N45N45 Auger line at approx. 431 eV) significantly. After subsequent Ar+ treatment steps, it is essentially (if not completely) removed. To identify the different Sn species, we have used spectrum (iv)—being representative for one Sn species— and subtracted it from spectrum (i) to derive the Sn MNN signature of the second Sn species. If 40% of spectrum (iv) [dashed line in Fig. 3(a)] is subtracted from spectrum (i), the resulting difference spectrum (dotted line) resembles a single-species Sn MNN spectrum itself. Comparison with literature values40 for the Sn M4N45N45 Auger line [represented as gray boxes in Fig. 3(a)] assigns this species to Sn-Ox bonds (the respective line lies in-between the reference position of SnO and SnO2). Furthermore, the species present in all four spectra (i)—(iv) is assigned to Sn-S bonds in SnS2, which appears plausible when considering CZTS as a quasi ternary Cu2S-ZnS-SnS2 system.Reference Olekseyuk, Dudchak and Piskach20 The apparent shift of this species between spectra (ii) and (iv) is due to the subsequent reduction of the Sn-Ox species mentioned above.
XAES (a) Sn MNN and (b) Zn LMM detail spectra of the investigated CZTS thin film before (i) and after (ii–iv) subsequent Ar+ treatment steps. The gray boxes at the top (a) and at the bottom (b) represent the range of energetic positions of potentially formed Sn and Zn species, respectively, as found in Ref. 40. (Data taken from Ref. Reference Bär, Schubert, Marsen, Krause, Pookpanratana, Unold, Weinhardt, Heske and Schock28.)

At first glance, the Zn LMM XAES spectra in Fig. 3(b) are very similar. Close inspection, however, reveals that the Zn LMM spectrum of the as-received sample (i) shows additional intensity around 987 eV. Computing a difference spectrum (dotted line) by subtracting 95% of spectrum (iv) [dashed line in Fig. 3(b)] from spectrum (i), we observe that the difference resembles the Zn LMM Auger line of a second species quite well. However, the resulting spectrum is rather broad, which suggests that it might be composed of more than one species. Comparison with literature values for the Zn L3M45M45 transition40 points to Zn-S bonds as the primary chemical Zn environment and to Zn-O, Zn-(OH)2, and/or Zn-SO4 bonds as most likely components of the broader difference spectrum. Note that the presence of oxidized sulfur is corroborated by the detail S 2p XPS spectra (shown in Ref. Reference Bär, Schubert, Marsen, Krause, Pookpanratana, Unold, Weinhardt, Heske and Schock28). Interestingly, no indications of oxidation can be observed in the Cu XAES and XPS detail spectra (not shown), which suggests that Cu is present in a Cu(I)-S environment (even after extensive air exposure). Thus, exposing a CZTS sample to ambient air mainly causes the native oxidation of tin and, to a significantly lesser extent, also of zinc and sulfur, but not of copper.
D. Cu-poor surface structure
We now focus on a comparison of the bulk and surface composition of CZTS thin films. The relative bulk composition of the here-considered sample, as determined by EDS immediately after growth, is 23.5% Cu, 14.4% Zn, 13.1% Sn, and 49.0% S (experimental uncertainty: ± 1.5%). The corresponding Cu/(Zn + Sn) and Zn/Sn ratios are (0.86 ± 0.10) and (1.10 ± 0.16), respectively.Reference Bär, Schubert, Marsen, Krause, Pookpanratana, Unold, Weinhardt, Heske and Schock28 The investigated CZTS bulk is thus slightly Cu-poor and Zn-rich (Sn-poor) compared with the nominal Cu:Zn:Sn:S = 2:1:1:4 stoichiometry. Note that our near-surface bulk sensitive x-ray emission and absorption measurements (see discussion above and Refs. Reference Bär, Schubert, Wilks, Marsen, Zhang, Blum, Krause, Yang, Unold, Weinhardt, Heske, Schock, Bell, Shahedipour-Sandvik, Jones, Schaadt, Simpkins and Contreras26,Reference Bär, Schubert, Marsen, Schorr, Wilks, Weinhardt, Pookpanratana, Blum, Krause, Zhang, Yang, Unold, Heske and Schock27) nevertheless indicate a single-phase CZTS sample without any evidence for a ZnS impurity phase.
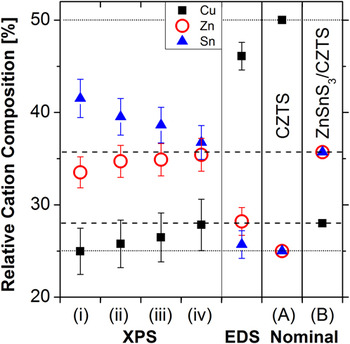
The surface composition was quantified using the surface-sensitive XPS data, as described in detail in Ref. Reference Bär, Schubert, Marsen, Krause, Pookpanratana, Unold, Weinhardt, Heske and Schock28. The XPS-derived relative cation compositions are compared with the bulk-sensitive EDS data in Fig. 4. We find that the relative surface content of Zn and Cu increase, while that of Sn decreases as a function of Ar+ treatment time. This can most likely be explained by a removal of the preferentially formed tin oxide (see above) from the air-exposed CZTS surface. Comparing the XPS with the EDS data, a significant deviation in the relative cation composition can be identified. While the bulk composition derived by EDS is similar (but not identical) to the nominal Cu:Zn:Sn = 2:1:1 stoichiometry of CZTS [“Nominal (A)”, Fig. 4], the XPS data indicate a considerably Cu-poor and (Zn+Sn)-rich chemical surface structure. We interpret this as evidence for a pronounced compositional variation at the outermost surface. With respect to the bulk-sensitive EDS data and the nominal 2:1:1 composition, XPS shows the CZTS surface to contain more Zn and Sn and less Cu, and thus we suggest the formation of a Cu-free Zn-Sn surface species. The absence of any evidence for Cu oxidation at the air-exposed CZTS surface (see above) is experimental support for this hypothesis. One reasonable compositional candidate in this context would be ZnSnS3.Reference Nanobashvili, Nemsadze and Svanidze41 Note that XPS alone is not able to distinguish between ZnSnS3 and a corresponding (laterally segregated) mixture of ZnS and SnS2; we will, however, continue to call this surface structure “ZnSnS3”. Comparing the (relative) XPS Cu surface content of 28 at.% with the 50 at.% of a nominal 2:1:1 composition (see Fig. 4) suggests a ZnSnS3/CZTS bilayer system where the ZnSnS3 thickness is approx. (1.4 ± 0.4) nm.Reference Bär, Schubert, Marsen, Krause, Pookpanratana, Unold, Weinhardt, Heske and Schock28 Using this thickness and calculating the Zn and Sn XPS surface content of an assumed ZnSnS3/CZTS bilayer leads to a relative Zn and Sn composition of approx. 36 at.% [“Nominal (B)”, Fig. 4]. Direct comparison with the measured XPS surface composition of the “real-world” CZTS sample reveals an excellent agreement between the proposed ZnSnS3 [(1.4 ± 0.4) nm]/CZTS bilayer model system and the experimental data, supporting the hypothesis of a Cu-free Zn-Sn compound (of a stoichiometry close to ZnSnS3 or ZnS + SnS2) at the CZTS surface.
Relative cation composition, derived by XPS for the as-received CZTS sample (i) and after subsequent Ar+ treatment steps (ii)—(iv). For comparison, the respective EDS-derived composition is also shown. As reference, the relative cation composition, as expected for a CZTS sample with the nominal 2:1:1 stoichiometry (“Nominal (A)”, horizontal dotted lines), as well as the expected XPS surface composition of a ZnSnS3 [1.4 nm]/CZTS model bilayer (“Nominal (B)”, horizontal dashed lines) are also presented. (Data taken from Ref. Reference Bär, Schubert, Marsen, Krause, Pookpanratana, Unold, Weinhardt, Heske and Schock28.)

In particular in view of the electronic CZTS surface structure (including the band gap and band edge positions), this finding might represent a crucial piece of information for further CZTS device optimization. Similar to the case of Cu(In1-xGax)(SySe1-y)2, for which the presence of a Cu-poor surface layerReference Tuttle, Albin and Noufi42, Reference Schmid, Ruckh, Grunwald and Schock43 is considered essential for optimizing the electronic level alignmentReference Bär, Nishiwaki, Weinhardt, Pookpanratana, Fuchs, Blum, Yang, Denlinger, Shafarman and Heske37, Reference Morkel, Weinhardt, Lohmüller, Heske, Umbach, Riedl, Zweigart and Karg38, Reference Klein and Jaegermann44 and for minimizing interface recombination,Reference Schock and Rau45, Reference Turcu and Rau46 we propose that this “off-stoichiometry” at the surface can be exploited on a pathway toward highly-efficient CZTS-based cells. Note, however, that our data does not indicate the exact origin of the Cu deficiency—whether this complicated chemical surface structure is a result of the pronounced formation of native oxides and their subsequent removal by mild Ar+ treatment steps, or whether it is an inherent feature of the ideal surface, has to be clarified in future studies.
IV. SUMMARY
It was shown that by using different soft x-ray spectroscopies a wealth of information can be gained about the chemical and electronic structure of CZTS thin-film samples. XAS measurements provide a very sensitive probe for the amount of S-Zn bonds.Reference Bär, Schubert, Wilks, Marsen, Zhang, Blum, Krause, Yang, Unold, Weinhardt, Heske, Schock, Bell, Shahedipour-Sandvik, Jones, Schaadt, Simpkins and Contreras26 The combination of XES and XAS reveals that the top (bottom) of the CZTS valence (conduction) band is dominated by hybridized antibonding Cu 3d—S 3p (Sn 5s—S 3p) states.Reference Bär, Schubert, Marsen, Schorr, Wilks, Weinhardt, Pookpanratana, Blum, Krause, Zhang, Yang, Unold, Heske and Schock27 Good agreement of the experimental data with theory is found for the CZTS density of states calculated by Paier et al.Reference Paier, Asahi, Nagoya and Kresse15, Reference Bär, Schubert, Marsen, Schorr, Wilks, Weinhardt, Pookpanratana, Blum, Krause, Zhang, Yang, Unold, Heske and Schock27 The electronic band gap in the near-surface region of the investigated CZTS materials is determined to be 1.5 (± 0.3) eV,Reference Bär, Schubert, Marsen, Schorr, Wilks, Weinhardt, Pookpanratana, Blum, Krause, Zhang, Yang, Unold, Heske and Schock27 which agrees well with previously reported UV-Vis dataReference Tanaka, Nagatomo, Kawasaki, Nishio, Guo, Wakahara, Yoshida and Ogawa7 and represents an optimal band gap for the use of CZTS in photovoltaic devices. Studying the chemical surface structure of an air-exposed CZTS thin film, we find the native oxidation of tin, zinc, and sulfur (in order of prevalence), but not copper.Reference Bär, Schubert, Marsen, Krause, Pookpanratana, Unold, Weinhardt, Heske and Schock28 Furthermore, the comparison of bulk and surface compositions reveals a Cu-poor CZTS surface structure, which is interpreted as the presence of a Cu-free Zn-Sn surface species, such as, e.g., ZnSnS3 or a mixture of ZnS + SnS2.Reference Bär, Schubert, Marsen, Krause, Pookpanratana, Unold, Weinhardt, Heske and Schock28
V. CONCLUSION AND OUTLOOK
The next step in aiding the development of CZTS-based solar cells is the investigation of the chemical and electronic interface structure throughout the thin-film layer stack. For the manufacturing of CZTS devices, the currently used heterostructure was simply copied from chalcopyrite-based devices, which was derived after 20 years of optimization. It can thus not be expected that the respective interfaces of CZTS with the CdS buffer and/or the Mo back contact be also “automatically” optimized. Consequently, we speculate that the CZTS solar cell performance can be further and significantly improved by a careful design of these interfaces as well. For example, a detailed device characterization of kesterite-based solar cellsReference Gunawan, Todorov and Mitzi47, Reference Wang, Gunawan, Todorov, Shin, Chey, Bojarczuk, Mitzi and Guha48 revealed that the activation energy of the dominant recombination process is smaller than the band gap energy of the respective kesterite absorbers. This is commonly interpreted as an indication for solar cells limited by recombination across the (buffer/absorber) interface.Reference Turcu, Pakma and Rau49 A direct determination of the valence and conduction band offset at the CdS/CZTS interface by a combination of direct and inverse photoemission is thus very important (and currently ongoing). Given the availability of novel characterization methods (including the ones described here and in Ref. Reference Abou-Ras, Kirchartz and Rau25), it is to be expected that the development of CZTS will not require 20 years (as in the case of chalcopyrite-based devices), but can be significantly accelerated.
To aid in the development of high-efficiency thin-film solar cell devices, many different characterization techniques are available that use soft x-rays to illuminate the electronic and chemical properties of surfaces and interfaces. By applying a variety of different viewpoints, e.g., by varying the depth-sensitivity and by combining methods that probe occupied and unoccupied electronic states, a comprehensive picture of the complex processes at empirically optimized real-world semiconductor surfaces and heterojunctions can be drawn. Such insights can be used to propose novel optimization routes and, furthermore, be used to monitor the success of deliberately introduced modifications.
In addition, it should be mentioned that some of the here-described methods could be applied to in situ studies since they are photon-in-photon-out (PIPO) techniques. Due to their 1/e-attenuation lengths in the order of a few tens to a few hundreds of nanometers, PIPO techniques have recently been successfully used to investigate samples under non vacuum conditions.Reference Weinhardt, Fuchs, Blum, Bär, Weigand, Denlinger, Zubavichus, Zharnikov, Grunze, Heske and Umbach50 In the future, they will lend themselves to monitor the electronic and chemical properties of thin-film solar cell interfaces while they are being formed. This promises new and exciting insights into the interface formation dynamics and will open up a new avenue for deliberate optimization of thin-film solar cells.
ACKNOWLEDGMENTS
R.G. Wilks and M. Bär acknowledge the financial support by the Impuls- und Vernetzungsfonds of the Helmholtz-Association (VH-NG-423). The ALS is funded by the Department of Energy, Basic Energy Sciences, Contract No. DE-AC02-05CH11231. Furthermore, the authors thank J. Paier and G. Kresse for making their calculated DOS dataReference Paier, Asahi, Nagoya and Kresse15 available in electronic form.