INTRODUCTION
In the context of global warming due to radiative forcing of greenhouse gases, many studies of the carbon cycle have substantiated the primary role of the ocean in rapid CO2 uptake, in turn lowering the atmospheric concentration (Brewer Reference Brewer1978; Sundquist Reference Sundquist1993; Sabine et al. Reference Sabine, Feely, Gruber, Key, Lee, Bullister, Wanninkhof, Wong, Wallace and Tilbrook2004; Volk and Hoffert Reference Volk and Hoffert2013, among others). Further, variable CO2 partitioning between the atmosphere and ocean reservoirs has been implicated in past and present climate variations. For example, during the last deglaciation, increased ventilation released CO2 from the deep oceans to the atmosphere (Lorius et al. Reference Lorius, Barkov, Jouzel, Korotkevich, Kotlyakov and Raynaud1988; Anderson et al. Reference Anderson, Ali, Bradtmiller, Nielsen, Fleisher, Anderson and Burckle2009; Skinner et al. Reference Skinner, Fallon, Waelbroeck, Michel and Barker2010). While high latitude ocean regions support most of deep water—atmosphere exchange, transport of intermediate and deep waters towards lower latitudes also needs to be accounted for in the carbon cycle (Bostock et al. Reference Bostock, Opdyke, Gagan and Fifield2004).
Bomb-produced radiocarbon released to the atmosphere in the 1950s and early 1960s from nuclear tests significantly increased the 14C content of atmospheric CO2, making it a suitable tracer for rapid processes, and enabling us to estimate the transfer rate of anthropogenic CO2 to the ocean (Hesshaimer et al. Reference Hesshaimer, Heimann and Levin1994; Levin and Hesshaimer Reference Levin and Hesshaimer2000; Sweeney et al. Reference Sweeney, Gloor, Jacobson, Key, McKinley, Sarmiento and Wanninkhof2007). Several global oceanographic campaigns included sampling of dissolved inorganic carbon (DIC) for 14C analysis: Geochemical Ocean Sections Study (GEOSECS) in the 1970s (Broecker et al. Reference Broecker, Peng, Ostlund and Stuiver1985), the Hydrographic Program of the World Ocean Circulation Experiment (WOCE, Key Reference Key1996; Key et al. Reference Key, Quay, Schlosser, McNichol, Reden, Schneider, Elder, Stuiver and Östlund2002), and Climate Variability and Predictability (CLIVAR) in the 2000s (CLIVAR Scientific Steering Group, 1995). Repeat sections between CLIVAR and WOCE, separated by a decade, allowed the study of the evolution of DI14C through time, further constraining the CO2 flux to the ocean (Graven et al. Reference Graven, Gruber, Key, Khatiwala and Giraud2012), and confirming the penetration of radiocarbon down to intermediate water depths in the southern Pacific Ocean (Jenkins et al. Reference Jenkins, Elder, McNichol and Reden2010; Kumamoto et al. Reference Kumamoto, Murata, Kawano, Watanabe and Fukasawa2013).
The deep waters, however, remain free of bomb-produced radiocarbon, and only include natural cosmic-ray produced radiocarbon. It is thus possible to use radiocarbon as a semi-conservative tracer of deep ocean circulation, and its natural decay can be used to radiometrically date water masses (Matsumoto Reference Matsumoto2007).
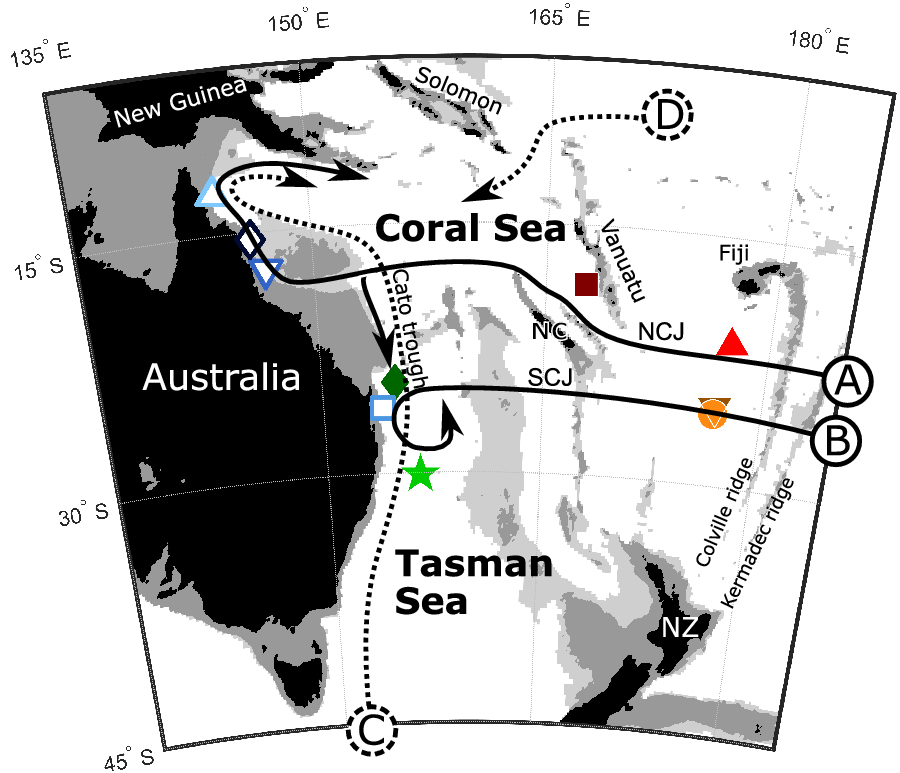
Here, we focus on the western Coral Sea, off Queensland, northeast Australia. The Coral Sea is bounded by the Solomon Islands to the North, Vanuatu and New Caledonia to the East, and the latitude of 30°S to the South. The Coral Sea is a major outlet of the South Pacific gyre, with water masses entering the Coral Sea through the South Equatorial Current (Wyrtki Reference Wyrtki1960; Webb Reference Webb2000). This current splits into zonal jets that circulate around the New Caledonia and Vanuatu islands, as attested by Argo floats (Maes et al. Reference Maes, Gourdeau, Couvelard and Ganachaud2007) and Doppler velocity profiles (Gourdeau et al. Reference Gourdeau, Kessler, Davis, Sherman, Maes and Kestenare2008). The North Caledonian and South Caledonian Jets (NCJ and SCJ, respectively) extend down to at least 1500 meters below sea level (mbsl), which implies that these jets also transport Antarctic Intermediate Waters (AAIW) toward the Coral Sea (Kessler and Cravatte Reference Kessler and Cravatte2013). AAIW is a low salinity, high oxygen water mass with a neutral density (γn) comprised between 27.0 and 27.6 kg/m3 in the South Pacific, at depths of 700 to 1200 mbsl in the Coral Sea (Sloyan and Rintoul Reference Sloyan and Rintoul2001; Schneider et al. Reference Schneider, Fukasawa, Uchida, Kawano, Kaneko and Fuenzalida2005; Macdonald et al. Reference Macdonald, Mecking, Robbins, Toole, Johnson, Talley, Cook and Wijffels2009). The circulation of AAIW into the Coral Sea is indicated by solid arrows in Figure 1. The pathway A, adopted from Sokolov and Rintoul (Reference Sokolov and Rintoul2000), extends from the NCJ, crosses the Coral Sea westward at a latitude of 18°S, then bifurcates at the Queensland Plateau. The northern branch circulates around the Coral Sea as a western boundary current (Kessler and Cravatte Reference Kessler and Cravatte2013), while the southern branch joins the pathway B at 24°S to form the southward East Australian Current (Ganachaud et al. Reference Ganachaud, Cravatte, Melet, Schiller, Holbrook, Sloyan, Widlansky, Bowen, Verron and Wiles2014).
Bathymetric map of the Southwest Pacific. Land surfaces are shown in black; grey shading and light grey shadings indicate bathymetry above 1000 mbsl and 2000 mbsl, respectively. Solid arrows show circulation of Antarctic Intermediate Water at 1000 mbsl, dashed arrows indicate circulation of Circumpolar Deep Water at 2000 mbsl. Capital letters A, B, C and D refer to pathways described in text. A selection of stations where 14C has been measured is indicated with symbols: open symbols (◊, △, ▽, □): this study; filled symbols (★, •, ▾, ▪, ♦, ▴): GLODAP database (Olsen et al. Reference Olsen, Key, van Heuven, Lauvset, Velo, Lin, Schirnick, Kozyr, Tanhua and Hoppema2016). NC – New Caledonia; NCJ – North Caledonian Jet; SCJ – South Caledonian Jet; NZ – New Zealand.
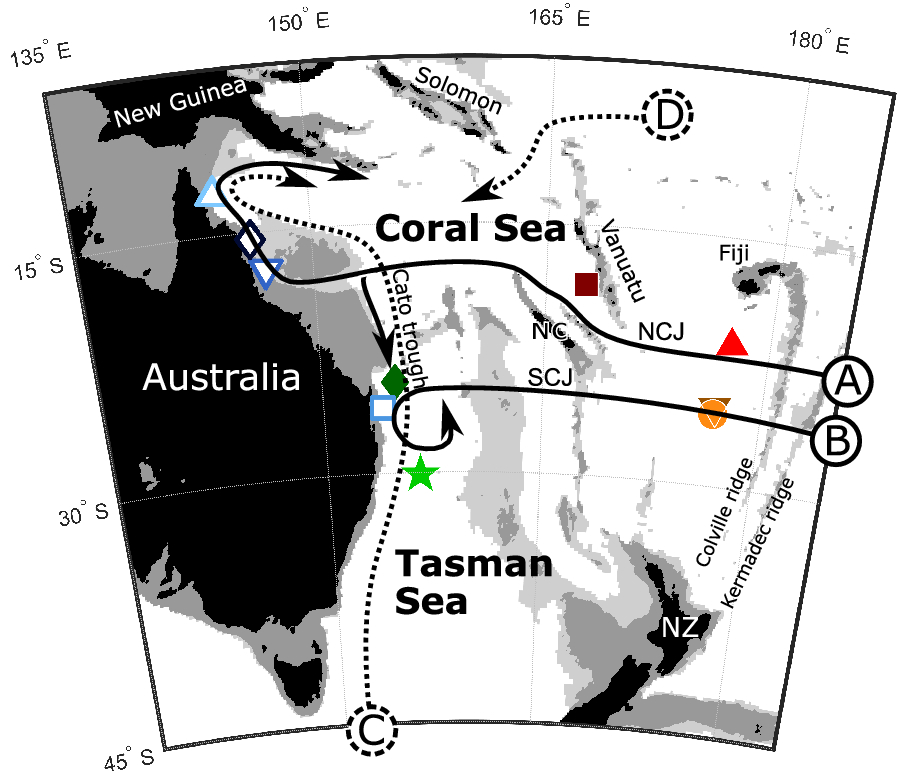
Circulation of water masses in the Coral Sea was also inferred from salinity and oxygen, supporting the above pathways of AAIW (Sokolov and Rintoul Reference Sokolov and Rintoul2000). The chemical properties were also used to describe the deep water circulation, depicted by dashed arrows in Figure 1. Topographic barriers at 2000 mbsl in the Southwest Pacific Ocean restrict the circulation of deep waters that can only enter and exit the Coral Sea via a few troughs. Sokolov and Rintoul (Reference Sokolov and Rintoul2000) attribute the deep water in the Coral Sea to a mixture of Circumpolar Deep Water (CDW) from the Southern Ocean transported northward through the Tasman Sea via the Cato Trough, and a westward flow of recircled CFW through the central Pacific underneath the South Equatorial Current. Deep waters are characterized by a weak salinity maximum, and span neutral densities of 27.4 to 28.2 kg/m3 in the South Pacific (Sloyan and Rintoul Reference Sloyan and Rintoul2001) or 27.7 to 28.27 kg/m3 in the Southern Ocean (Orsi et al. Reference Orsi, Smethie and Bullister2002); these neutral densities are the highest measured in the Coral Sea. Sokolov and Rintoul (Reference Sokolov and Rintoul2000) estimated the transport of deep water into the Coral Sea in northward and westward direction (respectively arrows C and D in Figure 1) from geostrophic velocities across a meridional transect at 155°E (WOCE P11) to be 3.0 and 3.9 Sverdrup, respectively, with outflows to the north toward Solomon Islands and to the east around New Caledonia. The 14C content of deep Coral Sea waters is nonetheless lacking in the GLODAPv2 data, as the Coral Sea legs did not include DI14C analysis north of the Cato trough.
In this study, we extend the coverage of Δ14C with the first measurements in the Western Coral Sea, which was missing in previously published datasets. We use the Δ14C as a complementary tracer to discuss the circulation of intermediate and deep water in the Coral Sea.
METHODS
Seawater samples were collected with a conductivity-temperature-depth (CTD)-Rosette water sampler at four stations (see Figure 1) during the R/V SONNE expedition SO-256 for the study of Temperature And Circulation history of The East Australian Current (TACTEAC, Mohtadi et al. Reference Mohtadi, Beaman, Boehnert, Daumann, Floren, Gould, Hirabayashi, Hollstein, Kienast and Lückge2017). The water for 14C analysis was subsampled into 50-mL glass bottles. To avoid contamination of 14C samples, the sample bottles were abundantly rinsed with sampled water, and overflowing to remove water that could exchange with air in the bottle. About 300 µL of mercuric chloride was added to each bottle for preservation of DIC during transport and storage.
For the 14C analysis, about 100 mL of seawater is transferred to the debubbling line, under a noble gas atmosphere (argon for the transfer, and helium in the line). Phosphoric acid is added to the seawater to reduce pH, and thus reduce the solubility of CO2 that is released in the line. The sample preparation line is composed as follows, with tubing in series: the bottle sample, two water traps in Dewars of cooled ethanol at –100°C, a CO2 trap in a Dewar of liquid nitrogen, a connection to graphitization line that is closed during debubbling, and a pump that actively circulates gas in a tube with the end immersed in the seawater sample. After 15 min of debubbling, we pump out the noble gases while maintaining water and CO2 fixed in cold traps. Finally, the liquid nitrogen Dewar is replaced with a cooled ethanol Dewar, to release CO2 from the trap to the graphitization line. The CO2 was then reduced following the graphitization procedure described by Yokoyama et al. (Reference Yokoyama, Miyairi, Matsuzaki and Tsunomori2007, Reference Yokoyama, Koizumi, Matsuzaki, Miyairi and Ohkouchi2010), and the graphite was analyzed on the single-stage AMS at the University of Tokyo (Yokoyama et al. Reference Yokoyama, Miyairi, Aze, Yamane, Sawada, Ando, de Natris, Hirabayashi, Ishiwa and Sato2019; Yamane et al. Reference Yamane, Yokoyama, Hirabayashi, Miyairi, Ohkouchi and Aze2019). Hereafter, we use the Δ14C as a measurement of radiocarbon concentration normalized to δ13C, as defined by Stuiver and Polach (Reference Stuiver and Polach1977). The measurement sequence includes counting of 12C, 13C and 14C, so we use the AMS δ13C values for an on-line normalization (Yokoyama et al. Reference Yokoyama, Miyairi, Aze, Yamane, Sawada, Ando, de Natris, Hirabayashi, Ishiwa and Sato2019).
We provide our Δ14C data in Supplementary Table S1, with uncertainty given as 1σ standard deviation of at least 10 repeated measurements on the same sample. A reproducibility analysis was conducted, where 5 pairs of subsampled bottles underwent full treatment, and we concluded that the sample preparation only slightly increased the mean 1σ uncertainty for the 5 samples from 8.803‰ to 9.251‰ (details are provided in Supplementary Table S2). We chose not to include this source of uncertainty in our data as the pair of subsamples were not statistically different against a Student’s t-test.
The new water column profiles presented here are compared to data from the Global Ocean Data Analysis Project version 2 (GLODAPv2); accessible from the National Oceanic and Atmospheric Administration database (Olsen et al. Reference Olsen, Key, van Heuven, Lauvset, Velo, Lin, Schirnick, Kozyr, Tanhua and Hoppema2016, last accessed July 6, 2018). This database includes high quality CTD and hydrographic data from the different oceanographic campaigns presented above, in addition to other cruise data.
Water masses have characteristic densities; we ensure comparison within the same water mass by computing the neutral density, a conservative density definition introduced by Jackett and McDougall (Reference Jackett and Mcdougall1997). Unlike potential density, neutral density is defined without a reference layer and can be used for a large range of depths in the ocean.
RESULTS
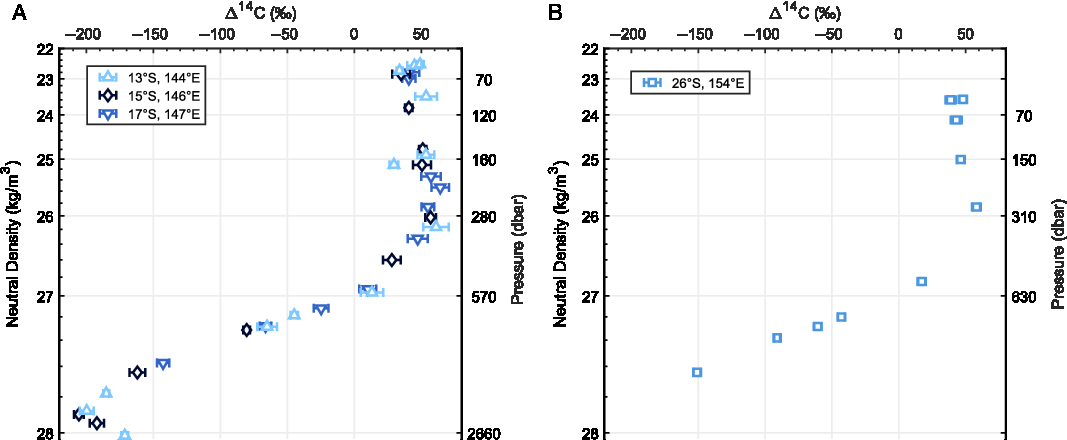
The profiles of Δ14C in the Coral Sea are presented in Figure 2. The three profiles in the northwestern Coral Sea are almost identical (within measurement error), and are thus merged into a single composite profile that we consider representative of the northwest (NW) Coral Sea. On the other hand, a single profile was measured in southwestern Coral Sea, hereafter named SW Coral Sea.
Profiles of Δ14C in the western Coral Sea on a neutral density scale in (A) the northwestern Coral Sea and (B) the southwestern Coral Sea. Error-bars indicate 1σ measurement standard deviation. Location of stations is indicated in Figure 1 with corresponding symbols.
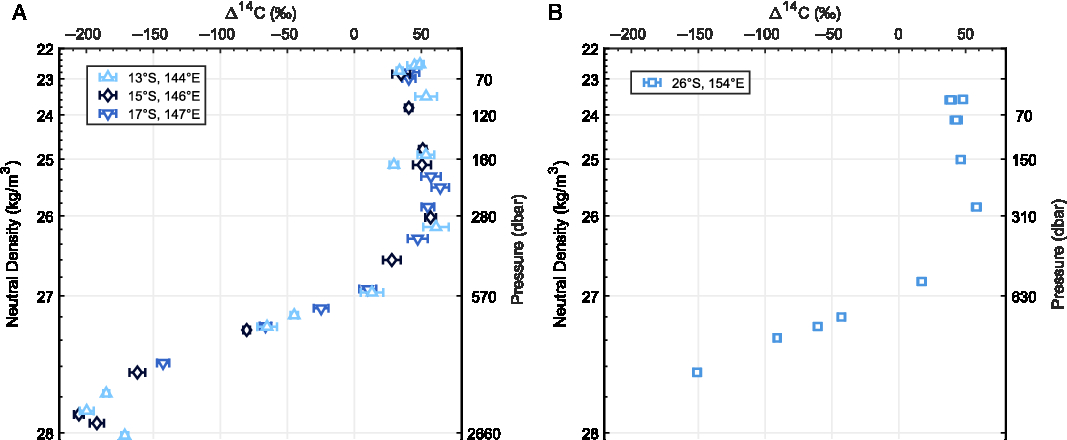
Both profiles show a constant Δ14C of 40 to 50‰ in the neutral densities lower than 26 kg/m3, which corresponds to surface and thermocline waters (Sloyan and Rintoul Reference Sloyan and Rintoul2001; Gasparin et al. Reference Gasparin, Maes, Sudre, Garcon and Ganachaud2014). In the intermediate waters, with neutral densities from 26 to 27.4 kg/m3, Δ14C is decreasing to about –100‰ at 27.4 kg/m3.
For neutral densities greater than 27.4 kg/m3, characteristic of deep waters, theΔ14C keeps decreasing to a minimum of –205.6 ± 3.6‰ at 27.9 kg/m3 in the NW Coral Sea. The deepest water sampled, with a neutral density just above 28.0 kg/m3, has a slightly higher Δ14C with –171.4 ± 2.6‰. The SW Coral Sea was not sampled at this depth here, except for one bottle with a Δ14C of –150.9 ± 2.9‰ at 27.64 kg/m3. The upper part of the SW Coral Sea profile, however, is almost identical to the composite profile from the NW Coral Sea.
DISCUSSION
Intermediate Water Circulation
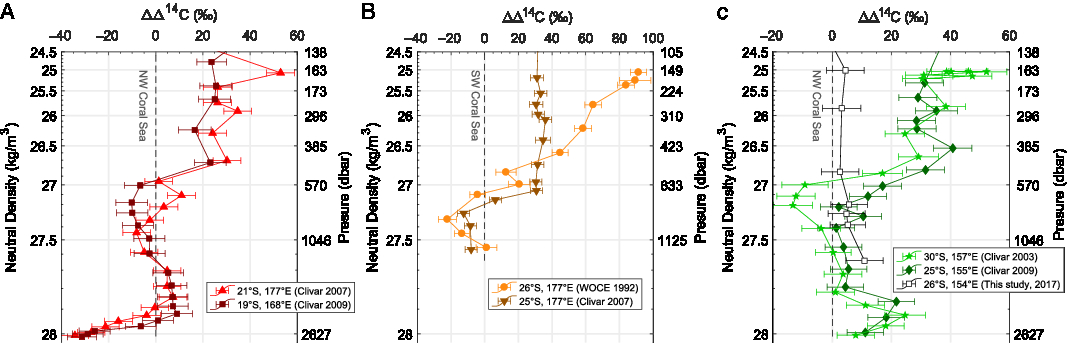
In order to compare subtle differences in Δ14C over a wide range of densities, we subtracted the NW Coral Sea profile from all profiles from stations along pathways A and C in Figure 3A and Figure 3C, and subtracted the SW Coral Sea profile from all profiles along pathway B in Figure 3B. If no point was available at the same density, we linearly interpolated the two closest points on a neutral density scale.
Selected profiles of Δ14C along the pathways A, B, and C, plotted versus neutral density as the difference to NW Coral Sea (A and C) or SW Coral Sea (B). Error-bars represent a 1σ combined standard error resulting from the combination of original data uncertainty and the subtracted value uncertainty. See Figure 1 for the location of stations indicated with corresponding symbols. Profiles are from WOCE 1992 (Roemmich et al. Reference Roemmich, Warner, Key, Jenkins, Bingler and Cornuelle2014), CLIVAR 2003 (Uchida et al. Reference Uchida, Fukasawa and Murata2013a), CLIVAR 2007 (Fukasawa et al. Reference Fukasawa, Kawano, Murata, Uchida and Doi2013), and CLIVAR 2009 (Uchida et al. Reference Uchida, Murata and Doi2013b).
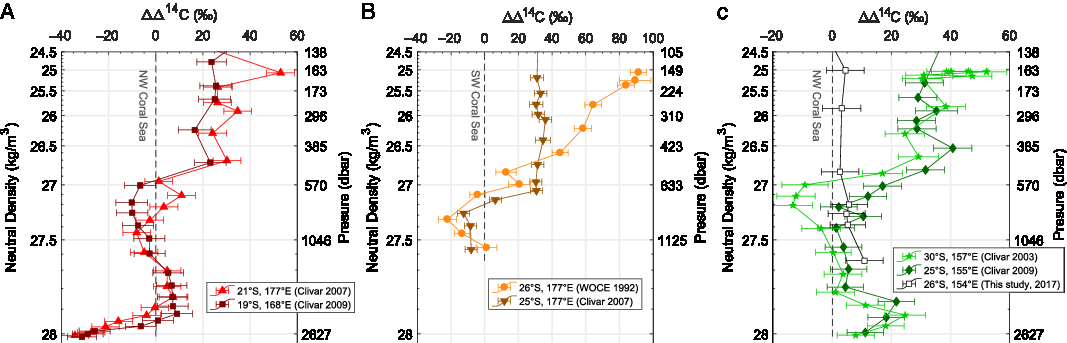
In Figure 3A, Thermocline Water and Sub-Antarctic Mode Water, with neutral densities lower than 27.0 kg/m3 (Hartin et al. Reference Hartin, Fine, Sloyan, Talley, Chereskin and Happell2011), show consistently lower Δ14C values in the NW Coral Sea by about –20‰ compared to profiles from CLIVAR, even though both profiles are taken along the same pathway of Antarctic Intermediate Waters (AAIW) (Sokolov and Rintoul Reference Sokolov and Rintoul2000; Gasparin et al. Reference Gasparin, Maes, Sudre, Garcon and Ganachaud2014). Conversely AAIW, with neutral densities of 27.0 to 27.4 kg/m3, is 14C depleted in WOCE and CLIVAR, compared to our profiles in the western Coral Sea: there is a +10‰ difference between CLIVAR 2009 and the NW Coral Sea at a neutral density of 27.3 kg/m3 presented here. These differences are even greater for the WOCE profile sampled in 1992 than for the CLIVAR profile sampled in 2007 at a very similar location (Figure 3B).
Assuming that the stations located along a specific pathway for intermediate waters have identical Δ14C at a given time, the Δ14C gradient described in the previous section used to be steeper than what we measured in 2017. This smoothing of the Δ14C gradient at intermediate water depths has been observed on a larger scale in the Pacific Ocean by comparing CLIVAR profiles to WOCE on repeated sections separated by 15 years (Jenkins et al. Reference Jenkins, Elder, McNichol and Reden2010). It is caused by diffusion of 14C enriched carbon dioxide produced extensively in the 1950s and 1960s that since has reached intermediate depths in the South Pacific Ocean. Our measurements show that the bomb-produced radiocarbon keeps diffusing further down the water column, with increasing 14C activity at AAIW densities, and decreasing 14C activity in the overlying water masses.
In the South Pacific at 150°W, Jenkins et al. (Reference Jenkins, Elder, McNichol and Reden2010) estimated a +15 to +50‰ increase of Δ14C in AAIW between 1991 and 2005, with the maximum increase occurring at mid latitudes and in the upper part of the AAIW. At low latitudes, the increase is smaller, +5 to +35‰ in the AAIW over 14 years. This rate is rather consistent with the increase of up to +12‰ measured along pathway B between CLIVAR 2007 and the new SW Coral Sea profiles from 2017 presented here, supporting the hypothesis of homogenous Δ14C content at a given time. It is also consistent with an increase along pathway A between CLIVAR 2009 and NW Coral Sea profiles, but not with the CLIVAR 2007 profile that do not show any significant difference with the NW Coral Sea at AAIW densities. Considering the position of the CLIVAR 2009 profile, we can constrain the eastward extent of pathway A up to north of New Caledonia. The CLIVAR 2007 profile however might be slightly off the pathway A, but was still the closest approximation due to the sparsity of Δ14C profiles.
In the Western Coral Sea however, we do not have repeated profiles. Because the water pathways differ for each water mass at a specific density, we can only compare a slice of a density profile with an upstream profile for the water mass. Additionally, we suppose that there is no mixing, which is the closest approximation we can make for Δ14C, but is not exactly true as shown by temperature and salinity (Supplementary Figures S4 and S6). Therefore, non-repeated profiles from the western Coral Sea are not suited for the computation of a downward flux of 14C, and we decide not to attempt a modeling of the flux that would be highly speculative as a result of all the uncertainties stated above.
Kumamoto et al. (Reference Kumamoto, Murata, Kawano, Watanabe and Fukasawa2013) estimated the extent of bomb-produced radiocarbon diffusion down to 1200 mbsl in the Coral Sea, which corresponds to neutral densities of 27.5 kg/m3. Our measurements further confirm the difference between the western Coral Sea and profiles upstream along the three pathways to be indistinguishable from measurement error, arguing for a water mass unaffected by diffusion thus far.
Deep Water Circulation
Below this limit of diffusion, the ocean is free of contamination, and radiocarbon can serve as a tracer for deep ocean circulation. The pathways A and B are limited to depths shallower than the topographic barrier formed by Colville and Kermadec ridges south of Fiji Islands, isolating the deep Coral and Tasman seas from the rest of the South Pacific Ocean. This results in relatively weak westward flow north of New Caledonia below 2000 mbsl (Gourdeau et al. Reference Gourdeau, Kessler, Davis, Sherman, Maes and Kestenare2008).
Furthermore, the deep water sampled in the NW Coral Sea has significantly higher Δ14C than stations upstream along pathway A, with a 30‰ difference below 27.9 kg/m3 in the NW Coral Sea where we observed a reversion of the Δ14C gradient (Figure 2 A) that is not observed at other stations east of New Caledonia (Fukasawa et al. Reference Fukasawa, Kawano, Murata, Uchida and Doi2013; Uchida et al. Reference Uchida, Murata and Doi2013b). This suggests a different source of deep waters.
Previous studies of the deep circulation in the Coral Sea suggested a northward circulation of Circumpolar Deep Water (CDW) through the Tasman Sea (Rotschi and Lemasson Reference Rotschi, Lemasson and Barnes1967; Sokolov and Rintoul Reference Sokolov and Rintoul2000), along with a westward flow between Vanuatu and Solomon Islands, as shown by the dashed arrows C and D in Figure 1. We compare the Δ14C data from the NW Coral Sea, where we sampled deep waters with CDW densities at stations upstream of pathway C for CDW in Figure 3C.
In the Southern Ocean, CDW is often considered as the water mass just underneath AAIW, with neutral densities from 27.4 to 28.2 kg/m3 (Sloyan and Rintoul Reference Sloyan and Rintoul2001). While Δ14C values of the NW Coral Sea do not show any significant differences compared to CLIVAR profiles at 25°S and 30°S, on neutral densities 27.4 to 27.8 kg/m3, the NW Coral Sea deep waters have a 20‰ lower Δ14C around the density of 27.9 kg/m3, where we identified the Δ14C minimum. A decrease of Δ14C along the pathway C could be due to natural decay of radiocarbon. As an order of magnitude, natural decay from –180‰ to –190‰ would take approximately 100 years. Assuming that there is no mixing along the pathway, this would imply a mean circulation below 0.1 cm/s from the East Australian Basin to the west of the Coral Sea Basin, via the Cato trough, ten times lower than the 1 to 5 cm/s implied by the 3 Sverdrup flow given by Sokolov and Rintoul (Reference Sokolov and Rintoul2000). We thus refute the hypothesis of an unmixed southern source for water at neutral densities 27.9 kg/m3, and argue for a significant contribution of 14C depleted waters from another source. The difference of Δ14C between the NW Coral Sea and southern stations along pathway C decreases to less than 10‰ for the deepest points at 28.0 kg/m3, which could be explained by an increased relative contribution of CDW at greater depths.
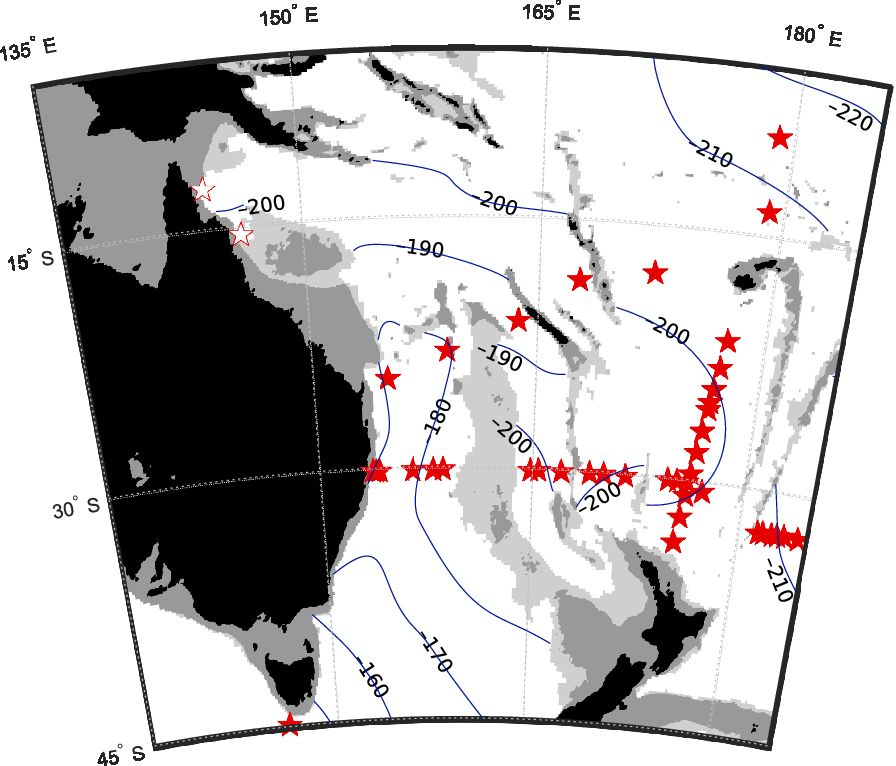
To further investigate the water masses arriving in the Coral Sea, we provide a map of Δ14C on the isopycnal surface of neutral density 27.9 kg/m3 in the Southwest Pacific (Figure 4, details on the map generation are provided in the supplementary information). Given that this density is largely below the diffusion limit of bomb-produced 14C, this map can be considered at steady state, independent of the time of sampling.
Map of Δ14C on isopycnal surface 27.9 kg/m3 neutral density, interpolated between stations shown by open stars (this study) and filled stars (GLODAP database; Olsen et al. Reference Olsen, Key, van Heuven, Lauvset, Velo, Lin, Schirnick, Kozyr, Tanhua and Hoppema2016). As in Figure 1, land surfaces are shown in black; grey shading and light grey shadings indicate bathymetry above 1000 mbsl and 2000 mbsl, respectively.
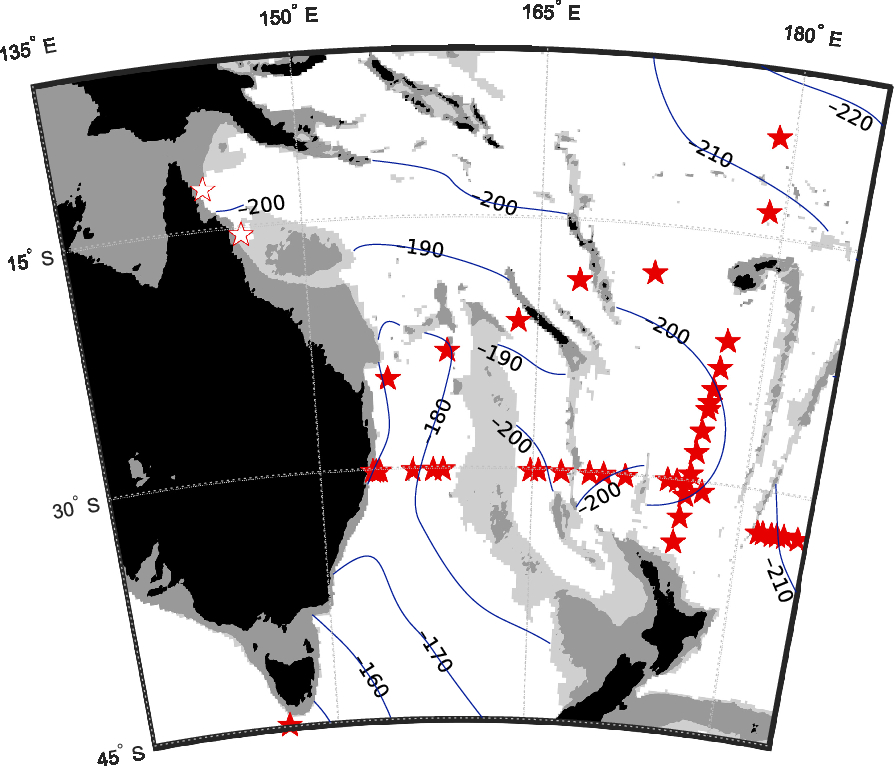
The Δ14C map in Figure 4 shows a gradient with high values of more than –180‰ south of Tasman Sea decreasing towards the Coral Sea that contrasts with very low Δ14C values of lower than –200‰ east of Vanuatu. The relatively high Δ14C of –195‰ in the northwestern Coral Sea confirms a major contribution of 14C rich Circumpolar Deep Water from the East Australia Basin through the Cato Trough (see Figure 1), although the eastern Coral Sea might also receive 14C depleted CDW flowing westward after circulating through the central Pacific, where it could have mixed to some extent with 14C-poor North Pacific Deep Water (NPDW) and consequently has a lower Δ14C. Sokolov and Rintoul (Reference Sokolov and Rintoul2000) discussed the sources for deep water in Coral Sea using the silica distribution, and concluded that low silica in the Coral Sea basin indicates a southern source of CDW, while higher values in the eastern Coral Sea indicates an eastern source, which is in excellent agreement with Δ14C data presented here.
The profiles along pathway C (Figure 3C) also show that the two water masses do not mix completely, but rather occupy different density layers in the Coral Sea basin, with a larger contribution of 14C depleted CDW from the eastern source at 27.9 kg/m3, and CDW from the southern source beneath, at 28.0 kg/m3. The lack of samples along the inferred westward flow (arrow D in Figure 1) does not allow us to fully confirm this contribution and would require further investigation. The westward flow is nonetheless in good agreement with modeled transport stream functions (Macdonald et al. Reference Macdonald, Mecking, Robbins, Toole, Johnson, Talley, Cook and Wijffels2009), and the location of the dissolved silica maximum (Sokolov and Rintoul Reference Sokolov and Rintoul2000).
NPDW formation during deglaciation may have modified the deep water circulation in the Pacific Ocean (Keigwin et al. Reference Keigwin1987; Okazaki et al. Reference Okazaki, Timmermann, Menviel, Harada, Abe-Ouchi, Chikamoto, Mouchet and Asahi2010; Rae et al. Reference Rae, Sarnthein, Foster, Ridgwell, Grootes and Elliott2014), and it is possible that the 14C content of deep water entering the Coral Sea was altered significantly at the time, although it remains hypothetical.
CONCLUSION
We investigated the Δ14C of Dissolved Inorganic Carbon in the Coral Sea, and compared it to previously published records of ocean circulation and time evolution of bomb-produced radiocarbon in the study region.
Our results are consistent with a deepening of bomb-produced radiocarbon, as observed at other stations in the South Pacific Ocean (Jenkins et al. Reference Jenkins, Elder, McNichol and Reden2010; Kumamoto et al. Reference Kumamoto, Murata, Watanabe and Fukasawa2011, Reference Kumamoto, Murata, Kawano, Watanabe and Fukasawa2013), based the hypothesis of a westward circulation of AAIW from the South Pacific gyre via the North and South Caledonian Jets.
Δ14C at greater depths remains free of bomb-produced 14C and is consistent with a dual origin of deep waters in the western Coral Sea, with Circumpolar Deep Water from the east through the Central Pacific, and directly from the south through the Tasman Sea, which are moderately mixed. The inflow of the eastern source cannot be tracked because of a lack of deep Δ14C measurements from this area. In general, the Δ14C map is in excellent agreement with silicate concentrations (Sokolov and Rintoul Reference Sokolov and Rintoul2000), which have been used previously to illustrate the dual origin of deep water in the Coral Sea.
While the Δ14C water column profiles presented here further validate the circulation pathways for intermediate to deep water masses, the sparse data available limits their interpretation in comparison to other geochemical tracers such as nutrients or oxygen. Yet the unique nature of Δ14C scaling with the age of the water mass complements other tracers to distinguish water masses and clarify the deep circulation of oceans.
ACKNOWLEDGMENTS
The authors would like to thank members of the R/V Sonne 256 cruise for providing high-quality samples. The R/V Sonne 256 cruise was funded by the German Research Ministry (BMBF) as project 03G0256A “TACTEAC: Temperature And Circulation History of The East Australian Current.” A part of this research was supported by Grants-in-Aid for Scientific Research, MEXT (No. KAKENHI JP15KK0151, JP17H01168) and JST CREST Grant Number JPMJCR13A4. We are grateful to Katsumi Matsumoto and an anonymous reviewer for their comments and constructive criticism on the manuscript.
SUPPLEMENTARY MATERIALS
To view supplementary material for this article, please visit https://doi.org/10.1017/RDC.2019.122