Introduction
In conservation agriculture, cover crops are utilized to improve soil properties and to enhance cash crop growth (Bowman et al., Reference Bowman, Shirley and Cramer2007). Producers in Alabama grew approximately 81,000 ha of cover crops (7.2% of total cropland) on 1800 farms (6.7% of total farms) in 2010 (USDA-NASS, 2016b). There are many benefits associated with cover crops such as reduced runoff and soil erosion (McGregor and Mutchler, Reference McGregor and Mutchler1992; Kern and Johnson, Reference Kern and Johnson1993), increased water infiltration and water holding capacity, increased soil organic carbon, decreased soil compaction (Reeves, Reference Reeves, Hatfield and Stewart1994; Raper et al., Reference Raper, Reeves, Schwab and Burmester2000) and better weed control due to mulching effects and allelopathy (Barnes and Putnam, Reference Barnes and Putnam1983; Creamer et al., Reference Creamer, Bennett, Stinner, Cardina and Regnier1996; Hoffman et al., Reference Hoffman, Weston, Snyder and Reginer1996). To optimize these benefits, cover crops must produce enough biomass to provide effective soil coverage; therefore, they must be managed properly from establishment to termination (Brady and Weil, Reference Brady and Weil1999).
To ensure effective planting of cash crops directly into large quantities of flattened residue, cover crops must be terminated at the appropriate growth stage (Balkcom et al., Reference Balkcom, Duzy, Kornecki and Price2015; Nelson et al., Reference Nelson, Kephart, Bauer and Connor1995). In the southern United States (USA), the recommended time to plant cash crops into residue is 3 weeks after terminating the cover crop and when termination exceeds 90% (Ashford and Reeves, Reference Ashford and Reeves2003); this minimizes resource competition between cover and cash crops. Therefore, proper management of cover crop residue is important for successful no-till planting of cash crops (Kornecki et al., Reference Kornecki, Price and Raper2006). Rolling with crimping is a method to roll down and mechanically terminate cover crops (Derpsch, Reference Derpsch, Stott, Mohtar and Steinhardt2001; Reeves, Reference Reeves2003). It uses crimping bars against a firm soil surface to damage plants without cutting the stems, accelerating death due to blocked nutrient flow through the plant. Parallel rolling direction of cover crops with respect to cash crop planting minimizes interference with cash crop planting and ensures good seed-to-soil contact (Kornecki, et al., Reference Kornecki, Raper, Arriaga, Schwab and Bergtold2009a). For cereal rye, the appropriate growth stage for mechanical termination without herbicides is between early milk and soft dough stages (Ashford and Reeves, Reference Ashford and Reeves2003; Kornecki et al., Reference Kornecki, Price, Raper and Arriaga2009c). If termination is done in earlier growth stage, rolling is ineffective because young plants have the ability to recover (Ashford and Reeves, Reference Ashford and Reeves2003; Balkcom et al., Reference Balkcom, Duzy, Kornecki and Price2015). Research also has shown that glyphosate application in conjunction with rolling–crimping resulted in faster termination of cereal rye 1 week after rolling alone (Kornecki et al., Reference Kornecki, Price, Raper and Bergtold2009b).
An important factor for sustainable and profitable conservation systems with cover crops is to minimize production costs associated with managing cover crops. Production costs, particularly labor, machinery and fuel costs, can be reduced by merging suitable field operations. Spring field operations, such as planting and application of herbicide and fertilizer, are commonly combined by producers to minimize trips across fields. Examples of combined operations include final seedbed preparation combined with planting or fertilizer application combined with a tillage operation (Helsel, Reference Helsel2007).
The objectives of this study were to determine the effects of different methods of cover crop termination and cotton planting on success of the cotton crop in terms of stand population, seed cotton yield, total treatment costs, net returns, labor and energy.
Materials and methods
Field experiment
A field experiment was established at the E.V. Smith Research Center (EVS) in Shorter, Alabama (32°25′38.12″N, 85°53′14.16″W) to evaluate termination methods of fall planted cover crops in a continuous cotton no-till system. The experiment was conducted from 2009 to 2011 on a Compass sandy loam (coarse-loamy, siliceous, subactive, thermic Plinthic Paleudults). The experiment was arranged as a randomized complete block design with four blocks of 11 plots each. Each plot was 3.64 m wide and 15.2 m long. The experiment remained in the same location for 3 yr with no re-randomization of treatments.
Cereal rye (var. Elbon) was planted following cotton at a rate of 100 kg ha−1 using a Great Plains no-till grain drill (Great Plains Manufacturing, Inc., Salina, KS, USA) with 19 cm row spacing (6.35–12.7 mm deep) on 30 October 2008, 4 November 2009 and 14 October 2010 (Table 1). The cover crop was fertilized using a spin spreader as a split application of 33.6 kg N ha−1 applied on 27 October 2008, 12 January 2010 and 1 November 2010, and 33.6 kg N ha−1 applied on 27 January 2009, 26 February 2010 and 15 February 2011. Rainfall delayed fertilizer application in 2010.
Cumulative precipitation (mm) and growing degree days (GDD) by date of operations

a Cumulative rainfall was calculated from cover crop planting to cotton harvest. Cumulative GDD were calculated separately for the cover crop and cotton growing season. For the cereal rye cover crop, GDD were calculated using 4.4°C as the lower temperature threshold. For cotton, GDD were calculated using 15.5°C as the lower temperature threshold.
b Cover crop termination occurred at early milk growth stage for treatments with termination separate from planting. For all other treatments, termination occurred at cotton planting.
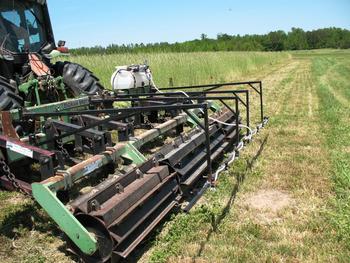
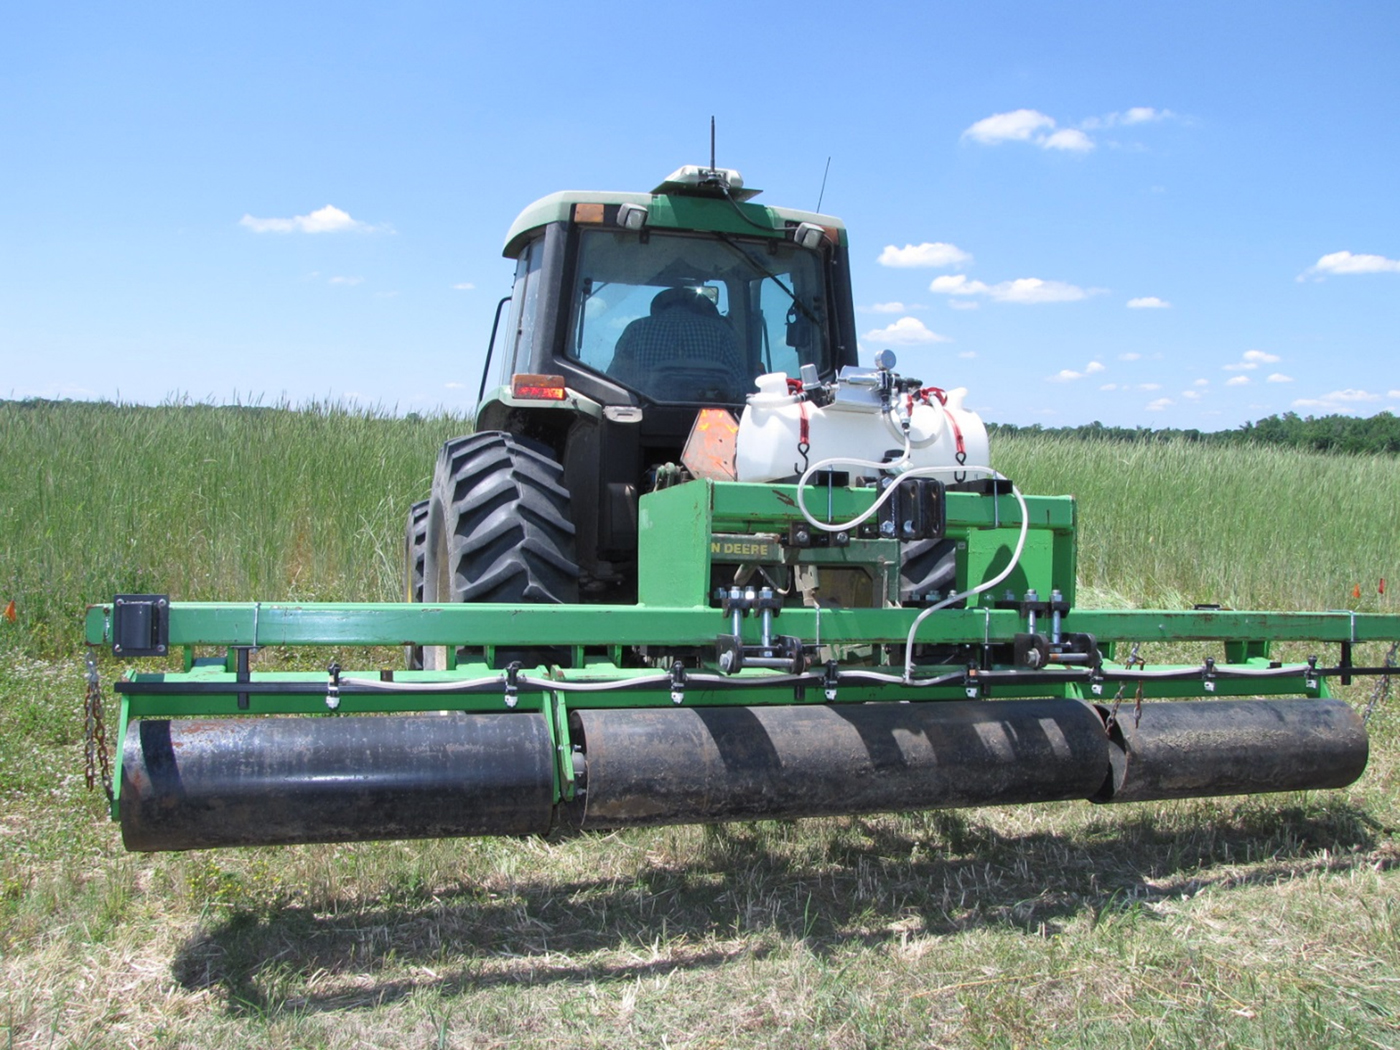
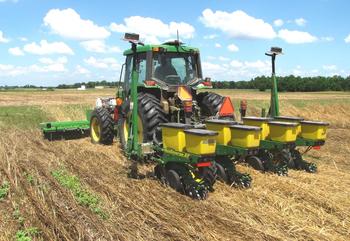
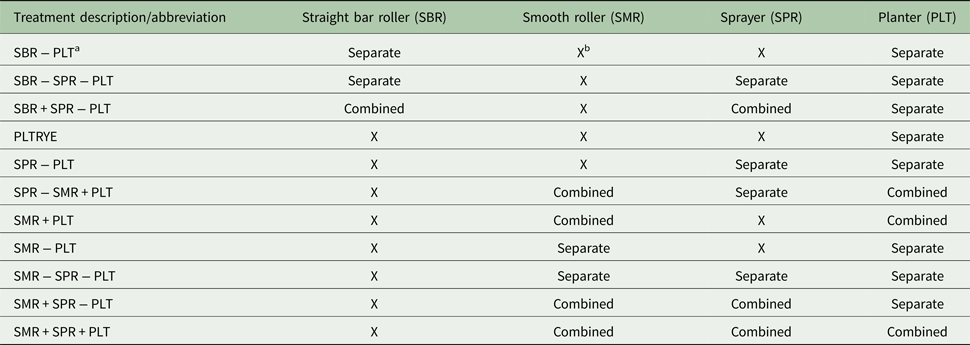
The cover crop termination and cotton planting combinations are shown in Table 2. For treatments with separate (−) operations, cereal rye at early milk growth stage (Zadoks growth stage #73; Zadoks et al., Reference Zadoks, Chang and Konzak1974) was terminated with either a smooth roller (SMR; Fig. 1) or a straight bar roller (SBR; Fig. 2) with or without chemical termination (SPR) 3 weeks prior to cotton planting (PLT). Early milk growth stage corresponded to 176 days after planting (DAP) in 2009, 175 DAP in 2010 and 193 DAP in 2011 (Table 1). To reduce field operations, SMR or SBR were combined with (+) PLT with and without SPR (Fig. 3). Planting into standing cereal rye (PLTRYE) was used as non-treated check in the present study. Termination at early milk growth stage occurred on 24 April 2009, 28 April 2010 and 25 April 2011 (Table 1).
A three-section, straight-bar roller/crimper (SBR) with a chemical termination (SPR) system attached to the tractor through three-point hitch to terminate cereal rye cover crop as a separate operation from cotton planting.

A three-section, smooth roller (SMR) with a chemical termination (SPR) system attached to the tractor through three-point hitch to terminate cereal rye cover crop as a separate operation from cotton planting.

Combined mechanical and chemical termination and cotton planting operations: smooth three-section roller (SMR) attached to the front of tractor through a three-point hitch with a chemical termination (SPR) system to spray glyphosate on rolled cereal rye. On the rear of the tractor, four-row, no-till John Deere drill (MaxEmerge XP) is attached on a three-point hitch to plant cotton directly into cereal rye residue.

Description of treatments (treatment description in rows) for rye termination and planting cotton

a Separate operations (separate) are denoted by ‘−’. Combined operations (combined) are denoted by ‘+’.
b No inclusion in a particular treatment is denoted by ‘X’.
PLTRYE, plant into standing cereal rye.
Rolling was carried out with either a 4.1-m wide straight bar experimental roller with crimper (SBR, Fig. 1) or a 4.1-m wide smooth roller without crimping bars (SMR; Fig. 2) mounted on a 67 kW tractor (Moline, IL, USA). For the treatments with termination at early milk growth stage, the SBR and SMR were mounted on the back of the tractor (standard mounting for separate operations), and for treatments with termination at cotton planting, the SMR was mounted on the front of the tractor (combined operations). For SBR or SMR combined with SPR, the SBR and SMR were equipped with a spray system consisting of a 53-L plastic tank pressurized by an electric 12-V pump and a spray boom with eight nozzles to apply glyphosate at 1.12 kg ai ha−1 on rolled cereal rye residue (Figs. 1 and 2).
Cotton (PhytoGen 375 WRF, Dow AgroSciences, Indianapolis, IN, USA) was planted in rows spaced 91 cm apart on 2 June 2009, 26 May 2010 and 18 May 2011 using a four-row John Deere 1700 Max Emerge XP no-till vacuum planter (Moline, IL, USA) equipped with DAWN™ row cleaners (DAWN Equipment Company, Sycamore, IL, USA; Fig. 3). Cotton plant population data were collected twice a week after seed emergence for 5 weeks. Cotton seed emerged nine DAP in 2009, six DAP in 2010 and eight DAP in 2011 (Table 1). Cotton was harvested on 26 October 2009, 30 September 2010 and 18 October 2011 with a two-row John Deere 9920 cotton picker (Moline, IL, USA; Table 1). Cotton was harvested from the two middle rows (1.82 m wide and 15.2 m long) from each four-row plot and bagged in the field. Bags were immediately weighed to measure seed cotton yield.
For operations with the tractor, fuel consumption was measured with a Corrsys Datron DFL3X-5barsensor system (Kistler Instrument Corp. Novi, MI, USA; Kornecki, Reference Kornecki, Arriaga, Price and Balkcom2016), and operations were carried out at 4.8 km h−1. Since fuel usage associated with separate SPR was not measured, the fuel usage and performance rate was assumed to be 34.1 liters h−1 and 0.0435 ha h−1, respectively, based on a 131 Kw self-propelled sprayer with an 18 m boom operating at 19.3 km h−1 (Laughlin and Spurlock, Reference Laughlin and Spurlock2008; MSU, 2016). To estimate CO2 emissions from fuel consumption, it was assumed that 1 liter of diesel fuel equates to 2.66 kg of CO2.
Rainfall and growing degree days (GDD) were reported for three periods (Table 1): (1) cover crop planting to termination (early milk growth stage); (2) cover crop termination to cotton planting and (3) cotton planting to harvest. GDD for cover crops were calculated as the [(maximum daily air temperature + minimum daily air temperature)/2–4.4°C], where 4.4°C is the lower temperature threshold (Schomberg et al., Reference Schomberg, McDaniel, Mallard, Endale, Fisher and Cabrera2006). For cotton, GDD were calculated as the [(maximum daily air temperature + minimum daily air temperature)/2–15.5°C], where 15.5°C is the lower temperature threshold (Ritchie et al., Reference Ritchie, Bednarz, Jost and Brown2004; Schomberg et al., Reference Schomberg, McDaniel, Mallard, Endale, Fisher and Cabrera2006).
Economic analysis
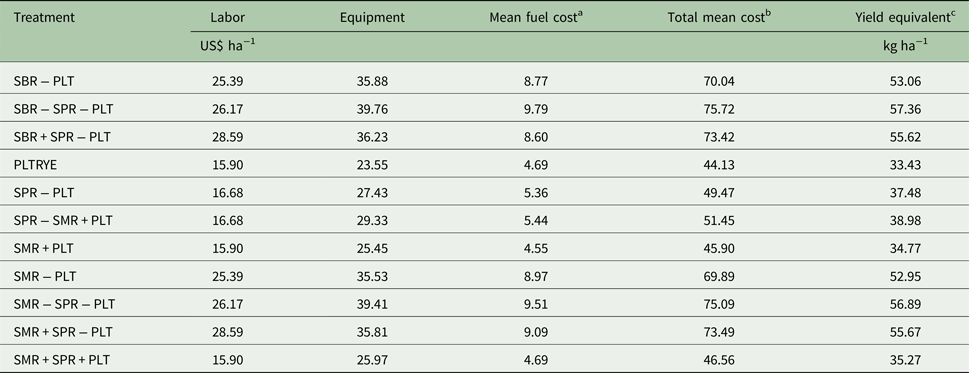
A partial budgeting approach was used to calculate the net returns above treatment costs of each treatment. Net returns (US$ ha−1) were equal to the revenue from cotton minus cost of field operations for corresponding treatment and yield varying costs, including ginning and classing costs and interest on operating capital (Runge, Reference Runge2016). Revenue (US$ ha−1) was comprised of both lint cotton and cottonseed, with prices set at US$1.32 and US$0.25 kg−1, respectively (USDA-NASS, 2016a). Cotton lint was calculated by multiplying the seed cotton yield by the ginning percentage (40%; Duzy et al., Reference Duzy, Balkcom and Price2016; UGA, 2017). Total treatment costs (US$ ha−1) included fuel (US$0.528 Liter−1), repair and maintenance, labor, and fixed costs for machinery ownership for each treatment (Table 3; MSU, 2016). Repair and maintenance were calculated as a percentage of the cost of new equipment, and included oil and lubricants (MSU, 2016; Laughlin and Spurlock, Reference Laughlin and Spurlock2008). Fuel costs were based on fuel usage by treatment by year from the experiment, as well as estimated fuel usage for chemical termination. Labor hours differed by operation based on performance rates (h ha−1), and wage rates differed by type of worker. The wage rate was US$13.40 h−1 for machinery operators, and US$9.06 h−1 for hand labor associated with loading chemical and seed (MSU, 2016). Total treatment costs (US$ ha−1) included total mean costs, interest associated with operating loans, and yield varying costs. Prices and costs used in the analysis were held constant across years to minimize the impact of market conditions, such as fluctuations in fuel costs and commodity prices received by producers.
Production costs (US$ ha−1) and yield equivalent (kg ha−1) by treatment

a The mean fuel cost is based on a fuel price of US$0.53 liter−1.
b The total mean cost is sum of labor, equipment and mean fuel cost.
c Yield equivalent is the kg ha−1 of cotton lint required to offset the total mean cost assuming US$1.32 kg−1 is the cotton lint price.
PLT, plant; SBR, straight bar roller; SMR, smooth roller; SPR, chemical termination; PLTRYE, plant into standing cereal rye; ‘+’, combined with; ‘−’, separate from.
Analysis of variance with SAS/PROC GLIMMIX using maximum likelihood with Laplace approximation (SAS Institute Inc, 2014) was used to analyze the data. The dependent variables were cover crop biomass (kg ha−1), plant population (plants ha−1), cotton seed yield (kg ha−1), total treatment costs (US$ ha−1) and net returns (US$ ha−1). Year, combined operation treatments and the interaction between year and treatments were considered fixed effects, while replication within year was considered a random effect. Main and interaction effects, as well as mean comparisons, were considered significant at an a priori P ≤ 0.10, and treatment means were separated using the Tukey–Kramer procedure. The LSMESTIMATE statement in SAS/PROC GLIMMIX was used to obtain hypothesis tests comparing groups of treatments using the least squares means for treatments.
Seed cotton yield (n = 132) was not normally distributed based on goodness-of-fit tests using SAS/PROC UNIVARIATE. Six plots in 2009 across several treatments had no yield in 2009 due to standing water. These plots were deleted from the data set. Since the response variable plant population was a count of the number of cotton plants, it was assumed that counts had a negative binomial distribution, and the link function was the natural log (Gbur et al., Reference Gbur, Stroup, McCarter, Durham, Young, Christman, West and Kramer2012). The ilink function in SAS/PROC GLIMMIX provided the estimates and standard errors on the inverse linked scale for ease of interpretation.
Results and discussion
Cover crop biomass
Due to differences in weather between years, there were statistically significant differences between years for biomass production; however, a treatment effect and interaction between year and treatment were not detected for biomass production (Table 4). In 2009 and 2011, biomass averaged 7909 and 7326 kg ha−1, respectively, while biomass in 2010 averaged 6578 kg ha−1 (2009a>2011ab>2010b, where different superscripts denote statistical difference at P ≤ 0.10). Cotton harvest was delayed in 2009 due to excess rainfall starting in August. Subsequently, cover crop planting occurred after 1 November in 2009 and the initial fertilizer application was delayed until January 2010. Previous research has shown that cover crop biomass production is affected by establishment and termination date (Duiker, Reference Duiker2014; Balkcom et al., Reference Balkcom, Duzy, Kornecki and Price2015). The 2009 crop year had the second highest cumulative rainfall during the 30-yr period 1980–2010, with approximately 34% of the total rainfall occurring after cotton harvest in 2009. The following cover crop received over 276 mm of rainfall in December 2009, as compared with 82 and 59 mm during the same period in 2008 and 2010, respectively. The 30-yr normal (1980–2010) rainfall for December was 125 mm. The excess rainfall continued into 2010, where rainfall from cover crop planting to termination was 19 and 67% greater than rainfall received in 2009 and 2011, respectively (Table 1). Cover crop growth and biomass potential at termination may have been impeded by excess and high-intensity rainfall. Variability also increased across treatments as reflected by a higher coefficient of variation (CV) in 2010 (CV = 22.7) as compared with 2009 (CV = 16.3) and 2011 (CV = 19.9).
Tests of fixed effects for cover crop biomass, plant population, seed cotton yield, total costs and net returns

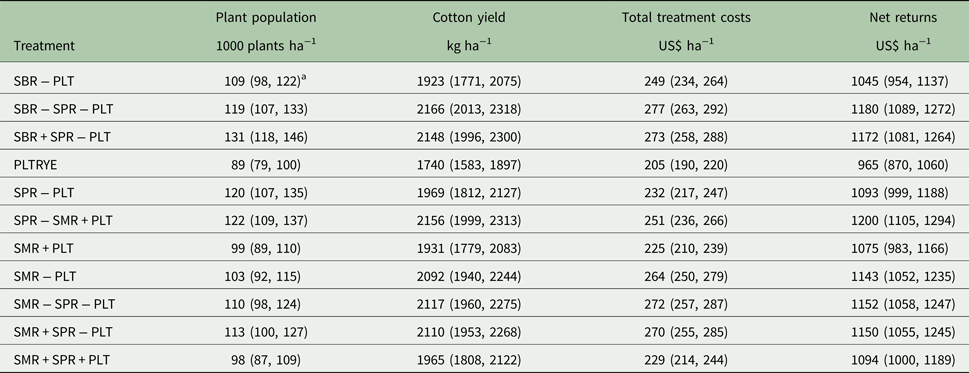
Cotton plant populations (plants ha−1), cotton yield (kg ha−1), total treatment costs (US$ ha−1) and net returns (US$ ha−1) by treatment

PLT, plant; SBR, straight bar roller; SMR, smooth roller; SPR, chemical termination; PLTRYE, plant into standing cereal rye; ‘+’, combined with; ‘−’, separate from.
aValues in parentheses are the 90% confidence limits. Mean comparisons are based on Tukey–Kramer procedure at P < 0.10.
Plant population
Differences in plant population were associated with year, treatment effect and their interaction (Table 4). Across treatments, plant populations were the highest in 2010 followed by 2009 and 2011 (138,952 plant ha−1, 126,131 plant ha−1 and 75,246 plant ha−1, respectively). While there was no statistically significant difference between 2009 and 2010, both were statistically higher than 2011 (data not shown). Lower cover crop biomass in 2010 reduced the potential for poor seed-to-soil contact (Kornecki et al., Reference Kornecki, Raper, Arriaga, Schwab and Bergtold2009a; Balkcom et al., Reference Balkcom, Duzy, Kornecki and Price2015). Drier conditions prior to cotton planting may have contributed to reduced plant populations in 2011 (Table 1).
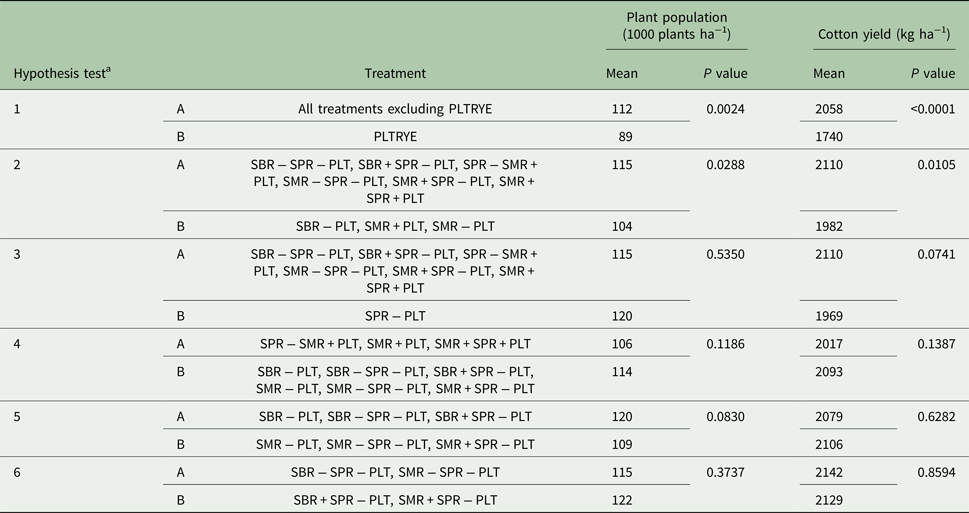
Across years, termination using SBR or SMR with or without SPR resulted in plant populations higher (26%) than PLTRYE (Table 5; Table 6). This result is in agreement with Kornecki et al. (Reference Kornecki, Arriaga, Price and Balkcom2012) and Kornecki (Reference Kornecki2016), who observed higher plant populations in termination using SBR − SPR − PLT compared with PLTRYE. On average, plant populations from treatments with SBR as compared with SMR were 10.3% higher (Table 6). The addition of SPR in conjunction with SBR or SMR increased plant populations by an average of 11.4% as compared with treatments without SPR (Table 6).
Hypothesis tests for cotton plant populations (plants ha−1) and cotton yield (kg ha−1)

a The null hypothesis states that A is not statistically different from B.
PLT, plant; SBR, straight bar roller; SMR, smooth roller; SPR, chemical termination; PLTRYE, plant into standing cereal rye; ‘+’, combined with; ‘−’, separate from.
Cotton yield
Over the course of the study, there was no statistical difference between years (Table 4). Seed cotton yields in 2010 (1833 kg ha−1) were numerically lower than those in 2009 and 2011 (2123 and 2130 kg ha−1, respectively), which was most likely due to lower rainfall and warmer temperatures from cotton planting to harvest (Table 2). The yield difference between those in 2009 and 2011 was <10 kg ha−1, demonstrating that, even with statistically lower plant populations in 2011, cotton has the propensity to produce equivalent yields. This result is in agreement with results from Wrather et al. (Reference Wrather, Phipps, Stevens, Phillips and Vories2008) which demonstrated that greater plant populations do not necessarily produce higher cotton yields. Across years, SBR + SPR and SMR + SPR had higher seed cotton yields than PLTRYE (Table 5). However, yields for PLTRYE were similar to the other single operation treatments (SMR + PLT and SMR + SPR + PLT). Terminating cover crops prior to PLT resulted in average yields over 18% higher than PLTRYE (Table 6). While the type of roller was not significant, including SPR as part of cover crop termination resulted in higher seed cotton yields. Seed cotton yields where cover crops were terminated with both SPR and SBR or SMR were 6.5% higher than with SBR or SMR alone, and 7.2% higher than with SPR – PLT (Table 6). These results are in agreement with Kornecki (Reference Kornecki2016) who observed higher seed cotton yields where cover crops were terminated prior to planting.
Treatment costs and net returns to cotton production
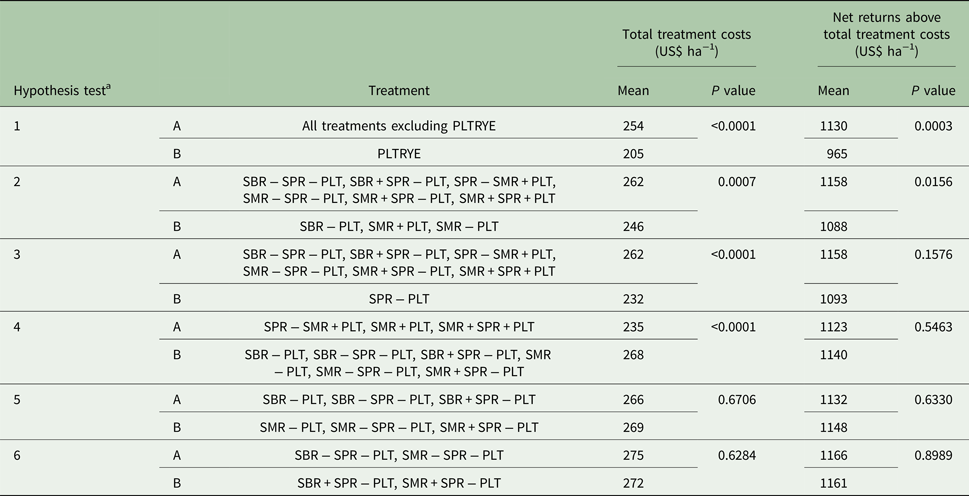
Across years, SBR – SPR – PLT had the highest total treatment cost due to separate SPR and higher yield varying costs as a result of higher yields (Table 5). While PLTRYE had the lowest total treatment cost, it was not statistically lower than SPR – PLT and other single operation treatments (SMR + PLT; SMR + SPR + PLT). Treatments where cover crops were terminated (all treatments except PLTRYE) had 24% higher total treatment costs than PLTRYE (Table 7) due to higher yields and machinery and labor costs, which were supported by results in Kornecki et al. (Reference Kornecki, Price, Raper and Bergtold2009b).
Hypothesis tests for total treatment costs (US$ ha−1) and net returns above total treatment costs (US$ ha−1)

a The null hypothesis states that A is not statistically different from B.
PLT, plant; SBR, straight bar roller; SMR, smooth roller; SPR, chemical termination; PLTRYE, plant into standing cereal rye; ‘+’, combined with; ‘−’, separate from.
Net return results were similar to those of yield and total treatment costs. Net returns in 2009 and 2011 were equivalent with a difference of only US$4 ha−1 (data not shown). While SPR − SMR + PLT had highest net returns, there was no statistical difference between treatments with one exception. Planting into standing rye (PLTRYE) was statistically less than SBR − SPR − PLT, SBR + SPR − PLT, SPR − SMR + PLT, SMR − PLT, SMR − SPR − PLT and SMR + SPR − PLT (Table 5). Terminating cover crops prior to PLT (all treatments except PLTRYE) increased net returns by 17% over PLTRYE (Table 7). Higher yields associated with terminating the cover crop prior to PLT or terminating at PLT resulted in revenues in excess of the higher total treatment costs as compared with PLTRYE. While termination including SBR or SMR and SPR was more costly than SBR and SMR alone, net returns were 6.5% higher due to higher average yields (Table 7). The amount of biomass and number of days between termination and planting may have influenced the need for both SBR or SMR and SPR (Kornecki, Reference Kornecki2016). The total treatment costs and net return results were dependent on the assumptions made regarding the equipment for spraying, as well as other parameters as discussed in Materials and methods.
Labor savings
In the 2015–2016 Cover Crop Survey conducted by CTIC (2016), producers identified time and labor required for planting and managing cover crops as a major challenge to adopting cover crops. Timing of cash crop planting is affected by soil moisture, suitable field days and availability of machinery and inputs due to other farm activities (Edwards and Boehlje, Reference Edwards and Boehlje1980). For producers growing multiple crops across numerous fields, scheduling machinery and labor is necessary for successful and timely planting. Assuming wages changed by 10% across all labor types, total treatment costs increased and net returns decreased for treatments with multiple operations as compared with treatments with fewer operations; however, these changes were small. Changes in total treatment cost and net returns were dependent on labor hours for each treatment, as well as wage rate.
For operations with labor constraints, minimizing machinery operations more efficiently utilizes employees during operations. Moving from three separate operations to SPR − SMR + PLT reduced labor hours per hectare by 32.7%. Converting to a single operation system (SMR + SPR + PLT) reduced the labor hours even further, with a reduction of 51% (or 1.1 h ha−1) from termination and planting using three separate operations. In this analysis, it was assumed that all work was completed by a combination of farmworkers and hand laborers; however, the operator is the primary worker on many operations (USDA-ERS, 2016) and their wage rate is higher than other paid workers due to the opportunity cost of their time and potential for off-farm employment (Mishra and Sandretto, Reference Mishra and Sandretto2002).
Fuel savings
The price paid for farm diesel varies throughout the year, and is a substantial expense to producers. In 2015, the diesel fuel expense for producers in the southern USA was US$990 million (USDA-NASS, 2016a). To evaluate the sensitivity of results to changes in fuel price, the price was increased by US$0.26 liter−1 increments from US$0.528 liter−1. As the price of fuel increased, total treatment costs for treatments with separate operations increased over treatments with combined operations. Subsequently, net returns declined the most for treatments with separate operations (e.g., SBR − SPR − PLT). However, even at US$1.05 L−1, there was little change in differences between treatments. Due to operation speed and tractor size, treatments comprised a small portion of overall fuel use and production cost. The cost savings of fewer operations were small when considered on a per hectare basis; however, when considered over an entire operation, the magnitude increases, especially in years with high fuel prices and low commodity prices.
While economic savings associated with combining operations were small, the overall fuel usage decreased by approximately 43% when converting from SMR − SPR − PLT to SPR − SMR + PLT, and by 51% with converting to SMR + SPR + PLT. Assuming a diesel price of US$0.53 liter and machinery use assumptions, producers with 100 ha of cover crops could realize a reduction total of 916 liters of diesel fuel or US$484.
Environmental impact
Combining rolling with planting reduced CO2 emissions by 43–51% with little effect on net returns. Seed cotton yield, total treatment costs and net returns were not statistically different between SPR − SMR + PLT and SMR − SPR − PLT; therefore, combining SMR with PLT has the potential to provide producers with similar net returns, a smaller carbon footprint (43% reduction), and lower labor costs (US$9.49 ha−1 lower). The same holds true for converting from SMR − SPR − PLT to SMR + SPR + PLT; however, emission reductions and labor costs both decreased by larger amounts (51% reduction and US$10.27 ha−1 lower, respectively). The emission reductions highlighted in this analysis complement prior research demonstrating that eliminating tillage operations reduced emissions (Dyer and Desjardins, Reference Dyer and Desjardins2003; Lal, Reference Lal2004).
Conclusion
This research provides additional insight into cover crop termination options for cotton producers both from an agronomic and economic perspective. Combining rolling and spraying of fall planted cereal rye with cotton planting does not affect cotton yield compared to separate operations, demonstrating that cotton producers have various options for terminating cereal rye depending on the challenges and goals of the operation, such as labor constraints. Furthermore, terminating cereal rye prior to or at planting contributed to higher plant populations, seed cotton yield and net returns compared with planting into standing cereal rye. Additionally, SBR + SPR − PLT and SMR + SPR − PLT generated greater revenues and were more profitable than SBR − PLT and SMR − PLT, especially in years with high biomass and when it may be difficult to leave at least 3 weeks between termination and planting. Combining cover crop termination and cash crop planting reduces fuel usage, CO2 emissions, and machinery and labor hours, which may increase production efficiency.