Introduction
Research in bilingualism, as in psycholinguistics more generally, often involves quantifying constructs of interest by the use of rating scales. In these items, participants are asked to express a belief by selecting a response from an ordered set (e.g., “How well do you speak English?”, ‘0 = not well at all’ to ‘6 = very well’). The use of rating scales is ubiquitous in bilingualism research, in particular as part of the standard bilingualism questionnaires: for example, the Language History Questionnaire (Li, Sepanski, & Zhao, Reference Li, Sepanski and Zhao2006), the Language Experience and Proficiency Questionnaire (LEAP-Q) (Marian, Blumenfeld, & Kaushanskaya, Reference Marian, Blumenfeld and Kaushanskaya2007), and the Bilingual Language Profile (Birdsong, Gertken, & Amengual, Reference Birdsong, Gertken and Amengual2012).
One reason for the extensive use of rating scales is that they have wide applicability: they can be customised to measure many different constructs, including language proficiency (Hakuta, Bialystok, & Wiley, Reference Hakuta, Bialystok and Wiley2003), nativelikeness of speech (Flege, Yeni-Komshian, & Liu, Reference Flege, Yeni-Komshian and Liu1999; Hopp, Reference Hopp2009), frequency of language mixing (Li et al., Reference Li, Sepanski and Zhao2006), language attitudes (Birdsong et al., Reference Birdsong, Gertken and Amengual2012), sentence grammaticality (Cho & Slabakova, Reference Cho and Slabakova2014), and semantic relatedness (Farhy & Veríssimo, Reference Farhy and Veríssimo2019). Despite this heterogeneity, ratings are thought to yield quite valid and reliable measurements of such constructs (Marian et al., Reference Marian, Blumenfeld and Kaushanskaya2007). Ratings are also particularly useful to assess graded quantities in bilingualism research (e.g., language proficiency or dominance). Finally, they are broadly considered to be simple to design, administer, and analyse.
The simplicity and usefulness of rating scales may, however, be deceptive. Concerns have been raised that ratings may be too subjective, variable, and unidimensional to capture complex constructs like language proficiency (Hulstijn, Reference Hulstijn2012; Lemhöfer & Broersma, Reference Lemhöfer and Broersma2012; Tomoschuk, Ferreira, & Gollan, Reference Tomoschuk, Ferreira and Gollan2019; Zell & Krizan, Reference Zell and Krizan2014). Additionally, as discussed below, ratings constitute a type of data that violates the assumptions of the statistical methods that are commonly used to analyse them. As a result, their validity is compromised and the ensuing statistical inferences can be seriously distorted.
The problem
The approach that is near-universally used for the analysis of ratings is to assign a number to each response and then compute descriptive statistics like means and standard deviations, followed by inference from linear models: for example, ANOVAs, t-tests, and linear regressions. The general problem with this approach is that these methods are appropriate only for metric variables, which are continuous and inherently quantitative, whereas rating scales are ordinal variables, in which data consists of ordered, but discrete categories.
The inclination to analyse ratings with metric methods arises because responses can be easily assigned numerical values. However, ordinal data lacks the important property of equidistance between points, which is a requirement for the application of metric methods; that is, the interval between values cannot be assumed to be constant throughout the scale. For example, in the proficiency question of the LEAP-Q, the psychological distance between ‘7 = good’ and ‘8 = very good’ is likely to be larger than that between ‘5 = adequate’ and ‘6 = slightly more than adequate’, due to the distinct verbal labels. Even if exquisite care is taken in devising the labels, there are systematic psychological biases in how responses are perceived (DeCastellarnau, Reference DeCastellarnau2018; Krosnick & Presser, Reference Krosnick, Presser, Marsden and D.2010). For example, extreme responses tend to be avoided (Douven, Reference Douven2018), such that the psychological distance between an endpoint and its adjacent value may be particularly large (e.g., between ‘0 = none’ and ‘1 = very low’ in the LEAP-Q). Likewise, responses on each side of the midpoint may be qualitatively different, and thus perceived to be further apart.
Such tendencies and biases may also vary across tasks, populations, and individuals (Dawes, Reference Dawes2008; Kuncel, Reference Kuncel1977; Schwarz, Reference Schwarz1999). A striking example is that the relationship between self-ratings and objective measures of proficiency may vary as a function of language dominance and the particular languages used (Tomoschuk et al., Reference Tomoschuk, Ferreira and Gollan2019). For example, Spanish–English bilinguals who self-rate as a ‘4’ (on a 7-point scale) have greater objective proficiency than Chinese–English bilinguals, but the difference between groups disappears or reverses for bilinguals who self-rate as a ‘7’. Such results suggest that ratings vary according to an internal ‘frame of reference’, which may in turn differ across bilingual groups.
Consequences of analysing ordinal data with metric methods
If the distances between the values of a rating scale cannot be assumed to be constant, then even the interpretation of a simple mean breaks down. Figure 1 shows how a 7-point proficiency scale may be mentally represented if participants avoid extreme responses and perceive crossing the midpoint as particularly impactful. In this case, the average proficiency expressed by the hypothetical responses {‘2’, ‘3’, ‘4’} is not identical to that expressed by {‘3’, ‘3’, ‘3’}, but actually reflects greater average proficiency. From this we see that when equidistance is violated, the very same metric mean (here, 3) may not express the same underlying quantity; rather, what the mean signifies depends on the particular distribution of responses. This lack of consistency between an underlying quantity and the metric mean naturally extends to effects: that is, to differences between means and regression slopes. Thus, at the very least, estimating ordinal effects with metric methods brings about a serious problem of interpretability.
The hypothetical mental representation of a 7-point scale with unequally-spaced intervals.

Importantly, as demonstrated by Liddell and Kruschke (Reference Liddell and Kruschke2018) with both simulated and real data, metric methods may produce serious inferential errors when applied to rating scales: namely, the detection of effects that do not exist; the failure to detect effects that do exist; and distortions of effect-size estimates. It is even possible for differences to be inverted: that is, for effects in one direction in the underlying construct (e.g., group A has larger proficiency than group B) to turn into effects in the opposite direction when mapped to metric means (e.g., group B > group A) (this can happen when the underlying distributions have different variances; see Liddell & Kruschke, Reference Liddell and Kruschke2018).
A (very) wrong model for ordinal data
The negative consequences described above arise because, in addition to unequal distances between responses, other properties of ordinal data are also fundamentally incompatible with the statistical models commonly used to analyse them. To see how this is the case, consider the following dataset.Footnote 1 Schlenter (Reference Schlenter2019) conducted a study in which bilingual speakers listened to 56 German sentences with canonical and non-canonical orders of thematic arguments. In order to determine the acceptability of the two variants, these sentences were first rated by a group of 42 native speakers, using a 7-point scale (‘1 = not acceptable’…‘7 = very acceptable’).
A typical analysis would involve computing means in the two conditions (canonical: 6.35, non-canonical: 5.76), and then fitting a linear model: for example, a regression with condition as predictor. The results indicate that non-canonical sentences are less acceptable (b=−0.59, t=−9.64). As described above, it is hard to interpret such differences: it is not clear what it means for a construction to have 0.59 ‘units of acceptability’ less, and moreover, if equidistance cannot be assumed, the interpretation of this difference depends on the distribution of responses.
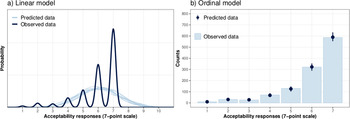
In addition, it can be shown that the assumptions of linear regression are severely violated. This can be assessed with a predictive check, in which instances of ‘predicted data’ are generated from the fitted statistical model and then compared to the observed data that the models were fitted on; this check is shown in Figure 2, panel a. A comparison of the lighter lines (predicted) against the darker line (observed) reveals that the linear model: (a) grossly underestimates the proportions of ‘6's and ‘7's; (b) predicts impossible non-integer responses (e.g., 6.27); and (c) predicts a sizeable proportion of responses outside the 7-point scale.
Predictive checks for a mixed-effects linear regression model (panel a), and for an ordinal model with flexible threshold locations (panel b). These assessments of model quality involve comparing the probability/counts of different responses (given in a 7-point acceptability scale) in data predicted by the fitted models (lighter lines in panel a, and dots in panel b) against the observed data that the models were fitted on (darker line in panel a, and bars in panel b). The two panels depict predicted and observed data differently because the linear model treats responses as continuous and the ordinal model appropriately treats them as discrete.

The mismatches happen because linear models are inherently continuous and assume that errors are normally distributed. In other words, the best inference we can draw from this model is that the observed data in each condition comes from a normally-distributed population. However, because these assumptions yield impossible data, we know that this inference is fundamentally flawed. To be sure, the assumptions of statistical models are never fully satisfied (“all models are wrong”; Box, Reference Box1976). However, linear models with normally-distributed errors are particularly wrong when applied to ordinal data.
A pervasive problem in bilingualism
How widespread is the analysis of ordinal data with metric methods in bilingualism research? Although there are examples of the application of appropriate methods (e.g., Kissling, Reference Kissling2018; Tare et al., Reference Tare, Golonka, Lancaster, Bonilla, Doughty, Belnap, Jackson, Sanz and Morales-Front2018), this is far from common. We quantified this tendency by searching for all articles published in Bilingualism: Language and Cognition in 2019–2020, containing the words ‘rating’ or related words. Forty-six articles analysed ordinal data, mostly proficiency ratings. Of these, only 3 appropriately summarised it with counts instead of means, but skipped inferential statistics or reported inappropriate ones; only 2 used a method that can be applied to ordinal data (Spearman's correlation), but still computed means. No article used both descriptive and inferential statistics that respect the properties of ordinal data. The remainder of this article describes and exemplifies a solution to this pervasive problem.
The solution
A better statistical model for ordinal data should fulfil the following requirements: first, predict discrete response categories, rather than continuous outcomes; second, accommodate non-normal response distributions; and third, allow for unequal distances between responses. Ordinal models satisfy all three requirements (McCullagh, Reference McCullagh1980; McKelvey & Zavoina, Reference McKelvey and Zavoina1975), and they are relatively simple for psycholinguists to fit, using readily-available software.
The particular class of ordinal model we describe here is the thresholded-cumulative model. Its basic idea is to assume an underlying latent continuous variable (e.g., proficiency), which is mapped to proportions of observed responses by being ‘discretised’: that is, chopped into intervals by thresholds placed at different points. Figure 3 shows an example (described in greater detail below). The normal distribution represents the variability of the latent variable (i.e., more or less proficiency) and the vertical thresholds divide the distribution into ordered responses (‘1’…‘7’). The proportion of ‘1's is given by the area under the curve up to the first threshold; the proportion of ‘2's by the area between the first two thresholds, etc. The threshold locations are estimated from the observed proportions, and, in this way, we can model how the construct of interest is mapped to the responses.
Ordinal model with flexible thresholds fitted to responses given on a 7-point proficiency scale (data was simulated in order to have unequal distances between responses). Estimates of each threshold are shown by vertical lines, with their 95% credible intervals at the bottom of each line. Predicted probabilities of each response (‘1’ to ‘7’) correspond to the areas of the distribution bounded by the thresholds. Arrows indicate the ‘true’ threshold locations from which the data was generated. The latent distribution is assumed to be normal with mean = 0, SD = 1.

In the next sections, we provide practical examples of fitting, interpreting, and assessing ordinal (thresholded-cumulative) models in the R programming language (R Core Team, 2020). Models will be constructed in the framework of Bayesian statistics, with the easy-to-use package brms (Bürkner, Reference Bürkner2017). We opt for a Bayesian approach, because such models: (a) typically provide greater flexibility and can be easily extended in complexity (Bürkner, Reference Bürkner2018; Bürkner & Vuorre, Reference Bürkner and Vuorre2019); (b) converge more easily on accurate values (Liddell & Kruschke, Reference Liddell and Kruschke2018); (c) provide a more natural and informative quantification of uncertainty, because each quantity is accompanied by a full probability distribution (McElreath, Reference McElreath2020). However, note that ordinal models in a frequentist framework provide another valid solution for analysing ratings (see ordinal package; Christensen, Reference Christensen2019).
The current article is a brief introduction to the application of Bayesian ordinal models, with examples drawn from bilingual research. It does not constitute a full tutorial, as the examples below sidestep several issues that would be considered in a real analysis.Footnote 2 For more detailed tutorials and comprehensive treatments of Bayesian analyses, see Bürkner and Vuorre (Reference Bürkner and Vuorre2019), Vasishth, Nicenboim, Beckman, Li, and Kong (Reference Vasishth, Nicenboim, Beckman, Li and Kong2018), and Schad, Betancourt, and Vasishth (Reference Schad, Betancourt and Vasishth2020).
Modelling unequal distances
The modelling of unequal distances can be better understood by comparing models with and without equidistance. We will make use of a simulated dataset of proficiency ratings, consisting of the (randomly generated) responses of 1,000 participants, given on a 7-point scale. The dataset aims to represent a heterogeneous group of L2 speakers with a mean level at the midpoint of the scale. Importantly, the data was generated assuming a representation similar to that in Figure 1: that is, with unequal distances between values. The counts of each response are shown in Figure 4 below (as bars), and suggest an exaggerated tendency for choosing the midpoint of the scale.
Predictive checks for ordinal models with flexible thresholds (full dots) and equidistant thresholds (empty triangles). These assessments of model quality involve comparing the probability/counts of different responses (given in a 7-point acceptability scale) in data predicted by the fitted models (dots and triangles) against the observed data that the models were fitted on (shown as bars).

We use the brm() function to fit two (Bayesian) thresholded-cumulative models to this dataset. We use a probit link function, which means that we assume a normally-distributed latent variable. In the first model (m.equidistant), the distance between each threshold is assumed to be the same:
m.equidistant <- brm(Response ~ 1,
data = ratings.unequal,
family = cumulative(link=“probit”, threshold=“equidistant”))
In the second model (m.flexible), we allow consecutive thresholds to be estimated at any distance from one another:
m.flexible <- brm(Response ~ 1,
data = ratings.unequal,
family = cumulative(link=“probit”, threshold=“flexible”))
A summary of the flexible model is shown in Table 1 with estimates of each threshold's position and associated 95% credible intervals (this is the range within which a parameter falls with 95% probability). The estimates are expressed in standard deviation (SD) units; for example, the first threshold (labelled Intercept[1]) is 1.92 SDs below the mean of the latent distribution. The thresholds are more easily interpreted when visualised, as in Figure 3. In order to capture the observed proportions of each response (‘1’ to ‘7’), the thresholds are estimated to be closer together (e.g., second and third thresholds) or further apart.
Summary of a model with flexible thresholds, with estimates and 95% credible intervals for the position of each threshold. For comparison, estimates from the equidistant model are also displayed, as well as the ‘true’ population values which were used to generate the data.

The arrows at the bottom of Figure 3 depict the ‘true’ population values, which in this case (and unlike with real data) are already known. The models can be assessed by whether they can recover these underlying parameters, and it can be seen that the flexible model does a very good job. The equidistant model fares worse (see Table 1), especially for the third and fourth thresholds, which are estimated as much closer together than the population values.
One way of assessing a model's goodness-of-fit is the previously discussed predictive check, in which data samples are predicted from the fitted model and compared to the observed data. For Bayesian models, these checks can be easily conducted with the pp_check() function; we use bar plots because the models are discrete rather than continuous:
pp_check(m.equidistant, type=“bars”, nsamples = 100)
pp_check(m.flexible, type=“bars”, nsamples = 100)
The results are displayed in Figure 4 (in a single plot), and show that the equidistant model severely underestimates the number of ‘4’ responses and overestimates the number of ‘3’ and ‘5’ responses. By contrast, the predictions of the flexible model are very close to the observed data. Another way of assessing models is to formally compare them: for example, with cross-validation (Bürkner, Reference Bürkner2017; Vasishth et al., Reference Vasishth, Nicenboim, Beckman, Li and Kong2018); this also shows an advantage for the flexible model (see Appendix S1 in the Supplementary Material).
From the various comparisons, we would conclude that flexible thresholds are necessary to appropriately model this dataset, and by extension, that the psychological distances between response values are not constant across the scale. In particular, the estimated threshold locations show that ‘5’ responses actually express greater underlying proficiency than a metric 5 (and ‘3’ responses express lower proficiency than a 3), so that the difference between a ‘3’-participant and a ‘5’-participant should be interpreted as particularly large. Such inferences about how the underlying construct relates to the observed responses are missed when metric models are used, and are an important advantage of ordinal models.
Effects of categorical predictors
To illustrate how the effects of predictors are estimated in ordinal models, we go back to Schlenter (Reference Schlenter2019)'s dataset, in which canonical and non-canonical sentences were rated on a 7-point acceptability scale. In thresholded-cumulative models, effects are estimated in the same way as in linear regression (i.e., by ‘shifting’ the mean of a normal distribution), but they take place at the latent variable, rather than on metric responses.
We fit a (mixed-effects) thresholded-cumulative model with condition (canonical, non-canonical) as predictor. Because each participant and item are associated with multiple responses, participant and item are included as random effects:
m.canonicity <- brm(Response ~ (1|Participant) + (1|Item)+Condition,
data = acceptability.ratings,
family = cumulative(link=“probit”, threshold=“flexible”))
The effect of condition on acceptability is estimated as -0.68 [-0.83, -0.54] (see model summary in Table S1 in the Supplementary Material). The effect is expressed in SD units, which in this case can be interpreted as a standardized effect size, similar to Cohen's d (Reference Cohen1988; Glass, McGaw, & Smith, Reference Glass, McGaw and Smith1981). Both the effect's magnitude and its narrow credible interval indicate a substantial difference between conditions, with lower acceptability for non-canonical sentences.
An important aid to interpretation is the examination of the model's conditional effects: that is, the predicted proportions of responses in each condition:
conditional_effects(m.canonicity, categorical = T)
The predictions indicate that canonical sentences have very high acceptability, with a large proportion of ‘7 = very acceptable’ responses (64% [52, 75]); also see Figure S1 in the Supplementary Material. The proportion of ‘6's is lower but still substantial (28% [20, 34]), and other responses are less frequent (‘5’ responses: 6% [3, 10]). In turn, the lower acceptability of non-canonical sentences is expressed by a much smaller proportion of ‘7's (37% [26, 49]), and by more lower-acceptability responses (‘6’ responses: 38% [34, 42]; ‘5's: 14% [10, 19]).
Such predictions are finer than those obtained from the linear model above (cf. ‘0.59 less acceptability’), because they are expressed as probabilities of discrete responses and not in the inappropriate metric scale. Note also that these proportions are not calculated directly from the data. Rather, they constitute better, more generalisable inferences, because they come from a model that: (a) estimates the effect of condition across all responses; (b) takes into account the whole structure of the data in terms of its participants and items; and (c) can potentially include other sources of information, like adjustments for covariates.
Finally, we assess the model's goodness-of-fit with a predictive check, displayed in Figure 2, panel b:
pp_check(m.canonicity, type=“bars”, nsamples = 100)
Whereas the predictions of the linear model seriously mismatched the data (see above), the ordinal model fares remarkably well, and readily accommodates both the discreteness of responses and their non-normality.
Effects of continuous predictors
The usefulness of examining the model's conditional effects is particularly clear in the case of continuous predictors. To illustrate, we will make use of a dataset collected by Puebla (Reference Puebla2016) in which 55 second language German speakers self-rated their speaking proficiency on a 7-point scale (responses covered only the four highest categories, ‘functional’, ‘good’, ‘very good’, and ‘nativelike’). We will estimate the effect of age of acquisition (AoA) on self-ratings of proficiency (see, e.g., Hakuta et al., Reference Hakuta, Bialystok and Wiley2003).
Responses were coded as categories (e.g., ‘good’), so we first establish their order, and then fit a thresholded-cumulative model with AoA as a continuous predictor:
proficiency.ratings$Response <- ordered(proficiency.ratings$Response, levels = c(“functional”, “good”, “very good”, “nativelike”))
m.aoa <- brm(Response ~ AoA, data = proficiency.ratings,
family = cumulative(link=“probit”, threshold=“flexible”))
The effect of AoA on the latent proficiency variable is estimated as -0.15 [-0.22, -0.09] per year (see model summary in Table S2 in the Supplementary Material). Thus, the effect across the whole AoA range (4–24 years) is 3 SDs on the latent scale, indicating a large difference between early and late bilinguals, with lower proficiency at later AoAs.
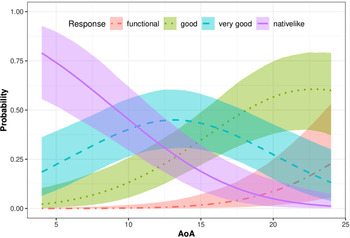
We plot the conditional effects of this model (Figure 5):Footnote 3
conditional_effects(m.aoa, categorical = T)
Effect of AoA on self-rated speaking proficiency. Separate predictions are plotted for each response category (i.e., different probabilities for ‘functional’, ‘good’, ‘very good’, ‘nativelike’). Given that responses are mutually exclusive, their predicted proportions add up to 100% at each AoA. Note that even though the model predicts an AoA effect for each response category, all predictions arise from a single (linear) effect of AoA on the latent proficiency variable. Shaded bands indicate 95% credible intervals. Data from Puebla (Reference Puebla2016).

At the earlier AoAs there is a predominance of ‘nativelike’ responses. As AoA increases, ‘nativelike’ responses decline sharply and there is an increase in the proportions of the lower-proficiency categories (i.e., ‘nativelike’ responses are progressively replaced by ‘very good’ and ‘good’ responses). By an AoA of 13, all three top proficiency choices are likely responses, but there is a predominance of ‘very good's. As AoA increases further (after puberty), the most common response becomes ‘good’ and some ‘functional’ responses start emerging.
These inferences are much more informative than what could be afforded by a linear model, because predictions (and their uncertainty) are appropriately expressed in terms of the different response categories.
Conclusions
We have shown how Bayesian ordinal models are an appropriate solution for the analysis of rating scales, since they respect the discreteness of responses, conform to statistical assumptions, and allow modelling unequal psychological distances. This last aspect is particularly relevant for estimating language proficiency, given that bilinguals of different groups can adopt different frames of reference in self-ratings (Tomoschuk et al., Reference Tomoschuk, Ferreira and Gollan2019). We note that ordinal models are not a panacea against all subjective biases in ratings; they should ideally be complemented by objective measures (Hulstijn, Reference Hulstijn2012; Lemhöfer & Broersma, Reference Lemhöfer and Broersma2012). Nevertheless, ordinal models can incorporate some of those biases by modelling how underlying constructs like proficiency map to ordered responses. As a result, they provide more valid and accurate inferences than the metric methods that are currently used in bilingualism research.
Supplementary materials
For supplementary material accompanying this paper, visit https://doi.org/10.1017/S1366728921000316
Acknowledgements
I thank Laura Anna Ciaccio, Daniela Mertzen, Cecilia Puebla, Judith Schlenter, Nick Pandža, and two anonymous reviewers for helpful comments. I also thank Cecilia Puebla and Judith Schlenter for sharing their datasets and for granting me permission to make them public. This work has been partly funded by the Deutsche Forschungsgemeinschaft (DFG, German Research Foundation) – Project ID 317633480 – SFB 1287, Project Q.