

Diabetes mellitus is a metabolic disorder resulting from defects in insulin secretion or insulin action or both. Insulin is a potent regulator of glucose level in circulation, but insulin production is abolished in type-2 diabetes after prolonged insulin resistance and also in type-1diabetic subjects. Experimentally, type-1 diabetic conditions in rats can be induced by intraperitoneal administration of streptozotocin (STZ) which causes necrosis in pancreatic β-cells. Insulin is produced by β-cells which also carry GLUT-2 transporters on their surface. STZ is transported to β-cells via GLUT-2 transporters. It can cause genotoxicity as well as can result in increased oxidative stress due to nitric oxide release and production of reactive oxygen species (Simmons, Reference Simmons2006; Friederich et al. Reference Friederich, Hansell and Palm2009; Raza et al. Reference Raza, Subbuswamy, John and Avadhani2011). Rats are considered diabetic when fasting glucose level exceeds 126 mg/dl and rats become positive for glucosuria on 2 consecutive days (Agrawal et al. Reference Agrawal, Sahani, Tuteja, Ghorui, Sena, Gupta and Kochar2005b). In human diabetic subjects, besides fasting glucose level higher than 126 mg/dl, plasma glucose level remains above 200 mg/dl after 2 h of glucose uptake in oral glucose tolerance test (OGTT) (Bastaki, Reference Bastaki2005). The level of glycosylated haemoglobin (HbA1c) is now considered a better index for diabetes over measurement of fasting glucose or blood glucose after 2 h of glucose intake. HbA1c level provide information on overall blood glucose status in preceding 2–3 months. In non-diabetic, the HbA1c level is ≤6·0%, whereas in diabetic patients, the level increases above 6·2% (Koro et al. Reference Koro, Bowlin, Bourgeois and Fedder2004). Extent of severity of diabetes is related to the level of HbA1c. Also, as the disease progresses, tissue or vascular damage ensues, leading to severe diabetic complications such as retinopathy, neuropathy, nephropathy, cardiovascular complications and ulceration. Disturbance in glucose homoeostasis can lead to disturbance in cholesterol homoeostasis (Lemhadri et al. Reference Lemhadri, Hajji, Michel and Eddouks2006; Ebuehi et al. Reference Ebuehi, Ajuluchukwu, Afolabi, Ebuehi and Akinwande2009; Wang et al. Reference Wang, Li, Liu, Hu, Jin, Liu, Mei and Liu2012).
Milk is a complex biological fluid and is comprised of protein, fat, lactose, minerals, vitamins and many minor components. Milk is considered almost complete food. Milk composition varies from species to species. Camel milk lacks β-lactoglobulin and β-casein which are main causative agents of allergy in bovine milk (Merin et al. Reference Merin, Bernstein, Bloch-Damti, Yaagil, van Creveld, Lindner and Gollop2001; Shabo et al. Reference Shabo, Barzel, Margoulis and Yagil2005). In comparison to bovine milk, camel milk contains high content of zinc, manganese, copper and Vitamins C, E and A (Gorban & Izzeldin, Reference Gorban and Izzeldin1997; Al-Awadi & Srikumar, Reference Al-Awadi and Srikumar2001; Nikkah, Reference Nikkah2011) and thus can exert better antioxidative effects. Camel milk fat is also easily digested due to its small size of fat globules (Meena et al. Reference Meena, Rajput and Sharma2014). Short chain fatty acids, which are also present in milk fat, are known to enhance immune functions, lower heart disease and exhibits antimicrobial activity (Elagamy, Reference Elagamy2000; Khay et al. Reference Khay, Idaomar, Castro, Bernardez, Senhaji and Abrini2011). Similarly, monounsaturated fatty acids, also a part of milk fat, can lower LDL-cholesterol and total cholesterol. On the other hand, saturated fatty acid, which is abundantly present in milk fat, exhibits hypercholesterolemic effect (Bravo et al. Reference Bravo, Flora, Cantafora, De Luca, Tripodi, Avella and Botham1998). Preliminary results from human subjects suggest that camel milk reduces blood glucose, HbA1c levels and requirement of insulin for treating diabetic human patients (Agrawal et al. Reference Agrawal, Beniwal, Sharma, Kochar, Tuteja, Ghorui and Sahani2005a, Reference Agrawal, Dogra, Mohta, Tiwari, Singhal and Sultania2009; Mohamad et al. Reference Mohamad, Zekry, Al-Mehdar, Salama, El-Shaieb, El-Basmy, Al-said and Sharawy2009; Kotb-El-Sayed et al. Reference Kotb-El-Sayed, Al-Shoeibi, EI-Ghany and Atef2011) or experimental rats (Agrawal et al. Reference Agrawal, Kochar, Sahani, Tuteja and Ghorui2004, Reference Agrawal, Sahani, Tuteja, Ghorui, Sena, Gupta and Kochar2005b; Hassan & Bayoumi, Reference Hassan and Bayoumi2010). Also, cow milk can reverse the atherosclerotic process in experimental rabbits (Aggarwal & Kansal, Reference Aggarwal and Kansal1992). In view of these indications, it is not conclusively clear whether all milks can exert anti-diabetic effect and if so, whether the effect is species specific. In present work, the anti-diabetic potential of goat, camel, cow and buffalo milk is assessed.
Materials and methods
Animals
Forty eight male albino rats of Wistar strain of eight weeks old and similar body weight (200–250 g) were obtained from Small Animal House of National Dairy Research Institute (NDRI), Karnal, Haryana, India. Rats were housed in polycarbonate cages at a temperature (24 ± 2 °C) and relative humidity (55 ± 10%), with a 12:12 h light-dark cycle. This study was approved and maintained in accordance with the Institutional Animal Ethics Committee (IAEC) under the national guidelines of Committee for the Purpose of Control and Supervision on Experiments on Animals (CPCSEA).
Diet
The components of the standard diet (SD) included starch (53·2%), casein (20%), sucrose (10%), fat (7%), cellulose (5%), methionine (0·3%), vitamin mixture (1%) and mineral mixture (3·5%). The vitamin and mineral mixture were prepared according to AOAC (1990). After acclimatisation for one week on standard diet, rats were made diabetic by streptozotocin (STZ) (50 mg/kg of body weight) injection. STZ was freshly prepared in 0·1 m citrate buffer (pH 6·3) and administered intraperitoneally after 12 h of food deprivation. On third day, blood was drawn by puncturing tail vein using lancet for measuring glucose level by glucometer (GlucoDr blood glucose test meter, Germany). Rats having blood glucose level greater than 200 mg/dl were considered diabetic and used in the study. Also, 8 rats in non-diabetic control group were administered citrate phosphate buffer instead STZ. Diabetic rats were divided into five different groups having 8 rats in each group and were fed on diet as mentioned below.
-
1. Non-diabetic Control group: SD
-
2. Diabetic Control group: SD
-
3. Diabetic + Goat group: SD + Goat milk (3% fat)
-
4. Diabetic + Camel group: SD + Camel milk (3% fat)
-
5. Diabetic + Cow group: SD + Cow milk (3% fat)
-
6. Diabetic + Buffalo group: SD + Buffalo milk (3% fat)
Goat, cow and buffalo milk were collected from cattle yard of the institute. Camel milk was obtained from National Research Centre on Camel, Bikaner, Rajasthan, India. Fat percentage of milk was adjusted to 3%. 50 ml milk was offered per rat per day at 9:00 AM every day and was taken voluntarily. Diet was provided ad libitum during 28 d experimentation.
Body weight, blood glucose, oral glucose tolerance test (OGTT)
Body weight and fasting blood glucose level of all groups were recorded weekly. OGTT was performed between 09:00 and 11:00 AM after 8 h of fasting on the 28th day (before sacrifice). Glucose (2 gm/kg body weight, 200 gm/l solution) was administered by gavage. Blood was drawn by puncturing the tail vein with lancet before and after 30, 60, 90 and 120 min glucose administration.
Measurement of HbA1c, FFAs, insulin and lipids
Animals were sacrificed by cervical dislocation. Blood was collected through heart puncture in EDTA coated vaccutainers. Aliquots of blood were prepared for estimation of HbA1c and free fatty acids (FFAs). A portion of blood was also subjected to centrifugation (1600 g , 10 min, 4 °C) for collection of plasma. Insulin and lipids were estimated in plasma.
HbA1c
HbA1c was measured by enzymatic ELISA kit as per manufacturer (Crystal Chem Inc., USA) instructions.
FFAs
Free fatty acids (FFAs) were estimated according to the method of Itaya (Reference Itaya1977). Standard curve was prepared by using different concentrations of oleic acid which was also processed in the same way as in the case of test samples. The FFAs concentration was calculated from standard curve and expressed as mg/dl.
Plasma insulin
Insulin was assayed by sandwich ELISA kit following manufacturer (Crystal Chem Inc., USA) instructions.
Plasma lipids
Total cholesterol (TC), triglycerides (TGs) and high density lipoprotein cholesterol (HDL-C) were estimated using kits (Span diagnostics Ltd. Surat, India). Low density lipoprotein cholesterol (LDL-C), very low density lipoprotein cholesterol (VLDL-C) and atherogenic index (AI) were calculated using Friedewald's equation (Friedewald et al. Reference Friedewald, Levy and Fredrickson1972).
Measurement of cholesterol and TGs in liver
Liver was washed with 0·2 m phosphate buffer saline (pH 7·4). A portion of liver tissue was weighed and homogenised in chloroform: methanol (2 : 1) mixture. Lipids were extracted in accordance to the method described by Folch & Slane-Stanley (Reference Folch and Slane-Stanley1957). Cholesterol and TGs were estimated using kit (Span diagnostics Ltd. Surat, India).
Preparation of tissue homogenate and RBC lysate
Tissues (pancreas, kidney and liver) were homogenised in 10 volumes of ice cold phosphate buffer (50 mm, pH 7·4) and centrifuged at 700 g for 10 min. Supernatant was collected and used for assay of catalase, GPx, SOD, TBARS and PCs. RBC lysate: RBCs were collected after centrifugation (1600 g , 10 min, 4 °C) of blood and pellet was washed with 0·9% NaCl. RBC lysate was prepared by diluting 1 volume RBC with 9 volumes of cold distilled water (Matkovics et al. Reference Matkovics, Szab and Sz Varga1988) and was used for assay of catalase, SOD and GPx.
Assay of antioxidative enzymes in pancreas, kidney, liver and RBCs
Catalase assay
The catalase activity was estimated by the method of Aebi (Reference Aebi1984). The enzyme activity in sample was calculated using extinction coefficient of 0·0394 mm/cm and expressed as μm of H2O2 consumed/mg/min or Units/mg/min at 240 nm.
Glutathione peroxidase (GPx) assay
The GPx activity was assayed spectrophotometrically by the method of Paglia & Valentine (Reference Paglia and Valentine1967). The method uses excess of glutathione reductase that couples the rate of oxidation of NADPH to reaction of the peroxidase with H2O2 and glutathione (reduced). The oxidation of NADPH was monitored by measuring change in absorbance at 340 nm as a function time. The enzyme activity was calculated using extinction coefficient of 6·22 mm/cm, where unit enzyme activity is one mm of NADPH oxidised per min or Units/mg/min.
Superoxide dismutase (SOD) assay
The SOD activity was assayed by the method of Marklund & Marklund (Reference Marklund and Marklund1974). The inhibition of pyrogallol auto-oxidation by SOD at 420 nm is a measure of enzyme activity in this method. The amount of enzyme that inhibited the auto-oxidation of pyrogallol by 50% is defined as one unit of enzyme activity.
Oxidative damaged products in pancreas, kidney, liver and plasma
TBARS
Lipid peroxidation in tissues and plasma was estimated by the method of Nichans & Samuelson (Reference Nichans and Samuelson1968). In this method, malondialdehyde and other thiobarbituric acid reactive substances (TBARS) were measured by their reactivity with thiobarbituric acid in acidic conditions to generate a pink coloured chromophore which was read at 535 nm. Values are expressed as mm/mg. Standard curve was prepared by carrying out overnight digestion of different amounts (8–40 nm) of 1, 1, 3, 3- tetraethoxypropane in presence of 0·2 N HCl.
Protein carbonyls (PCs)
PCs formation was measured by the method of Levine et al. (Reference Levine, Garland, Oliver, Amici, Climent, Lenz, Ahn, Shaltiel and Stadtman1990) modified by Bejma & Ji (Reference Bejma and Ji1999). Carbonyl content was calculated using a molar absorption coefficient of DNPH, 22 mm/cm at 360 nm and expressed as nm dinitrophenylhydrazone carbonyl adduct per mg protein.
Estimation of haemoglobin and protein
Haemoglobin was estimated using haemoglobin estimation kit which uses Drabkin reagent (Drabkin, Reference Drabkin1950). Protein was estimated according to the method of Lowry et al. (Reference Lowry, Rosebrough, Farr and Randall1951).
Statistical analysis
All the results are expressed as mean ± sem. Using GraphPad PRISM version 5.0 statistical software package, analysis of variance was performed and differences between the groups were tested using Tukey post-hoc test.
Results
Body weight
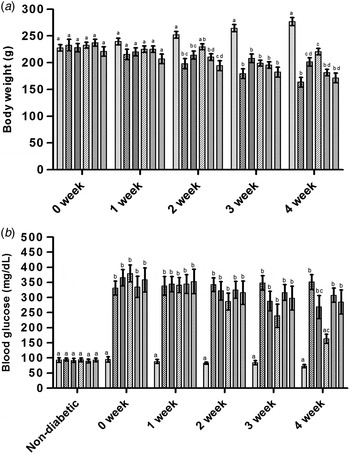
Just after 2 weeks, body weight decreased significantly in diabetic control group as compared to control group. Goat and camel milk helped in partial restoration of body weight loss and the effect was visible only after 4th week of feeding. Cow or buffalo milk failed to restore body weight loss (Fig. 1a).
Effect of milk feeding to diabetic rats on (a) body weight and (b) blood glucose levels during 4 week period Groups: Non-diabetic Control ( ); Diabetic Control (
 ); Diabetic + Goat (
 ); Diabetic + Camel (
 ); Diabetic + Cow (
 ); Diabetic + Buffalo (
 ). Values are expressed as mean ± sem. Similar alphabets indicate non-significant difference (P ≥ 0·05). Dissimilar alphabets indicate significant difference (P < 0·05).

Blood glucose, HbA1c and OGTT
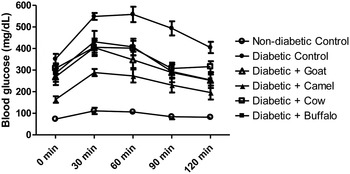
STZ treatment resulted in more than threefold increase in blood glucose level (Fig. 1b). There was no significant difference in blood glucose amongst diabetic groups and glucose level varied from 331 to 379 mg/dl. Administration of milk from different species to diabetic rats for 3 week did not show any significant difference in blood glucose level as compared to diabetic control group (Fig. 1b). After 4 weeks of camel milk feeding to diabetic rats, blood glucose level (Fig. 1b) and HbA1c (Table 1) decreased significantly while milk from other species (goat, cow, buffalo) failed to decrease blood glucose level and HbA1c. In OGTT, the area under curve (AUC) in diabetic control group has increased 5·2 times as compared to non-diabetic control group (Fig. 2). AUC was found to decrease in all milk groups and is in the order of: non-diabetic control (11 368) <diabetic + camel (29 169) <diabetic + goat (39 061) <diabetic + buffalo (42 065) <diabetic + cow (42 823) <diabetic control (59 348). Among these groups, camel milk group has the lowest AUC but it is still 2·5 times greater than the non-diabetic control group (Fig. 2).
Effect of milk on OGTT: Values are expressed as mean ± sem.

Effect of milk supplementation on plasma lipids, plasma insulin, blood HbA1c and blood FFA in diabetic rats

Values are expressed as mean ± sem
Similar superscript alphabets indicate non-significant differences (P ≥ 0·05) in each column
Dissimilar superscript alphabets indicate significant differences (P < 0·05) in each column
* Measured after 4 weeks of milk feeding
FFAs in blood
Level of FFAs increased significantly in diabetic control group (50·95 mg/dl) as compared to non-diabetic control group (24·75 mg/dl). Amongst the different milks, only administration of camel milk significantly reduced the level of FFAs in diabetic rats to the level present in non-diabetic control group (Table 1).
Plasma insulin
In the diabetic rats, plasma insulin level dropped to 0·05 ng/ml from 0·19 ng/ml after 4 weeks of STZ injection. Dietary supplementation of camel milk for 4 weeks resulted in enhancing the levels of insulin to the level similar to non-diabetic control. This property was noted only with camel milk (Table 1).
Plasma lipids
Diabetes leads to the imbalance in plasma lipid profile. The levels of TC, TG, VLDL-C, LDL-C increased whereas HDL-C decreased significantly in diabetic rats (Table 1). Consumption of camel milk for four weeks resulted in complete restoration of levels of TC, TG, VLDL-C, LDL-C and HDL-C noted in non-diabetic control group. Goat milk also resulted in decrease in LDL-C and increase in HDL-C levels. Except buffalo milk, all milks decreased AI in diabetic rats. Complete restoration AI equal to non-diabetic rats was observed with goat and camel milk. (Table 1).
Liver cholesterol and TGs
There was about 3 fold increase liver cholesterol in diabetic control (12·27 ± 0·82 mg/g) over non-diabetic control (4·01 ± 0·13 mg/g). The levels of cholesterol in goat, camel, cow and buffalo milk fed groups were 9·48 ± 0·57, 6·13 ± 0·50, 10·18 ± 0·52 and 10·79 ± 0·56 mg/g respectively. Although goat milk helped in lowering cholesterol deposition, camel milk was able to lower cholesterol deposition which was comparable to non-diabetic control. Also, the levels of liver TGs increased by 2·7 folds in diabetic control rats (34·03 ± 1·38 mg/g) over non-diabetic control rats (12·33 ± 0·83 mg/g). Camel milk lowered TG concentration to non-diabetic control level.
Antioxidative enzymes
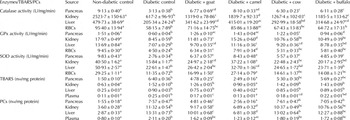
The level of catalase, GPx and SOD in pancreas, kidney, liver and RBCs reflects the capability of overcoming oxidative stress in diabetes. The level of these enzymes decreased in diabetic rats (Table 2). In general, milk helped in restoration of activities of antioxidative enzymes and effect was tissue dependent. Catalase activity in pancreas and kidney was enhanced by feeding either of four milks tested. Except cow milk, all milks also enhanced catalase activity in liver. However, only camel milk was effective in enhancing activities of catalase in RBCs (Table 2). As opposed to cow or buffalo milk, goat and camel milks were effective in enhancing GPx activity in RBCs (Table 2). Buffalo milk was also not effective in enhancing GPx in kidney and liver (Table 2). Buffalo or cow milk failed to enhance SOD in kidney, liver and RBCs (Table 2). Camel milk enhanced SOD activity in all the tissues and RBCs.
Effect of milk feeding for 4 weeks on antioxidant enzymes and oxidative damaged products in diabetic rats

Values are expressed as mean ± sem
Similar superscript alphabets indicate non-significant differences (P ≥ 0·05) in each row
Dissimilar superscript alphabets indicate significant differences (P < 0·05) in each row
Oxidative damaged products
TBARS and PCs levels measure oxidised damaged products. TBARS were measured in pancreas, kidney, liver and plasma from all experimental rats at the end of 28 d study period. Amongst all milks, only camel milk exhibited capability of lowering TBARS in pancreas, kidney, liver and plasma to a level found in non-diabetic rats (Table 2). Goat milk also lowered TBARS in pancreas and plasma. Buffalo milk did not reduce TBARS in tissues and plasma. Cow milk also did not reduced TBARS in tissues. Similar to TBARS, protein carbonyls were also measured in pancreas, kidney, liver and plasma. Camel milk lowered PCs in all tissues and plasma (Table 2). Goat milk was also effective in reducing PCs in pancreas, kidney and liver, not in plasma. Cow or buffalo milk failed to reduce PCs in tissues and plasma (Table 2).
Discussion
Formation of reactive oxygen species (ROS) is crucial for life, however, a fine balance is required between formation of ROS and their removal. Excess formation of ROS can lead to oxidative damage to cell structure and cell function. ROS can be inactivated by antioxidants and antioxidant-enzymes, which can be generated in vivo. Dietary antioxidants can also perform this function. Antioxidants present in milk include vitamin C, uric acid, casein, albumin, vitamin A, vitamin E, carotenoids, ubiquinol, and flavonoids (Zulueta et al. Reference Zulueta, Maurizi, Frigola, Esteve, Coli and Burini2009; Lindmark-Manssou & Akesson, Reference Lindmark-Manssou and Akesson2000). Composition of milk differs from species to species. Camel milk contains high concentrations of vitamins A, B2, C and E and is rich in minerals such as calcium, iron, magnesium, copper, zinc, potassium (Mohamed et al. Reference Mohamed, Mousa and Beynen2005; Al-Humaid et al. Reference Al-Humaid, Mousa, El-Mergawi and Abdel-Salam2010). Magnesium protects the cell against ROS and assists in absorption of vitamins B, C and E which functions as anti-oxidants. In comparison to bovine milk, camel milk exhibits about three fold higher anti-oxidant activity measured in vitro (Chen et al. Reference Chen, Lindmark-Mansson, Gorton and Akesson2003). Feeding of either goat or camel or cow or buffalo milk results in enhanced level of catalase, GPx, and SOD enzymes in pancreas (Table 2). Camel milk also enhances expression of these anti-oxidants enzymes in kidney, liver and RBCs (Table 2). In comparable terms, potency of camel milk vis a vis goat milk in enhancing antioxidant enzymes in pancreas, kidney and RBCs is distinctly higher than goat milk (Table 2). Except pancreas, the effect of cow or buffalo milk in enhancing antioxidant enzymes in kidney, liver and RBCs is either absent or marginal (Table 2). Amongst these milks, only camel milk is effective in enhancing catalase activity in RBCs (Table 2). Also, only camel milk is effective in normalising HbA1c and insulin in diabetic rats (Table 1). These results and other's finding (Celik & Akkaya, Reference Celik and Akkaya2009) suggests that catalase activity and HbA1c are negatively correlated.
Amongst goat, camel, cow and buffalo milks, camel milk appears to be unique since feeding of camel milk to diabetic rats results in complete amelioration of pancreas from oxidative damage as measured in terms of TBARS and PCs (Table 2). Camel milk also minimises oxidative damage to kidney and liver (Table 2). Goat milk was also effective in overcoming oxidative damage to tissues but the effectiveness is lower than camel milk in comparative terms. Cow or buffalo milk does not reduce TBARS and PCs in pancreas, kidney and liver (Table 2). Thus, it can be presumed that camel milk exhibits anti-diabetic properties by ameliorating pancreas, kidney and liver from oxidative damage. Healthy pancreas can restore production of insulin (Table 1) which ultimately facilitates in normalising the level of glucose or HbA1c. Although OGTT suggests that all milk (goat, camel, cow and buffalo) helps in controlling diabetes, HbA1c levels allow concluding that only camel milk has this unique property. Further, camel milk reduces deposition of cholesterol and TGs in liver and lowers FFAs in blood (Table 1). Thus, camel milk not only helps in control of diabetes but also improves lipid profile.
Thus, it can be concluded that higher level of anti-oxidants in camel milk coupled with its capacity to produce anti-oxidative enzymes at enhanced levels in pancreas, kidney, liver and RBCs limits formation of TBARS and PCs to the levels found in non-diabetic subjects and thereby exerts benefit to type I diabetic rats.
The authors would like to thank Indian Council of Agricultural Research, India for providing the funding for this research work.