
I. INTRODUCTION
With the increasing energy demand, it is urgent to develop renewable energy technology to replace traditional fossil energy sources for resisting the worst influence of the climate warming and environment pollution. For energy storage devices, supercapacitors and Li-ion batteries are of great attention in the past decades. In the energy renewable materials, porous materials play a very important role in the materials field due to the majority phases, either with random character (disordered pore systems) or with high regularity (ordered pore systems).Reference Mastai, Polarz and Antonietti1 Among them, ordered porous materials draw great scientific and technological interest owing to the excellent ability to interact with atoms, ions, and molecules not only at the interface but also into their bulk.Reference Davis2 According to the definition of IUPAC (International Union of Pure and Applied Chemists), the pore systems of porous materials have been classified by the pore size. Pores sizes below 2 nm are named as micropores, and the typical materials are microporous zeolites.Reference Hua, Zhou and Shi3 The pores with the size range of 2–50 nm are classified as mesopores, such as mesoporous M41S family and the SBA series.Reference Hofmann, Wallacher, Perlich, Vayalil and Huber4 The pores above 50 nm are denoted as macropores, with the representative materials of porous SiO2 materials.Reference Yang, Chen, Li, Rooke, Sanchez and Su5
As a typical class of nonoxide porous materials, porous carbons play an important role in the wide application of water and air purification due to the advantageous properties, such as a large specific surface area, tunable pore sizes, good thermal and mechanic stability, surface hydrophobicity, and low-cost preparation.Reference Ma, Liu and Yuan6 Most of the porous carbon materials perform microporous, and the corresponding application involves the small molecule-like energy storage and catalysis.Reference Yu, Zhao, Feng, Hu, Zhang, Zeng, Tong and Lu7,Reference Foley8 Furthermore, the appearance of the mesoporous or macroporous carbon materials can provide many other applications, for example, the absorption of large organic molecules and an electrochemical double-layer capacitor. For example, Zhao and his colleges prepared a mesoporous carbon material, which showed excellent adsorption performance for microcystin-LR.Reference Teng, Wu, Fan, Chen, Feng, Lv, Wang, Asiri and Zhao9 Mesoporous carbon fibers fabricated by Qu and his coworkers performed with a high adsorption capacity for bulky dye molecules.Reference Dong, Lin, Jin, Wang, Zhou and Qu10 In the electrochemical capacitor field, Srinivasan Madhavi and co-workers prepared highly mesoporous carbon from Teak wood sawdust, which was used as the prospective electrode for the high energy Li-ion capacitors and delivered a highly reversible capacitance of 70 mA h/g.Reference Jain, Jayaraman, Ulaganathan, Balasubramanian, Aravindan, Srinivasan and Madhavi11 Therefore, there are growing interests in developing the mesoporous and macroporous carbon materials as well as microporous carbon materials.
Since the first example of mesoporous carbon materials, prepared by using mesoporous silica as a hard template at 1999, more and more attention has been paid to the fabrication and application of mesoporous carbon materials in recent years.Reference Yu, Lin, Feng, Zeng, Tong and Lu12–Reference Yan, Cai and Shen14 Sun and her co-workersReference Sun, Yanga and Yan13 synthesized hierarchically porous nitrogen and sulfur co-doped carbon graphene-like microsphere materials as a high capacity anode for lithium ion batteries. Shen’s groupReference Yan, Cai and Shen14 fabricated porous graphitized carbon materials at low temperature with a catalyst precursor of K4[Fe(CN)6], exhibiting good performance for the methanol oxidation reaction compared to the commercial Pt/C electrocatalyst. Porous carbon materials are usually prepared though a template strategy, including the hard-template strategy and soft-template strategy. The hard-template route known as the nanocasting technology involves several following steps: (i) a mesoporous matrix with tunable structure is prepared; (ii) a suitable carbon precursor is introduced into the above matrix template though solution impregnation or chemical vapor deposition; (iii) the organic–inorganic composite is generated by polymerization of the carbon precursor; (iv) carbonization of the organic–inorganic composite is in progress; (v) the template prepared before is removed by a suitable remover solution to produce porous carbon materials. As a result, the structure of the porous carbon performs as a replica of the template. In the past few years, the template in the “hard template” method develops rapidly, including zeolite, Al2O3, MgO, ice, salt, and so on. For instance, Chai and his co-workersReference Chai, Shin and Yu15 have synthesized uniformly ordered macro- and mesoporous carbon materials by the aggregation of polystyrene spheres and silica particles. Kaixue Wang et al. prepared mesoporous carbon nanofibres by Al2O3 membranes hard templating.Reference Wang, Birjukovs, Erts, Phelan, Michael, Zhou and Justin16 And the MgO particle template was also used to produce porous carbon materials with a controllable pore size by Inagaki and co-workers.Reference Zhu and Akiyama17 Sol Yun et al. successfully synthesized hierarchical trimodal porous graphene frameworks by the activation of CO2 (dry ice), exhibiting excellent capacitive performance, which can supply a promising approach of combining self-assembly with conventional activation for the construction of three-dimensional hierarchical structures with multiple porosity.Reference Yun, Kang, Park and Park18 Tang and his co-workers prepared mesoporous carbon materials from the carbon tetrachloride precursor by its self-reduced sodium potassium alloy, with the advantage of facile removal for just the aqueous salt solution, displaying a specific mass capacitance as high as 259 F/g and an outstanding cyclic performance with a capacitance retention of over 92% for 6000 cycles.Reference Tang, Hu, Dai, Yi, Gordin, Chen, Song and Wang19 Even though the “hard template” method could prepare porous carbon materials by successful replication with a special architecture, another widely used route named the “soft-template” for synthesizing directly porous carbon materials has been developed. The steps of ther soft-template route usually are shown as following: (i) a supramolecule alignment of suitable molecules is prepared; (ii) a highly crosslinked composite formed by polymerization at a certain temperature; (iii) the template is removed from the composite; (iv) carbonization. Compared with the “hard-template” route, instead of template aggregation, this soft-template method must rely on the supramolecular self-assembling for the template formation. There is another important point where the removal of the template can be achieved by an easy process of calcination in an inert gas.Reference Xia, Yang and Mokaya20 Moreover, a lot of porous carbon materials with wide pore sizes distributions, with mircopores, mesopores, macropores, or these pore combinations, have been prepared due to the supramolecular self-assembly. For example, hollow-tunneled graphitic N-doped carbon nanofibers were synthesized though the soft-template method with two steps of electrospinning and carbonization by Chengzhou Zhu et al.Reference Zhu, Li, Fu, Du and Lin21 Seung’s group fabricated a kind of porous carbon material with an alterable pore size by the surfactant-templated sol–gel process and carbonization.Reference Lee and Oh22 Fe–N decorated hybrids of CNTs grown on hierarchically porous carbon materials were prepared via a combination strategy of ordered packing polystyrene as the hard template for 3D ordered macropores and F127 polyether as the soft template to form mesopores by Qiao’s group.Reference Liang, Zhou, Chen, Tang and Qiao23 Therefore, the selection of appropriate carbon precursors is of also great importance in the soft-template route, which can mostly preserve the preorganized structure, inspired by the self-assembly driving force including hydrogen-bonding interactions, columbic, and Van der Waals forces. No matter which route of the hard template or soft template is chosen, the porous carbon materials display nearly the same chemical components and similar surface functional groups. However, it exhibits different pore size distributions by these two routes.Reference Inagaki, Kobayashi, Kojin, Tanaka, Morishita and Tryba24 The pore size distributions from the soft-template route appear to be more uniform than those of the hard template. And the phase of the pores prepared by the soft-template strategy can be more easily adjusted via the alternation of different precursors. Furthermore, porous carbon materials from the soft template method perform with a higher thermal stability and mechanical properties than those the from hard-template route due to their thick pore wall and continuous framework.Reference Zhou, Chen, Cao, Lu and Jiang25 In contrast, there are more procedures for the hard-template method. Therefore, the entire procedure of the soft-template strategy is low-cost, simple, convenient, and suitable for large-scale industrial production. Besides the widely used hard-template and soft-template routes, a template-free strategy has obtained popularity for preparing porous carbons materials owing to its facile process nature without the introduction and removal of the template, which is primarily classified into the biomass-derived method and synthetic material-derived method for development in the past few years. The natural biomass materials of the biomass-derived methods were selected as precursors for the preparation of porous carbons materials, including plant-derived materials, animal-derive materials, fungi, and sewage sludge. For instance, Shijiao Song and co-workers synthesized 3D hierarchical porous carbon with hierarchical porosity consisting of macro, meso, and micropores by the biomass-route of KOH pretreatment and direct pyrolysis.Reference Song, Ma, Wu, Ma, Geng and Wan26 Caiyun Zhang et al. fabricated hierarchical porous carbon materials by a facile carbonization and activation process without any extra templates, exhibiting excellent capacitive properties for supercapacitors.Reference Zhang, Zhu, Cao, Li, Li, Liu, Zhu and Wei27 Liu Wan and co-workers synthesized porous carbons materials by nitrile-functionalized benzoxazine with KOH activation, facilitating rapid ionic diffusion and reducing the internal resistance.Reference Wan, Wang, Xie, Sun and Li28 The other template-free method is the synthetic material-derived route, primarily containing the synthetic polymer and synthesized carbon-based materials for further activation. For example, Kim and co-workers prepared sandwich-type ordered mesoporous carbon/graphene nanocomposites derived from ionic liquid of 1-(3-cyanopropyl)-3-methylimidazolium dicyanamide.Reference Kim, Kim, Roh and Kim29 Yat Li’s group fabricated three-dimensional hierarchical graphene aerogels with periodic macropores, which display exceptional capacitive retention (approximately 90% from 0.5 to 10 A/g) and power densities (>4 kW/kg).Reference Zhu, Liu, Han, Duoss, Kuntz, Spadaccini, Worsley and Li30 Ding et al. developed a two-step top-down method to synthesize hierarchical porous carbon sheet stacks using a ternary-layered carbide, Ti3AlC2, with a controllable pore size.Reference Galhena, Bayer, Hofmann and Amaratunga31 In general, the porous carbon materials prepared by the biomass-derived route always contain heteroatoms of the nitrogen and sulfur element, which can offer extra pseudocapacitance, exhibiting higher capacitance than carbon materials with a limited quantity of herteroatoms.
With the growing demand for the electrochemical performance of the porous carbon materials, heteroatom doping carbon materials have attracted great attention in the past years. Heteroatom doping into the porous carbon materials include nitrogen atoms, oxygen atoms, Boron atoms, phosphorus atoms, sulfur atoms, and so on.Reference Liu, Zhang, Songa and Li32 Porous carbon materials doped with the N atom have been developed with the hard-template or soft-template methods rapidly in recent articles. For instance, Porous carbon materials doped with the N atom have been developed rapidly with the hard-template and soft-template methods in recent articles. For instance, nitrogen-doped hierarchical hollow carbon materials were fabricated with a hard-template route.Reference Liang, Wang and Lu33 And these N-doped carbon materials performed with an excellent specific capacitance of 322 F/g at 1 A/g and a high rate capability of 54% capacitance retention at 20 A/g. Xiangwen Yuan et al. synthesized hierarchical porous carbon materials with macro, meso-, and micropores structures, which was composited of 36.8 wt% of nitrogen through the hard-template with ice.Reference Yang, Zhuang, Huang, Jiang, Tian, Wu, Zhang, Mai and Feng34 And, it had a large specific surface area of 776 m2/g and displayed a superior specific capacitance of 335 F/g at 0.1 A/g in 6 M KOH aqueous solution. Wickramaratne and his co-workersReference Wickramaratne, Xu, Wang, Zhu, Dai and Jaroniec35 fabricated nitrogen-enriched porous carbon spheres with the maximum doping ratio of 7.2 wt% in the carbon sphere by the soft-template strategy. The as-prepared carbon sphere materials shows the high specific surface area up to 1224 m2/g and good capacitive performance of 388 F/g at 1.0 A/g. Besides doping N into carbon materials, the O atoms doping method is also used for the promotion of capacitive properties of the carbon materials. Nitrogen- and oxygen-enriched 3D hierarchical porous carbon fibers with a high specific surface area (2176.6 m2/g) and pore volume (1.272 cm3/g) were prepared by a template-free route, which exhibited outstanding capacitive properties.Reference Li, Lu, Zhang, Su, Shen, Zhou and Ma36 Ma et al.Reference Ma, Wu, Song, Ma, Geng and Song37 synthesized oxygen-enriched hierarchical porous carbon materials without a template, which displayed outstanding capacitive properties with a specific capacitance of 345 F/g at 1.0 A/g and a good rate capability. Moreover, B, P, and S atom doping is another choice to enhance the capacitive properties of carbon materials. For example, Hao and his co-workersReference Hao, Yao and Chen38 fabricated B and N codoped porous carbon materials, along with a specific capacitance as high as 262 F/g at 20 mV/s in the 10 mol/L H2SO4 and the outstanding charge–discharge stability. Sulfur-doped composites with hierarchical nanopores prepared by Zhang etc. exhibited a high specific capacitance of 259 F/g at 1 A/g in 6 mol/L KOH aqueous solution.Reference Zhang, Yang, Qiao, Ren and Qiao39 Phosphorus-doped porous carbons with considerable catalytic activity for the oxygen reduction reaction have been fabricated by Wu and co-workers.Reference Wu, Yang, Yang, Sun, Jin, Strasser and Yang40 Above all, the heteroatom doping into the porous carbon materials can supply more pore structures and pore size distributions, facilitating the promotion of the electrochemical properties for the porous carbon materials.Reference Ma, Liu and Yuan6,Reference Ski, Szala and Bystrzejewski41 Except the strategy of heteroatom doping, metal oxides compositing can also enhance the capacitive properties of porous carbon materials. Nb2O5 quantum dots embedded in the N-doped porous carbon materials achieved excellent energy density as high as 76.9 W h/kg, and superior cyclic stability was synthesized by Liu’sReference Liu, Zhou, Liang, Fang, Cai and Liang42 team. Yuxiao Zhou at al. fabricated N-doped porous carbon incorporating Co and CoO, which shows superior excellent catalytic activity for alcohols to esters.Reference Zhou, Chen, Cao, Lu and Jiang25 A Fe/Fe3O4/N-carbon composited with porous materials was synthesized with a superior energy density of 610 mA h/g at 200 mA/g after 100 cycles by Yao Li and co-workers.Reference Li, Meng, Zhang, Sun, Yang, Chen, Zhu, Guo and Zhang43 Zhao Long and his colleagues prepared the porous Fe3O4/carbon composite material with an excellent reversible capacity of 1180 mA h/g at a current density of 100 mA/g.Reference Zhao, Liu, Liu, Wang, Wang and Chen44 MnO2 nanoparticles were also brought into graphitic 3D disordered mesoporous carbon by Patel and co-workers, and these porous carbon materials exhibited 500 F/g MnO2 at 2 mV/s for 8.8 wt% MnO2.Reference Patel, Wang, Stevenson, Ferrer, Dai, Johnston and Stevenson45 On the whole, compositing the metal oxides and porous carbon can adjust the surface functional groups of porous carbon materials and supply extra pseudocapacitance enhancement for the porous carbon matrix.Reference Zhou, Chen, Cao, Lu and Jiang25,Reference Zeng, Yu, Meng, Fang, Lu and Tong46–Reference Wang, Han, Zeng, Qie, Wang, Zheng, Lu and Tong48
Herein, we demonstrate a general and efficient soft-template strategy to fabricate porous carbon nanostructures by the self-assembling of glucose. Two different sizes of pores (sample-A and sample-B) were obtained by simply changing the concentration of the glucose precursor. The final porous carbon nanomaterials after carbonizing exhibited unexpectedly high specific surface area and electrochemical properties. Specifically, the as-prepared sample-A electrode possesses a high specific surface area of 476.39 m2/g, nearly almost the double than that of the sample-B electrode (280.94 m2/g). A remarkable mass specific capacitance of 211 F/g is achieved by the sample-A electrode at a current density of 4 A/g, which is nearly three times higher than that of the sample-B electrode (78.6 F/g). Furthermore, the Sample-A electrode also exhibits superior durability with 94.19% capacitance retention after 5000 cycles, which is also higher than that of the sample-B electrode (about 84.28%).
II. EXPERIMENT SECTION
A. Preparation of the porous carbon materials
Porous carbon nanomaterials were synthesized by a modified soft-template method as the previous work reported.Reference Lu, Cao, Zhang and Zhang49 Firstly, 0.02 mol glucose powder and 0.02 mol Zn(NO3)2 were dissolved in 40 mL of deionized water, and this solution was kept with continuous stirring until it becomes transparent. Then, the transparent solution was added into a 50 mL Teflon lined stainless autoclave. This autoclave was kept with 180 °C for 14 h under spontaneous pressure. After being cooled to room temperature, the black powder in the bottom of the autoclave was centrifuged and washed with deionized water and anhydrous ethanol for several times. And this powder was kept drying at 80 °C for 24 h. Finally, the porous carbon nanomaterials were obtained by annealing at 950 °C in N2 gas atmosphere with atmospheric natural pressure, and this product was noted as sample-A. The product which was noted as sample-B was synthesized by the same condition, except the solution with 0.056 mol glucose and 0.02 mol Zn(NO3)2 in 40 mL of deionized water.
B. Fabrication of porous carbon materials electrode
Firstly, the as-prepared porous carbon materials with a certain precise mass as the active ingredient and drying polyvinylidene fluoride as a binder were disssolved into N-methyl pyrrolidone as the dispersion agent at room temperature according to the mass ratio of 9:1, with continuously stirring for 3 h. And then, a black pulp was obtained and smeared uniformly on a piece of nickel foam as a substrate with the area of 1 cm2. Subsequently, the nickel foam smeared by the black pulp was kept at 80 °C for 24 h, to dry out the NMP. The dry nickel foam loaded with the as-prepared active carbon materials was compacted at a pressure of 10 MPa. Finally, a compact electrode with the as-prepared porous carbon materials for electrochemical measurements was obtained.
C. Characterizations
The morphology of the as-prepared porous carbon samples was investigated by Transmission Electron Microscopy (TEM; JEM2010-HR, 200 kV, JEOL Ltd., Tokyo, Japan) at various magnifications.
The composition and crystal phase structures of each as-prepared porous carbon sample was measured by X-ray diffractometry (XRD; D8 ADVANCE equipped with Cu-Ka radiation, Bruker AXS GmbH Corp., Karlsruhe, Germany), X-ray Photoelectron Spectroscopy (XPS; ESCALab250, Thermo VG Scientific, Waltham, Massachusetts), and Raman spectroscopy (Renishaw inVia, Renishaw, Wotton-under-Edge, United Kingdom). The XRD test was in the 2θ range from 10° to 80° with a step size of 0.02°. The XPS Spectra were obtained through a high-power monochromated Al-Ka source by the smallest available spot size of 10 mm diameter. The Raman spectroscopy was performed with an excitation of 633 nm (1.96 eV), at a power of 1 mW, with a 100× objective, to give a 1 mm spot size and a grating of 18,001 mm−1 to achieve a spectral resolution of 1 cm−1. The spectra shown are the average of 10 sets of 10 s exposures.
The Brunauer–Emmett–Teller (BET) specific area of the as-prepared porous carbon samples was obtained by nitrogen adsorption/desorption isotherms at 77 K on the BET Surface Area and Pore Size Analyzer (BK100A Beijng JWGB Sci. & Tech. Co., Ltd., Beijing, China). All samples were outgassed at 150 °C for 2 h under flowing nitrogen before measurements.
Cyclic voltammetry test, galvanostatic charge–discharge measurement, and the electrochemical impedance investigation were carried on by the electrochemical workstation (CHI 760D, Shanghai CH Instruments, Inc., Shanghai, China) under room temperature with a three-electrode system. The electrolyte is 6 mol/L KOH aqueous solution. Cyclic voltammetry tests were performed at variable scan rate of 5, 10, 20, 40, 60, 80, and 100 mV/s. Galvanostatic charge–discharge measurements were carried on at different current densities of 1, 2, 4, 6, 8, and 10 A/g. The electrochemical impedance spectroscopy investigation was carried out by an AC voltage of 5 mV in a frequency range from 0.01 to 100 Hz at the circuit potential. The cyclic charge–discharge life measurement was performed by the electrochemistry workstation (CS single-channel potentiostat/galvanostat workstation, Wuhan CorrTest Instruments Corp., Ltd., Wuhan, China) for repeated scanning for 5000 cycles.
The specific capacitance of the as-prepared porous carbon electrodes can be calculated from two methods of the cyclic voltammogram curves and the galvanostatic charge–discharge curves. For the cyclic voltammogram method, the specific capacitance is calculated based on the following Eq. (1):
 $${C_{\rm{s}}} = {Q \over {m \times \Delta V}}\quad ,$$
where C m (F/g) is the specific capacitance based on the mass of the active materials, Q is the average electric quantity between the charge and discharge process, ΔV (V) is the working-voltage width of the electrochemistry scanning window, and m (g) is the mass of the active materials of the electrode.
For galvanostatic charge–discharge method, the specific capacitance is calculated based on the following Eq. (2):
 $${C_{\rm{g}}} = {{1 \times \Delta t} \over {m \times \Delta V}}\quad ,$$
where C g (F/g) is the specific capacitance based on the mass of active materials, I (A) is the current of the galvanostatic discharge process, Δt (s) is the discharge time, ΔV (V) is the discharge voltage excluding IR drop, and m (g) is the mass of the active materials of the electrode.
III. RESULTS AND DISCUSSION
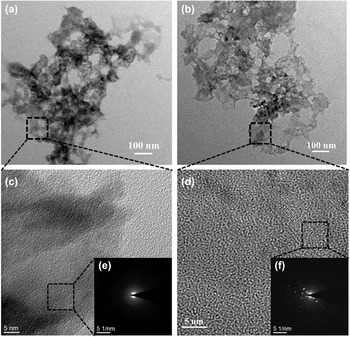
The porous carbon nanomaterials were prepared by the typical soft-template procedure. Firstly, the hydrothermal reaction of the solution with glucose and Zn(NO3)2. Secondly, the as-prepared samples from the hydrothermal reaction have been annealed at 950 °C in the flowing N2 gas with the atmospheric natural pressure. In the heating-up process of carbonization, ZnO and carbon were produced by the decomposition of the zinc-organic framework precursors. With the temperature increasing continuously, ZnO was reduced by carbon during the carbonization process,Reference Fletcher50 and subsequently, the Zn metal (boiling point 906 °C) vaporized away along with the N2 flow, leaving the carbon species alone in the resulting carbon nanomaterials sample.Reference Chae, Siberio-Perez, Kim, Go, Eddaoudi, Matzger, O’Keeffe and Yaghi51 The only difference between sample-A and sample-B is the original concentration of glucose before the hydrothermal reaction. Therein, the original glucose addition of sample-A and sample-B are, respectively, corresponding to 0.02 and 0.056 mol dissolved in 40 mL of deionized water. Figures 1(a) and 1(b) show the typical transmission electron microscopy (TEM) images of sample-A, and Figs. 1(c) and 1(d) show the high-resolution transmission electron microscopy (HRTEM) images of sample-B. In Fig. 1(a), it can be seen that the as-prepared sample-A nanomaterials with a lot of pores were obtained. Similarly, it is shown in Fig. 1(b) that a lot of holes live in the as-prepared nanomaterials in sample-B. In view of the pores size, there is no obvious difference between sample-A and sample-B. But compared with sample-B, the pores in sample-A are more uniform, shown by Figs. 1(a) and 1(b). To investigate the structure details of these two samples, HRTEM and the selected-area electron diffraction (SAED) characterization were carried on in Figs. 1(c) and 1(d). Figure 1(c) gives the HRTEM images of sample-A, and the inset is the SAED pattern in Fig. 1(e). And several crystal lattice fringes are clear to see in the HRTEM image of sample-A. In the SAED pattern of sample-A, the diffraction halation can be observed without obvious speckles, indicating that sample-A performs to a low degree of crystallization. But it can be seen that there are a lot of lattice fringes for sample-B in Fig. 1(d). And many clear sparkles appear in the SAED pattern from Fig. 1(f), demonstrating that sample-B exhibits better crystallinity than that of sample-A.
(a) TEM image of as-prepared sample-A; (b) TEM image of sample-B; (c) HRTEM image of as-prepared sample-A; (d) HRTEM image of the as-prepared sample-B; (e) SAED pattern of sample-A; (f) SAED pattern of sample-B.

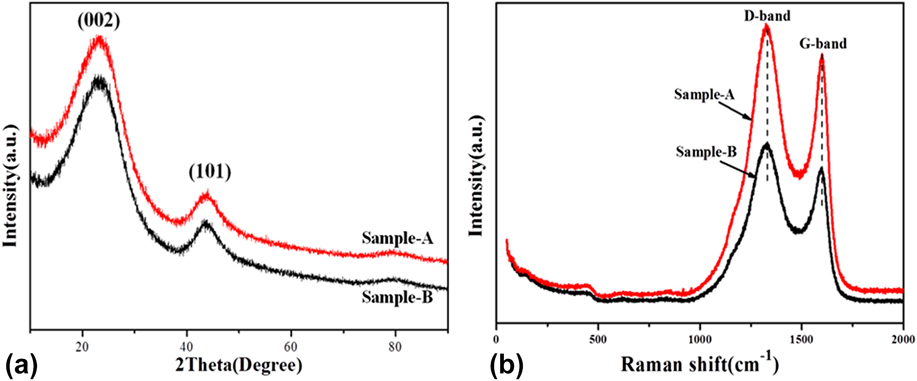
For further investigating the structure details, the XRD spectra of these two carbon nanomaterial samples are collected in Fig. 2(a). It can be seen that these two samples show the similar crystal phase because there are two board peaks with low intensity located at 2θ = 23.2° and 43.5° in these two XRD patterns. These two peaks are possibly indexed to graphite typical diffraction peak (JCPDS no. 41-1487)Reference Lee, Kim and Hyeon52 with crystal plane of (002) and (101), respectively. But compared with the standard 2θ = 26.6° (d = 0.344 nm) of graphite, the peaks located at 2θ = 23.2° are exhibited to be broader and weaker. In addition, the standard 2θ = 23.2° of these two samples shifted to the lower degree, suggesting the characteristics of low graphitization.Reference Qie, Chen, Wang, Shao, Li, Yuan, Hu, Zhang and Huang53 The interlayer spaces of these two samples are equal to 0.383 nm. This phenomenon shows that the as-prepared samples tend to be in the amorphous phase along with graphitization, which is identical to the HRTEM results. Moreover, no other obvious peak corresponding to Zn or ZnO can be found in these two XRD spectra, also demonstrating that all of Zn was taken away by the flowing N2 gas in the carbonization process.
(a) XRD pattern and (b) Raman spectra of sample-A and sample-B.
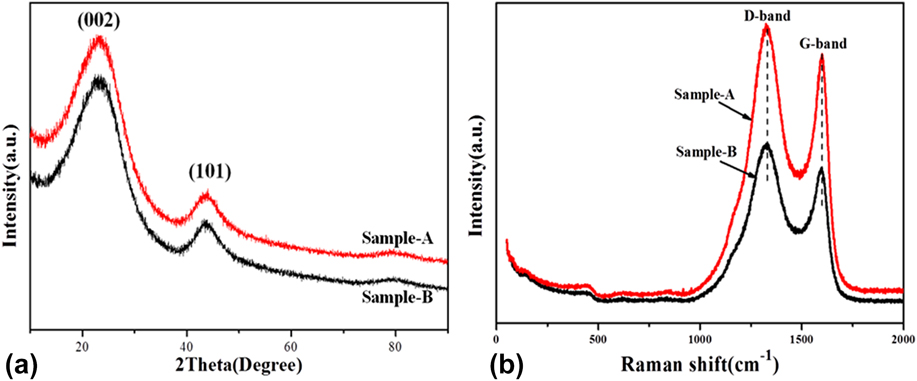
Further insight into the crystalline structure details of the as-prepared carbon nanomaterials was obtained by using a Raman spectrometer in Fig. 2(b). Both of these samples display all the same two distinct peaks centered at around 1328 and 1598 cm−1, which can be corresponding to the typical D-band and G-band of carbon materials, respectively. And this result is consistent with the previous work by Wenjing Qian’sReference Qian, Zhu, Zhang, Wu and Yan54 and Feng Zhang’s team.Reference Liu, Zhang, Songa and Li32 The D-band is associated with the vibrations of carbon atoms with dangling bonds in plane terminations of the disordered graphite, relating to defects and disorders of the structures in carbon materials, whereas the G-band is attributed to the vibration of sp 2-bonded carbon in a 2D hexagonal lattice, namely, the stretching modes of C=C bonds of typical graphite.Reference Zhou, Bao, Tang, Zhong and Loh55 Moreover, the peak intensity ratio between the D-band and G-band (I D/I G) may be explored for a quantitative figuration of the defects degree in carbon materials.Reference Zhang, Fugane, Mori, Niu and Ye56 In Fig. 2(b), the I D/I G values of sample-A and sample-B are, respectively, calculated out with 1.16 and 1.23, representing the two materials compositing of the amorphous phase and graphic phase, which is also agreeable with the result of the XRD measurement. The I D/I G value of sample-A is a little higher than that of sample-B, demonstrating that sample-B with more dispersion exhibited little more disorder carbon phases and defects than sample-A.
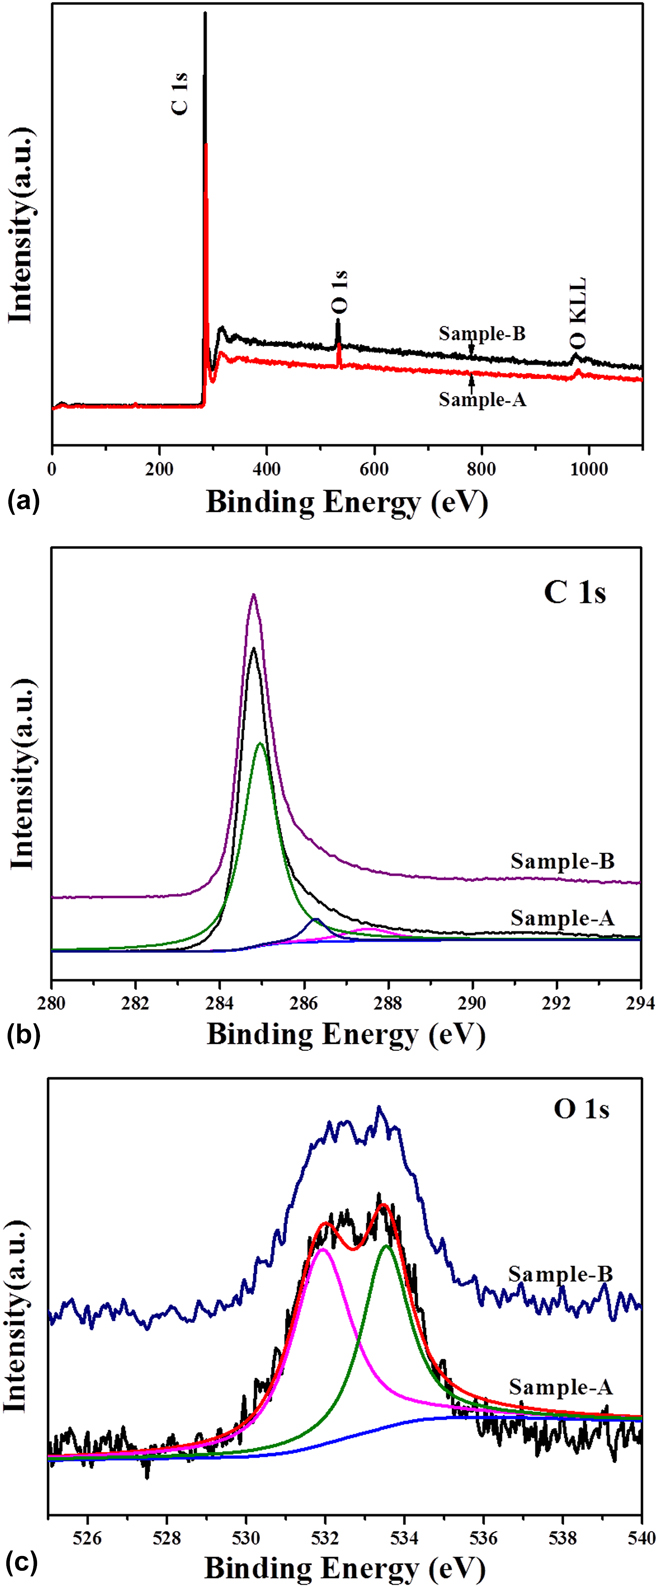
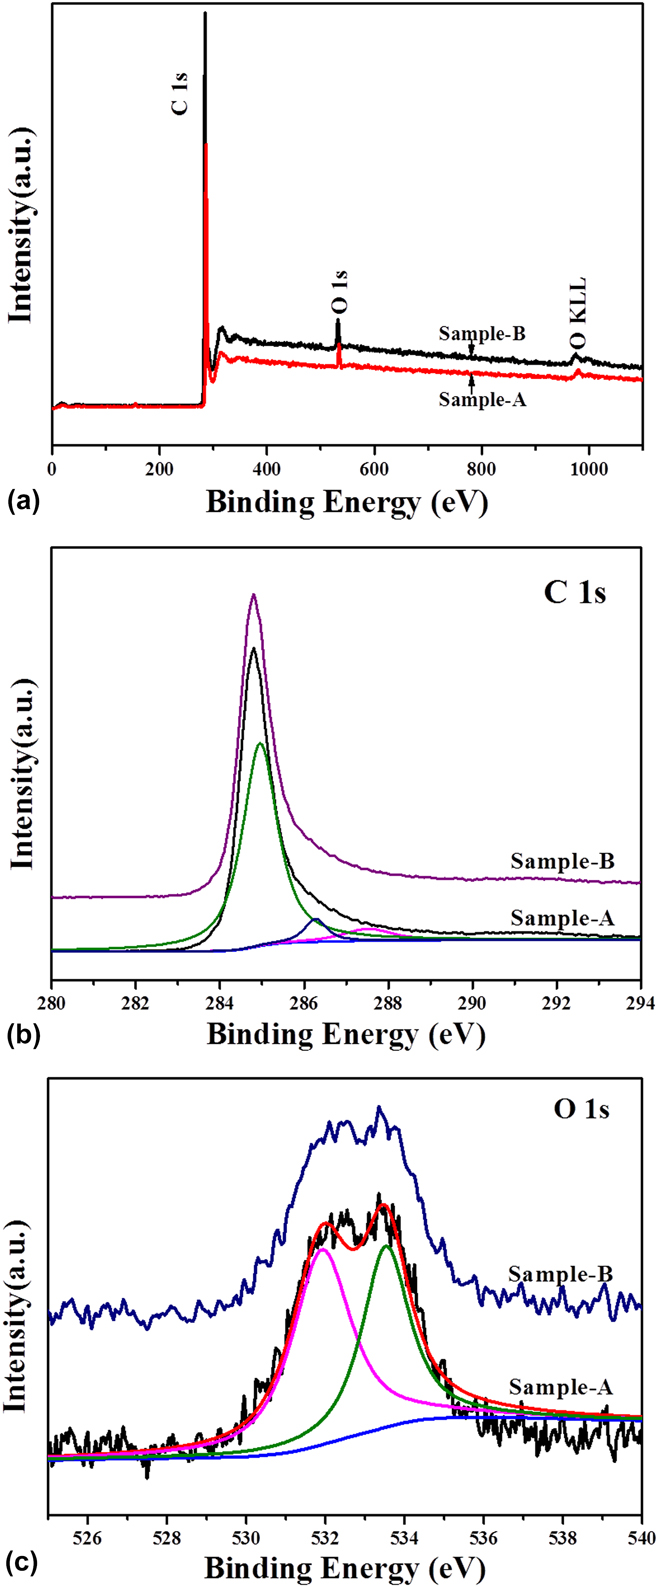
To better understand the chemical composition of sample-A and sample-B, the XPS measurement was performed in Fig. 3. The XPS survey spectra of sample-A and sample-B are shown in Fig. 3(a). We can see that there are no other peaks detected except the signals of C and O elements, suggesting that the as-prepared carbon nanomaterials are highly pure. This finding indicates that the Zn element and inorganic impurities have been completely taken away by the flowing N2 gas in the process of high-temperature carbonization for sample-A and sample-B. Figure 3(b) shows the comparison of the C 1s core-level XPS spectra between sample-A and sample-B. And these two spectra exhibit the same location of the binding-energy peaks. As shown in Fig. 3(b), the C 1s core-level XPS spectra of sample-A can be fitted to three peaks centered at 285.1 eV, 286.2 eV, and 287.6 eV, respectively. Therein, the peak of the C 1s spectra located 285.1 eV in Fig. 3(b) can be attributed to the nonfunctionalized sp 3 C–C according to the demonstration of the previous research.Reference Shen, Li and Liu57 And the peaks located at 286.2 and 287.6 eV can be attributed to C–O and C=O groups, respectively. In comparison, the C concentration with the forms of C–O and C=O shows much lower than that of C with the form of C–C in Fig. 3(b). Moreover, there are a few O atoms in these two samples by fitting calculation, which are 4.75% in sample-A and 2.18% in sample-B by the XPS results, respectively. Figure 3(c) shows comparison of the O 1s core level XPS spectra between sample-A and sample-B. The O 1s spectra can be fitted to two peaks as shown in Fig. 3(c). The detailed scans of the O 1s peak show that each of the two samples has a peak locating at about 533.1 eV, which can be indexed to oxygen single-bonded carbon (C–O) with the form of phenol and/or ether groups. Another peak locating around 531.5 eV is also present, revealing the existence of oxygen double-bonded carbon (C=O) as a quinone type group.Reference Hulicova-Jurcakova, Seredych, Lu and Bandosz58,Reference Ania, Khomenko, Raymundo-Pinero, Parra and Beguin59
(a) XPS survey spectra, (b) C 1s core level XPS spectra, and (c) O 1s core level XPS spectra of the sample-A and sample-B.
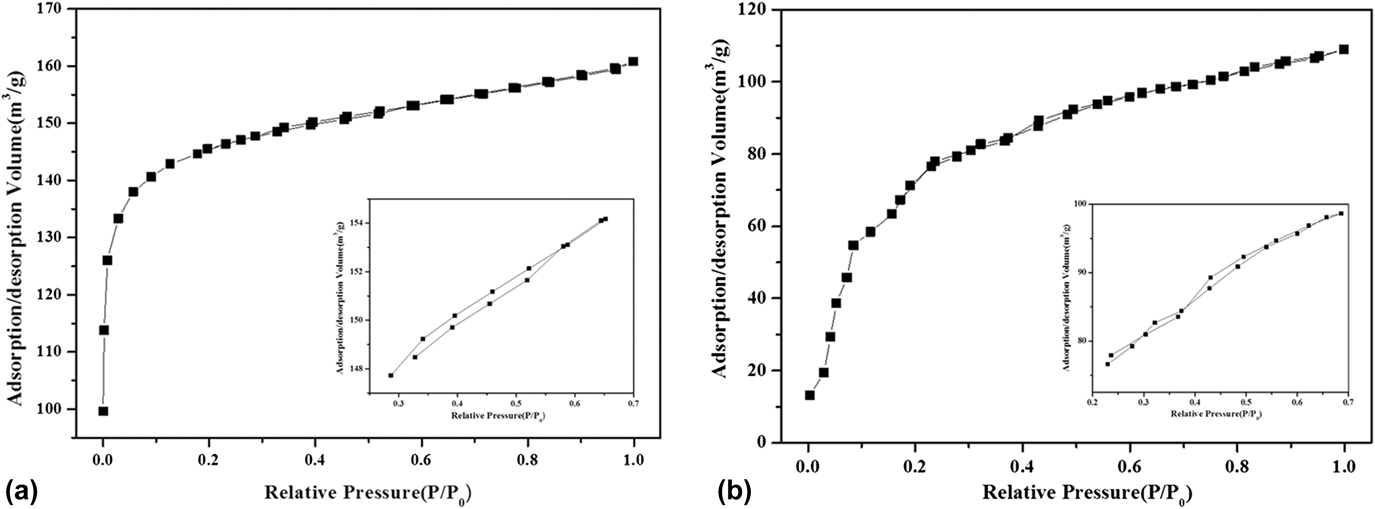
To further investigate the porosity of these two as-prepared porous carbon nanomaterials, the N2 adsorption–desorption isotherm analysis was performed and the results are described in Fig. 4. It can be seen in Fig. 4 that these two nitrogen adsorption–desorption isotherms for sample-A and sample-B should be all categorized to type I isotherms according to IUPAC (International Union of Pure and Applied Chemists) definition.Reference Thommes, Kaneko and Neimark60 And from the magnification part of these two isotherms in Fig. 4a, there is a slight adsorption–desorption delaying cycle, indicating that the pores in the as-prepared carbon nanomaterials mainly perform microporous and mesoporous, which is coherent to the results reported by the previous literature.Reference Xia, Mokaya, Walker and Zhu61,Reference Luo, Chen, Chen, Li, Zhang and Xia62 Through the calculation of the Brunauer–Emmett–Teller model, the BET specific area of sample-B is 280.94 m2/g, lower than that of sample-A (476.39 m2/g), due to the quantity of pores decreased by higher graphitization, which can be seen in Fig. 2.
Nitrogen adsorption–desorption isotherms of the as-prepared (a) sample-A and (b) sample-B (the inset is the magnification of isotherm from 0.2 to 0.7 P/P 0).

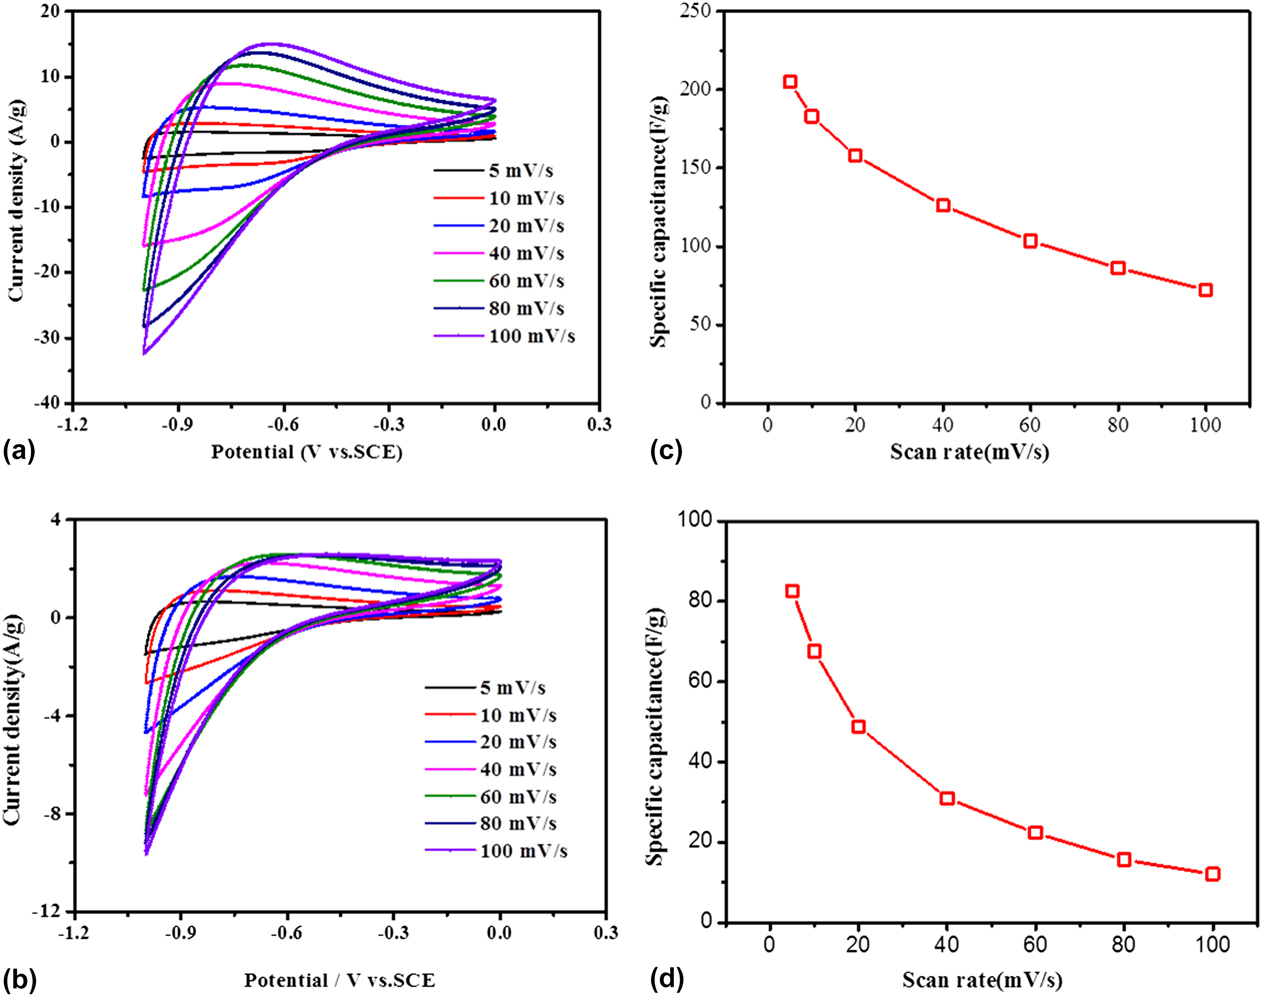
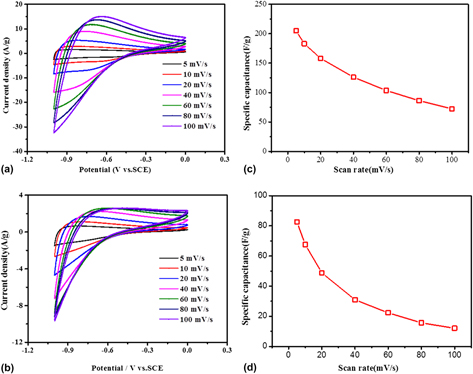
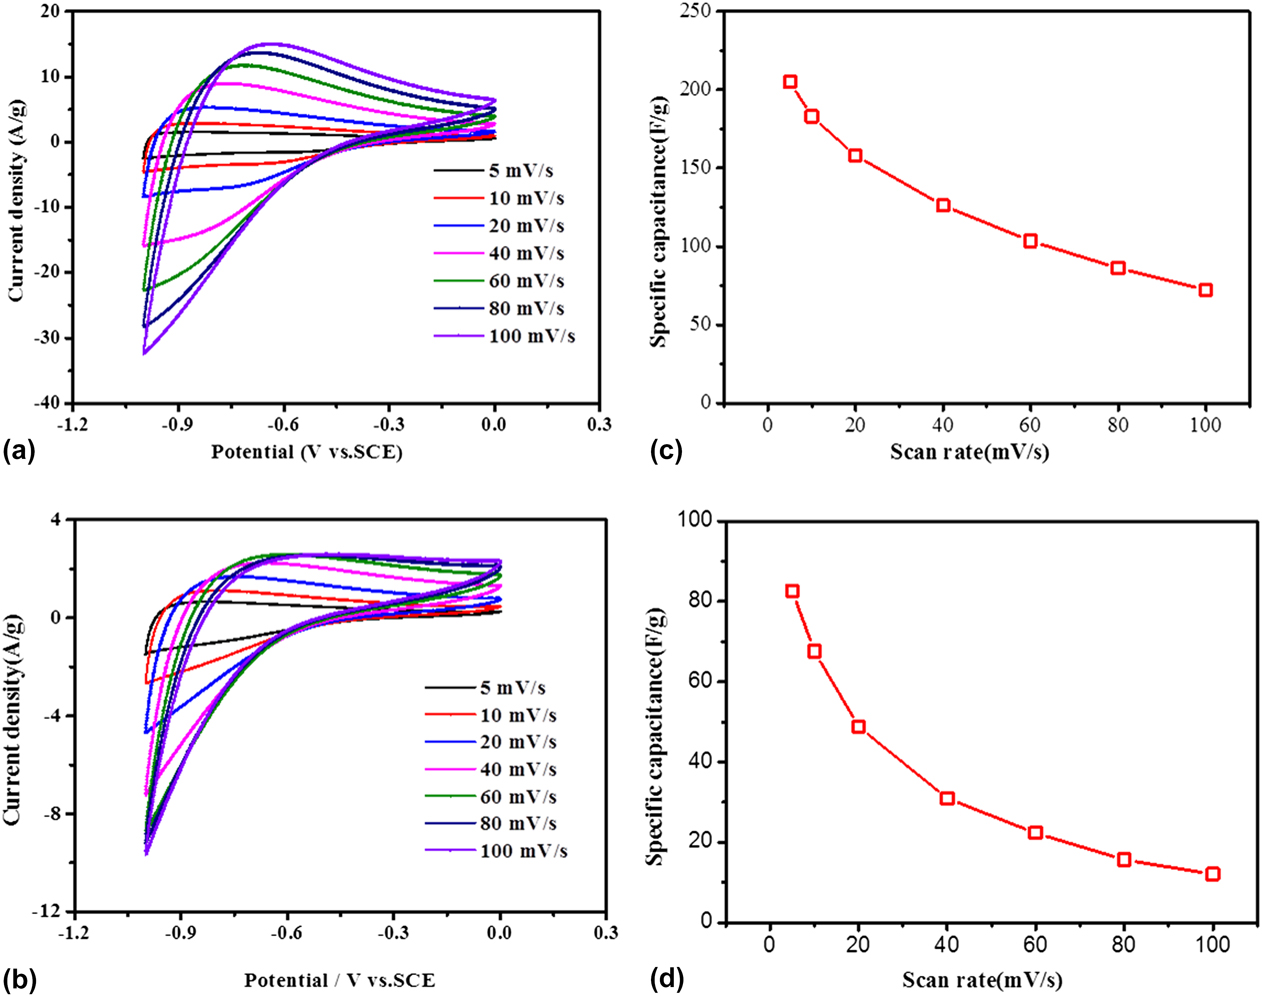
To evaluate the electrochemical performance of the as-prepared porous carbon materials as supercapacitor electrodes, cyclic voltammetry (CV) measurements were carried out in 6 M KOH aqueous solution at room temperature in a three-electrode system, given by Fig. 5(a) (measurement detailed in Sec. II). From Fig. 5(a), it can be observed that quasi-rectangular shaped loops are gained under different scan rates of 5, 10, 20, 40, 60, 80, 100 mV/s with the potential range from −1.0 to 0 V, which exhibits excellent reversibility and stability. And close to −1.0 V (−1 to −0.4 V), the sample-A electrode current has a larger response than the electrode current near 0 V (−0.4–0 V) due to the charge resistance of sample-A.Reference Zhao, Li, Yang, Zhang and Luo63 With the sweep rate increasing, the CV curves of sample-A exhibit similar shape. However, all the CV curves display a slight deviation from the rectangular shape, resulting from the more inadequate time of ion absorption and diffusion in the inner pores of the porous carbon particles.Reference Ouyang, Cheng, Cao, Kong, Ye, Wang and Cao64 Moreover, the distortion of the CV curves for the sample-A electrode may be attributed to the pseudocapacitance arising from the reversible Faradic redox reaction of oxygen-containing groups, which was given by the XPS measurement in Fig. 3. Groups like this can influence the acid–basic feature and the electron donor–acceptor characteristics of porous carbon materials, which can enhance the specific capacitance.Reference Liu, Zhang, Songa and Li32 The CV curves of the sample-B electrode were given at different scan rates in Fig. 5(b), which display a quasi-rectangular shape, indicating a superior stability and reversibility of the sample-B porous carbon materials. And the CV curves of sample-B show the similarly shaped loops at different scan rates. Approaching the voltage of −1.0 V (range from −1 to −0.6 V), the sample-B electrode current has a larger response than the electrode current near 0 V (range from −0.6 to 0 V). Moreover, compared with the CV curves of sample-A in Fig. 5(a), the current densities of the CV curves for sample-B are much higher at various scan rates. The mass specific capacitance of sample-A and sample-B calculated by their CV curves is plotted in Figs. 5(c) and 5(d). In Fig. 5(c), it is shown that the mass specific capacitance of the sample-A electrode is 205.1 F/g, 183.2 F/g, 158.1 F/g, 126.1 F/g, 103.6 F/g, 86.2 F/g, and 72.4 F/g at different sweep rates of 5 mV/s, 10 mV/s, 20 mV/s, 40 mV/s, 60 mV/s, 80 mV/s, and 100 mV/s, respectively. The mass specific capacitance displays a decreasing trend with the increasing scan rate, which is also attributed to the shortage time of the ion diffusion to the material surface.Reference Piedboeuf, Léonard, Deschamps and Job65 Moreover, in Fig. 5(d), the mass specific capacitance of the sample-B electrode exhibited 82.6 F/g, 67.6 F/g, 48.8 F/g, 31.1 F/g, 15.6 F/g, and 12.1 F/g at different scan rate of 5 mV/s, 10 mV/s, 20 mV/s, 40 mV/s, 60 mV/s, 80 mV/s, and 100 mV/s, respectively. Obviously, the mass specific capacitance of sample-A is higher than that of sample-B, which can be owing to the larger surface area of sample-A, leading to more active sites for contacting ions in the electrolyte.
Cyclic voltammogram curves of the as-prepared porous carbon nanomaterials electrode by (a) sample-A and (b) sample-B with different scan rates from 5 mV/s to 200 mV; the mass specific capacitance of (c) the sample-A electrode and (d) the sample-B electrode at different scan rates calculated by their CV curves.
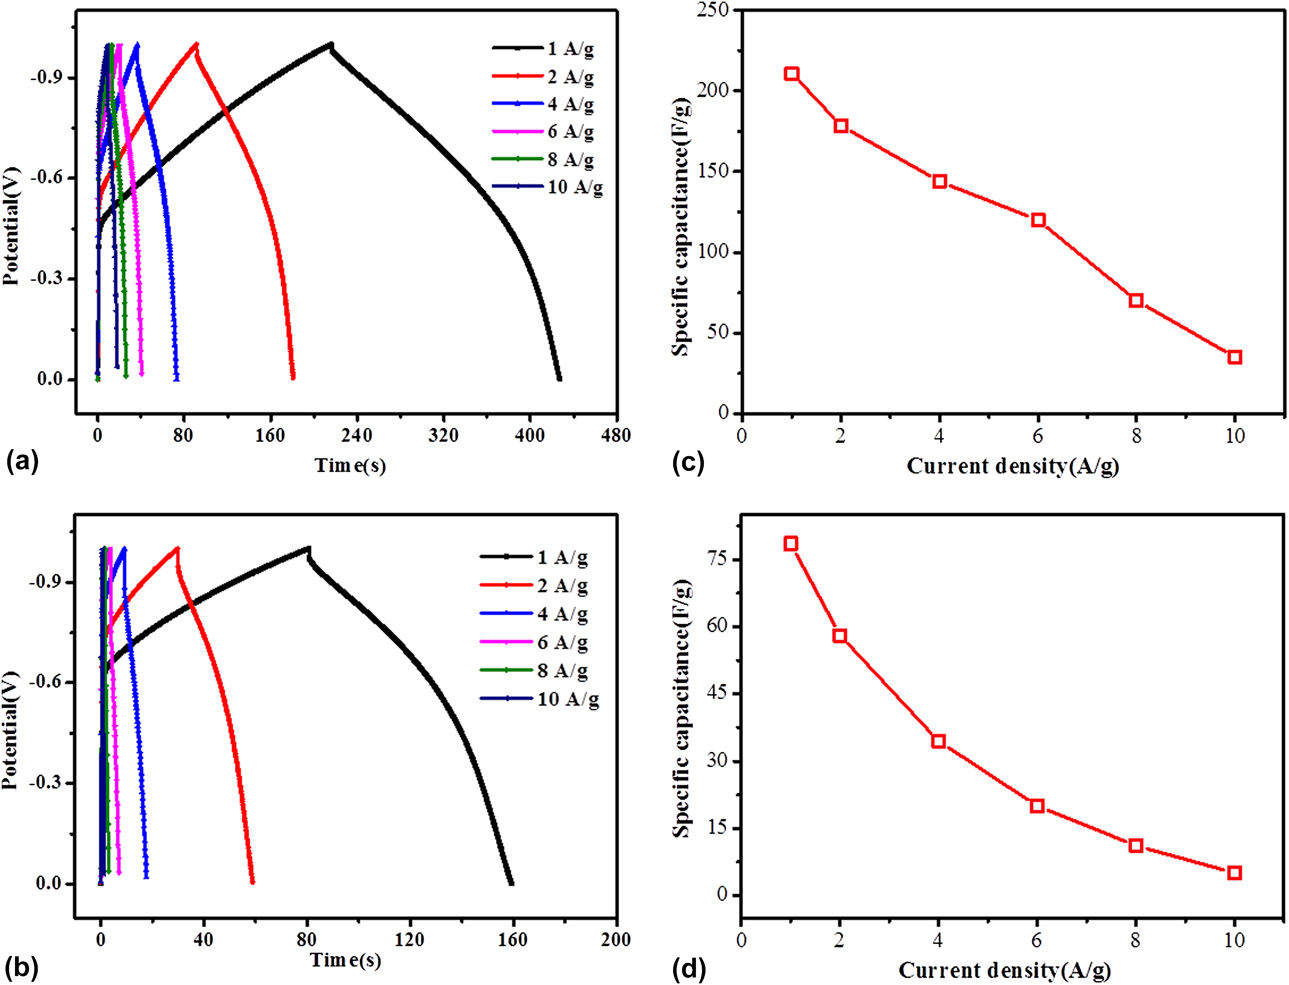
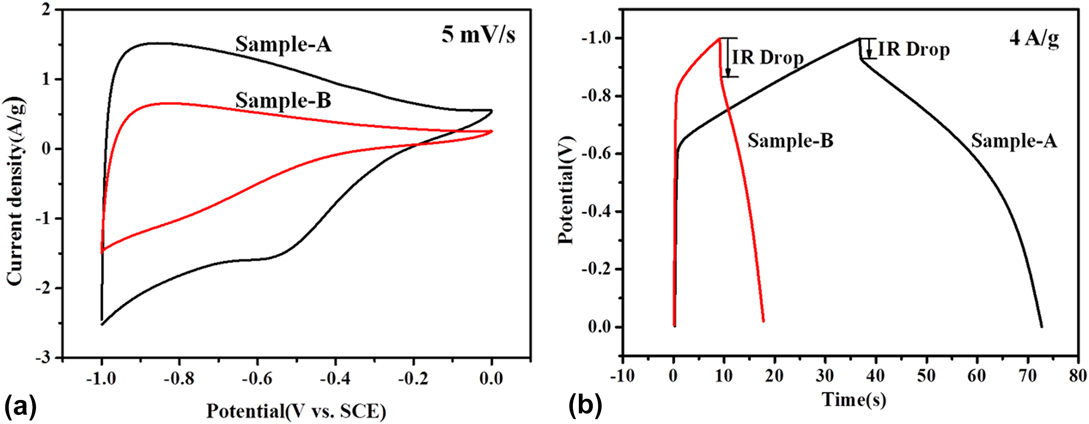
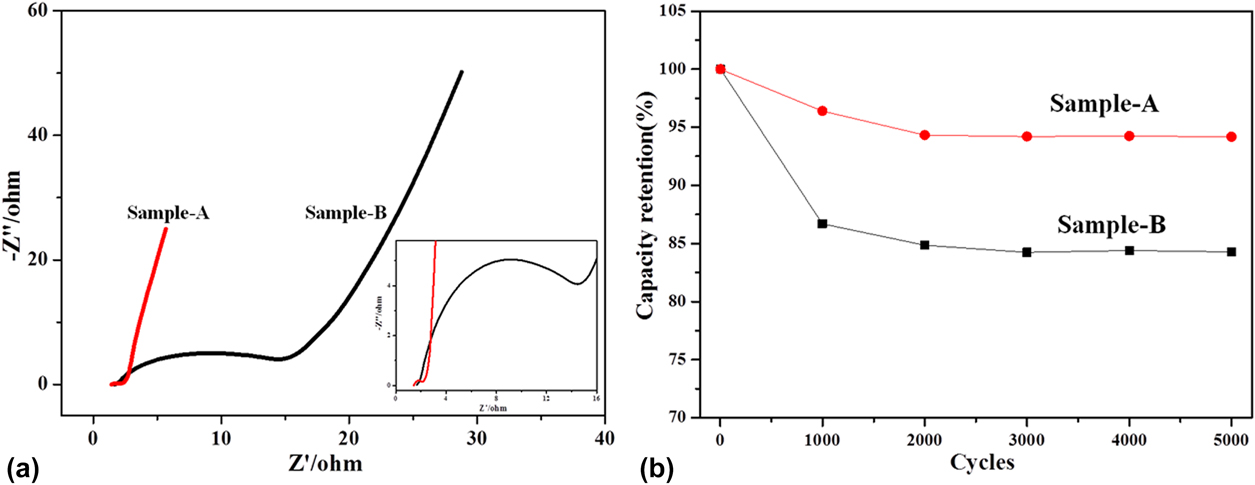
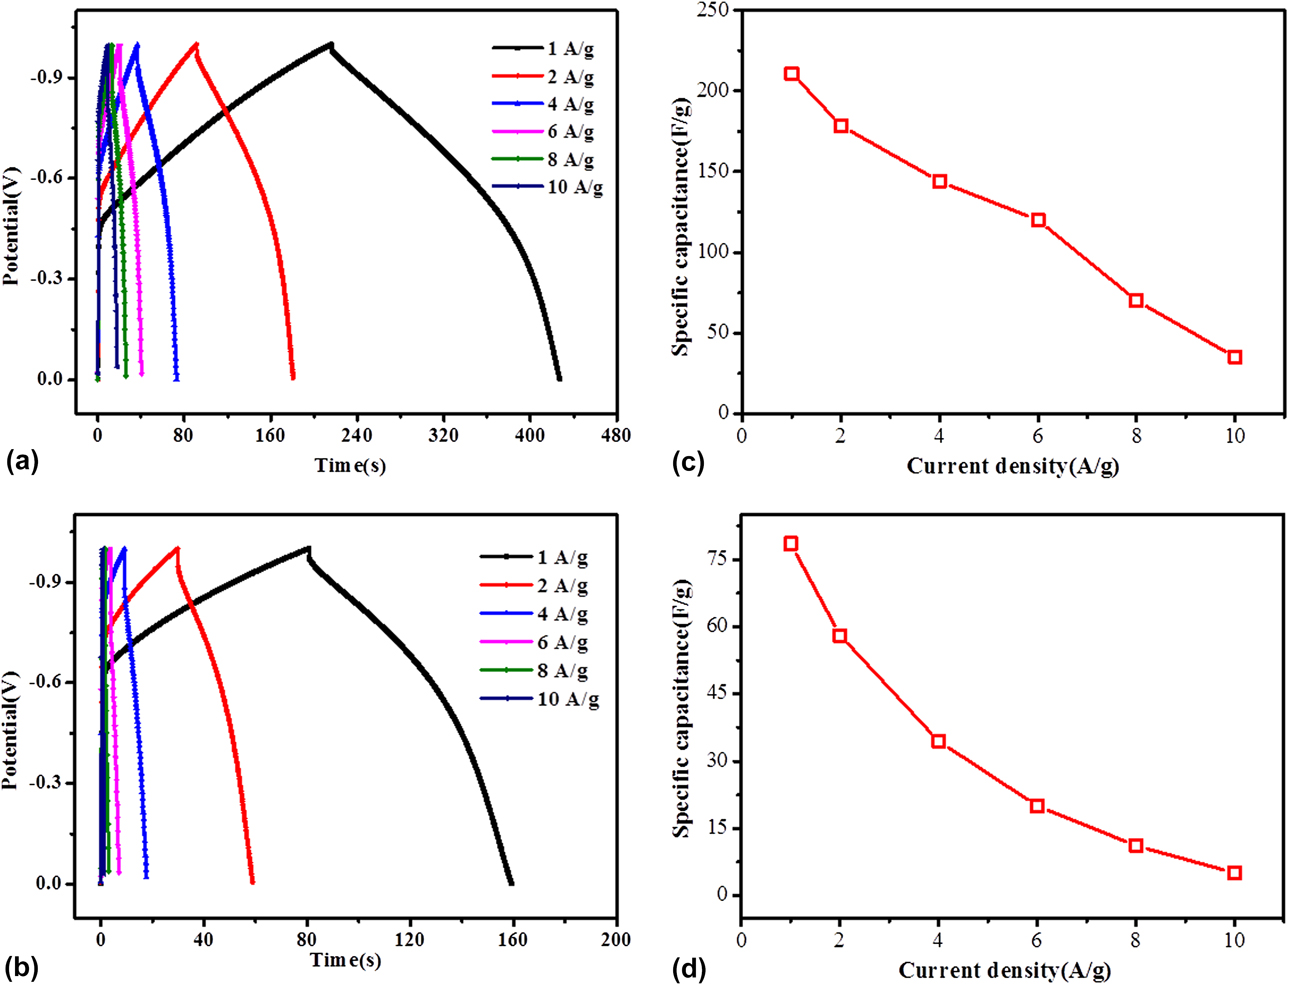
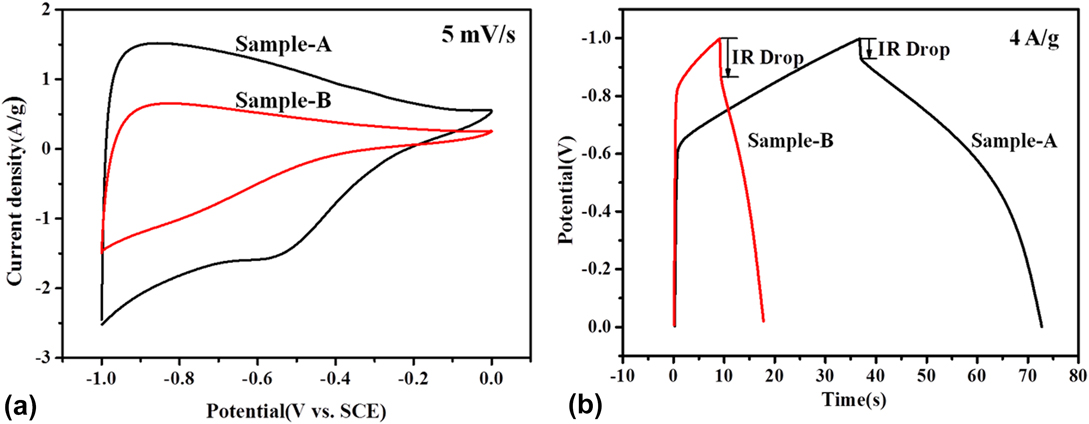
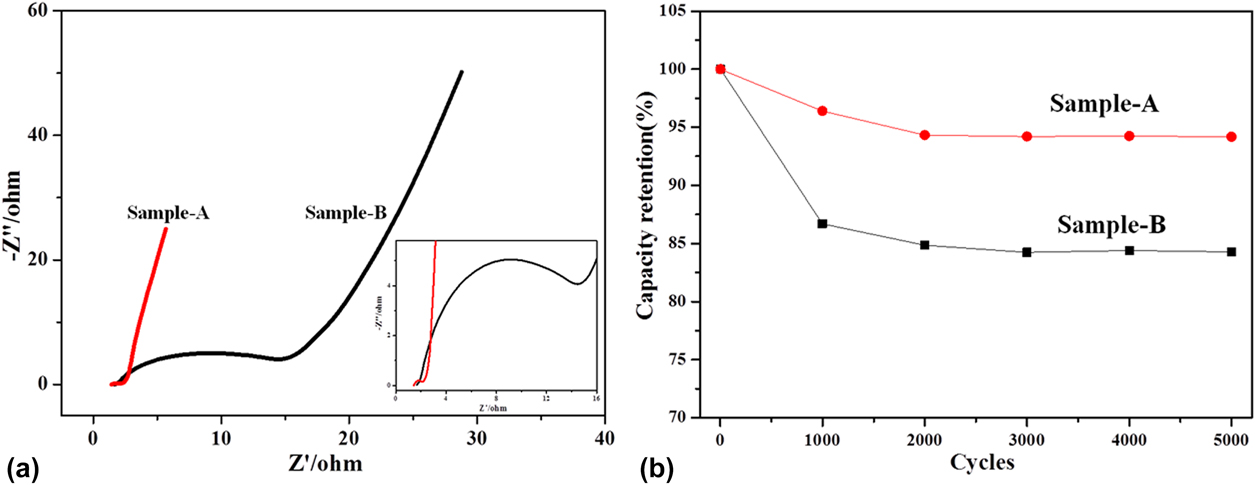
Furthermore, the galvanostatic charge–discharge profiles for sample-A and sample-B electrodes were given in Figs. 6(a) and 6(b) at different current densities of 1 A/g, 2 A/g, 4 A/g, 6 A/g, 8 A/g, 10 A/g. From the curves in Fig. 6(a), it can be observed that the galvanostatic charge–discharge curves of sample-A exhibit superior symmetry, indicating excellent stability and reversibility of the as-prepared sample-A carbon materials. With the current density increasing, the time of discharge for the sample-A electrode shortens, and at the same time, the mass specific capacity of sample-A decreases. Based on the results that the responding current near 0 V (−0.4–0 V) is lower than that approaching −1 V (−1 to −0.4 V) from the CV curves of sample-A in Fig. 5(a), the galvanostatic charge–discharge curves of sample-A show a similar performance in the charge process observed in Fig. 6(a). Similar behavior happens to the sample-B electrode in Fig. 6(b), but the voltage range of the responding current changes to −1 to −0.6 V. Figures 6(c) and 6(d) represent the mass specific capacitance of the sample-A and sample-B electrode at different current densities calculated by the galvanostatic charge–discharge curves, respectively. In Fig. 6(c), it can be seen that the mass specific capacitance of the sample-A and sample-B electrode decreases with the increasing the current density. The mass specific capacitance of sample-A was calculated to 211 F/g, 178.5 F/g, 144 F/g, 120 F/g, 70 F/g, and 35 F/g at different current densities of 1 A/g, 2 A/g, 4 A/g, 6 A/g, 8 A/g, and 10 A/g, respectively. From Fig. 6(d), the sample-B displays a relatively lower mass specific capacitance of 78.6, 58.5, 34.4, 20, 11.1, and 5 F/g at different current densities of 1, 2, 4, 6, 8, and 10 A/g. The comparison of CV and the galvanostatic charge–discharge performance between sample-A and sample-B are shown in Fig. 7. In Fig. 7a, the CV curves of the sample-A and sample-B electrodes at 5 mV/s show that the sample-A electrode has a much higher current density than that of the sample-A electrode, implying the improved capacitance of the sample-A electrode. It can be observed that sample-B has a lower mass specific capacitance and a larger IR drop than those of sample-A given by Fig. 7(b) due to the larger ion diffusion resistance in the electrolyte solution. Figure 8(a) exhibited the electrochemical impedance spectra of these two samples. Under high frequency, the curves of sample-A and sample-B electrodes exhibit an almost vertical straight line corresponding to the real axis, indicating that the pores of the as-prepared porous carbon materials can promote the quick diffusion of ions in the electrolyte solution. But under low frequency, the curves exhibit a half semicircle. Furthermore, the diameter of the half semicircle is related to the charge transfer resistance, and a higher diameter means a larger charge transfer resistance. Obviously, the diameter of the half semicircle for the sample-B electrode is much larger than that of the sample-A electrode, suggesting the much increased charge transfer resistance of the sample-B electrode. Moreover, the cyclic stability of sample-A and sample-B was tested in Fig. 8(b). After 5000 cycles, the specific capacitance retention of sample-A can be kept at 94.19%, which is higher than that of sample-B (84.28%), indicating much boosted durability of the sample-A electrode. Above all, the sample-A electrode displays excellent capacitive performance and cyclic stability.
Galvanostatic charge–discharge curves of (a) sample-A and (b) sample-B at different current density; the mass specific capacitance of the (c) sample-A and (d) sample-B electrode at different current densities calculated by the galvanostatic charge–discharge curves.
(a) Cyclic voltammograms of sample-A and sample-B at the scan rate of 5 mV/s; (b) galvanostatic charge–discharge curves of sample-A and sample-B at a current density of 4 A/g.
(a) Electrochemical impedance spectra (inset: magnified 0–16 Ω region) and (b) Specific capacitance retention of sample-A and sample-B.
IV. CONCLUSION
In summary, porous carbon nanomaterials with significant capacitive performance were successfully prepared though two simple steps of thermal-polymerization and carbonization without an additional template. These two as-prepared porous carbon materials exhibited the amorphous phase with low graphitization. The resulting porous carbon materials of sample-A showed a moderate specific surface area of 476.39 m2/g, larger than that of sample-B (280.94 m2/g). Moreover, a relatively high mass specific capacitance of 205.1 F/g at 5 mV/s and 211 F/g at a current density of 4 A/g was obtained by the sample-A electrode in a 6 M KOH electrolyte solution, which is higher than that of the sample-B electrode (82.6 F/g at 5 mV/s and 78.6 F/g at current density of 4 A/g). Such improved electrochemical performance of the Sample-A electrode may be ascribed to the larger surface area and better conductivity. Furthermore, the Sample-A electrode also delivered superior cyclic stability with less than 6% capacitance decay after 5000 cycles, which is also higher than that of the sample-B electrode (about 16%). This work proposed a cost-effective, green, and promising strategy for the large-scale preparation of porous carbon material electrodes.
ACKNOWLEDGMENTS
This work was financially supported by Science and Technology Planning Project of Guangdong Province (No. 2015A020215038), and Province key platforms and projects of Guangdong Universities (No. 2015KQNCX161).