




No CrossRef data available.
Article contents
How well does IQ predict neuropsychological test performance in normal adults?
Published online by Cambridge University Press: 06 February 2004
Abstract
The strength and nature of the association between IQ and performance on other cognitive tests has both practical and conceptual significance for clinical neuropsychology. In this study, 28 measures derived from 16 cognitive tests were analyzed as a function of IQ in 221 adults. Participants were grouped by their IQ scores as having below average (BA), average (A), or above average (AA) intelligence. Planned comparisons revealed that A adults performed significantly better than BA adults on 25 of the 28 cognitive measures, and that AA adults performed significantly better than A adults on 19 of 28 measures. Effect sizes averaged .74 for BA–A comparisons and .41 for A–AA comparisons. Linear, quadratic, and cubic functions described the relationships between IQ and cognitive test performance equally well for most individual test measures and for a composite index of test performance, whereas quadratic and cubic functions explained the proportion of abnormal performances better than a linear function. These findings confirm that IQ predicts concurrent neuropsychological performance across the entire spectrum of intelligence, but more so among persons of average IQ or less than among those with above average IQ. (JINS, 2004, 10, 82–90.)
Information
- Type
- Research Article
- Information
- Journal of the International Neuropsychological Society , Volume 10 , Issue 1 , January 2004 , pp. 82 - 90
- Copyright
- © 2004 The International Neuropsychological Society
INTRODUCTION
Clinicians often use a person's intelligence to estimate expected performance on other neuropsychological tests. This is based on the assumption that performance on the latter correlates with intelligence. Discrepancies between IQ and other neuropsychological test performances contribute to clinical inferences regarding the presence of cognitive deficits. However, the assumption of a linear relationship between IQ and neuropsychological test performance has been questioned (e.g., Bell & Roper, 1998; Dodrill, 1997, 1999; Horton, 1999; Larrabee, 2000; Tremont et al., 1998). Dodrill (1997, 1999), in particular, contends that this assumption is a “myth” of neuropsychology. He argued that the relationship between IQ and neuropsychological test performance is fairly robust among persons of below-average IQ, but diminishes substantially among persons whose IQ is average or higher. In support of this argument, he examined the relationship between WAIS–R (Wechsler, 1981) IQ and Halstead Reitan Battery (HRB; Halstead, 1947) test scores among 181 community-dwelling adults, and found a strong relationship between the HRB Impairment Index (HII) and intelligence at lower IQ levels, but little relationship once IQ exceeded 90 or 95 (Dodrill, 1997). Later analyses of 120 of these subjects, stratified by IQ, revealed that persons of average IQ outperformed those with below-average IQ on 19 of 23 HRB test variables, whereas persons with above average IQ outperformed those with average IQ on only 7 of 23 test variables. IQ correlated significantly with 10 neuropsychological tests in the below-average IQ group, no tests in the average IQ group, and 2 tests in the above-average IQ group (Dodrill, 1999). However, the findings have been challenged on a number of grounds, including the nature of his sample, which consisted almost exclusively of healthy, young White adults, as well as his use of overlapping IQ groups with individuals being represented more than once in analyses.
Other investigators have found a linear relationship between IQ and neuropsychological test performance that extends to the upper end of the IQ distribution (e.g., Bell & Roper, 1998; Horton, 1999; Jung et al., 2000; Tremont et al., 1998), although few examined the strength of this relationship. For example, Horton reviewed the performance of 363 community-dwelling normal adults ranging in age from 19 to 71 on the HRB and the WAIS (Wechsler, 1955). He reported that higher IQ was associated with better test performance on all measures except Finger Tapping, but he provided no statistical comparisons. Based on 157 clinically referred but apparently normal adults, Tremont et al. (1998) found that performances on the HRB and Wechsler Memory Scale (Wechsler, 1945) correlated with IQ, even above the average range. The only tests that failed to differentiate above-average IQ subjects from others were motor measures, such as Finger Tapping and Grip Strength. Dodrill (1999) criticized the methods and conclusions of this study on several grounds, including the failure to adjust for age in statistical analyses and the fact that the intellectually average subjects demonstrated abnormal performances on some cognitive tests, raising doubts about their classification as normal.
The present study sought to test the nature and strength of the relationship between IQ and neuropsychological test performance, but differs from previous studies in several ways. First, to increase generalizability, the participants comprised a broadly representative sample of community-dwelling adults. Second, performance on a broad range of neuropsychological tests was examined, extending previously reported findings for the HRB. Third, the nature and strength of the relationship between IQ and cognitive test performances were examined using several approaches, with both age-corrected and non-age-corrected scores.
METHODS
Research Participants
Participants were drawn from the Aging, Brain Imaging, and Cognition (ABC) Study, an ongoing NIH-funded investigation of normal aging that was approved by the Johns Hopkins University IRB. Most of the participants were recruited via random digit dialing, supplemented by random selection of Medicare beneficiaries who were 65 years or older. Because the ABC study involves normal as opposed to optimal aging, potential participants were excluded only if they lived in an institution, were unable to communicate independently via telephone, or had a medical condition that precluded the use of magnetic resonance imaging (MRI). Following a determination of eligibility, the ABC study was explained. Those who chose to participate gave written informed consent, and were paid for their participation. Each participant provided a health history, underwent a structured psychiatric interview and physical examination, had blood samples drawn, completed the brain MRI protocol, and was administered a battery of neuropsychological tests. Based on his or her health history, psychiatric interview, and physical examination, each person's health status was rated from zero (no problems) to 3. Health ratings of 1 (minor problems) were assigned for such conditions as simple phobias, uncomplicated diabetes mellitus, obesity, or controlled hypertension. Health ratings of 2 (moderate problems) were assigned for such conditions as major depression in remission, complicated diabetes mellitus, prior alcohol abuse, or coronary artery disease. Health ratings of 3 (severe problems) were assigned for such conditions as current substance dependence, current major depression, dementia, Parkinson's disease, multiple sclerosis, or prior traumatic brain injury with loss of consciousness for over 1 hr.
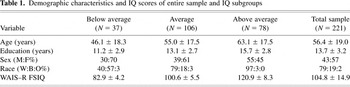
Altogether, there were 249 adult participants in the ABC sample at the time this study was conducted. Of these, 28 had health ratings of 3 or earned a Mini-Mental State Exam (MMSE; Folstein et al., 1975) score of less than 24/30, and were excluded from the analyses. This left a final sample of 221 participants who ranged from 20 to 92 years of age. As shown in Table 1, the sample is broadly representative in terms of age, sex, race, education, and IQ.
Demographic characteristics and IQ scores of entire sample and IQ subgroups

Cognitive Measures
Ward's (1990) seven-subtest version of the Wechsler Adult Intelligence Scale–Revised (WAIS–R; Wechsler, 1981) was used to group participants by Full Scale IQ. This has been shown to yield reliable and valid estimates of Full-Scale IQ scores (Axelrod et al., 1996; Benedict et al., 1992) and Mayo Full-Scale IQ scores for elderly adults (Schretlen & Ivnik, 1996).
In addition, 28 cognitive variables were derived from 16 different neuropsychological tests. These included (1) times to complete the Grooved Pegboard Test (GPT; Kløve, 1963) of manual speed/dexterity with each hand; (2) number of items completed on Salthouse's (1991) letter and pattern Perceptual Comparison Test, a measure of simple processing speed; (3) total number correct on the Brief Test of Attention (BTA; Schretlen, 1997), a measure of auditory divided attention; (4) times to complete Parts A and B of the Trail-Making Test (TMT; Reitan, 1958), a measure of psychomotor speed; (5) hit reaction time, hit reaction time standard error, and discriminability (d′) on Conners' (1995) Continuous Performance Test (CPT) of sustained visual attention; (6) total number correct on a 30-item version of the Boston Naming Test (BNT; Goodglass & Kaplan, 1983), a test of confrontation naming; (7) total acceptable words reported in consecutive 1-min trials on tests of Verbal Fluency in response to letter (S and P) and category (supermarket items and animal names) cues; (8) total number of acceptable designs produced on the Design Fluency Test (Jones-Gotman & Milner, 1977), a nonverbal analog of verbal fluency; (9) total deviation score (Axelrod & Millis, 1994) on the Cognitive Estimation Test (CET; Shallice & Evans, 1978), a measure of executive function; (10) number of categories achieved and errors committed on Nelson's (1976) modification of the Wisconsin Card Sorting Test (mWCST; Heaton, 1981), a measure of concept formation and mental flexibility; (11) total number correct on the Facial Recognition Test (FRT; Benton et al., 1983), a measure of the ability to match pictures of unfamiliar faces under varied light conditions; (12) total points earned on the copy trial of the Rey-Osterrieth Complex Figure Test (CFT; Rey, 1941, 1993), a measure of constructional praxis and planning; (13) total number correct across three learning trials, total number correct on delayed recall, and recognition discrimination on the Hopkins Verbal Learning Test–Revised (HVLT–R; Brandt & Benedict, 2001), a measure of word-list learning and memory; (14) total correct on immediate and delayed recall trials of the Logical Memory subtest of the Wechsler Memory Scale, Revised (WMS–R LM; Wechsler, 1987), a measure of verbal learning and memory; (15) total number correct across three learning trials, total number correct on delayed recall, and recognition discrimination on the Brief Visuospatial Memory Test–Revised (BVMT–R; Benedict, 1997), a measure of design learning and memory; (16) and total correct on immediate and delayed recall trials of the WMS–R Visual Reproduction subtest (WMS–R VR; Wechsler, 1987), a measure of visuospatial learning and memory.
Data analysis began with grouping participants on the basis of their prorated WAIS–R Full-Scale IQ scores as below average (BA) if their FSIQ scores fell below 90, average (A) if their FSIQ scores fell between 90 and 109, or above average (AA) if their FSIQ scores exceeded 109. Because IQ scores are age-adjusted, each of the remaining 28 cognitive test variables was regressed on age, and the residuals were saved as z-transformed scores for further analysis. The z scores were then transformed to standard scores (M = 100; SD = 15) for comparison with IQs. Group differences in test performance were examined using multivariate analysis of variance (MANOVA) with planned contrasts of adjacent IQ groups (i.e., BA vs. A, and A vs. AA). Next, a composite impairment index (CII) was derived by computing the proportion of age-adjusted cognitive test measures on which each participant scored 2 or more standard deviations below the sample mean. These values were regressed on IQ to determine whether a linear, quadratic, or cubic function best fit the data. In addition, the mean of each person's age-adjusted cognitive test scores was computed as a composite performance index (CPI) for correlation with IQ to determine whether a linear or curvilinear function best fit the data. Finally, we examined the relationship between IQ and age-adjusted scores separately for each test variable using a series of ANOVAs. For all statistical tests, ps < .05 were considered significant.
RESULTS
Deriving IQ Groups
Each participant was assigned to one of three groups based on his or her WAIS–R Full-Scale IQ. As shown in Table 1, 37 (17%) participants comprised the Below-Average (BA) group, 106 (48%) comprised the average (A) group, and 78 (35%) comprised the above-average (AA) group. Demographic characteristics and mean WAIS–R Full-Scale IQ scores for the three groups and the whole sample are presented in Table 1. The IQ groups differed in age [F(2,218) = 11.6, p < .001]. Post-hoc comparisons confirmed that the AA group was older than the A group, which, in turn, was older than the BA group. As expected, the three groups also differed in education [F(2,218) = 38.2, p < .001]. Post-hoc comparisons showed that the AA group completed more years of school than the A group, which completed more years of school than the BA group. The proportion of men and women in each group also differed significantly (χ2(2) = 8.1, p < .02), as did the racial/ethnic composition of the groups (χ2(4) = 51.3, p < .001).
IQ Group Comparisons
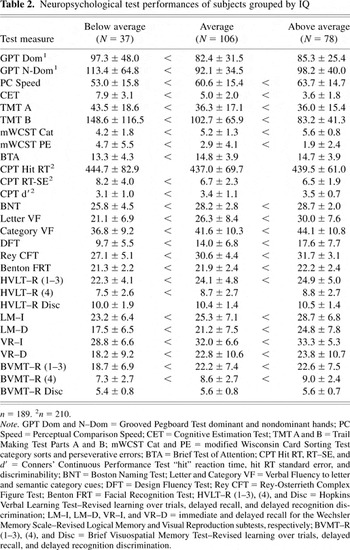
Multivariate analyses of variance (MANOVA) were used to compare the three WAIS–R Full Scale IQ groups' age-corrected z scores on all 28 of the neuropsychological test variables. However, because the Grooved Pegboard Test and Conners' CPT were added to the cognitive battery after the study began, 32 participants lacked data for the GPT, and 11 lacked data for the CPT. Separate MANOVAs were conducted for these tests in order to avoid the exclusion of their other cognitive variables from statistical analyses. Fewer than 5% of the participants were missing any data for any other cognitive test variables. The first MANOVA (on the two GPT variables) yielded a Wilks's lambda of .843 (p < .001). The second MANOVA (on the three Conners' CPT variables) yielded a Wilks's lambda of .898 (p < .002), and the third MANOVA (on the remaining 23 test variables) yielded a Wilks's lambda of .380 (p < .0001). Univariate F tests revealed significant group effects (ps < .01) for all but three variables. These included the Conners' CPT “hit” reaction times and recognition discrimination scores for the HVLT–R and BVMT–R. Planned comparisons of “adjacent” groups revealed that BA subjects performed significantly worse than A subjects on 25 of the 28 measures, and that A subjects performed significantly worse than AA subjects on 19 of the 28 measures. For clarity of presentation, the non-age-corrected raw test scores of each IQ group are shown in Table 2. Significant group differences that emerged from the planned comparisons (based on age-corrected test scores) also are shown between the data columns of Table 2. Effect size analyses, using Cohen's (1988) d statistic, revealed that the BA–A group comparison ds ranged from .25 to 1.08 with a mean of .73, while the A–AA group comparison ds ranged from .13 to .76 with a mean of .41.1
These same analyses were repeated after subjects were grouped into BA, A, and AA groups on the basis of their NART-R IQ estimates, rather than WAIS–R FSIQ estimates. The composition of the groups remained largely unchanged, and univariate F tests revealed significant group effects for all but five variables. Planned comparisons revealed that BA subjects were significantly worse than A subjects on 23 of the 28 measures, whereas A subjects were significantly worse than AA subjects on 11 of the 28 measures. Effect sizes for BA–A comparisons ranged from .01 to .72 with a mean of .72, while A–AA comparisons ranged from .09 to .77 with a mean of .46.
Neuropsychological test performances of subjects grouped by IQ


Mean age-adjusted standard scores for each neuropsychological test variable by the three WAIS–R Full Scale IQ groups. GPT Dom and GPT N-Dom = Grooved Pegboard Test, dominant and nondominant hands; BTA = Brief Test of Attention; TMT A and TMT B = Trail Making Test, Parts A and B; mWCST Cat and mWCST PE = modified Wisconsin Card Sorting Test category sorts and perseverative errors; CET = Cognitive Estimation Test; DFT = Design Fluency Test; PC Speed = Perceptual Comparison Speed; CPT Hit RT, RT-SE, and d′ = CPT hit reaction time, hit RT standard error, and discrimination; Letter VF and Category VF = Verbal Fluency to letter and semantic category prompts; BNT = Boston Naming Test; FRT = Facial Recognition Test; Rey CFT = Rey-Osterrieth Complex Figure Test; HVLT (1–3), HVLT (4), and HVLT Disc. = Hopkins Verbal Learning Test–Revised total learning, delayed recall, and delayed recognition discrimination; LM–I and LM–D = Wechsler Memory Scale–Revised Logical Memory immediate and delayed recall; BVMT (1–3), BVMT (4), and BVMT Disc. = Brief Visuospatial Memory Test–Revised total learning, delayed recall, and delayed recognition discrimination; VR–I and VR–D = Wechsler Memory Scale–Revised Visual Reproduction immediate and delayed recall.
We also considered the possibility that ceiling effects on some neuropsychological measures might have limited differences between the A and AA groups, therefore attenuating the relationship between IQ and performance on these measures. In reviewing the distributions of all test measures, we identified three on which mean performance was less than one standard deviation below the highest possible score. These included the Wisconsin Card Sorting Test (category sorts), Boston Naming Test, and Brief Visuospatial Memory Test–Revised (recognition discrimination). After excluding these three measures due to their ceiling effects, the analyses described above were repeated. Again, however, the BA subjects performed significantly worse than A subjects on 23 of the remaining 25 measures, and A subjects performed significantly worse than AA subjects on 17 of the 25 measures. Effect sizes were nearly identical to those found earlier, with the BA–A group comparison ds ranging from .25 to 1.08 with a mean of .74, and the A–AA group comparison ds ranging from .14 to .76 with a mean of .42.
Correlations Between IQ and Neuropsychological Test Performance
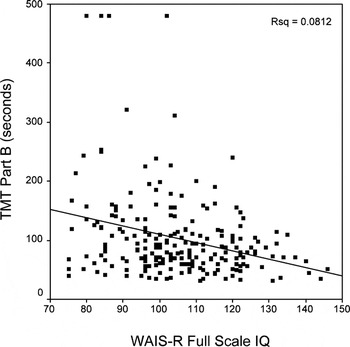
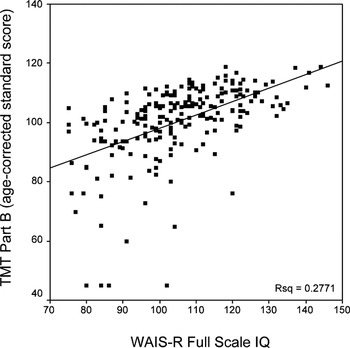
We next examined the relationship between IQ and age-adjusted neuropsychological test performance in a manner similar to that employed by Dodrill (1997, 1999). When Dodrill (1999) plotted performance on Part B of the Trail Making Test as a function of IQ, he found that times to complete the task dropped sharply with increases in IQ up to about 90 or 95, but did not improve further among persons whose IQs exceeded this range. However, we were unable to replicate this finding in our sample, using either age-corrected or raw scores on the same test. As shown in Figure 2, regression of TMT Part B raw scores on WAIS–R Full Scale IQs yielded a multiple R of .29. Moreover, linear, quadratic, and cubic functions all accounted for roughly the same proportion of the variance, as demonstrated by their R2 values of .081, .084, and .084 respectively. As shown in Figure 3, age-corrected standard scores on TMT Part B correlated more strongly with WAIS–R Full Scale IQs (multiple R = .53), but linear (R2 = .28), quadratic (R2 = .29), and cubic (R2 = .29) functions again accounted for roughly the same proportion of the variance. Similar patterns were observed for most other neuropsychological variables.

Scatterplot with linear regression line depicting the raw scores (in seconds) of 219 adults on Part B of the Trail Making Test as a function of WAIS–R Full-Scale IQ. The multiple R for this model (.285) was nearly identical to those for quadratic and cubic models (both .290).

Scatterplot with linear regression line depicting the age-corrected standard scores of 219 adults on Part B of the Trail Making Test as a function of WAIS–R Full-Scale IQ. The multiple R for this model (.526) was nearly identical to those for quadratic and cubic models (both .537).
As described above, we derived a composite impairment index (CII) that is conceptually similar to the Halstead Impairment Index (HII; Reitan & Davison, 1974) used by Dodrill (1997) and others. Because the CII reflects the proportion of each person's age-adjusted cognitive test scores that fall more than two SDs below the sample mean, CII scores can range from zero to 1.0. For example, a participant who scored greater than 2 standard deviations below the mean on 2 of 28 test variables would earn a CII of .07. Regression of CII scores on FSIQ yielded a multiple R of −.46, (p < .0001). However, quadratic (R2 = .28) and cubic (R2 = .31) functions accounted for larger proportions of the variance than a linear (R2 = .22) function (Figure 4). When CII scores were examined as a function of IQ group, we found that BA subjects scored more than 2 standard deviations below the sample mean on .115 of the test measures, A subjects scored below this level on .028 of the test variables, and AA subjects scored below this level on just .008 of the cognitive test measures. In short, CII scores showed a diminishing relationship with IQ, especially as the latter scores exceeded about 110.

Scatterplot with cubic regression line depicting the proportion of each participant's age-adjusted standard scores that fell more than two standard deviations below the sample means of 28 cognitive test measures (i.e., Composite Impairment Index, or CII) as a function of WAIS–R Full-Scale IQ. The multiple R for this model (.556) exceeded the multiple Rs for quadratic (.533) and linear (.460) models. Although the model “predicts” CII scores below zero among persons of very high intelligence, this should be construed as a theoretical prediction, as it is impossible to obtain a CII of zero.
Because CII values were constrained at the lower bound by zero, we reasoned that the nonlinearity of their relationship with IQ could result from their non-Gaussian distribution (skewness = 2.9; kurtosis = 9.9). In order to test this possibility, we computed a composite performance index (CPI) based on the mean of each person's age-adjusted standard scores for the 28 cognitive test measures. The resulting CPI values were decidedly more Gaussian in distribution (skewness = −.72; kurtosis = .74). When these values were regressed on FSIQ scores, the resulting Multiple R was .69 (p < .0001). More importantly, linear (R2 = .47), quadratic (R2 = .49), and cubic (R2 = .51) models all accounted for roughly the same proportion of the variance. Figure 5 depicts the linear model of their relationship.

Scatterplot with linear regression line depicting the mean of each participant's age-adjusted standard scores on 28 cognitive test measures as a function of WAIS–R Full-Scale IQ. The multiple R for this model (.686) was nearly identical to those for both quadratic (.700) and cubic (.711) models.
Our sample contained a smaller (16.7%) than expected (23%) proportion of individuals with below average intelligence. This was due to the exclusion of 28 subjects with severe health problems or MMSE scores of below 24/30. Counting those excluded from the analyses described above, 21% of the initial sample (n = 249) earned IQ scores below 90, confirming that the under-representation of persons with below average IQ in the study sample was not due to a recruitment bias. However, in order to determine whether the exclusion of persons with severe health problems biased our findings regarding the strength of the relationship between IQ and neuropsychological test performance, we repeated the analyses described above using the entire sample. Planned comparisons of adjacent IQ groups revealed that A subjects performed significantly better than BA subjects on all 28 neuropsychological test variables, and that AA subjects performed significantly better than A subjects on 20 of the 28 test variables. Effect size analyses yielded a mean d of .94 for BA–A group differences, and a mean d of .47 for A–AA group differences. Correlations of Full Scale IQ scores with the CPI and CII yielded Pearson rs of .75 and −.48, respectively. Thus, initially excluding the 28 participants with severe health problems marginally decreased the strength of the relationship between IQ and neuropsychological test performance.
DISCUSSION
In this study we examined the relationship between intelligence and neuropsychological test performance in a reasonably healthy, broadly representative sample of community-dwelling adults whose WAIS–R Full-Scale IQ scores approximated those of the general population. Consistent with earlier reports, IQ proved to predict concurrent neuropsychological test performance, but more so in persons with below average to average IQ than in persons with above average IQ. For example, the BA and A groups differed significantly on 25 of the 28 neuropsychological test variables, whereas the A and AA groups differed significantly on 19 of the 28 test variables. In addition, the mean effect size of BA–A differences (d = .73) was larger than that of A–AA differences (d = .41). Still, persons with above average IQ outperformed those with average IQ on every single test variable when compared in terms of their age-corrected test scores (Figure 1). Similar results were obtained when the IQ groups were based on NART–R estimates of premorbid IQ. In addition, when the age-adjusted cognitive test scores were regressed on IQ, linear models accounted for roughly equal proportions of variance to curvilinear models for most variables. Thus, our findings refute the strong version of Dodrill's (1997) hypothesis that there is no relationship between intelligence and neuropsychological test performance at above-average IQ levels. They are more consistent with Dodrill's (1999) re-statement that intelligence is “much more correlated with neuropsychological performance when it is below-average than when it is above-average” (p. 568). Nevertheless, our average and above-average IQ groups differed significantly on substantially more cognitive test variables than the 7 of 23 reported by Dodrill. This discrepancy likely reflects differences in sampling methods and statistical analyses. Our sample probably was more broadly representative of the general population, and we were careful to control for age in all statistical analyses. While our results do not support Dodrill's (1997) early claims, they also suggest that the relationship between IQ and neuropsychological test performance is weaker in persons of above average IQ than has been reported by other investigators. Tremont et al. (1998), for example, reported a stronger link between above-average IQ and neuropsychological test performance, but used a clinic-referred sample, and did not adjust their analyses for age.
Another finding of this study concerns the methods used to estimate the strength of the relationship between IQ and neuropsychological test performance. Among the evidence cited by Dodrill (1997) in support of his argument was the finding that IQ scores showed a nonlinear relationship with the Halstead Impairment Index (HII). We also found a nonlinear relationship between IQ and the conceptually similar composite impairment index (CII) derived for this study. However, because the HII and CII are bound at the lower end by zero (i.e., one cannot obtain “negative” impairment index scores), and because the distributions of both are likely to be highly skewed (as was confirmed for the CII), correlating IQ scores with these indices does not represent a fair test of the hypothesis that IQ and neuropsychological test performance are linearly related. Instead, we computed the mean of each participant's age-corrected test scores as a composite performance index (CPI). When these values were regressed on IQ, their correlation with IQ was quite strong. More importantly, linear, quadratic, and cubic models all accounted for roughly equal proportions of the variance (with R2s of .47, .49, and .51, respectively). In all three models, IQ accounted for about half the variance in this aggregate measure of cognitive test performance. Viewed in this light, IQ appears to bear a robust relationship with cognitive test performance across the entire spectrum of intellectual ability. It is also worth noting that, although differences in IQ clearly accounted for substantial proportions of the variance, they did not account for the majority of variance on any single measure. This suggests that the neuropsychological tests assess cognitive processes that extend beyond those captured by IQ.
Regarding potential weaknesses of the study, one might argue that because our sample contained fewer than expected persons with below average intelligence, the obtained results could reflect a biased estimate of relationship between IQ and cognitive test performance. However, rather than representing a recruitment bias, our sample contained relatively few persons with below average intelligence because 57% of the 28 subjects who were excluded earned IQ scores below 90. In fact, 21% of the parent sample scored in this range, confirming that our recruitment yielded a broadly representative sample of community-dwelling adults. Moreover, repeating the analyses on the entire sample yielded nearly identical results. Others might criticize the inclusion of rarely used instruments in our neuropsychological test battery. However, we regard this as a strength because the instruments that we employed assess a broad range of cognitive abilities and extend previous research beyond more commonly used test batteries, such as the HRB.
Another potential weakness is that we defined IQ groups based on normative data from the WAIS–R standardization sample, whereas performance on the neuropsychological tests was standardized on the study sample. In order to confirm that this did not alter the pattern of our results, we repeated the statistical analyses after re-defining IQ groups based on our sample's distribution, rather than the WAIS–R norms. That is, we summed each individual's age-residualized score on the seven WAIS–R subtests using the weighting procedure described by Ward (1990), and then used the resulting “IQ” scores to define BA, A, and AA groups. The resulting “IQ” groups actually differed very little from those defined by the WAIS–R normative sample. Consistent with this, the A subjects outperformed BA subjects on 26 of 28 measures, and the AA subjects outperformed A subjects on 22 of 28 measures, with effect sizes for the BA–A and A–AA comparisons that were slightly larger than those obtained when the IQ groups were defined by the WAIS–R standardization sample. In short, redefining the IQ groups based on the study sample marginally increased the strength of associations between “IQ” and cognitive test performance, but did not alter the overall pattern of results.
Finally, it is important to note that, although our IQ groups differed from one another in many demographic characteristics, including education, sex and race, we did not covary the analyses for these variables because doing so would essentially treat the variance they share with IQ and other cognitive measures as an error term, which it clearly is not. We were guided in this decision by prior discussions of appropriate versus inappropriate applications of analysis of covariance (Adams et al., 1985, 1992; Lord, 1967), all of which have concluded that statistical adjustment by covariance can distort estimates of group differences when the experimental groups and the covariate are correlated. The impossibility of disentangling the influence of IQ from demographic characteristics with which it covaries serves as a reminder that cognitive test performance is multiply determined even in healthy adults.
These results have practical implications. One is that poor neuropsychological test performance must be interpreted with particular caution among persons with below average IQ. In the present study, reasonably healthy adults with IQs below 90 scored more than 2 standard deviations below age-adjusted means on nearly 12% of the test measures. While we cannot rule out the possibility that some of these subjects had an unrecognized neurological condition that was responsible for their poor test performance, this seems unlikely for several reasons. First, participants with significant medical or psychiatric disorders were excluded from the study. Second, the overall distribution of IQ scores for the study sample ranged from 75 to 146, with a mean of 105 and a standard deviation of 15, which is very close to what one would expect for the general population. Third, in a related study (Schretlen et al., in press) we have shown that healthy adults normally demonstrate considerable intra-individual variability in neuropsychological test performance, and frequently produce some abnormal test scores. Indeed, this raises the question of what constitutes an abnormal neuropsychological finding, especially in persons of below average intelligence. This question will be addressed in later work. A corollary implication of the present results is that because the relationship between IQ and neuropsychological test performance diminishes among persons with above average intelligence, it is risky to interpret below average neuropsychological test performance by persons with superior premorbid IQ as abnormal. Even though the participants in our AA group had a mean WAIS–R Full-Scale IQ of 121, the means of their age-adjusted standard scores on 28 neuropsychological measures ranged from 102 to 108, with SDs of 7 to 15, suggesting that many scored in the borderline to low average range, at least on some tests.
Because intelligence testing is a cornerstone of neuropsychological assessment, and clinicians frequently consider a patient's estimated premorbid intelligence in their clinical interpretation of cognitive test results, the findings of this study may help elucidate the nature and strength of a relationship that is critical to clinical practice and conceptually important.
ACKNOWLEDGMENTS
Portions of the findings reported here were presented at the Thirtieth Annual International Neuropsychological Society Conference, February 13–16, 2002, Toronto, Ontario, Canada. This research was supported by Grants R01 MH60504, R01 MH43775, and R01 MH52886 (to G.D.P. and D.J.S.) from the National Institute on Mental Health.
References
REFERENCES
Adams, K.M.,
Brown, G.G., &
Grant, I.
(1985).
Analysis of covariance as a remedy for demographic mismatch of
research subject groups: Some sobering simulations.
Journal of Clinical and Experimental Neuropsychology,
7,
445–462.Google Scholar
Adams, K.M.,
Brown, G.G., &
Grant, I.
(1992).
Covariance is not the culprit: Adams, Brown and Grant reply.
Journal of Clinical and Experimental Neuropsychology,
14,
983–985.Google Scholar
Axelrod, B.N. &
Millis, S.R.
(1994).
Preliminary standardization of the Cognitive Estimation Test.
Assessment,
1,
269–274.Google Scholar
Axelrod, B.N.,
Woodard, J.L.,
Schretlen, D., &
Benedict, R.H.B.
(1996).
Corrected estimates of WAIS–R short form reliability and
standard error of measurement.
Psychological Assessment,
8,
222–223.Google Scholar
Bell, B.D. &
Roper, B.L.
(1998).
“Myths of neuropsychology”: Another view.
Clinical Neuropsychologist,
12,
237–244.Google Scholar
Benedict, R.H.B.
(1997).
Brief Visuospatial Memory Test–Revised.
Odessa, FL:
Psychological Assessment Resources, Inc.
Benedict, R.H.B.,
Schretlen, D., &
Bobholz, J.H.
(1992).
Concurrent validity of three WAIS–R short forms in
psychiatric inpatients.
Psychological Assessment,
4,
322–328.Google Scholar
Benton, A.L.,
Hamsher, K. deS.,
Varney, N.R., &
Spreen, O.
(1983).
Contributions to neuropsychological assessment: A clinical manual.
New York, NY:
Oxford University Press.
Brandt, J. &
Benedict, R.H.B.
(2001).
Hopkins Verbal Learning Test–Revised professional manual.
Odessa, FL:
Psychological Assessment Resources, Inc.
Cohen, J.
(1988).
Statistical power analysis for the behavioral sciences
(2nd ed.).
Hillsdale, NJ:
Lawrence Earlbaum Associates.
Conners, C.K.
(1995).
Conners' Continuous Performance Test.
Toronto, Canada:
MHS.
Dodrill, C.B.
(1999).
Myths of neuropsychology: Further considerations.
Clinical Neuropsychologist,
13,
562–572.Google Scholar
Folstein, M.F.,
Folstein, S.E., &
McHugh, P.R.
(1975).
Mini-mental state. A practical method for grading the cognitive
state of patients for the clinician.
Journal of Psychiatric Research,
12,
189–198.Google Scholar
Goodglass, H. &
Kaplan, E.
(1983).
Boston Diagnostic Aphasia Examination (BDAE).
Philadelphia:
Lea and Febiger.
Halstead, W.C.
(1947).
Brain and intelligence.
Chicago:
University of Chicago Press.
Heaton, R.K.
(1981).
Wisconsin Card Sorting Test manual.
Odessa, FL:
Psychological Assessment Resources, Inc.
Horton, A.M.
(1999).
Above-average intelligence and neuropsychological test score
performance.
International Journal of Neuroscience,
99,
221–231.Google Scholar
Jones-Gotman, M. &
Milner, B.
(1977).
Design fluency: The invention of nonsense drawings after focal
cortical lesions.
Neuropsychologia,
15,
653–674.Google Scholar
Jung, R.E.,
Yeo, R.A.,
Chiulli, S.J.,
Sibbitt, W.L., &
Brooks, W.M.
(2000).
Myths of neuropsychology: Intelligence, neurometabolism, and
cognitive ability.
Clinical Neuropsychologist,
14,
535–545.Google Scholar
Kløve, H.
(1963).
Clinical neuropsychology. In
F.M. Forster (Ed.),
Medical Clinics of North America.
New York:
Saunders.
Larrabee, G.J.
(2000).
Association between IQ and neuropsychological test performance:
Commentary on Tremont, Hoffman, Scott, and Adams (1998).
Clinical Neuropsychologist,
14,
139–145.Google Scholar
Lord, F.M.
(1967).
A paradox in the interpretation of group comparisons.
Psychological Bulletin,
68,
304–305.Google Scholar
Nelson, H.E.
(1976).
A modified card sorting test sensitive to frontal lobe defects.
Cortex,
12,
313–324.Google Scholar
Reitan, R.M.
(1958).
Validity of the Trail Making Test as an indicator of organic brain
damage.
Perceptual and Motor Skills,
8,
271–276.Google Scholar
Reitan, R.M. &
Davison, L.A.
(1974).
Clinical neuropsychology: Current status and applications.
New York:
Hemisphere.
Rey, A.
(1993).
Psychological examination of traumatic encephalopathy. J. Corwin
& F.W. Bylsma (Trans.).
Clinical Neuropsychologist,
7,
3–21.
(Original work published 1941).Google Scholar
Salthouse, T.A.
(1991).
Mediation of adult age differences in cognition by reductions in
working memory and speed of processing.
Psychological Science,
2,
179–183.Google Scholar
Schretlen, D.
(1997).
Brief Test of Attention professional manual.
Odessa, FL:
Psychological Assessment Resources, Inc.
Schretlen, D. &
Ivnik, R.J.
(1996).
Prorating IQ scores for older adults: Validation of a seven-subtest
WAIS–R with the Mayo Older Americans Normative sample.
Assessment,
3,
411–416.Google Scholar
Schretlen, D.J.,
Munro, C.A.,
Anthony, J.C., &
Pearlson, G.D.
(2003).
Examining the range of normal intra-individual variability in
neuropsychological test performance.
Journal of the International Neuropsychological Society,
9,
864–870.Google Scholar
Shallice, T. &
Evans, M.E.
(1978).
The involvement of the frontal lobes in cognitive estimation.
Cortex,
14,
294–303.Google Scholar
Tremont, G.,
Hoffman, R.G.,
Scott, J.G., &
Adams, R.L.
(1998).
Effect of intellectual level on neuropsychological test
performance: A response to Dodrill (1997).
Clinical Neuropsychologist,
12,
560–567.Google Scholar
Ward, L.C.
(1990).
Prediction of verbal, performance, and full scale IQs from seven
subtests of the WAIS–R.
Journal of Clinical Psychology,
46,
436–440.Google Scholar
Wechsler, D.
(1945).
A standardized memory scale for clinical use.
Journal of Psychology,
19,
87–95.Google Scholar
Wechsler, D.
(1955).
Wechsler Adult Intelligence Scale Manual.
New York:
The Psychological Corporation.
Wechsler, D.
(1981).
Manual for the Wechsler Adult Intelligence Scale–Revised.
New York:
The Psychological Corporation.
Wechsler, D.
(1987).
Wechsler Memory Scale–Revised.
San Antonio, TX:
The Psychological Corporation.
Demographic characteristics and IQ scores of entire sample and IQ subgroups
Neuropsychological test performances of subjects grouped by IQ

Mean age-adjusted standard scores for each neuropsychological test variable by the three WAIS–R Full Scale IQ groups. GPT Dom and GPT N-Dom = Grooved Pegboard Test, dominant and nondominant hands; BTA = Brief Test of Attention; TMT A and TMT B = Trail Making Test, Parts A and B; mWCST Cat and mWCST PE = modified Wisconsin Card Sorting Test category sorts and perseverative errors; CET = Cognitive Estimation Test; DFT = Design Fluency Test; PC Speed = Perceptual Comparison Speed; CPT Hit RT, RT-SE, and d′ = CPT hit reaction time, hit RT standard error, and discrimination; Letter VF and Category VF = Verbal Fluency to letter and semantic category prompts; BNT = Boston Naming Test; FRT = Facial Recognition Test; Rey CFT = Rey-Osterrieth Complex Figure Test; HVLT (1–3), HVLT (4), and HVLT Disc. = Hopkins Verbal Learning Test–Revised total learning, delayed recall, and delayed recognition discrimination; LM–I and LM–D = Wechsler Memory Scale–Revised Logical Memory immediate and delayed recall; BVMT (1–3), BVMT (4), and BVMT Disc. = Brief Visuospatial Memory Test–Revised total learning, delayed recall, and delayed recognition discrimination; VR–I and VR–D = Wechsler Memory Scale–Revised Visual Reproduction immediate and delayed recall.
Scatterplot with linear regression line depicting the raw scores (in seconds) of 219 adults on Part B of the Trail Making Test as a function of WAIS–R Full-Scale IQ. The multiple R for this model (.285) was nearly identical to those for quadratic and cubic models (both .290).
Scatterplot with linear regression line depicting the age-corrected standard scores of 219 adults on Part B of the Trail Making Test as a function of WAIS–R Full-Scale IQ. The multiple R for this model (.526) was nearly identical to those for quadratic and cubic models (both .537).
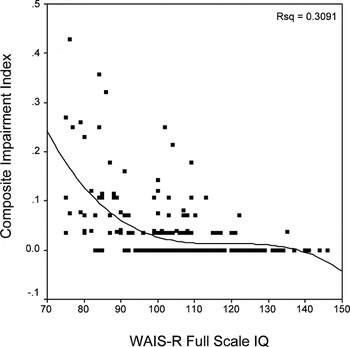
Scatterplot with cubic regression line depicting the proportion of each participant's age-adjusted standard scores that fell more than two standard deviations below the sample means of 28 cognitive test measures (i.e., Composite Impairment Index, or CII) as a function of WAIS–R Full-Scale IQ. The multiple R for this model (.556) exceeded the multiple Rs for quadratic (.533) and linear (.460) models. Although the model “predicts” CII scores below zero among persons of very high intelligence, this should be construed as a theoretical prediction, as it is impossible to obtain a CII of zero.
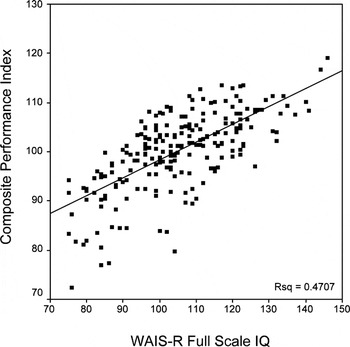
Scatterplot with linear regression line depicting the mean of each participant's age-adjusted standard scores on 28 cognitive test measures as a function of WAIS–R Full-Scale IQ. The multiple R for this model (.686) was nearly identical to those for both quadratic (.700) and cubic (.711) models.
 You have
Access
- 81
- Cited by